

Submitted:
10 November 2026
Posted:
11 November 2026
You are already at the latest version
Abstract
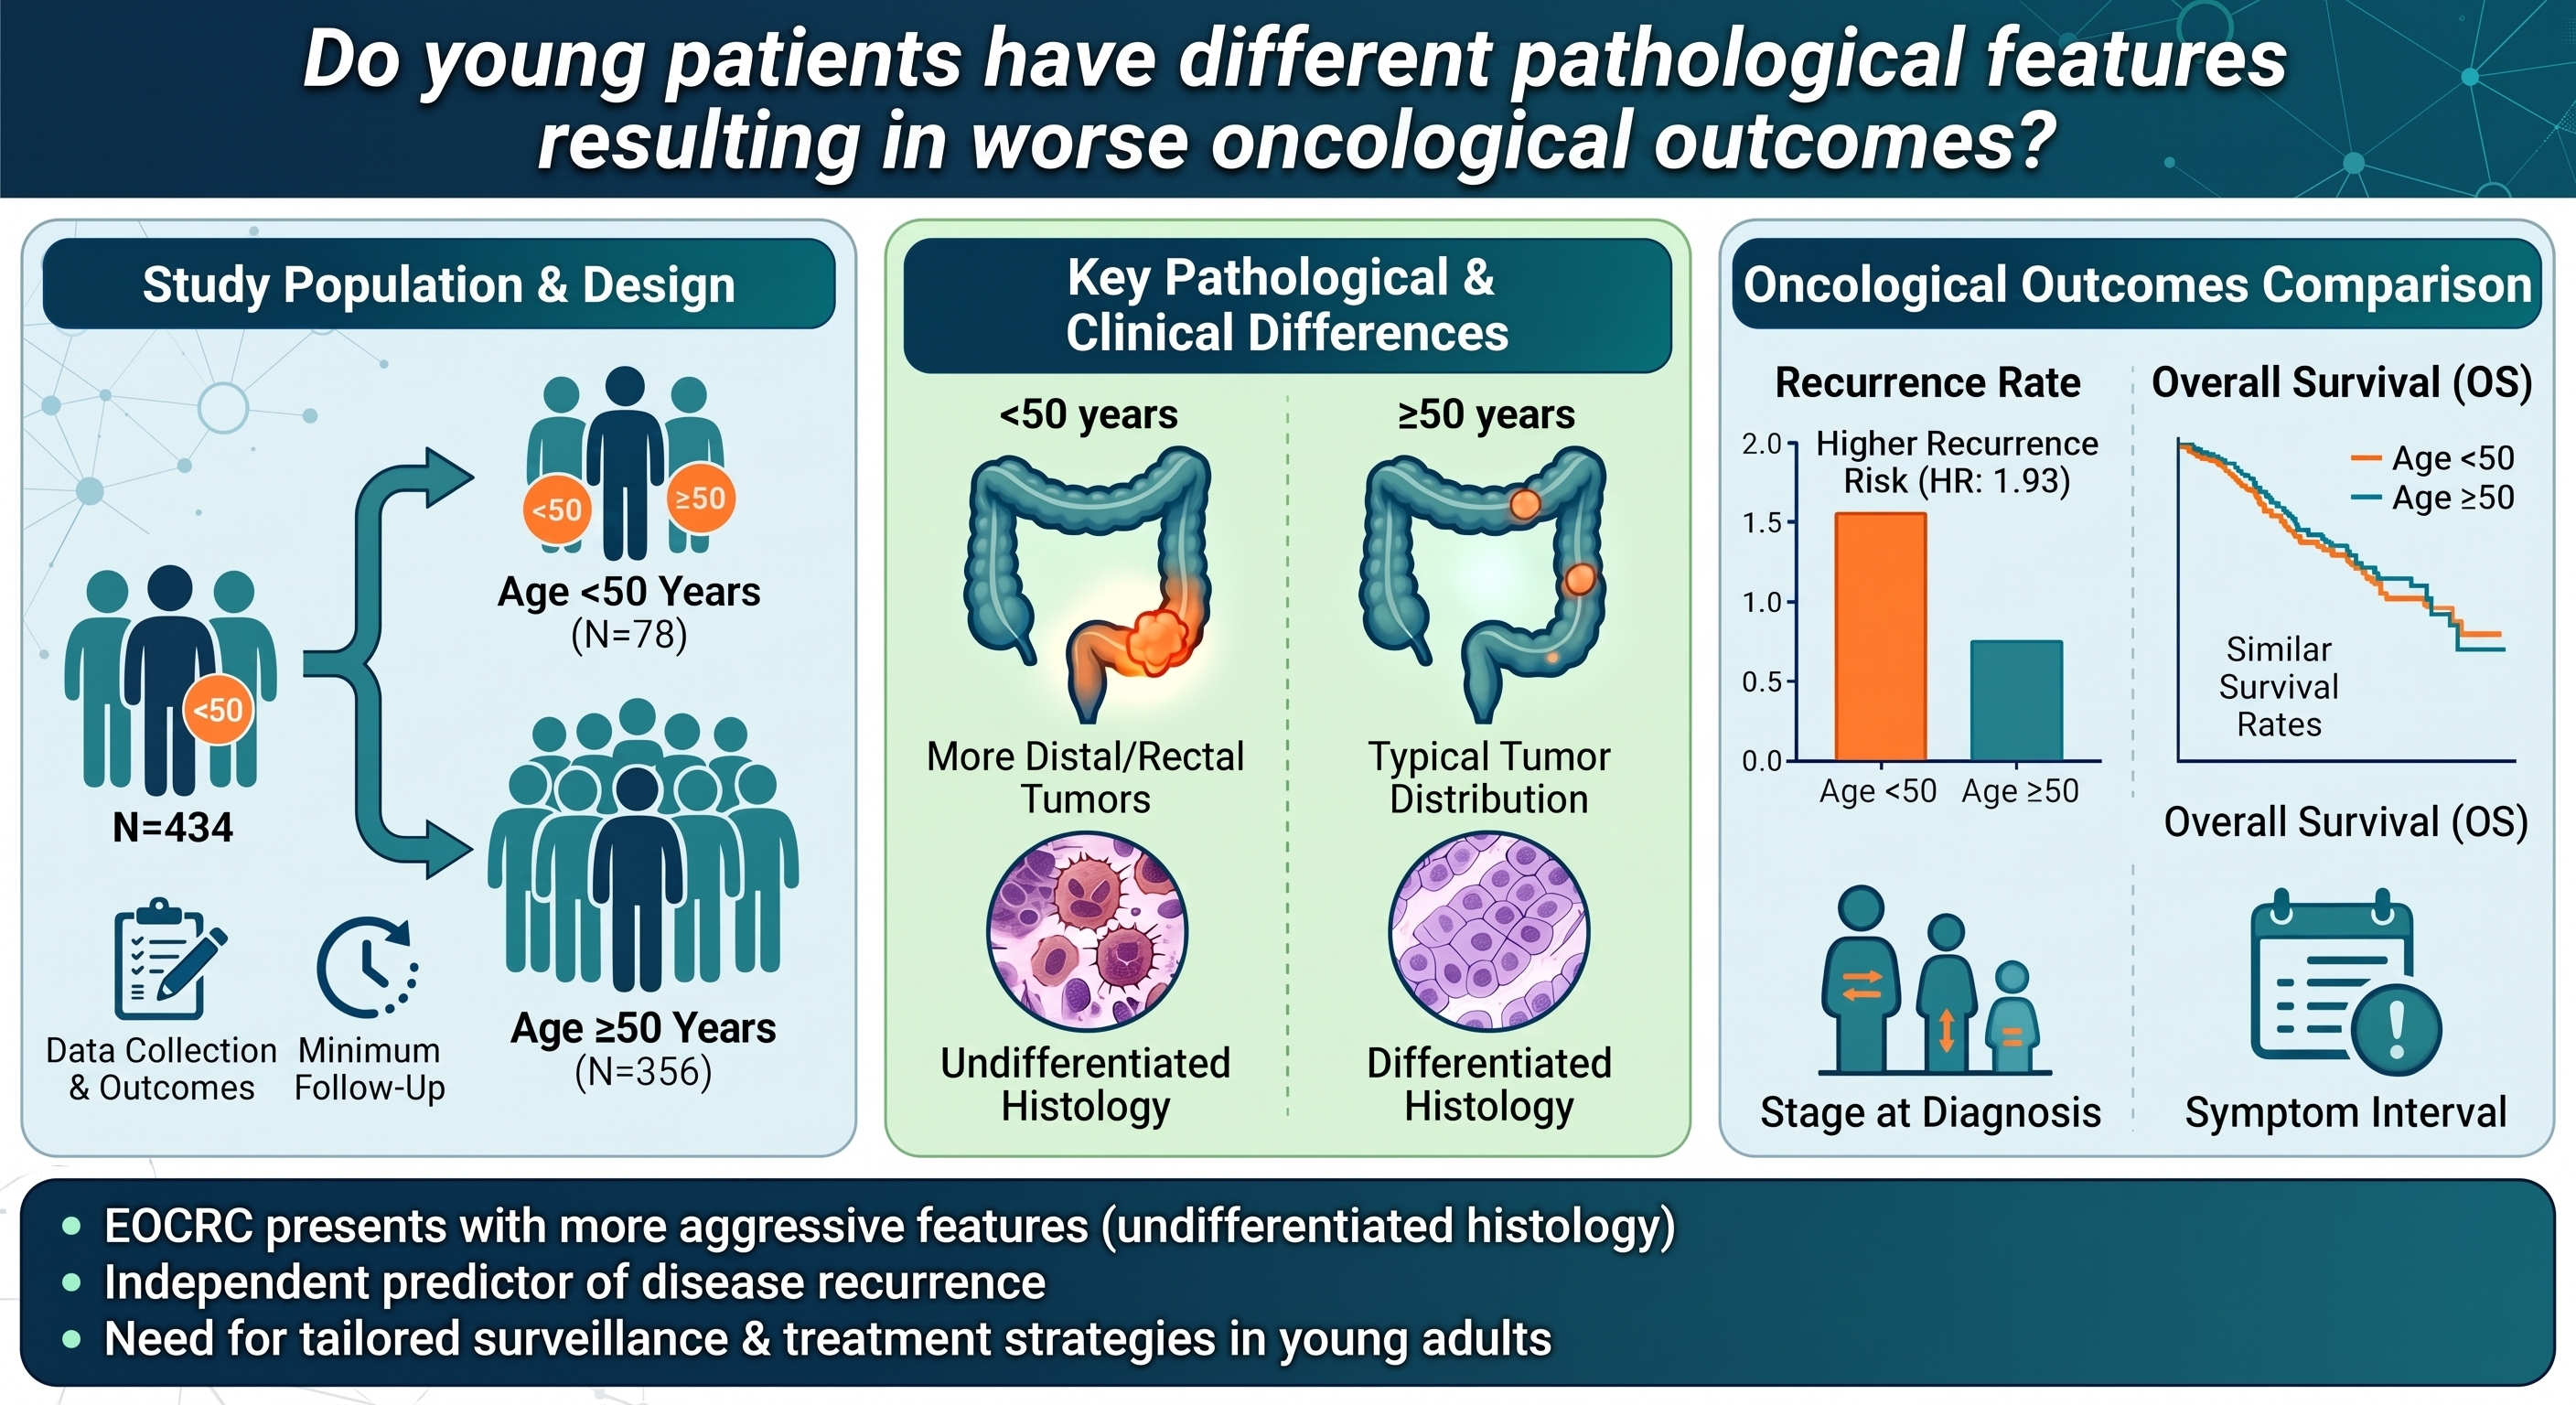
Early-onset colorectal cancer (EOCRC) may differ clinically and oncologically from later-onset disease. This retrospective cohort study compared surgically treated patients with stage I–IV colorectal adenocarcinoma diagnosed at age < 50 vs. ≥ 50 years at a tertiary center between 2010 and 2020. Clinical, pathological, perioperative, and oncological outcomes were compared. Survival was evaluated using Kaplan–Meier analysis and Cox proportional hazards regression. Of 434 patients, 78 (17.97%) were aged < 50 years and 356 (82.03%) were aged ≥ 50 years. Mean (SD) follow-up was 35.59 (16.27) months. Patients aged < 50 years had shorter hospital stays (prevalence ratio [PR], 0.11; 95% CI, 0.01–0.21; p = 0.0336) but exhibited a higher prevalence of undifferentiated tumors (PR, 2.38; 95% CI, 1.18–4.78; p = 0.0147) and a 93% higher risk of recurrence (hazard ratio [HR], 1.93; 95% CI, 1.00–3.72; p = 0.0483) than those aged ≥ 50 years. No significant age-related difference was observed in overall survival, symptom–to–diagnosis interval, or pathological stage. EOCRC was associated with undifferentiated histology and a higher risk of disease recurrence. Further studies incorporating treatment information and molecular tumor characteristics are needed to clarify the independent prognostic significance of age in EOCRC.
Keywords:
colorectal cancer
; young patients
; early-onset colorectal cancer
; diagnosis
; clinical presentation
; TNM staging
1. Introduction
Colorectal cancer (CRC) is the third most commonly diagnosed cancer worldwide and the second leading cause of cancer-related death, accounting for 1,926,425 new cases and 904,019 deaths in 2022 [1]. In Brazil, 21,970 new cases in men and 23,660 in women were estimated annually for the 2023–2025 period, making CRC the third most common cancer in the country [2].
Age is a major risk factor for CRC. The risk increases progressively after the age of 40 years, with a marked increase after 50 years; historically, more than 90% of CRC cases have occurred in individuals aged ≥ 50 years [3]. Nevertheless, the incidence of CRC among individuals younger than 50 years has increased substantially in recent decades. Defined as early-onset CRC (EOCRC), CRC diagnosed before the age of 50 years is now among the 10 most common cancers in individuals aged 20–49 years, with an incidence of 5.6 cases per 100,000 population [1,2,3]. Data from the American Cancer Society have also demonstrated a decrease in the median age at CRC diagnosis from 72 to 66 years, attributed to the rising incidence among younger adults together with declining incidence among older populations [4].
The clinicopathological presentation of EOCRC appears to differ from that of CRC diagnosed in individuals aged ≥ 50 years. Younger patients tend to present with more advanced disease, with a greater proportion diagnosed at stages III and IV, and may experience a longer interval between symptom onset and diagnosis. EOCRC has also been associated with a higher prevalence of mucinous tumors, undifferentiated histology, and adverse pathological features, including signet-ring cell morphology and vascular and perineural invasion [5,6]. After exclusion of patients with Lynch syndrome, a greater predilection for distal colorectal tumors has also been reported [7].
However, whether these adverse clinicopathological characteristics translate into poorer oncological outcomes, or whether age independently influences prognosis after accounting for disease stage and other prognostic factors, remains uncertain. This study aimed to compare the epidemiological, clinical, and pathological characteristics and oncological outcomes of patients with colorectal adenocarcinoma diagnosed before and at or after the age of 50 years.
2. Materials and Methods
This retrospective cohort study included patients with histopathologically confirmed CRC who underwent surgical treatment at the University Hospital of Brasília, Brazil, between January 2010 and December 2020. Patients were identified from a prospectively maintained database, and medical records were retrospectively reviewed to obtain additional variables of interest. The research adhered to international ethical guidelines.
Patients aged ≥ 18 years with adenocarcinoma of the colon or rectum were eligible for inclusion. Patients with hereditary colon cancer syndromes, synchronous tumors, or inflammatory bowel disease were excluded. Patients who did not undergo surgery were not included in the analysis.
Patients were stratified according to age at diagnosis. The EOCRC group consisted of patients aged 18–49 years, whereas patients aged ≥ 50 years served as controls. Data collection was completed in September 2022, when oncological outcomes and follow-up information were updated.
The variables collected included age at diagnosis, sex, presenting signs and symptoms, symptom–to–diagnosis interval (SDI), body mass index (BMI), current or previous smoking, alcohol consumption, American Society of Anesthesiologists (ASA) physical status classification, tumor location in the colon or rectum, and serum carcinoembryonic antigen (CEA) levels. SDI was defined as the interval between the patient-reported onset of CRC-related symptoms and the date of histopathological diagnosis.
Pathological variables included TNM stage, tumor differentiation, lymphovascular and perineural invasion, and the number of lymph nodes examined. Treatment and perioperative variables included surgical approach (open or laparoscopic), conversion to open surgery, reoperation, admission to the intensive care unit (ICU), length of hospital stay, and operative mortality (defined as death within 30 days of surgery).
Oncological outcomes included disease recurrence, CRC-specific mortality, disease-free survival (DFS), overall survival (OS), and duration of postoperative follow-up. OS was defined as the interval from the date of surgery to death from any cause, with surviving patients censored at the date of their last follow-up. DFS was evaluated among patients with stage I–III disease and was defined as the interval from curative-intent surgery to the first documented local or distant recurrence or death from any cause. Patients who remained alive and recurrence-free were censored at the date of their last clinical follow-up.
Statistical Analysis
Patients were categorized into 2 groups according to age at diagnosis: < 50 years and ≥ 50 years. Categorical variables were compared using the chi-square test or Fisher’s exact test, as appropriate. Continuous variables were expressed as mean and standard deviation (SD) and compared using Student’s t test or Mann–Whitney test, as appropriate.
Poisson regression models with robust variance were used to estimate prevalence ratios (PRs) and corresponding 95% confidence intervals (CIs) for the association between age and clinical, surgical, and pathological outcomes. Potential confounders included sex, BMI, smoking, alcohol consumption, diabetes mellitus, hypertension, and ASA class. Each covariate was initially evaluated in a univariable model, and variables with p < 0.25 were considered for inclusion in the multivariable models. Candidate variables were subsequently evaluated using forward selection and backward elimination, with covariates meeting a significance threshold of p < 0.05 retained in the final core model. Age group (< 50 vs. ≥ 50 years), the primary independent variable of interest, was then forced into the final model to estimate its adjusted association with each outcome.
Linear regression models were used to evaluate the association between age and length of hospital stay, controlling for diabetes mellitus and hypertension. Pearson’s partial correlation coefficients and corresponding 95% CIs were calculated.
Cox proportional hazards regression models were used to estimate adjusted hazard ratios (HRs) and corresponding 95% CIs for the associations between age and OS and DFS. Potential demographic and clinical covariates were initially evaluated using univariable Cox regression. Covariates with p < 0.25 were considered for inclusion in the multivariable models and subsequently evaluated using backward elimination. Variables with p < 0.05 were retained in the final core model. Age group (< 50 vs. ≥ 50 years), the primary independent variable of interest, was then forced into the final model to estimate its adjusted association with OS and DFS.
Kaplan–Meier curves were generated for OS and DFS according to age group (< 50 vs. ≥ 50 years), and survival distributions were compared using the log-rank test. Statistical analysis was performed using SAS version 9.4 (SAS Institute Inc., Cary, NC, USA). The significance level was set at 0.05 for all analyses.
3. Results
A total of 434 patients aged 18–88 years underwent surgical treatment for colorectal adenocarcinoma during the study period. The mean (SD) age was 60.88 (12.49) years, and 242 patients (55.76%) were women. The EOCRC group consisted of 78 patients aged < 50 years (17.97%), whereas the control group consisted of 356 patients aged ≥ 50 years (82.03%).
Sex distribution was similar between the groups, with women accounting for 58.97% of the EOCRC group and 55.06% of the control group. For operative risk stratification, patients were categorized as ASA II or ASA III–IV. Patients aged < 50 years had a more favorable ASA classification than those aged ≥ 50 years (ASA II, 80.77% vs. 67.89%; ASA III–IV, 19.23% vs. 32.11%; p = 0.0243). Smoking was less frequent in patients aged < 50 years than in those aged ≥ 50 years (12.50% vs. 36.75%; p < 0.001). Similarly, hypertension (11.11% vs. 51.51%; p < 0.001) and diabetes mellitus (2.78% vs. 22.89%; p < 0.001) were less frequent in patients aged < 50 years. No significant between-group differences were observed in alcohol consumption, BMI, SDI, or tumor location (Table 1 and Table 2).
The mean (SD) SDI for the overall cohort was 9.69 (5.51) months. Clinical presentation was generally similar between the age groups, with no significant differences in weight loss (48.33% vs. 47.04%; p = 0.8550), change in bowel habits (43.33% vs. 50.17%; p = 0.3350), bleeding (16.67% vs. 51.92%; p = 0.1684), or abdominal pain (53.33% vs. 50.52%; p = 0.6920). Consistent with these findings, neither unadjusted nor adjusted analyses demonstrated significant associations between age group and the prevalence of the evaluated clinical signs and symptoms (Table 3 and Table 4).
Surgical approach, conversion rate, operative mortality, and other perioperative outcomes are presented in Table 5 and Table 6. Patients aged < 50 years had a shorter length of hospital stay than those aged ≥ 50 years (p = 0.0336). No significant between-group differences were observed for the other evaluated perioperative outcomes.
Overall, pathological characteristics were similar between the age groups (Table 7 and Table 8). In the unadjusted analysis, the prevalence of undifferentiated tumors did not differ significantly by age group (p = 0.0674). However, after adjustment for tumor location, EOCRC was associated with a higher prevalence of undifferentiated histology (PR, 2.38; 95% CI, 1.18–4.78; p = 0.0147). No significant associations were identified between age group and the other pathological outcomes.
The mean (SD) follow-up duration was 35.59 (16.27) months. For the OS analysis, tumor location, sex, BMI, ASA class, smoking, alcohol consumption, SDI, preoperative CEA level, surgical approach, tumor differentiation, lymphovascular invasion, perineural invasion, pathological stage, and number of lymph nodes examined were initially evaluated as potential covariates. Tumor location, SDI, ASA class, alcohol consumption, preoperative CEA level, surgical approach, tumor differentiation, perineural invasion, and pathological stage met the prespecified criterion of p < 0.25 and were considered in the multivariable model. After model selection, ASA class, alcohol consumption, and perineural invasion remained significantly associated with OS and were retained in the final core model.
After adjustment for these covariates, age group was not significantly associated with OS (HR, 2.26; 95% CI, 0.91–5.63; p = 0.0801) (Table 9). Similarly, Kaplan–Meier analysis showed no statistically significant difference in OS between the age groups (log-rank p = 0.2921). In both age groups, the Kaplan–Meier curves appeared to plateau between 25 and 50 months of follow-up (Figure 1). The 3-year OS rate was 75.0% among patients aged < 50 years and 67.4% among those aged ≥ 50 years.
For the DFS analysis, the same demographic, clinical, surgical, and pathological covariates were initially evaluated. ASA class, preoperative CEA level, perineural invasion, and pathological stage met the prespecified criterion of p < 0.25 and were considered in the multivariable model. After model selection, preoperative CEA level and perineural invasion remained significantly associated with DFS and were retained in the final core model.
After adjustment for these covariates, EOCRC was associated with a higher hazard of a DFS event compared with the control group (HR, 1.93; 95% CI, 1.00–3.72; p = 0.0483) (Table 10). Thus, patients aged < 50 years had an estimated 93% higher risk of recurrence after adjustment for the covariates retained in the final model. The unadjusted recurrence rate was 39.5% among patients aged < 50 years and 31.8% among those aged ≥ 50 years. Kaplan–Meier analysis showed no statistically significant difference in DFS between the age groups (log-rank p = 0.0685). The Kaplan–Meier curves appeared to plateau after approximately 25 months in patients aged < 50 years and after approximately 50 months in those aged ≥ 50 years (Figure 2).
4. Discussion
In this retrospective cohort of surgically treated patients with colorectal adenocarcinoma, patients aged < 50 years differed from older patients in several clinical and pathological characteristics, but most presenting features and perioperative outcomes were similar between groups. The principal findings were a higher adjusted prevalence of undifferentiated tumors in patients aged < 50 years and a higher risk of recurrence in this group after adjustment for the covariates retained in the final Cox model. In contrast, age group was not significantly associated with OS. These findings suggest that younger age may be associated with differences in tumor behavior and oncological outcomes, although the magnitude and independence of these associations require cautious interpretation.
Epidemiological studies indicate that EOCRC accounts for approximately 10% of CRC cases, and its incidence is expected to increase in the coming decades [1,2,4,5,6,7,8,9,10,11,12,13]. In our cohort, 78 patients (17.97%) were aged < 50 years and 356 (82.03%) were aged ≥ 50 years. The relatively high proportion of younger patients compared with population-based estimates may reflect referral patterns at a university hospital and should not be interpreted as representative of the general population. Interestingly, a previous case series conducted at the same institution between 2006 and 2010 reported that 31% of patients were aged < 50 years [7]. Thus, despite the increasing incidence of EOCRC reported globally, our institution-specific data do not demonstrate a corresponding increase in the proportion of younger patients over time.
Both age groups showed a slight predominance of women, with no significant difference in sex distribution. Brazilian national estimates have similarly indicated a relatively balanced CRC burden between men and women [2]. Previous studies of EOCRC have also reported a slight female predominance [14,15]. Among younger patients in our cohort, tumors were similarly distributed between the left colon and rectum, followed by the right colon. This distribution is consistent with previous studies reporting a predominance of distal colorectal tumors in patients with EOCRC [9,10,13,16,17].
As expected, younger patients had fewer comorbidities and a more favorable operative risk profile, with lower rates of hypertension, diabetes mellitus, smoking, and ASA III–IV classification. Although ICU admission differed between groups in the unadjusted analysis, this association was no longer significant after adjustment, suggesting that differences in perioperative resource use may be explained, at least in part, by differences in comorbidity burden rather than chronological age alone. Mita et al. evaluated the surgical outcomes of 396 patients aged ≥ 80 years undergoing radical gastric cancer surgery and observed no difference in postoperative morbidity and mortality in this population, with survival rates similar to those of patients undergoing curative surgery [18].
Clinical presentation was similar between age groups, with no significant differences in weight loss, change in bowel habits, bleeding, abdominal pain, or SDI. This finding contrasts with a previous study that reported a lower frequency of abdominal pain in patients aged ≥ 50 years [7]. Prior reports have demonstrated considerable variability in the prevalence of presenting symptoms, with abdominal pain reported in 11.6% to 63.0%, bleeding in 7.2% to 53.0%, and change in bowel habits in 2.1% to 54.0% [12,13,19,20]. The relatively high frequency of these symptoms in our cohort may reflect the advanced stage of disease at diagnosis. The interval between symptom onset and histopathological diagnosis did not differ significantly between age groups, with most patients receiving a diagnosis within 6 months of symptom onset.
Laparoscopy was the preferred surgical approach, whereas open surgery was used when minimally invasive surgery was considered technically unsuitable or when the patient’s clinical condition precluded pneumoperitoneum. Surgical approach did not differ significantly between age groups, consistent with evidence supporting minimally invasive colorectal surgery across age categories [21,22,23,24,25]. Nevertheless, open surgery remained relatively frequent in both groups. This may reflect the advanced disease encountered in this cohort as well as the long study period, from 2010 to 2020, during which minimally invasive colorectal surgery was progressively implemented at our institution.
Pathological stage did not differ significantly between age groups. Although stage III–IV disease was numerically more frequent among patients aged < 50 years (62.67% vs. 56.89%; p = 0.3595), metastatic disease at presentation was similarly prevalent in younger and older patients (stage IV, 18.92% vs. 19.60%). Thus, the greater proportion of stage III–IV disease among younger patients was not attributable to a higher prevalence of metastatic disease. After adjustment for tumor location, however, patients aged < 50 years had a significantly higher prevalence of undifferentiated tumors, which could indicate a more aggressive disease in this population. Other adverse features were also numerically more frequent among younger patients, including advanced T stage (T3–T4), lymph node involvement (N1–N2), and lymphovascular invasion, whereas this pattern was not observed for perineural invasion.
Our findings reinforce the growing body of evidence suggesting that EOCRC is a distinct clinical and biological entity compared with late-onset disease, characterized by a more aggressive phenotype [26]. In our cohort, the higher prevalence of undifferentiated tumors among patients aged < 50 years aligns with previous reports indicating that EOCRC is frequently associated with adverse histological features, such as mucinous or signet-ring cell histology and poor differentiation [27].
Crucially, our multivariable analysis identified age < 50 years as an independent risk factor for recurrence (adjusted HR, 1.93), even after controlling for stage and perineural invasion. This finding suggests that the poorer outcomes observed in patients aged < 50 years may be driven by intrinsic biological aggressiveness rather than solely by diagnostic delays or more advanced disease at presentation. Recent comprehensive molecular characterization studies have shown that sporadic EOCRC often harbors distinct genomic alterations compared with late-onset CRC, including lower frequencies of APC mutations and higher frequencies of CTNNB1 and TP53 mutations, which may contribute to this aggressive behavior and resistance to standard therapies [26,28].
The clinical implications of these findings are substantial. Identifying age < 50 years as an independent predictor of recurrence challenges the assumption that younger patients should be treated identically to their older counterparts based solely on TNM stage. Our findings support a lower threshold for considering more aggressive adjuvant therapy and, perhaps more importantly, suggest that younger patients may benefit from more intensive postoperative surveillance to facilitate early detection of recurrence. Future precision medicine approaches should prioritize routine molecular profiling, including circulating tumor DNA analysis and next-generation sequencing, in this population to better tailor therapeutic strategies [28].
No statistically significant difference in OS was observed between the groups, which may be related to advances in treatment. Multivariable analysis identified several factors associated with poorer prognosis as independently significant. Higher ASA class, alcohol consumption, and perineural invasion were associated with lower OS, whereas higher preoperative CEA level and perineural invasion were associated with poorer DFS. BMI was not identified as an independent prognostic factor, in contrast to findings from a previous study conducted at our institution [7].
We acknowledge that this study has limitations. Its retrospective, single-center design introduces the potential for selection and information bias, and the number of patients with EOCRC was relatively small compared with the older group. Because the cohort was restricted to surgically treated patients at a university hospital, the findings may not be generalizable to all patients with CRC, particularly those managed without surgery. Finally, information on neoadjuvant and adjuvant treatment was not available; therefore, potential differences in systemic therapy or radiotherapy between age groups could not be incorporated into the survival analyses.
In conclusion, among surgically treated patients with colorectal adenocarcinoma, patients aged < 50 years had a higher prevalence of undifferentiated tumors and a higher risk of disease recurrence than patients aged ≥ 50 years. No significant age-related difference was observed in OS, SDI, or pathological stage. These findings suggest that younger age may be associated with differences in tumor characteristics and disease recurrence, but further studies incorporating treatment exposure, stage, and molecular characteristics are needed to clarify the independent prognostic significance of age in EOCRC.
Author Contributions
Conceptualization, A.A.M.S., B.A.A.M., and J.B.S.; Methodology, A.A.M.S., B.A.A.M., and J.B.S.; Software, A.A.M.S.; validation, A.A.M.S., B.A.A.M., O.M.F., A.C.N.S., C.O.B., R.M.A., and J.B.S.; formal analysis, A.A.M.S.; investigation, A.A.M.S., B.A.A.M., O.M.F., A.C.N.S., C.O.B., R.M.A., T.C, and J.B.S.; resources, J.B.S.; data curation, A.A.M.S., B.A.A.M., O.M.F., and C.O.B.; writing – original draft preparation, A.A.M.S. and B.A.A.M.; writing – review & editing, A.A.M.S., B.A.A.M., O.M.F., A.C.N.S., C.O.B., R.M.A., T.C., and J.B.S.; visualization, A.A.M.S.; supervision, J.B.S.; project administration, J.B.S. All authors have read and agreed to the published version of the manuscript.
Funding
This research received no external funding.
Institutional Review Board Statement
The study was conducted in accordance with the Declaration of Helsinki, and approved by the Ethics Committee of the Medical School of the University of Brasília (CAAE: 64202422.7.0000.5558 on Oct 28, 2022).
Informed Consent Statement
Patient consent was waived due to the retrospective nature of data collection.
Data Availability Statement
The original contributions presented in this study are included in the article/supplementary material. Further inquiries can be directed to the corresponding author.
Conflicts of Interest
The authors declare no conflicts of interest.
Abbreviations
The following abbreviations are used in this manuscript:
| ASA | American Society of Anesthesiologists |
| BMI | body mass index |
| CEA | carcinoembryonic antigen |
| CI | confidence interval |
| CRC | colorectal cancer |
| DFS | disease-free survival |
| EOCRC | early-onset colorectal cancer |
| HR | hazard ratio |
| ICU | intensive care unit |
| OS | overall survival |
| PR | prevalence ratio |
| SD | standard deviation |
| SDI | symptom–to–diagnosis interval |
References
- Bray, F.; Laversanne, M.; Sung, H.; Ferlay, J.; Siegel, R.L.; Soerjomataram, I.; Jemal, A. Global cancer statistics 2022: GLOBOCAN estimates of incidence and mortality worldwide for 36 cancers in 185 countries. CA Cancer J. Clin. 2024, 74, 229–263. [Google Scholar] [CrossRef] [PubMed]
- Santos, M.O.; Lima, F.C.S.; Martins, L.F.L.; Oliveira, J.F.P.; Almeida, L.M.; Cancela, M.C. Estimativa de incidência de câncer no Brasil, 2023-2025. Rev. Bras. Cancerol. 2023, 69, e-213700. [Google Scholar] [CrossRef]
- Haggar, F.A.; Boushey, R.P. Colorectal cancer epidemiology: incidence, mortality, survival, and risk factors. Clin. Colon Rectal Surg. 2009, 22, 191–197. [Google Scholar] [CrossRef] [PubMed]
- American Cancer Society. Colorectal cancer facts & figures 2020-2022; American Cancer Society: Atlanta, EUA, 2020; pp. 1–46. [Google Scholar]
- Akimoto, N.; Ugai, T.; Zhong, R.; Hamada, T.; Fujiyoshi, K.; Giannakis, M.; Wu, K.; Cao, Y.; Ng, K.; Ogino, S. Rising incidence of early-onset colorectal cancer - a call to action. Nat. Rev. Clin. Oncol. 2021, 18, 230–243. [Google Scholar] [CrossRef] [PubMed]
- De Campos, F.G.C.M.; Figueiredo, M.N.; Monteiro, M.; Nahas, S.C.; Cecconello, I. Incidence of colorectal cancer in young patients. Rev. Col. Bras. Cir. 2017, 44, 208–215. [Google Scholar] [CrossRef] [PubMed]
- De Sousa, J.B.; Souza, C.S.; Fernandes, M.B.; de Castro Durães, L.; de Almeida, R.M.; Dos Santos, A.C.; da Silva, E.F.; de Oliveira, P.G. Do young patients have different clinical presentation of colorectal cancer causing delay in diagnosis? Int. J. Colorectal Dis. 2014, 29, 519–527. [Google Scholar] [CrossRef] [PubMed]
- Sinicrope, F.A. Increasing incidence of early-onset colorectal cancer. N Engl. J. Med. 2022, 386, 1547–1558. [Google Scholar] [CrossRef] [PubMed]
- Da Fonseca, L.M.; da Luz, M.M.; Lacerda-Filho, A.; Cabral, M.M.; da Silva, R.G. Colorectal carcinoma in different age groups: a histopathological analysis. Int. J. Colorectal Dis. 2012, 27, 249–255. [Google Scholar] [CrossRef] [PubMed]
- Chang, V.C.; Cotterchio, M.; De, P.; Tinmouth, J. Risk factors for early-onset colorectal cancer: a population-based case-control study in Ontario, Canada. Cancer Causes Control 2021, 32, 1063–1083. [Google Scholar] [CrossRef] [PubMed]
- Liang, J.; Kalady, M.F.; Church, J. Young age of onset colorectal cancers. Int. J. Colorectal Dis. 2015, 30, 1653–1657. [Google Scholar] [CrossRef] [PubMed]
- Skalitzky, M.K.; Zhou, P.P.; Goffredo, P.; Guyton, K.; Sherman, S.K.; Gribovskaja-Rupp, I.; Hassan, I.; Kapadia, M.R.; Hrabe, J.E. Characteristics and symptomatology of colorectal cancer in the young. Surgery 2023, 173, 1137–1143. [Google Scholar] [CrossRef] [PubMed]
- Done, J.Z.; Fang, S.H. Young-onset colorectal cancer: a review. World J. Gastrointest. Oncol. 2021, 13, 856–866. [Google Scholar] [CrossRef] [PubMed]
- Petrick, J.L.; Barber, L.E.; Warren Andersen, S.; Florio, A.A.; Palmer, J.R.; Rosenberg, L. Racial disparities and sex differences in early- and late-onset colorectal cancer incidence, 2001-2018. Front Oncol. 2021, 11, 734998. [Google Scholar] [CrossRef] [PubMed]
- Fritz, C.D.L.; Otegbeye, E.E.; Zong, X.; Demb, J.; Nickel, K.B.; Olsen, M.A.; Mutch, M.; Davidson, N.O.; Gupta, S.; Cao, Y. Red-flag signs and symptoms for earlier diagnosis of early-onset colorectal cancer. J. Natl. Cancer Inst. 2023, 115, 909–916. [Google Scholar] [CrossRef] [PubMed]
- Kirzin, S.; Marisa, L.; Guimbaud, R.; De Reynies, A.; Legrain, M.; Laurent-Puig, P.; Cordelier, P.; Pradère, B.; Bonnet, D.; Meggetto, F.; Portier, G.; Brousset, P.; Selves, J. Sporadic early-onset colorectal cancer is a specific sub-type of cancer: a morphological, molecular and genetics study. PLoS ONE 2014, 9, e103159. [Google Scholar] [CrossRef] [PubMed]
- Dong, B.; Chen, Y.; Lyu, G. Prognostic nomograms for predicting overall survival and cancer-specific survival of patients with very early-onset colorectal cancer: a population-based analysis. Bosn. J. Basic Med. Sci. 2022, 22, 803–817. [Google Scholar] [CrossRef] [PubMed]
- Mita, K.; Ito, H.; Hashimoto, M.; Murabayashi, R.; Asakawa, H.; Nabetani, M.; Koizumi, K.; Hayashi, T.; Fujino, K. Postoperative complications and survival after gastric cancer surgery in patients older than 80 years of age. J. Gastrointest. Surg. 2013, 17, 2067–2073. [Google Scholar] [CrossRef] [PubMed]
- Sanford, S.D.; Zhao, F.; Salsman, J.M.; Chang, V.T.; Wagner, L.I.; Fisch, M.J. Symptom burden among young adults with breast or colorectal cancer. Cancer 2014, 120, 2255–2263. [Google Scholar] [CrossRef] [PubMed]
- Reddy, S.; Mouchli, A.; Bierle, L.; Gerrard, M.; Walsh, C.; Mir, A.; Lebel, D.P.; Mason, C.; Grider, D.; Rubio, M. Assessing presenting symptoms, co-morbidities, and risk factors for mortality in underserved patients with non-hereditary early-onset colorectal cancer. Cureus 2021, 13, e16117. [Google Scholar] [CrossRef] [PubMed]
- Biondi, A.; Grosso, G.; Mistretta, A.; Marventano, S.; Toscano, C.; Drago, F.; Gangi, S.; Basile, F. Laparoscopic vs. open approach for colorectal cancer: evolution over time of minimal invasive surgery. BMC Surg. 2013, 13 (SUPPL.2), S12. [Google Scholar] [CrossRef] [PubMed]
- Hinoi, T.; Kawaguchi, Y.; Hattori, M.; Okajima, M.; Ohdan, H.; Yamamoto, S.; Hasegawa, H.; Horie, H.; Murata, K.; Yamaguchi, S.; Sugihara, K.; Watanabe, M.; Japan Society of Laparoscopic Colorectal Surgery. Laparoscopic versus open surgery for colorectal cancer in elderly patients: a multicenter matched case-control study. Ann. Surg. Oncol. 2015, 22, 2040–2050. [Google Scholar] [CrossRef] [PubMed]
- Martínez-Martínez, A.B.; Arbonés-Mainar, J.M. Colorectal cancer: immune response in laparoscopic versus open colorectal surgery. Cir. Cir. 2022, 90, 295–302. [Google Scholar] [CrossRef] [PubMed]
- Bell, S.; Kong, J.C.; Carne, P.W.G.; Chin, M.; Simpson, P.; Farmer, C.; Warrier, S.K. Oncological safety of laparoscopic versus open colorectal cancer surgery in obesity: a systematic review and meta-analysis. ANZ J. Surg. 2019, 89, 1549–1555. [Google Scholar] [CrossRef] [PubMed]
- Morneau, M.; Boulanger, J.; Charlebois, P.; Latulippe, J.F.; Lougnarath, R.; Thibault, C.; Gervais, N.; Comité de l’Évolution des Pratiques en Oncologie. Laparoscopic versus open surgery for the treatment of colorectal cancer: a literature review and recommendations from the Comité de l’évolution des pratiques en oncologie. Can. J. Surg. 2013, 56, 297–310. [Google Scholar] [CrossRef] [PubMed]
- Mauri, G.; Sartore-Bianchi, A.; Russo, A.G.; Marsoni, S.; Bardelli, A.; Siena, S. Early-onset colorectal cancer in young individuals. Mol. Oncol. 2019, 13, 109–131. [Google Scholar] [CrossRef] [PubMed]
- Willauer, A.N.; Liu, Y.; Pereira, A.A.L.; Lam, M.; Morris, J.S.; Raghav, K.P.S.; Morris, V.K.; Menter, D.; Broaddus, R.; Meric-Bernstam, F.; Hayes-Jordan, A.; Huh, W.; Overman, M.J.; Kopetz, S.; Loree, J.M. Clinical and molecular characterization of early-onset colorectal cancer. Cancer 2019, 125, 2002–2010. [Google Scholar] [CrossRef] [PubMed]
- Ballester, V.; Rashtak, S.; Boardman, L. Clinical and molecular features of young-onset colorectal cancer. World J. Gastroenterol. 2016, 22, 1736–1744. [Google Scholar] [CrossRef] [PubMed]
Figure 1.
Kaplan–Meier curves for overall survival according to age group.
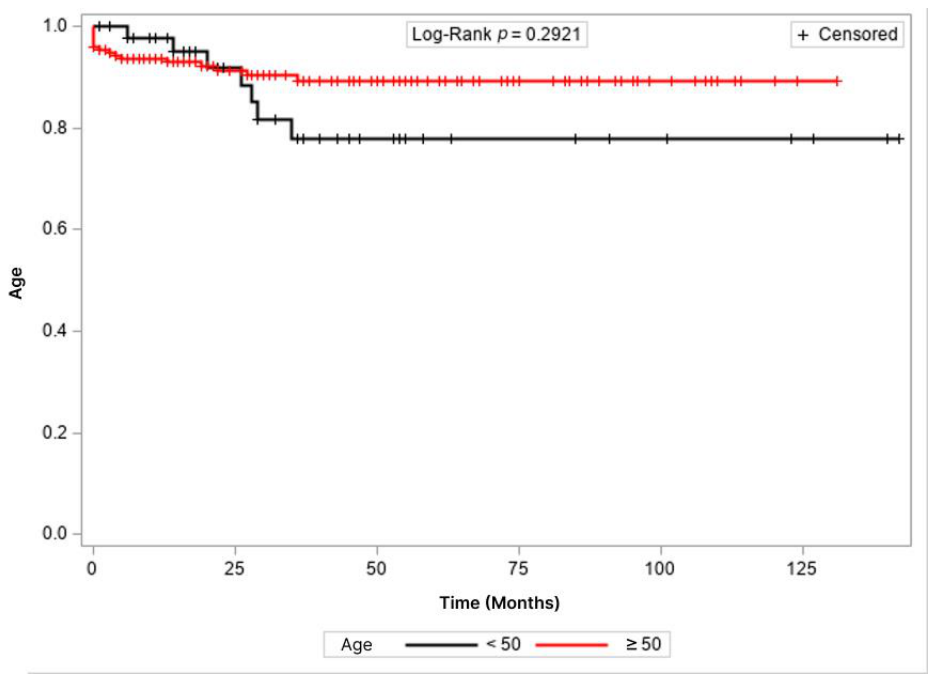
Figure 2.
Kaplan–Meier curves for disease-free survival according to age group.
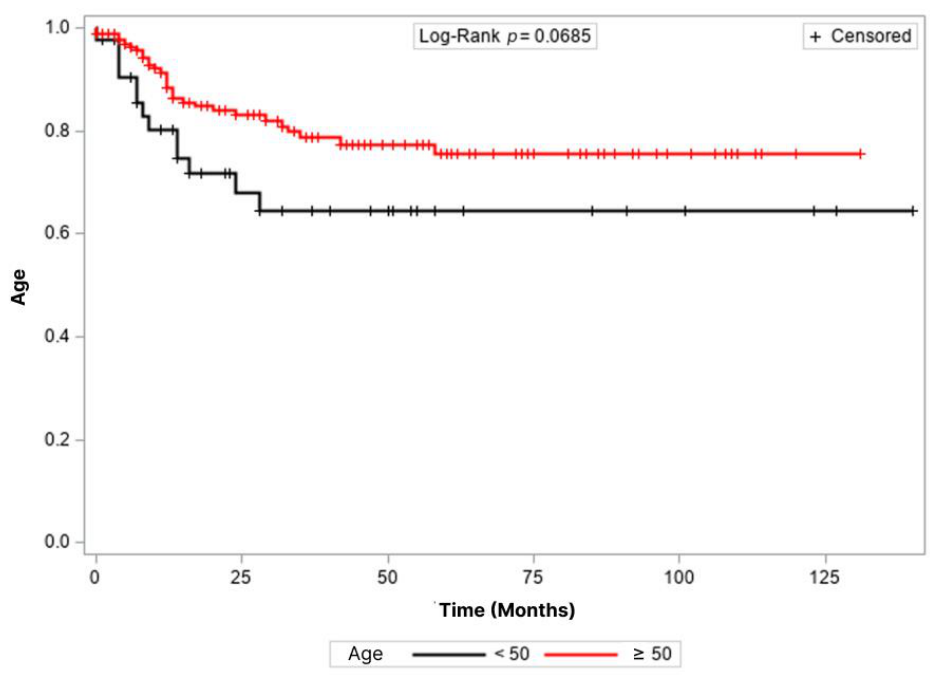

Table 1.
Demographic characteristics.
| Characteristic | Overall (N = 434) | Age < 50 years (n = 78, 17.97%) | Age ≥ 50 years (n = 356; 82.03%) | p-value* |
| Age (years), mean ± SD | 60.88 ± 12.49 | 41.78 ± 6.30 | 65.08 ± 9.15 | 0.0000 |
| Sex, n (%) | 0.5280 | |||
| Female | 242 (55.76) | 46 (58.97) | 196 (55.06) | |
| Male | 192 (44.24) | 32 (41.03) | 160 (44.94) | |
| ASA class, n (%) | 0.0243 | |||
| II | 304 (70.20) | 63 (80.77) | 241 (67.89) | |
| III + IV | 129 (29.8) | 15 (19.23) | 114 (32.11) | |
| Smoking, n (%) | <0.0001 | |||
| No | 273 (67.57) | 63 (87.50) | 210 (63.25) | |
| Yes | 131 (32.43) | 9 (12.50) | 122 (36.75) | |
| Alcohol consumption, n (%) 1 | 0.0553 | |||
| No | 361 (89.58) | 69 (95.83) | 292 (88.22) | |
| Yes | 42 (10.42) | 3 (4.17) | 39 (11.78) | |
| Diabetes mellitus, n (%) | <0.0001 | |||
| No | 326 (80.69) | 70 (97.22) | 256 (77.11) | |
| Yes | 78 (19.31) | 2 (2.78) | 76 (22.89) | |
| Hypertension, n (%) | <0.0001 | |||
| No | 225 (55.69) | 64 (88.89) | 161 (48.49) | |
| Yes | 179 (46.31) | 8 (11.11) | 171 (51.51) | |
| BMI (kg/m2), mean ± SD | 25.20 ± 4.77 | 25.24 ± 5.60 | 25.19 ± 4.58 | 0.9412 |
| SDI, n (%) | 0.5102 | |||
| < 6 months | 247 (56.91) | 47 (60.26) | 200 (56.18) | |
| ≥ 6 months | 187 (43.09) | 31 (39.74) | 156 (43.82) |
Abbreviations: ASA, American Society of Anesthesiologists; BMI, body mass index; SD, standard deviation; SDI, symptom–to–diagnosis interval. 1 Data on alcohol consumption were available for 403 of 434 patients: Overall (N = 403); Age < 50 years (n = 72, 17.86%); Age ≥ 50 years (n = 331; 82.13%). The missing data are due to a lack of documentation in the medical record. * Chi-square test or Student’s t test, as appropriate.
Table 2.
Tumor location.
| Variable | Overall1 (N = 431) | Age < 50 years (n = 77, 17.86%) | Age ≥ 50 years (n = 354; 82.13%) | p-value* |
| Location, n (%) | 0.8412 | |||
| Right colon | 92 (21.34) | 15 (19.48) | 77 (21.75) | |
| Left colon | 177 (41.07) | 31 (40.26) | 146 (41.24) | |
| Rectum | 162 (37.59) | 31 (40.26) | 131 (37.01) |
1 Data on tumor location were available for 431 of 434 patients. The missing data are due to a lack of documentation in the medical record. * Chi-square test or Student’s t test, as appropriate.
Table 3.
Clinical presentation.
| Variable | Overall1 (N = 347) | Age < 50 years (n = 60, 17.29%) | Age ≥ 50 years (n = 287; 82.70%) | p-value* |
| Weight loss, n (%) | 0.8550 | |||
| No | 183 (52.74) | 31 (51.67) | 152 (52.96) | |
| Yes | 164 (47.26) | 29 (48.33) | 135 (47.04) | |
| Change in bowel habits, n (%) | 0.3350 | |||
| No | 177 (51.00) | 34 (56.67) | 143 (49.83) | |
| Yes | 170 (49.00) | 26 (43.33) | 144 (50.17) | |
| Bleeding, n (%) | 0.1684 | |||
| No | 161 (46.40) | 23 (38.33) | 138 (48.08) | |
| Yes | 186 (53.60) | 37 (61.67) | 149 (51.92) | |
| Abdominal pain, n (%) | 0.6920 | |||
| No | 170 (49.00) | 28 (46.67) | 142 (49.48) | |
| Yes | 177 (51.00) | 32 (53.33) | 145 (50.52) |
1 Data on clinical presentation were available for 347 of 434 patients. The missing data are due to a lack of documentation in the medical record.* Chi-square test or Student’s t test, as appropriate.
Table 4.
Unadjusted and adjusted prevalence ratios for the association between age group and clinical presentation.
Table 4.
Unadjusted and adjusted prevalence ratios for the association between age group and clinical presentation.
| Prevalence ratio (95% CI) | |||||
| Age (years) | Unadjusted | p-value | Adjusted | p-value | |
| Bleeding Yes × No |
1.18 (0.94-1.48) | 0.1563 | 1.17 (0.93-1.47)1 | 0.1739 | |
| Abdominal pain Yes × No |
1.05 (0.81-1.36) | 0.7251 | 0.95 (0.73-1.24)2 | 0.7110 | |
| < 50 × ≥ 50 | Change in bowel habits Yes × No |
0.86 (0.63-1.17) | 0.3336 | 0.92 (0.66-1.27)3 | 0.5941 |
| Weight loss Yes × No |
1.02 (0.76-1.36) | 0.8912 | 1.06 (0.79-1.41)4 | 0.3819 | |
| SDI (months) ≥ 6 × < 6 |
0.92 (0.69-1.23) | 0.5857 | 0.92 (0.69-1.23)1 | 0.5871 | |
Abbreviations: BMI, body mass index; CI, confidence interval; SDI, symptom–to–diagnosis interval. 1 Adjusted for BMI and age; 2 Adjusted for sex, diabetes mellitus, and age; 3 Adjusted for smoking and age; 4 Adjusted for smoking, alcohol consumption, BMI, and age.
Table 5.
Perioperative outcomes.
| Variable | Overall (N = 434) | Age < 50 years (n = 78, 17.97%) | Age ≥ 50 years (n = 356; 82.03%) | p-value* |
| Surgical approach, n (%) | 0.3346 | |||
| Open | 152 (35.02) | 31 (39.74) | 121 (33.99) | |
| Laparoscopic | 282 (64.98) | 47 (60.26) | 235 (66.01) | |
| Conversion to open surgery, n (%)1 | 0.2810 | |||
| No | 126 (84.00) | 28 (90.32) | 98 (82.35) | |
| Yes | 24 (16.00) | 3 (9.68) | 21 (17.65) | |
| Reoperation, n (%)2 | 0.1902 | |||
| No | 379 (87.93) | 72 (92.31) | 307 (86.97) | |
| Yes | 52 (12.07) | 6 (7.69) | 46 (13.03) | |
| ICU admission, n (%) | 0.0054 | |||
| No | 318 (73.27) | 67 (85.90) | 251 (70.51) | |
| Yes | 116 (26.73) | 11 (14.10) | 105 (29.49) | |
| Operative mortality, n (%) | 0.0830 | |||
| No | 403 (92.85) | 76 (97.44) | 327 (91.85) | |
| Yes | 31 (7.15) | 2 (2.56) | 29 (8.15) | |
| Length of hospital stay (days), mean ± SD | 9.18 ± 8.88 | 7.88 ± 5.98 | 9.46 ± 9.36 | 0.1898 |
Abbreviations: ICU, intensive care unit; SD, standard deviation. 1 Data on conversion to open surgery were available for 150 of 152 patients: Overall (N = 150); Age < 50 years (n = 31, 20.66%); Age ≥ 50 years (n = 119; 79.33%). 2 Data on reoperation were available for 431 of 434 patients: Overall (N = 431); Age < 50 years (n = 78, 18.09%); Age ≥ 50 years (n = 353; 81.90%). The missing data are due to a lack of documentation in the medical record. * Chi-square test, Fisher’s exact test, or Mann–Whitney test, as appropriate.
Table 6.
Unadjusted and adjusted prevalence ratios for the association between age group and perioperative outcomes.
Table 6.
Unadjusted and adjusted prevalence ratios for the association between age group and perioperative outcomes.
| Prevalence ratio (95% CI) | |||||
| Age (years) | Unadjusted | p-value | Adjusted | p-value | |
| < 50 × ≥ 50 | Surgical approach Open × Laparoscopic |
1.21 (0.89-1.66) | 0.2241 | 1.09 (0.80-1.48)1 | 0.5958 |
| Conversion Yes × No |
0.53 (0.17-1.65) | 0.2732 | 0.60 (0.19-1.90)2 | 0.3852 | |
| Reoperation Yes × No |
0.42 (0.16-1.14) | 0.0888 | 0.42 (0.16-1.14)3 | 0.0884 | |
| ICU admission Yes × No |
0.46 (0.25-0.84) | 0.0113 | 0.61 (0.33-1.13)4 | 0.1165 | |
| Operative mortality Yes × No |
0.20 (0.03-1.45) | 0.1107 | 0.28 (0.04-2.02)5 | 0.2049 | |
| Length of hospital stay* | 0.09 (-0.01 to 0.19) | 0.0650 | 0.11 (0.01-0.21)6 | 0.0336 | |
Abbreviations: ASA, American Society of Anesthesiologists; BMI, body mass index; CI, confidence interval. 1 Adjusted for smoking, ASA class, and age; 2 Adjusted for sex, diabetes mellitus, BMI, and age; 3 Adjusted for BMI and age; 4 Adjusted for hypertension, ASA class, and age; 5 Adjusted for hypertension and age; 6 Adjusted for diabetes mellitus, hypertension, and age; * Pearson’s correlation coefficient was used in the unadjusted analysis, and Pearson’s partial correlation coefficient was used in the adjusted analysis.
Table 7.
Pathological characteristics and staging.
| Variable | Overall | Age < 50 years | Age ≥ 50 years | p-value* |
| Recurrence/Metastasis, n (%) | (N = 434) | (n = 78, 17.97%) | (n = 356; 82.03%) | 0.3046 |
| No | 294 (67.74) | 49 (62.82) | 245 (68.82) | |
| Yes | 140 (32.26) | 29 (37.18) | 111 (31.18) | |
| T stage, n (%) | (N = 381) | (n = 68, 17.84%) | (n = 313, 82.15%) | 0.6441 |
| T1 + T2 | 98 (25.72) | 19 (27.94) | 79 (25.24) | |
| T3 + T4 | 283 (74.28) | 49 (72.06) | 234 (74.76) | |
| N stage, n (%) | (N = 379) | (n = 67, 17.67%) | (n = 312, 82.32%) | 0.5363 |
| N0 | 194 (51.97) | 32 (47.76) | 162 (51.92) | |
| N1 + N2 | 185 (48.03) | 35 (52.24) | 150 (48.08) | |
| Lymphovascular invasion, n (%) | (N = 318) | (n = 57, 17.92%) | (n = 261, 82.07%) | 0.9285 |
| No | 188 (59.12) | 34 (59.65) | 154 (59.00) | |
| Yes | 130 (40.88) | 23 (40.35) | 107 (41.00) | |
| Perineural invasion, n (%) | (N = 317) | (n = 56, 17.66%) | (n = 261, 82.33%) | 0.3799 |
| No | 203 (64.04) | 33 (58.93) | 170 (65.13) | |
| Yes | 114 (35.96) | 23 (41.07) | 91 (34.87) | |
| Stage, n (%) | (N = 409) | (n = 75, 18.33%) | (n = 334, 81.66%) | 0.3595 |
| I + II | 172 (42.05) | 28 (37.33) | 144 (43.11) | |
| III + IV | 237 (57.95) | 47 (62.67) | 190 (56.89) | |
| Tumor differentiation, n (%) | (N = 335) | (n = 59, 17.61%) | (n = 276, 82.38%) | 0.0797 |
| Differentiated | 304 (90.75) | 50 (84.75) | 254 (92.03) | |
| Undifferentiated | 31 (9.25) | 9 (15.25) | 22 (7.97) | |
| Number of lymph nodes examined, n (%) | (N = 382) | (n = 69, 18.06%) | (n = 313, 81.93%) | 0.2350 |
| < 12 | 75 (19.63) | 10 (14.49) | 65 (20.77) | |
| ≥ 12 | 307 (80.37) | 59 (85.51) | 248 (79.23) |
* Chi-square test or Mann–Whitney test, as appropriate.
Table 8.
Unadjusted and adjusted prevalence ratios for the association between age group and pathological outcomes.
Table 8.
Unadjusted and adjusted prevalence ratios for the association between age group and pathological outcomes.
| Prevalence ratio (95% CI) | |||||
| Age (years) | Unadjusted | p-value | Adjusted | p-value | |
| < 50 × ≥ 50 | Metastasis Yes × No |
1.19 (0.85-1.66) | 0.3154 | 1.18 (0.85-1.66)1 | 0.3144 |
| T stage T3 + T4 × T1 + T2 |
0.92 (0.78-1.10) | 0.3816 | 0.93 (0.78-1.11)2 | 0.4343 | |
| N stage N1 + N2 × N0 |
1.00 (0.75-1.33) | 0.9900 | 0.99 (0.75-1.32)1 | 0.9750 | |
| Stage III + IV × I + II |
0.98 (0.88-1.10) | 0.7749 | 0.99 (0.89-1.10)2 | 0.8960 | |
| Tumor differentiation Differentiated× Undifferentiated |
1.95 (0.95-4.01) | 0.0674 | 2.38 (1.18-4.78)3 | 0.0147 | |
| Lymphovascular invasion Yes × No |
0.96 (0.67-1.37) | 0.8057 | 1.02 (0.71-1.47)4 | 0.9231 | |
| Perineural invasion Yes × No |
1.13 (0.79-1.63) | 0.4975 | 1.13 (0.78-1.62)1 | 0.5184 | |
Abbreviations: CI, confidence interval. 1 Adjusted for body mass index and age; 2 Adjusted for alcohol consumption and age; 3 Adjusted for tumor location and age; 4 Adjusted for smoking and age.
Table 9.
Cox proportional hazards regression model for overall survival.
| Hazard ratio (95% CI) | ||||
| Unadjusted | p-value | Adjusted* | p-value | |
| Location | 0.2152 | - | ||
| Left colon | 1.39 (0.65-2.99) | 0.3977 | - | - |
| Right colon | 1 | - | - | - |
| Rectum | 1.87 (0.89-3.95) | 0.0986 | - | - |
| Sex | 0.3750 | - | - | |
| Female | 1 | - | - | - |
| Male | 1.25 (0.76-2.05) | 0.3750 | - | - |
| SDI (months) | 0.1959 | - | - | |
| < 6 | 1 | - | - | - |
| ≥ 6 | 1.50 (0.81-2.75) | 0.1959 | - | - |
| ASA class | 0.0095 | 0.0124 | ||
| II | 1 | - | 1 | - |
| III + IV | 1.97 (1.18-3.28) | 0.0095 | 2.85 (1.25-6.47) | 0.0124 |
| BMI | 0.98 (0.92-1.04) | 0.4847 | - | - |
| Smoking | 0.6872 | - | - | |
| No | 1 | - | - | - |
| Yes | 1.12 (0.65-1.93) | 0.6872 | - | - |
| Alcohol consumption | 0.0680 | 0.0480 | ||
| No | 1 | - | 1 | - |
| Yes | 1.95 (0.95-3.98) | 0.0680 | 2.78 (1.02-8.32) | 0.0480 |
| Preoperative CEA | 0.0215 | - | - | |
| < 5 ng/mL | 1 | - | - | - |
| ≥ 5 ng/mL | 2.13 (1.12-4.06) | 0.0215 | - | - |
| Surgical approach | 0.0265 | - | ||
| Laparoscopic | 1 | - | - | - |
| Open | 2.00 (1.08-3.67) | 0.0265 | - | - |
| Tumor differentiation | 0.0301 | - | - | |
| Differentiated | 1 | - | - | - |
| Undifferentiated | 2.49 (1.09-5.67) | 0.0301 | - | - |
| Perineural invasion | 0.0104 | 0.0008 | ||
| No | 1 | - | 1 | - |
| Yes | 2.36 (1.22-4.56) | 0.0104 | 4.96 (1.95-12.60) | 0.0008 |
| Lymphovascular invasion | 0.2674 | - | - | |
| No | 1 | - | - | - |
| Yes | 1.45 (0.75-2.78) | 0.2674 | - | - |
| Stage | 0.0043 | - | - | |
| I + II | 1 | - | - | - |
| III + IV | 2.48 (1.33-4.63) | 0.0043 | - | - |
| Number of lymph nodes examined | 0.9138 | - | - | |
| < 12 | 1 | - | - | - |
| ≥ 12 | 1.04 (0.48-2.25) | 0.9138 | - | - |
| Age (years) | 0.2987 | 0.0801 | ||
| < 50 | 1.60 (0.66-3.85) | 0.2987 | 2.26 (0.91-5.63) | 0.0801 |
| ≥ 50 | 1 | - | 1 | - |
Abbreviations: ASA, American Society of Anesthesiologists; BMI, body mass index; CEA, carcinoembryonic antigen; CI, confidence interval; SDI, symptom–to–diagnosis interval. *Adjusted for ASA class, perineural invasion, alcohol consumption, and age.
Table 10.
Cox proportional hazards regression model for disease-free survival.
| Hazard ratio (95% CI) | ||||
| Unadjusted | p-value | Adjusted* | p-value | |
| Location | 0.2879 | - | ||
| Left colon | 1 | - | - | - |
| Right colon | 1.11 (0.55-2.24) | 0.7784 | - | - |
| Rectum | 1.52 (0.88-2.62) | 0.1313 | - | - |
| Sex | 0.8321 | - | - | |
| Female | 1 | - | - | - |
| Male | 0.95 (0.58-1.55) | 0.8321 | - | - |
| SDI (months) | 1.0000 | - | - | |
| < 6 | 1.00 (0.56-1.71) | 1.0000 | - | - |
| ≥ 6 | 1 | - | - | - |
| ASA class | 0.0932 | - | - | |
| II | 1 | - | - | - |
| III + IV | 1.58 (0.93-2.70) | 0.0932 | - | - |
| BMI | 0.99 (0.93-1.04) | 0.6440 | - | - |
| Smoking | 0.7470 | - | - | |
| No | 1 | - | - | - |
| Yes | 1.09 (0.65-1.81) | 0.7470 | - | - |
| Alcohol consumption | 0.4744 | - | - | |
| No | 1 | - | - | - |
| Yes | 1.36 (0.59-3.16) | 0.4744 | - | - |
| Preoperative CEA | 0.0049 | 0.0118 | ||
| < 5 ng/mL | 1 | - | 1 | - |
| ≥ 5 ng/mL | 2.14 (1.26-3.64) | 0.0049 | 2.17 (1.19-3.96) | 0.0118 |
| Surgical approach | 0.5281 | - | ||
| Laparoscopic | 1 | - | - | - |
| Open | 1.18 (0.71-1.97) | 0.5281 | - | - |
| Tumor differentiation | 0.2527 | - | - | |
| Differentiated | 1 | - | - | - |
| Undifferentiated | 1.65 (0.70-3.87) | 0.2527 | - | - |
| Perineural invasion | 0.0030 | 0.0007 | ||
| No | 1 | - | 1 | - |
| Yes | 2.32 (1.33-4.04) | 0.0030 | 2.84 (1.55-5.19) | 0.0007 |
| Lymphovascular invasion | 0.7322 | - | - | |
| No | 1 | - | - | - |
| Yes | 1.10 (0.62-1.96) | 0.7322 | - | - |
| Stage | 0.0007 | - | - | |
| I + II | 1 | - | - | - |
| III | 2.50 (1.47-4.26) | 0.0007 | - | - |
| Number of lymph nodes examined | 0.5583 | - | - | |
| < 12 | 1 | - | - | - |
| ≥ 12 | 1.22 (0.62-2.42) | 0.5583 | - | - |
| Age (years) | 0.0740 | 0.0483 | ||
| ≥ 50 | 1 | - | 1 | - |
| < 50 | 1.81 (0.94-3.47) | 0.0740 | 1.93 (1.00-3.72) | 0.0483 |
Abbreviations: ASA, American Society of Anesthesiologists; BMI, body mass index; CEA, carcinoembryonic antigen; CI, confidence interval; SDI, symptom–to–diagnosis interval. * Adjusted for preoperative CEA, perineural invasion, and age.
Disclaimer/Publisher’s Note: The statements, opinions and data contained in all publications are solely those of the individual author(s) and contributor(s) and not of MDPI and/or the editor(s). MDPI and/or the editor(s) disclaim responsibility for any injury to people or property resulting from any ideas, methods, instructions or products referred to in the content. |
© 2026 by the authors. Licensee MDPI, Basel, Switzerland. This article is an open access article distributed under the terms and conditions of the Creative Commons Attribution (CC BY) license.
Copyright: This open access article is published under a Creative Commons CC BY 4.0 license, which permit the free download, distribution, and reuse, provided that the author and preprint are cited in any reuse.