
Submitted:
09 November 2026
Posted:
11 November 2026
You are already at the latest version
Abstract
Traditional zaojing ceilings distinguish visually prominent overhead areas in halls for worship, as-sembly, and performance, yet similar outlines can enclose different arrangements of visible panels and timber members. Using terrestrial laser scanning, field photographs, and existing conditional models, this study examines 64 ceilings in 15 buildings in Fu’an. The comparison addresses physical measurement extent, internal panel articulation, and position within ceiling ensembles. With-in-ceiling analyses show that changing the lower reference changes the enclosure segment represent-ed by geometric indicators. Among 32 ceilings with continuous inclined-panel-foot references (P32), the area within the adopted opening boundary and reference height difference are positively associ-ated (Spearman ρ = 0.824), while covariation among the proportional indicators depends on building composition. Six detailed cases distinguish slope transitions within continuous panels from inde-pendent inner-panel zones; similar relative depths can therefore represent different visible arrange-ments. Across six ensembles comprising 41 ceilings in five buildings, central-to-peripheral or cen-tral-to-flanking relative-depth ratios are 2.687 in Zhaoying Temple and 0.663 in Huang Ancestral Hall. These cases show contrasting relationships between spatial centrality and relative recess depth. The approach describes existing ceiling morphology through explicit physical references and links dimensions, component identities, and spatial positions to their measured or model-derived evidence.
Keywords:
zaojing ceiling
; architectural morphology
; physical measurement reference
; panel articulation
; en-semble configuration
; digital heritage documentation
1. Introduction
A zaojing ceiling is a recessed overhead enclosure that marks a local zone beneath the roof structure of a traditional Chinese building. Its inward-rising panels and timber members converge toward a central closure (Figure 1). Historical descriptions place such ceilings above thrones and religious images, while surveys of traditional stages document their use above performance areas [1,2,3]. These features raise an architectural question: how does an overhead form distinguish a focal area within a larger interior? A similar-looking recess may be formed by a continuous sloping surface or by an assembly of separate members and panels. Distinguishing these arrangements supports comparisons of built form and the documentation of surviving timber fabric.
Zaojing ceilings have a long documentary history encompassing early Chinese examples and later timber construction. Studies of early zaojing forms [4] and historical construction accounts, including the Yingzao Fashi and the illustrated Architectural Design Reference Atlas [1], provide terminology for their recessed profiles and layered composition. Changes in overhead surfaces, member arrangements, and central closures distinguish focal interior zones from the surrounding ceiling. These historical sources inform the interpretation of the surviving Fu’an examples; shared construction rules require evidence from the individual buildings.
Comparable questions arise in other architectural settings. A study of medieval Chinese mosques compares domed mihrab chambers with Central Asian examples and notes that some later Chinese mosques also employed wooden caisson ceilings above mihrab areas [5]. Research on stacked ceiling forms in grotto architecture offers another setting in which overhead layering can be examined as spatial composition rather than ornament alone [6]. The present Fu’an sample spans ancestral, Buddhist, folk-religious, and Catholic settings. These examples motivate comparisons of the physical formation and placement of overhead features in spaces with different uses.
Alexander and his coauthors discuss spatial differentiation in Pattern 190, “Ceiling Height Variety,” and the configuration of room enclosures in Pattern 191, “The Shape of Indoor Space” [7]. Pattern 190 concerns differences in inhabited room height, whereas Pattern 191 addresses the form of an indoor space, including its overhead shape. The reference height difference measured here describes a ceiling recess; room height is measured from floor to ceiling. At the scale of the recess, these patterns frame two interpretive questions: does a central zaojing consistently form a deeper overhead feature than adjacent ceilings, and can similar overall depths be produced by different visible panel arrangements? The survey addresses these questions through measured geometry and visible component relationships.
Upward-tapering outlines can conceal differences in internal organization. A continuous panel may change slope, or an independent inner panel may separate an outer member zone from an inner enclosure. Central ceilings can also be relatively deeper or shallower than their neighbors. Interpreting overall area and depth indicators requires explicit physical measurement boundaries. Previous zaojing studies have examined construction types, regional cases, and measured sections [3,8,9]. The present comparison connects those geometric indicators to identifiable surfaces, components, and positions within buildings.
Fu’an lies in the mountainous coastal region of northeastern Fujian (Figure 2a–c). Its surviving traditional buildings include spaces for ancestral ceremonies, Buddhist worship, local religious practices, and Catholic services, alongside halls used for gatherings and theatrical performances. These uses and settings differ even where interiors contain timber ceilings with similar recessed outlines. Figure 2d maps the buildings selected for the survey.
The 15 surveyed buildings comprise seven ancestral halls (Z01–Z07), two Buddhist temples (Z08–Z09), one Catholic church (Z10), and five folk-religious temples (Z11–Z15). The surveyed zaojing ceilings occur above stages, front and rear halls, principal worship spaces, and adjoining bays. In Xidong Catholic Church, four recorded ceilings occupy the middle row and three occupy each side row. The reported foundation and rebuilding periods and the surveyed ceiling positions are summarized in Table A1, following the author’s earlier architectural survey [10]. These records provide building-level historical context for interpreting the surveyed spatial configurations.
These settings support comparisons across building types and within halls containing multiple ceilings. This study examines 64 ceilings in 15 buildings at three levels: overall geometry, local component relationships, and ensemble spatial arrangements. A group of 32 ceilings sharing continuous inclined-panel-foot references supports proportional analysis; six detailed cases support visible-component interpretation; and six ensembles comprising 41 ceilings in five buildings support spatial comparisons. Together, these analyses link overall ceiling outlines to the physical evidence of panel continuity, member articulation, and spatial configuration. The resulting architectural descriptions can inform comparisons with other layered overhead forms where comparable survey evidence is available.
2. Related Research and Research Gaps
2.1. Zaojing Morphology, Construction, and Architectural Context
The history of zaojing forms and the dates of surviving buildings require distinct evidence. Xie traces their origins and development in early China, including Han-period evidence [4]. The Northern Song construction manual Yingzao Fashi, compiled in the early twelfth century, describes a douba zaojing within its small-carpentry provisions. The 1937 volume Zaojing in the Architectural Design Reference Atlas discusses this prescription alongside historical descriptions and drawings of surviving ceilings [1]. These sources establish a historical context for ceiling forms; individual components in Fu’an require case-specific dating evidence.
Studies of surviving buildings connect ceiling form to particular uses and architectural settings. Ye and Fivet analyze construction types, visible details, and repair practices [3]; Xue documents varied ceiling forms in traditional stages [2]; and Sun et al. examine spiral zaojing ceilings using point-cloud sections [8]. Li, Jiang, and Yang’s study of the sutra library at Zhihua Temple relates axes, proportions, spatial layering, and the distinction between decorative surfaces and structural frames to historical evidence [11]. This study connects measured form to architectural context through case-specific historical evidence.
Xu and Huo qualitatively compared geometry, symmetry, layering, centrality, and hierarchy in five purposively selected cases [9]. Pei et al. analyzed the composition and expression of stacked ceiling forms in grottoes [6]. Jin compared domed mihrab chambers in medieval Chinese mosques with architectural examples from Central Asia and noted the later use of wooden caisson ceilings in some mosque settings [5]. These studies place prominent overhead forms within distinct building and religious traditions. Morphological comparison requires linking geometry to identifiable surfaces, member arrangements, and positions within each building. The present survey provides these descriptions for the Fu’an examples.
Digital studies of eastern Fujian and other traditional timber buildings offer relevant surveying methods. Yu et al. explored mobile scanning and as-built reconstruction of early modern houses in eastern Fujian [12]; Mao et al. investigated parametric heritage building information modeling (HBIM) for traditional Bai timber dwellings in Yunnan [13]; and Zhan et al. combined point clouds, BIM, and GIS to record maintenance information for historic timber buildings [14]. Applying these approaches to zaojing ceilings requires identifying visible components and the boundaries that delimit internal tapering.
Geometric models, point-cloud observations, and field photographs contribute complementary evidence. Models define or reconstruct measurement boundaries, point clouds document scanned surface geometry, and photographs support the identification of visible components and occlusions. Cross-referencing these sources supports the interpretation of local enclosures, while precise spatial correspondence requires reliable orientation registration.
2.2. From Surveyed Surfaces to Architectural Models
Reviews and guidance documents address photogrammetry and three-dimensional scanning of heritage buildings [15,16]. Historic England sets out technical requirements for scanning and survey tasks [16], while Liu et al. review TLS applications and implementation conditions in heritage recording [17,18]. HBIM studies link scanning and imaging data and historical records to editable geometric objects [19,20]. Reviews of as-built modeling [21,22] and Barazzetti’s work on parametric surfaces [23] examine how geometric objects are selected and represented from observations. Converting point clouds into models requires identifying boundaries and defining objects, with measured data recorded separately from modeling interpretations.
For Chinese timber heritage, Wang et al. developed a parametric model of the Yingxian Wooden Pagoda [24]; Gu et al. combined point clouds and construction rules to infer hidden parameters [25]; and Dong et al. generated line drawings from point clouds using architectural features [26]. Ding et al. reviewed related digital heritage research [27]. Together, these studies show how component-level modeling combines surveyed geometry with architectural knowledge to interpret incomplete or concealed boundaries. Direct observations and portions reconstructed using construction knowledge therefore have different evidential bases.
Digital reconstruction of traditional timber buildings is progressing from whole-building models to component-level representations. Zhang et al. investigated a smart modeling framework for traditional timber architecture [28], and Wu et al. examined digital representations of timber stilt-building techniques [29]. Dong et al. incorporated official Qing-dynasty roof construction rules into point-cloud semantic segmentation [30]. A dougong benchmark and studies of historic-building point-cloud segmentation further show that component recognition depends on construction knowledge, available training data, and actual scanning conditions [31,32,33].
In point-cloud-based information modeling, Pan et al. focused on converting semantic point clouds to BIM [34], and Hu et al. incorporated construction knowledge into component instance segmentation [35]. Zhang et al. and Chen et al. demonstrated multisource information organization and applications in timber-building HBIM [36,37]. Salah et al. proposed a semiautomated Scan-to-HBIM workflow based on component classification [38]. These studies emphasize the links between model objects and component semantics, alongside the distinction between scanned observations and model-derived boundaries.
Scan-data quality and completeness require separate assessment. Liu and Mamat examined registration and point-cloud accuracy checks in surveys of Chinese historic architecture [39]; Markiewicz et al. evaluated registration methods for complex heritage interiors [40]; and Varbla et al. assessed large TLS point clouds from surveying practice [41]. Accordingly, the present study records software registration metrics, local scan coverage, and model interpretations of physical boundaries separately.
2.3. Heritage Information, Reliability, and Model Use
The informational value of HBIM depends on the tasks supported by the model. López et al. [42] and Pocobelli et al. [43] reviewed heritage-modeling workflows and requirements for recording complex forms. Lovell et al. noted that some studies inadequately specify information needs and practical uses [44]. Comparisons of morphology across objects require geometric indicators to be linked to physical boundaries, observation sources, and interpretation status.
Dore and Murphy integrated HBIM with three-dimensional GIS [45]; Cursi et al. examined links to external knowledge [46]; and Poux et al. associated heritage information with point clouds [47]. Crisan et al. and Historic England further emphasized the recording of historical and material information [48,49]. These approaches provide a technical basis for linking geometry, photographs, locations, and archival sources for individual ceilings.
Maiezza discussed reporting the reliability of as-built HBIM models [50]. Bonduel et al. showed that point density, comparison direction, and occlusion affect geometric deviation analyses [51]. The London Charter, the Seville Principles, and relevant ICOMOS principles emphasize preserving sources, interpretive processes, and the grounds for interventions [52,53,54,55]. This study therefore separately codes actual point-cloud returns, fitted or completed geometry, and unresolved historical attributions.
Recent heritage information modeling research places greater emphasis on geometric uncertainty, model use, and information provenance. Sacco et al. examined HBIM uncertainty modeling for geometry that cannot be directly obtained [56], while Meriggi and Bianchini Ciampoli incorporated damage and vulnerability information into heritage-modeling workflows [57]. Doria et al. proposed evaluating HBIM and digital twins against practical use requirements [58]; Parente et al. reviewed non-geometric knowledge management for architectural heritage [59]; and Parrinello and Pettineo emphasized the classification and semantic linking of historic-building component information [60].
Specific applications also demonstrate the integration of multisource evidence. Zhuo et al. combined HBIM and multidimensional data to document historic-building characteristics in Xiamen [61], while Gao et al. addressed component information through morphological identification and construction research on traditional East Asian timber architecture [62]. These studies inform the distinction among measurement, component interpretation, and model inference adopted here. Each of the six cases is interpreted using its own field records.
2.4. Research Gaps and Contributions
Previous research has examined zaojing morphology through field surveys, construction descriptions, and point-cloud sections [3,8,9]. Studies of historical interiors and religious buildings highlight the architectural relevance of overhead layering and the definition of focal spaces [5,6,11]. Similar profiles across architectural traditions can arise from different arrangements of physical elements. For the Fu’an cases, the research gap concerns how to connect geometric indicators to comparable physical entities and to their positions within buildings. Ceilings with similar upward-tapering outlines may change slope within continuous panels or introduce a separate inner panel; similar overall depths may therefore enclose different visible arrangements. Ceilings in central positions may also differ in relative depth from their neighbors. Digital heritage methods can preserve the provenance of observations and models [47,50], but architectural comparison requires identifying which surface, component boundary, and spatial arrangement an indicator describes. The study addresses this interpretive gap using measurements with explicit physical references, local surface evidence, and mapped ceiling ensembles.
The study addresses three research questions. RQ1: How does changing the adopted lower physical measurement boundary alter the enclosure segment represented by area, height difference, and proportional indicators? RQ2: How do slope transitions within continuous panels and articulation with independent inner panels produce different forms of internal tapering? RQ3: How is overhead geometry configured across central, peripheral, and other ceiling positions within a building, and under what conditions can their actual sections be compared? The analysis combines the core corpus of 64 ceilings, the principal proportional group of 32 ceilings, six detailed cases, and six ensembles comprising 41 ceilings. Interpretation accounts for overlap among these sets and dependence among ceilings within the same building.
The interpretive framework distinguishes two kinds of overhead relationships discussed by Alexander [7]: variation between rooms and the form of an individual room enclosure. At the smaller scale of the ceiling recess, this study asks whether position within a ceiling ensemble is accompanied by a consistent relative-depth relationship and whether similar depth values describe the same local panel organization. Patterns 190 and 191 thus frame descriptive questions about recess geometry and panel organization; room height and spatial perception fall outside the measured variables.
The study links physical measurement references, visible components, and ensemble configurations through three architectural comparisons, with implications for digital heritage documentation.
First, it identifies the physical enclosure segments represented by geometric indicators. Within-ceiling comparisons in Huang and Lian Ancestral Halls show that measurements from the adopted lower opening and from the independent inner-panel foot describe the overall enclosure and an inner segment, respectively. The meaning of an area, height difference, or relative-depth value therefore depends on the physical extent being measured. This distinction underpins the principal proportional analysis within the declared R-P reference group, with component homology assessed separately (Section 5.1 and Section 5.2 and Section 6.1).
Second, it distinguishes visible forms of internal tapering that complement overall geometric indicators. Continuous panels in Wang Ancestral Hall and Mazu Temple show slope transitions at different model-derived heights. In Huang and Lian Ancestral Halls, short members and backing panels precede an independent inner-panel zone. Photographs identify visible components, measured sections document scanned surfaces, and existing conditional models locate internal references (Section 5.3 and Section 6.2).
Third, it compares ceiling ensembles in which central and adjacent positions display contrasting relative-depth relationships. The central ceiling is relatively deeper in the Zhaoying Temple rear hall, whereas the flanking ceilings are relatively deeper in the Huang Ancestral Hall front hall, within the declared R-P reference category. This comparison describes the measured geometry of the recesses within their respective spatial arrangements. Spatial position, reference extent, and locally observed panels must therefore be considered together (Section 5.4 and Section 6.3).
The associated documentation implication is to retain each ceiling’s spatial position, measurement references, and observed versus inferred boundaries in a linked record (Section 6.4). These links make recorded ceiling morphology interpretable.
3. Study Area and Research Objects
Zaojing ceilings form recessed enclosures beneath the roof structure, defining the overhead zone of traditional building interiors. The existing architectural section of Lian Ancestral Hall shows the zaojing as a local part of the hall ceiling, between the roof structure above and the occupied interior below (Figure 1a). Across the surveyed buildings, ceilings form center–periphery arrangements or follow hall bays in middle-row–side-row and center–flanking configurations (Figure 1b). These arrangements establish the positional basis for ensemble comparisons. Geometric comparisons use each ceiling’s physical measurement reference and surviving form.
The surveyed buildings are distributed across Fu’an as shown in Figure 2d. Table A1 identifies their reported historical phases, localities, and surveyed zaojing positions. The initial register contained 72 ceilings in 17 buildings. Excluding six ceilings in two churches without point-cloud data and adding one ceiling each at Mazu Temple and Nainiang Temple produced a reviewed register of 68 ceilings in 15 buildings (Figure 3 and Table 1). The reviewed buildings comprise seven ancestral halls, two Buddhist temples, one Catholic church, and five folk-religious temples. Site selection was based on access and the availability of survey records.
Reported building histories in Table A1 follow the author’s master’s thesis [10]. They include the Tang-period institutional origins of Lingyan and Shifeng temples, Ming- and Qing-period phases of several ancestral halls, and later construction or renovation phases in local religious buildings. Xidong Catholic Church is recorded as having a Chongzhen-period establishment and an 1842 rebuilding. Existing published accounts also document historical building phases at Shifeng Temple and the heritage listing of Huang Ancestral Hall [63,64]. These accounts provide historical context at the building level. The morphological analysis compares surviving forms using documented physical references and survey observations.
The core geometric corpus C2 includes ceilings with documented spatial locations and sources and complete, valid core geometric data. The core data comprise spans along two local directions (W and D), reference height difference (H), the horizontal projected area within the adopted opening boundary (A0), and the horizontal projected area of the central physical closure panel (Ac); all values must be positive. Z01-07 lacks a complete central-closure-panel area. Z05-01 was identified by the field investigator as recently built and retained for supplementary comparison. Z06-01 and Z08-01 were also identified as recent constructions and lack complete core geometry. Excluding these four ceilings from the main statistical analysis leaves 64 ceilings in 15 buildings in C2 (Table 1). Of these, 32 ceilings in eight buildings use continuous inclined-panel feet as their lower measurement reference and form the principal proportional analysis group, P32.
Wang Ancestral Hall, Zhaoying Temple, and Xidong Catholic Church contain 16, 11, and 10 ceilings in C2, respectively. Together, these buildings account for 37/64 ceilings (57.8%), more than half of the core corpus.
The sources comprise terrestrial laser scanning (TLS) point clouds and registration records, field photographs, CAD plans, and repair archives. LAS point clouds provide measured dimensions and scan returns. Photographs support identification of visible surfaces, components, and occlusions. CAD drawings are used to verify ceiling positions and help reconstruct missing boundaries, with the sources of reconstructed portions recorded. Archival records provide context for building alterations.
4. Materials and Methods
4.1. Point Clouds and Source Verification
Field data were acquired with a Trimble X7 and processed in Trimble RealWorks 12.0. LAS point clouds were exported and cropped by ceiling ID. Original coordinates, processing paths, measurement logs, and checksums were retained in linked records. CAD-assisted outlines, symmetry-based completions, and surface-intersection boundaries on unobserved sides were source-labeled and recorded separately from actual point-cloud returns. Verifiable registration records cover seven buildings in eight reports. Five multistation reports cover 5–14 stations and report overall cloud-to-cloud errors of 0.90–1.35 mm. These values describe software registration results for the relevant projects; ceiling-boundary measurement error and dimensional accuracy require separate assessment.
4.2. Physical References and Geometric Indicators
Measurement boundaries were selected from identifiable architectural entities in each ceiling. Opening area (A0) is the horizontal projected area enclosed by the adopted lower enclosure or transition boundary. Four-frame envelopes without corner deductions are classified separately as R-E; their areas represent the frame envelope. Central closure panel area (Ac) is calculated from the outer boundary of the physical panel rather than the outline of its painted decoration.
Reference height difference (H) is the difference between the representative elevations of the central closure panel and the lower physical reference. For each boundary, the representative elevation is the median of its elevation samples. Depending on the visible construction, lower-reference elevation samples are obtained from valid measured points at the panel foot or frame seat, or from fitted intersections of visible surfaces. Central-closure-panel elevation samples are obtained from measured points near its edge or from fitted-model predictions at or near the panel boundary. Local warping, scan occlusion, and model completion are recorded by ceiling ID, distinguishing measured from model-derived data.
According to the adopted lower measurement boundary, the 64 ceilings comprise 32 with continuous inclined-panel-foot references (R-P), 28 with frame or transition references (R-F), one with a projecting-member-layer reference (R-K), and three with four-frame-envelope references (R-E). Table 2 lists the six R-F subcategories and representative IDs. A reference category groups measurements taken at the same kind of physical position; component homology is assessed separately. The R- prefix distinguishes physical measurement references from visible-component codes. P32 denotes the 32 ceilings with R-P references.
For local spans W and D, E = max(W,D)/min(W,D), d = H/√A0, and c = Ac/A0 describe plan elongation, height difference normalized by an area-based length scale (hereafter relative depth), and the central closure panel area fraction, respectively (Equation (1)). Relative depth d normalizes height by an area-based length scale; its effectiveness as an allometric size correction remains unvalidated. The complement 1 − c expresses the same area relationship as c and is therefore not treated as an additional variable. Because d and c share A0, the analysis also examines unnormalized area and H [65].
C2 contains 64 ceilings in 15 buildings, with geometry derived from measured boundaries and documented model inferences. Data completeness and physical measurement reference are separate criteria that define potentially overlapping subsets. C3 was obtained from C2 by excluding 28 ceilings with existing inference/completion flags and four additional ceilings with documented edge/corner extrapolation (Z03-11 and Z09-01) or projection of an upper visible wall to represent an occluded lower boundary (Z06-02 and Z13-01), leaving 32 ceilings in 13 buildings. C4 additionally excluded the author-annotation-derived boundary of Z01-04 and the four-frame envelopes of Z09-02, Z09-03, and Z09-04, leaving 28 ceilings in 12 buildings. P32 comprises 32 ceilings in eight buildings selected by the R-P reference criterion. P32 overlaps with C3 and C4 in 16 and 15 ceilings, respectively, involving six buildings in each intersection. Z01-05 and Z04-01 were also selected for comparisons of measurement extents within each ceiling. Areas, height differences, and proportions were calculated for both the adopted opening and the confirmed inner-panel foot to examine how changing physical boundaries affects the indicators.
4.3. Associations and Proportions Within a Defined Physical Reference
For the 32 ceilings in P32, Spearman correlation analysis [66] describes three relationships: opening area versus reference height difference, plan elongation versus relative depth, and relative depth versus central closure panel area fraction. Medians of the indicators were also calculated to summarize the data for each building.
Natural-log transformations were applied to plan elongation E and relative depth d, and a logit transformation to central closure panel area fraction c. The three variables were standardized, and principal component analysis (PCA) was performed using singular value decomposition (SVD) [67] to summarize their covariation. Sensitivity to building composition was assessed by excluding all ceilings from one building at a time and repeating the analysis. Results were also compared across completeness subsets (Table 4).
4.4. Actual Section Strips and Visible Enclosure Organization
Strip sections extracted from TLS point clouds were examined alongside field photographs to analyze panel form and visible components. Preliminary exploration covered 12 ceilings in nine buildings, with four 80 mm-wide strips extracted along the existing local axes of each ceiling, yielding 48 directional strips. These observations supported case analysis and scale checks and were recorded separately from the ensemble comparisons conducted under the uniform rules in Section 4.7. Horizontal position was normalized as u, and vertical position as v = (Z − Z0)/H. Each directional strip was divided into 40 bins; a bin was valid only if it contained at least 10 actual scan points. Missing bins were left empty. The correspondence of local X/Y axes to building bay width, depth, or a common orientation remains to be independently confirmed.
Six ceilings with field photographs, actual sections, and existing models were purposively selected for detailed analysis. Geometry, section strips, component interpretations, and spatial position were linked by ceiling ID. The four strips from each ceiling are repeated observations of the same object. Component codes P, K, B, I, V, and C denote a continuous panel, short member, backing panel, independent exposed inner panel, adjacent vertical surface, and central closure panel, respectively. T denotes a slope transition within a continuous panel.
Visible enclosure organization describes how panels and components are arranged and articulated as the enclosure contracts from the outer opening toward the central closure panel within the observed extent. Each ceiling record specifies the lower physical measurement boundary, visible components and their sequence of articulation, slope changes within continuous panels or the presence of an independent inner panel, and the height and area-contraction stage of the internal reference. Interpretations are based on field observations and author-confirmed records, distinguishing confirmed presence, confirmed absence, and unresolved status. Photographs document visible components and boundaries, LAS sections describe scanned surfaces, and existing conditional models provide internal-reference positions and proportions.
Overall photographs, enlarged details, geometric models, and actual X/Y sections are presented side by side. L1/L2 identify observation locations in photographs, and D1/D2 identify the corresponding detail views; arrows indicate author-confirmed visible components. Photographs and sections are juxtaposed by case because a unique orientation correspondence between the photographs and local point-cloud axes has not been established. Section plots distinguish actual point returns, model outlines, and representative positions, leaving unscanned regions blank. Enlarged photographs and supplementary sections for the six cases are provided in Figure A1, Figure A2, Figure A3, Figure A4, Figure A5 and Figure A6.
Relative height position FH and area-contraction fraction FA describe the relative height and stage of plan-area contraction at an internal reference between the opening and central closure panel (Equation (2)).
Here, Z0 and Zb are the representative elevations of the lower measurement reference and the internal reference, respectively; H is the overall height difference from the lower reference to the central closure panel. A0, Ab, and Ac are the horizontal projected areas within the opening, internal reference, and central closure panel boundaries. FH is the height difference between the lower and internal references divided by H. FA is the area reduction from the opening to the internal reference divided by the total area reduction.
These indicators are applied to four ceilings with existing internal-reference models. Wang Ancestral Hall Z03-11 and Mazu Temple Z11-02 use a continuous-panel slope transition T, whereas Huang Ancestral Hall Z01-05 and Lian Ancestral Hall Z04-01 use the foot of an independent inner panel I. The two reference types are interpreted separately (Section 5.3). The existing irregular outline of the Huang inner panel is retained. FH, FA, and the representative elevation of the internal reference are calculated from the adopted conditional models; some boundary segments have not been independently determined from point-cloud data.
To examine strip-width sensitivity, narrower strips of 40 mm and 1% of the short span (0.01b, where b = min(W,D)) were extracted within the original 80 mm strips. The horizontal extent of each strip was divided into 40 bins, with at least 10 actual scan points required per valid bin. Bins with a narrow elevation spread were identified by requiring the difference between the 90th and 10th percentiles of normalized elevation to be no greater than 0.12 (q90(v) − q10(v) ≤ 0.12). Median elevations were compared only in bins with valid data at the widths being compared. Missing bins remained empty, and reference height differences and existing T/I models were held constant (Table A3).
4.5. Spatial Grouping and Within-Ensemble Comparisons
Spatial positions and ensembles were defined from building plans and continuous ceiling extents independently of area, height difference, and other geometric indicators. Central and peripheral ceilings were distinguished at the stage and front hall of Wang Ancestral Hall and the rear hall of Zhaoying Temple; middle-row and side-row ceilings at Xidong Catholic Church; and central and flanking ceilings in the three-ceiling arrangements of the Huang front hall and Shifeng main hall (Figure 9). Screening all 68 registered ceilings yielded six ensembles comprising 41 ceilings in five buildings for spatial comparison.
For each ensemble, medians of reference height difference H, relative depth d, and central closure panel area fraction c were calculated for the two positional groups, together with their ratios. Ranges and the smallest separation between groups were used to describe differences. Ensembles sharing a reference category were compared within their respective reference extents. Cross-reference ensembles were used to describe existing configurations in which spatial position and measurement extent vary together.
After completeness screening, within-ensemble ratios were calculated only when both positional groups retained valid ceilings. The six ensembles comprising 41 ceilings were analyzed descriptively, accounting for dependence among ceilings in the same building [68].
In interpreting these ensemble comparisons, central and middle-row positions are spatial labels derived from the plan, whereas H and d describe the geometry within each adopted zaojing reference. The direction of the central-to-adjacent ratio is examined within the same physical-reference category where possible. Mixed-reference ensembles remain descriptive because positional differences and measurement extents vary together. This distinction keeps the ensemble comparison at the scale of the measured recesses while drawing on Alexander’s room-scale questions [7].
4.6. Mathematical Relationships and Idealized Tapering Comparisons
The analysis first examines geometric relationships arising from indicator definitions. Let L and b be the long and short opening spans along the local axes, H the reference height difference, and A0 the adopted opening area. Defining short-span-normalized height κ = H/b and area fill ratio q = A0/(Lb) gives the relationship between plan elongation E and relative depth d in Equation (3).
With q and κ fixed, d decreases as E increases. The negative association between E and d therefore partly reflects the geometric relationship imposed by their definitions. To examine this contribution, Spearman correlations of E with d and with κ were calculated separately by physical reference. Logarithmic decomposition and within-building centering were used to examine the algebraic contributions to the indicators and differences between buildings.
An idealized model was then defined using concentric, geometrically similar plan outlines that taper linearly with height: horizontal dimensions decrease linearly from the lower opening to the central closure panel while plan shapes remain similar. Under this assumption, the internal reference’s area-contraction fraction FA predicts its relative height FH through Equation (4).
Here, c is the central closure panel area divided by the opening area. Positions in the existing internal-reference models were compared with the idealized predictions to describe departures in height allocation from the assumed geometry. T denotes a continuous-panel slope transition, and I an independent inner-panel foot; they are interpreted separately. The adopted outlines were also examined along 360 directions from the opening-area centroid to assess their conformity to the assumption of concentric, similar outlines. These comparisons evaluate specified geometric assumptions; measurement accuracy requires independent validation.
Three models were compared: fixed short-span-normalized height κ, fixed idealized taper inclination tanθ, and fixed relative depth d. For each building omitted in turn, model parameters were calibrated using the remaining buildings, and predictions were evaluated for the omitted building. Calibration used the median of the within-building medians of each logarithmic parameter. Performance was assessed using the root-mean-square error of log(d), with buildings weighted equally.
4.7. Panel-Section Comparisons Within Ensembles
Point-cloud sections for the 11 ceilings in the front hall of Wang Ancestral Hall were extracted using uniform rules. Four directional sections were extracted for each ceiling along the positive and negative local axes. Strip widths were 1%, 2%, and 4% of the short span b, and 80 mm; 0.02b was the primary strip width. Along each direction, the horizontal distance from the adopted opening to the central closure panel boundary was normalized to u = 0–1 and divided into 40 equal-width bins. Each bin was represented by its horizontal midpoint and the median normalized point-cloud elevation v = (Z − Z0)/H.
A valid bin required at least 10 actual scan points. An eligible direction required at least 36 valid bins overall and at least six valid bins in each of two windows: the opening-side window, u = 0.20–0.40, and the center-side window, u = 0.60–0.85. Points were retained between Z0 − 0.12 m and Zc + 0.12 m, where Z0 and Zc are the representative elevations of the lower reference and central closure panel.
The two windows were selected from the preliminary analysis of the central ceiling’s slope changes and held fixed for subsequent comparisons. An ordinary least-squares line with an intercept and equal weights for all valid bins was fitted separately to the representative points of valid bins in each window. Because the fit used normalized coordinates, its slope was converted to a physical panel inclination using the actual reference height difference and horizontal distance (Equation (5)).
Here, θ is panel inclination (°), m is the fitted slope in normalized coordinates, H is the reference height difference, and R is the horizontal distance from the opening to the central closure panel boundary along that direction. The inclination difference is the opening-side inclination (u = 0.20–0.40) minus the center-side inclination (u = 0.60–0.85). The ceiling-level result is the median difference across eligible directions. Direction S3 of Wang Z03-11 was excluded because of foreground occlusion and mixed surfaces. Point-cloud coverage and component identity were checked separately (Section 5.4); the fixed windows define the surface segments used in local descriptive comparisons.
The same rules were applied to three ceilings in the Huang front hall and nine in the Zhaoying rear hall. Both ensembles have explicit positional records and use continuous inclined-panel-foot references (R-P). Four directions and four widths for each of the 12 ceilings yielded 192 extraction records, all representing repeated observations of those ceilings. Physical section and bin lengths were recorded alongside point-cloud coverage to identify the architectural surfaces represented at corresponding normalized positions. Local segments meeting the coverage criteria were used for inclination comparisons; the identities of complete panels, backing panels, and short members were assessed separately from component evidence.
To test whether the fixed windows cover a target slope transition, four directional sections were extracted from Mazu Z11-02 and Zhaoying Z15-05 using the same rules. Both use R-P references. Horizontal position was normalized as u = (r0 − r)/(r0 − rc), where r0 and rc are the adopted opening-boundary and central-closure-boundary positions along that direction, and r is the horizontal projected position of a scan point. Thus, u = 0 corresponds to the opening and u = 1 to the central closure boundary. The existing model-derived T position in Z11-02 was transformed into this coordinate system to assess its location relative to the fixed windows and actual point-cloud coverage. The windows retained their preset extents.
5. Results
5.1. Geometric Characteristics and Proportional Relationships
The 64 ceilings in 15 buildings were measured using different physical references. The median opening area is 13.141 m² and the median reference height difference is 0.800 m, with ranges of 1.458–34.375 m² and 0.136–2.690 m, respectively (Table 3). The 32 ceilings in P32, drawn from eight buildings, share continuous inclined-panel-foot references. Their opening area and reference height difference are strongly positively correlated (Spearman ρ = 0.824; Figure 4).
Within P32, plan elongation E is negatively correlated with relative depth d (ρ = −0.765). The correlation between E and short-span-normalized height H/b is −0.473. After transformation and standardization of the three proportional indicators, the first principal component explains 84.4% of sample variance. Removing Zhaoying Temple reduces this proportion to 62.2% and the E–H/b correlation to −0.017 (Figure 4b–d and Table 4). Indicator covariation therefore depends on both normalization and building composition.
In leave-one-building-out comparisons for P32, the root-mean-square errors of log(d), with equal weighting across buildings, are 0.400 for the fixed-d baseline, 0.308 for the fixed-κ model, and 0.279 for the fixed idealized taper-inclination model. Under this evaluation rule, the latter two models have lower prediction errors, indicating that basic geometric relationships help describe variation in relative depth within P32.
5.2. Geometric Differences Between Physical Measurement Extents
Different enclosure boundaries within the same ceiling delimit different architectural segments. Huang Z01-05 and Lian Z04-01 were compared using the adopted lower opening and the confirmed inner-panel foot as alternative lower measurement references, while holding the central closure panel area and representative elevation constant. Table 5 reports area, reference height difference, and proportions for the two extents. Figure 5 shows three projected outlines constructed from existing model vertices: the adopted opening, internal reference, and central closure panel.
For Huang Z01-05, the area of the measured extent decreases from 12.595 to 4.652 m² and the reference height difference from 1.127 to 0.592 m. Relative depth d decreases from 0.318 to 0.274, while central closure panel area fraction c increases from 0.084 to 0.228. For Lian Z04-01, area decreases from 17.227 to 7.987 m², H from 1.902 to 0.636 m, and d from 0.458 to 0.225; c increases from 0.205 to 0.442. In both ceilings, the inner-panel extent has a lower relative depth and a larger central closure panel area fraction, although the magnitudes of change differ.
The candidate internal boundary of Chen Z05-02 provides an auxiliary comparison of measurement extents. Relative depth d is 0.225 for the adopted extent and 0.107 for the candidate extent, while c is 0.221 and 0.425, respectively (Table 5).
5.3. Visible Components and Internal Tapering
The relative depths d of the six detailed cases range from 0.314 to 0.458, all above the core-corpus median of 0.245. Photographs, actual point-cloud sections, and existing models show different ways in which these relatively deep ceilings contract from the outer opening toward the central closure panel (Figure 6, Figure 7 and Figure 8 and Table 6).
Wang Z03-11 and Mazu Z11-02 both taper through continuous panels P toward central closure panels C, with internal slope transitions T. In the existing models, the relative transition heights FH are 0.739 and 0.255, respectively, locating the transitions at different relative elevations (Figure 6a,b and 7). T describes an inclination change within a continuous panel, whereas I identifies an independent inner panel.
Huang Z01-05 and Lian Z04-01 both show short members K superimposed on backing panels B, followed inward by an independent inner panel I and central closure panel C. The model-derived relative heights of their inner-panel feet are 0.475 and 0.666, respectively. Xidong Z10-01 progresses from outer panels through short members and backing panels to a curved independent inner panel I and central closure panel C. In Shifeng Z09-03, the short-member/backing-panel zone directly adjoins C, with no independent inner panel between them (Figure 6c–f and Table 6). Actual X/Y strips for the latter two ceilings are shown in Figure 8. Xidong shows returns from outer inclined surfaces and the member zone; Shifeng has greater directional variation in return extent and occlusion.
Under the idealized tapering assumption in Equation (4), the predicted relative T heights for Wang Z03-11 and Mazu Z11-02 are 0.382 and 0.124. The model-derived T positions exceed the corresponding idealized predictions by 0.357 and 0.131 in normalized height, respectively. Predicted relative I-foot heights for Huang Z01-05 and Lian Z04-01 are 0.553 and 0.583, with model-minus-prediction differences of −0.078 and +0.083. The T-reference cases thus place the transitions higher than predicted by the idealized model, whereas the I-reference cases show deviations in opposite directions.
Cases with similar overall indicators can have different visible component sequences. Three illustrative pairs have similar values of a single indicator: Wang Z03-11 and Huang Z01-05 have d values of 0.314 and 0.318; Xidong Z10-01 and Mazu Z11-02 have opening areas of 22.932 and 22.410 m²; and Shifeng Z09-03 and Lian Z04-01 have reference height differences of 2.007 and 1.902 m.
These comparisons illustrate differences among ceilings with similar values of one overall geometric indicator in panel continuity, component arrangement, and tapering position. Field photographs support component identification, measured point-cloud sections document the scanned surfaces, and conditional models provide estimates of internal-reference positions. Together, these sources relate overall proportions to slope changes within continuous panels, articulation between outer member zones and independent inner panels, and height allocation among enclosure segments.
5.4. Spatial Arrangements and Panel-Section Comparisons
Spatial comparisons comprise 41 ceilings in six ensembles from five buildings. Figure 9 shows their arrangements and adopted boundaries; Table 7 reports geometric ratios and physical references. Within-ensemble comparisons use a common reference category for the Wang stage, Zhaoying rear hall, Huang front hall, and Shifeng main hall. The Wang front hall and Xidong Catholic Church are cross-reference configurations.
Central–peripheral relative-depth relationships differ between ensembles. In the Zhaoying rear hall, central-ceiling d is 2.687 times the peripheral median. In the Huang front hall, which also uses R-P references, the central-to-flanking d ratio is 0.663, showing the opposite relationship. Corresponding ratios for the Wang stage and Shifeng main hall are 2.930 and 1.368 (Table 7 and Figure 10). Central and adjacent ceilings therefore have different relative-depth relationships across these buildings.
The two R-P ensembles thus configure relative recess depth differently across central and adjacent positions.
In the Wang front hall, the central-to-peripheral median d ratio is 2.101 for all ten peripheral ceilings. Restricting the peripheral group to four ceilings with nearly equal spans (E ≤ 1.10) reduces the ratio to 1.159. The change shows the sensitivity of the ratio to plan-shape composition in the peripheral group. Because the central and peripheral ceilings use different physical references, the ratio describes their existing spatial configuration.
Among the 11 ceilings in the Wang front hall, three directions in central ceiling Z03-11 meet the uniform coverage criteria. The inclination differences between the two windows range from 37.3° to 39.9°, with a median of 39.7°. Four peripheral ceilings provide eight eligible directions with differences from −0.3° to +0.7°; the remaining six peripheral ceilings have no directions meeting the primary rule (Table 8 and Figure 11). Within these valid observation segments, the central ceiling shows a pronounced slope transition, whereas the sampled local panel segments in some peripheral ceilings are approximately straight. The fixed windows delimit this local comparison; describing full-panel form requires observations beyond them.
Applying the same rules to three ceilings in the Huang front hall and nine in the Zhaoying rear hall identifies Zhaoying central ceiling Z15-05 as the only ceiling with eligible directions; all four directions qualify (Table 9). Its inclination differences between windows range from −0.66° to −0.06°, describing approximately straight local panel segments. None of the other 11 ceilings has an eligible direction; some wider strips include panel-foot or platform transition zones. Figure 12 compares Wang Z03-11 and Zhaoying Z15-05, whose d values are 0.314 and 0.316. Their sampled panel segments show different slope changes within the windows. The ceilings belong to different buildings and use different lower physical references; the curves compare the forms of the surface segments covered by the windows.
Mazu Z11-02 and Zhaoying Z15-05 both use R-P references. All eight directions satisfy the numerical coverage criteria in the fixed-window check. The existing T position in Mazu is u = 0.120–0.131, before the opening-side window begins at u = 0.20 and therefore outside both windows. The approximately straight profiles characterize the sampled segments within the windows. Section comparisons require both sufficient point coverage and spatial coverage of the target feature.
6. Discussion
6.1. Physical References and Geometric Interpretation
An architectural comparison begins by specifying the physical extent represented by each measurement. In Huang Z01-05 and Lian Z04-01, the adopted opening encompasses both the outer member zone and the inner-panel zone, whereas the independent inner-panel foot isolates the inner enclosure (Table 5 and Figure 5). Shifting the lower reference therefore changes the architectural segment described by area and height difference. Identifying the lower boundary and central closure allows differences in measurement extent to be distinguished from differences in visible form.
Proportional relationships depend on both geometric definitions and sample composition, even when the measured entities are explicit. The 32 ceilings in P32 share the declared continuous inclined-panel-foot reference category, although corner details and the homology of boundary points require separate assessment. Within this group, opening area and H have a positive rank association (ρ = 0.824), and the first principal component of the selected proportions explains 84.4% of the variance and only 62.2% after Zhaoying Temple is omitted (Table 4 and Figure 4). Moreover, d = H/√A₀ and E = max(W,D)/min(W,D) are partly related through their definitions and plan shape. Reference-based measurement therefore identifies the ceiling segments available for comparison. Interpreting their proportional relationships requires attention to indicator definitions, building composition, and local component evidence.
6.2. Visible Internal Organization and Panel Articulation
Similar overall proportions can correspond to different visible panel-and-member arrangements because area and height differences summarize its boundary extents without encoding the sequence of intervening surfaces and components. Wang Ancestral Hall Z03-11 and Huang Ancestral Hall Z01-05 have similar relative depths, d = 0.314 and 0.318. Wang contracts inward through a continuous panel whose inclination changes, whereas Huang has a short-member and backing-panel zone followed by an independent inner panel and central closure (Figure 6 and Figure 7 and Table 6). Their lower physical references also differ, R-F-contact and R-K, so the numerical resemblance is illustrative of distinct morphologies. Local panel and member evidence identifies whether the enclosure is continuous or divided into distinct component zones.
Among the continuous-panel cases, the modeled location of a slope transition changes how the total rise is distributed. For Wang Z03-11 and Mazu Temple Z11-02, the model-derived relative transition heights FH are 0.739 and 0.255, while their corresponding area-contraction fractions FA are 0.480 and 0.173 (Figure 7). In Wang, a larger share of the measured rise occurs before the higher transition; in Mazu, more of the rise is allocated to the inner portion after a lower transition. The two continuous-panel arrangements thus distribute height differently. Their FH and FA values locate the adopted transitions within existing conditional models; independent verification is needed for transition boundaries inferred from those models.
Independent inner panels introduce another architectural distinction. In Huang Z01-05 and Lian Z04-01, a visible inner-panel foot separates the outer short-member and backing-panel zone from an inward panel zone. Their modeled area-contraction fractions at this boundary are close (FA = 0.689 and 0.675), although the corresponding relative heights differ (FH = 0.475 and 0.666). Similar stages of plan contraction therefore occur at different stages of vertical rise. Xidong Z10-01 also shows an independent inner panel within the observed sequence, while Shifeng Z09-03 has no such panel between its short-member/backing-panel zone and central closure in the observed extent (Figure 6 and Table 6). These cases illustrate distinct component arrangements within the observed extents.
The morphological implication is that overall proportion and internal articulation provide complementary descriptions. Similar values of an overall indicator can describe enclosures with different panel continuity, component boundaries, and height allocations. This explains why drawings, photographs, actual TLS sections, and conditional internal-reference models must be interpreted together. It also extends the discussion of spatial layering in historic interiors [11] to a specific, inspectable element: the recessed ceiling and the visible sequence by which it approaches its central closure. Recording these distinctions alongside opening outlines and relative-depth values makes the internal organization of existing architectural forms legible.
6.3. Ensemble Position and Overhead Spatial Order
The position of a zaojing within a hall and its measured depth are different architectural attributes. Across six ensembles comprising 41 ceilings in five buildings, central, peripheral, middle-row, and flanking positions were defined from building plans before comparing the geometric indicators. Two ensembles using R-P references show contrasting relationships. In the Zhaoying Temple rear hall, the central-to-peripheral median ratio is 2.687 for relative depth d and 6.097 for H; in the Huang Ancestral Hall front hall, the corresponding central-to-flanking ratios are 0.663 and 0.919 (Table 7 and Figure 9 and Figure 10). The central ceiling is relatively deeper in the former, but the flanking ceilings are relatively deeper in the latter. The surveyed ensembles therefore exhibit opposite depth relationships between central and adjacent recesses.
The architectural significance of position emerges through its relationship to the surrounding ceiling arrangement and the measured physical extent. In the Wang front hall, the central-to-peripheral median d ratio is 2.101 across all ten peripheral ceilings but falls to 1.159 when only four nearly equal-span peripheral ceilings are retained. These positions also use different lower-reference subcategories. Xidong Catholic Church likewise compares middle-row and side-row configurations across different references (Table 7). The observed ratios describe the combined positional and geometric characteristics of each existing arrangement.
Local sections add a further distinction between positional geometry and panel organization. In the Wang front hall, three eligible directions in central ceiling Z03-11 show inclination differences of 37.3°–39.9° between the fixed windows; eight eligible directions from four peripheral ceilings show differences between −0.3° and +0.7° (Figure 11 and Table 8). Six other peripheral ceilings do not meet the primary coverage rule. Similarly, Wang Z03-11 and Zhaoying Z15-05 have almost identical relative depths, 0.314 and 0.316, but their eligible local sections differ in slope organization (Figure 12). Their differing lower physical references and sampled surface extents define the scope of this descriptive comparison. The Mazu case further shows that sufficient scan coverage can still miss a model-derived transition located outside the chosen windows (Table A2). Architectural comparison thus requires both adequate point counts and coverage of the relevant surface.
Alexander and his coauthors’ Patterns 190 and 191 [7] connect variation in room height with the shape of indoor enclosures. At the smaller scale examined here, the ensemble comparisons address how relative recess depth is distributed across ceiling positions, while the component comparisons address how individual recesses acquire their form. This provides a connection between the two levels of architectural description. The measurements describe recess geometry and visible panel configurations rather than floor-to-ceiling room height or occupants’ perceptions.
Figure 13 synthesizes the three architectural comparisons. Physical measurement references define the enclosure segment represented by each indicator; continuous-panel slope changes and independent inner panels distinguish visible internal organization; and comparisons between positional groups describe configurations across a hall. Together, these observations relate depth and plan position to the visible organization of the surveyed forms. The diagram synthesizes the geometric, photographic, and conditional-model evidence used in the comparison.
6.4. Implications for Digital Heritage Documentation and Conservation
An interpretable digital record of a zaojing links its geometry to physical references, visible components, and spatial position. For each ceiling, the building and ceiling ID should connect its position in the hall to the adopted lower reference, the central closure, the associated area and height indicators, and the observed sequence of panels and members. Continuous-panel transitions (T) and independent inner-panel feet (I) need distinct descriptions because they mark different architectural entities. Section 6.1, Section 6.2 and Section 6.3 identify the information needed to preserve these distinctions in the record.
The source of each recorded boundary is equally important. Actual TLS returns support sampled geometry, field photographs support visible component identity, and existing conditional models provide selected internal positions. Missing or occluded edges completed by fitting, symmetry, or CAD assistance retain their model-derived status. For example, the T positions in Wang and Mazu and the I-foot positions in Huang and Lian serve as descriptive references whose modeled elevations and outlines must remain linked to their sources (Figure 7). Recording this distinction accords with work on point-cloud-based heritage information and model reliability [47,50], as well as the documentation principles that emphasize source records and interpretive transparency [52,53,54,55].
For conservation surveys, the approach identifies the component boundaries and source records needed to compare existing ceiling forms. A record of a ceiling with a short-member/backing-panel zone and a separate inner panel should retain those component boundaries instead of reducing them to one idealized taper. Comparing a newly surveyed ceiling with an earlier model also requires knowing whether each outline represents an observed panel foot, a lower frame, or a modeled completion. Descriptions that retain these sources could guide future comparisons with other recessed or layered ceilings, provided that their material systems and measurement references are independently documented. Its application to repair decisions requires independent dimensional verification, structural assessment, and evidence of component dates.
6.5. Limitations and Interpretive Scope
The 64-ceiling corpus was assembled from accessible buildings with usable survey records, rather than a random or exhaustive regional inventory. Wang Ancestral Hall, Zhaoying Temple, and Xidong Catholic Church contribute 37 of the 64 ceilings (57.8%); the ten church ceilings belong to one building. The principal R-P proportional group comprises 32 ceilings from eight buildings, and some associations change when an entire building is excluded. Ensemble comparisons are also dependent within buildings. These data document morphological contrasts among the sampled buildings; estimating regional frequencies or independent effects of religious use or spatial position requires a different sampling design.
Measured returns, photographs, and conditional models have different evidential roles. Some opening and internal boundaries include fitted, symmetry-based, or CAD-assisted portions, and independent repeat measurements were unavailable to establish absolute boundary accuracy. The six detailed cases were purposively selected; eligible local profiles cover only specified directions and windows, while several peripheral ceilings have no eligible directions under the primary rule. Visible members and panel surfaces do not disclose hidden joints, construction sequences, or the age of individual components. The study also did not measure floor-to-ceiling room height, user perception, acoustics, historical intention, or the performance of conservation interventions. Its architectural interpretations therefore apply to the documented present configurations and stated observation extents. Common construction origins and cross-cultural transmission require separate historical evidence.
7. Conclusions
This study examines 64 zaojing ceilings in 15 Fu’an buildings to explain differences in visible overhead form. The approach connects the physical extents represented by geometric measurements, visible panel and member articulation, and the arrangement of ceilings within halls. These complementary levels support the comparison of existing enclosures beyond an opening outline or a single relative-depth value.
The interpretation of a geometric indicator depends on the physical segment measured. In Huang Z01-05 and Lian Z04-01, measurements from the lower opening encompass outer and inner zones, while those from the independent inner-panel foot describe only an inner segment (Table 5 and Figure 5). Within the 32 R-P ceilings, opening area and reference height difference show a positive association (Spearman ρ = 0.824), but their proportional covariation changes when Zhaoying Temple is removed (PC1 variance explained, 84.4% to 62.2%). Consistent physical references and consideration of building composition are therefore essential to interpreting proportional relationships.
Overall resemblance can conceal different internal organization. Wang Z03-11 and Huang Z01-05 have similar relative depths (d = 0.314 and 0.318), but Wang’s visible enclosure changes slope within a continuous panel, whereas Huang introduces an independent inner panel after a short-member and backing-panel zone. Wang and Mazu locate their slope transitions at different model-derived relative heights, while Huang and Lian place their independent inner-panel feet at different fractions of the total rise. The overall recess and the arrangement of its visible surfaces therefore require complementary descriptions. Interpreted within their respective reference extents and conditional boundaries, these pairs illustrate alternative visible morphologies.
Spatial centrality is associated with different relative-depth relationships across the surveyed ensembles. Across six ensembles (41 ceilings in five buildings), the central-to-peripheral median relative-depth ratio is 2.687 in the Zhaoying rear hall but 0.663 for the center versus flanking ceilings in the Huang front hall; both use the declared R-P reference category (Table 7). These opposite arrangements show that the positional role of a ceiling must be read against adjacent enclosures. Alexander’s discussion of ceiling-height variety [7] helps frame the question of spatial differentiation, but these measurements concern recess height within a zaojing, not room-level ceiling height. The ratios describe the geometry of the existing overhead arrangements.
For digital heritage recording, the practical implication is to retain the lower and central physical boundaries, visible slope changes and independent panel edges, and the position of each ceiling among its neighbors. Geometric interpretations should remain traceable to photographs and TLS returns, with measured surfaces distinguished from CAD-assisted or conditional-model completions and with missing section coverage retained explicitly. Keeping each interpretation linked to its source preserves the architectural distinctions among visible enclosure forms.
Understanding an overhead feature requires both its overall geometry and the arrangement of its visible components. Recesses with similar overall indicators may contain different panels and members, and the central ceiling in a hall need not have the greatest relative depth. These findings frame a question for comparisons with other layered or recessed ceilings: which physical elements define the enclosure, and how is it configured relative to neighboring overhead features? Such comparisons require measured evidence from the relevant architectural settings.For the surveyed buildings, linking measurements to their architectural evidence provides a basis for documenting and comparing visible zaojing morphology.
Author Contributions
Conceptualization, Z.D. and D.L.; methodology, Y.M. and H.Z.; resources (equipment provision), Y.M. and H.Z.; validation, D.L. and J.C.; formal analysis, Z.D. and J.C.; investigation, Z.D. and H.Z.; data curation, Z.D.; writing—original draft preparation, Z.D.; writing—review and editing, D.L. and Y.M. All authors have read and agreed to the published version of the manuscript.
Funding
This research received no external funding.
Data Availability Statement
The research dataset supporting this study is publicly available in Science Data Bank (ScienceDB) at https://doi.org/10.57760/sciencedb.018dg. Access to any supporting materials not included in the published repository record may be requested from the corresponding authors, subject to applicable permissions and restrictions.
Conflicts of Interest
The authors declare no conflicts of interest.
Appendix A
Appendix A.1
Figure A1, Figure A2, Figure A3, Figure A4, Figure A5 and Figure A6 provide enlarged photographs and local point-cloud sections for the six detailed cases. Table A1 records building histories and surveyed ceiling positions; Table A2 and Table A3 report fixed-window coverage and strip-width sensitivity checks, respectively.
Figure A1.
Photograph and actual sections of Wang Z03-11.
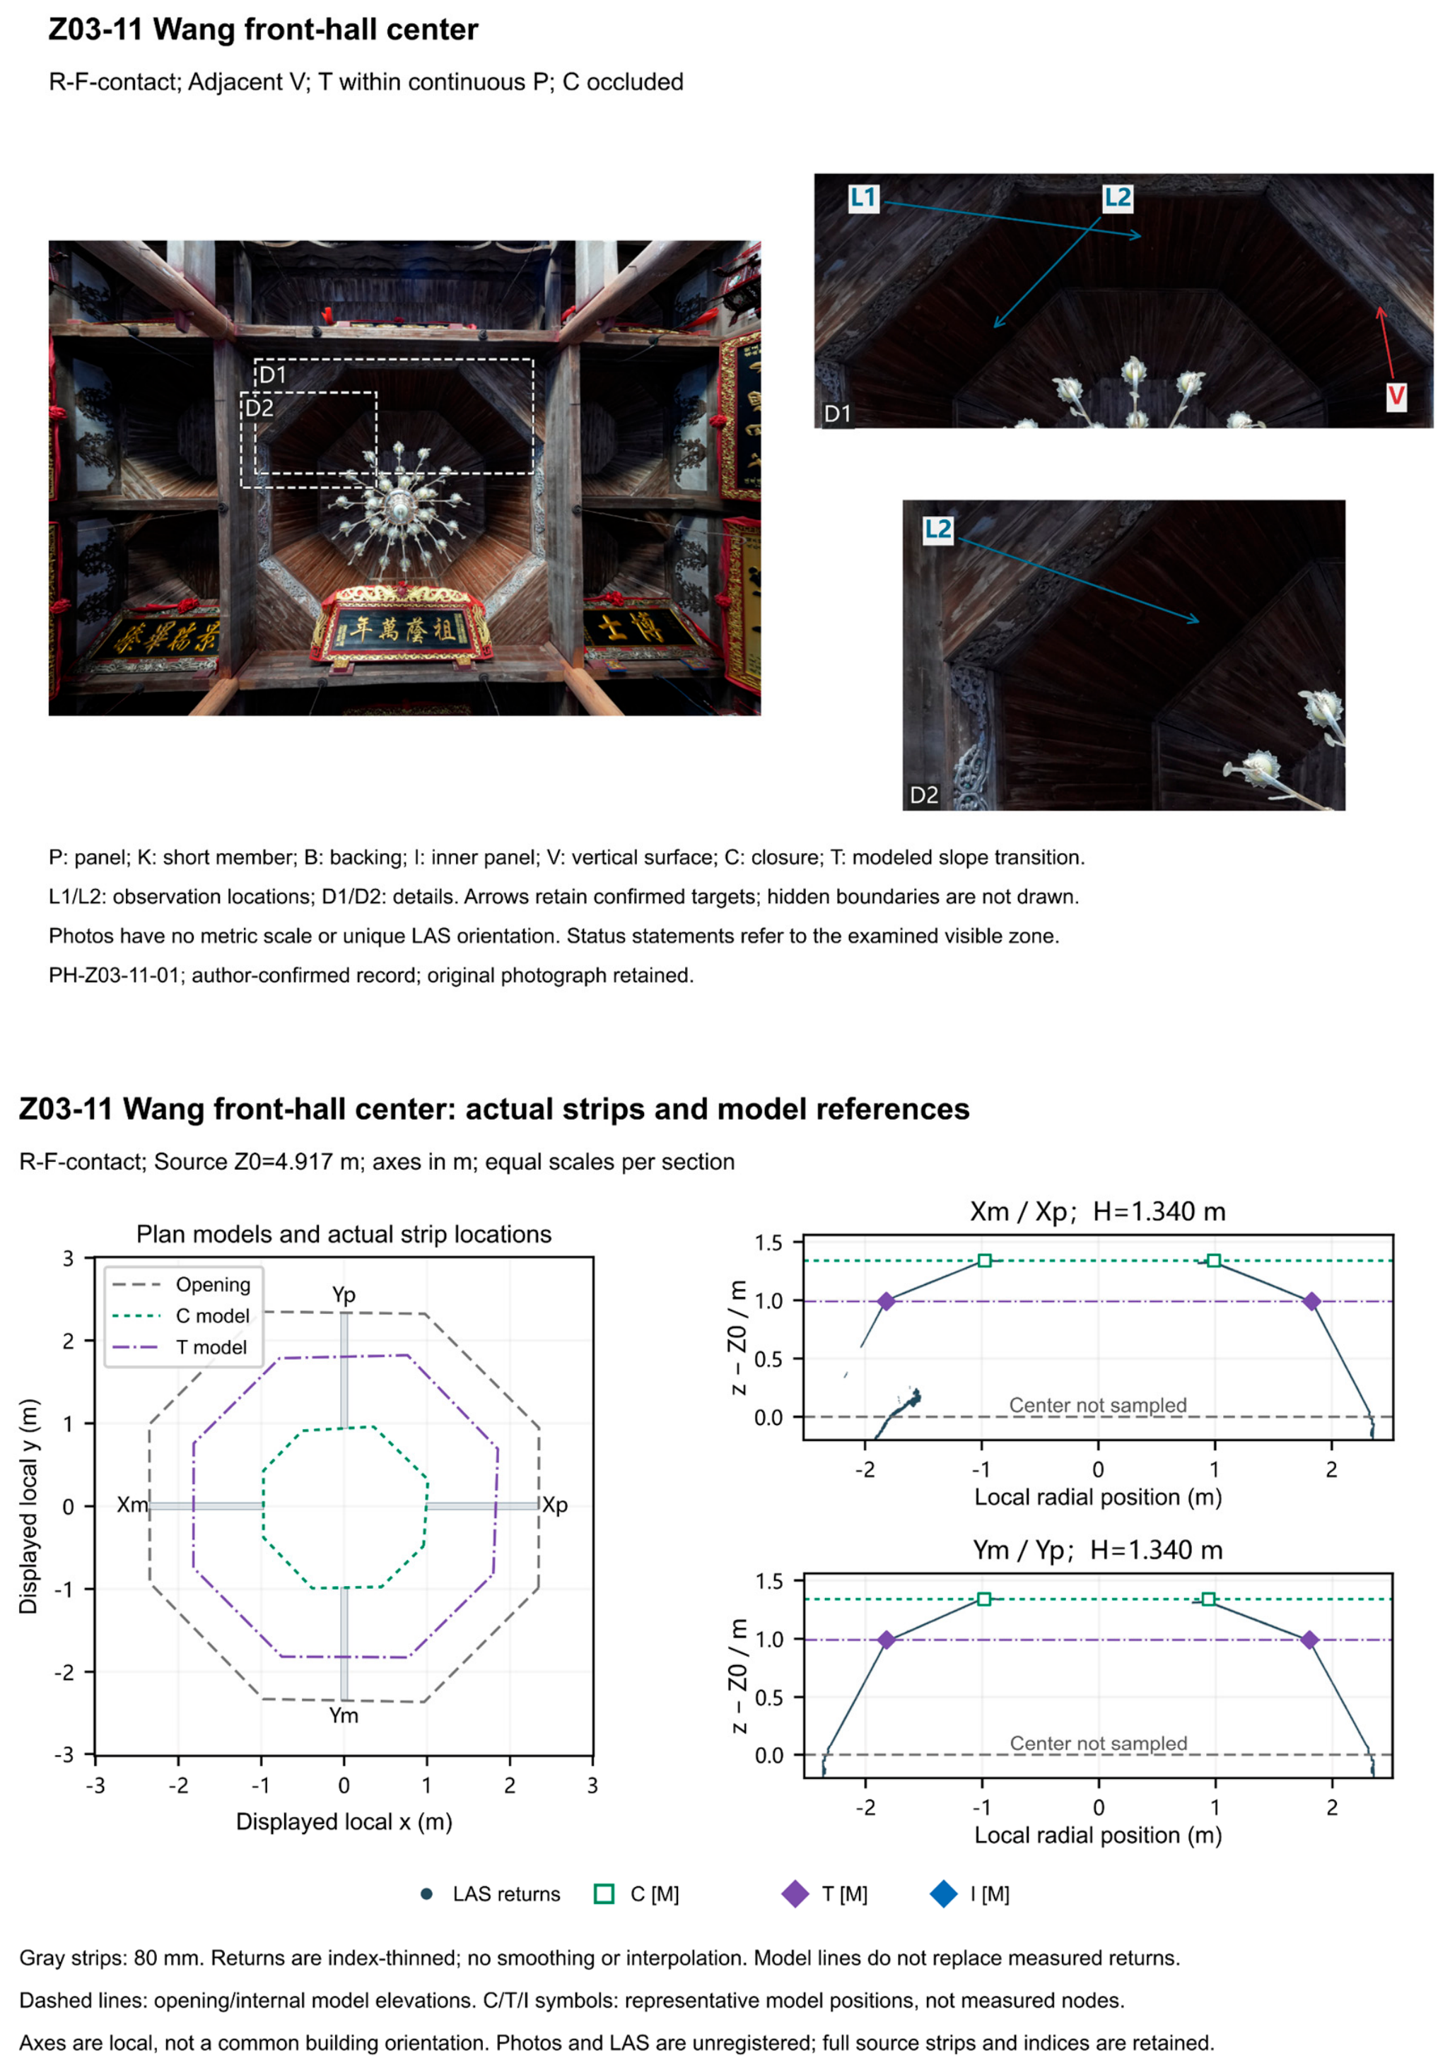

Table A1.
Historical phases, locations, and surveyed zaojing positions of the 15 buildings in Fu’an.
Table A1.
Historical phases, locations, and surveyed zaojing positions of the 15 buildings in Fu’an.
| ID | Building name | Architectural type | Reported foundation period | Reported rebuilding or renovation period | Locality | Surveyed zaojing locations |
|---|---|---|---|---|---|---|
| Z01 | Huang Ancestral Hall | Ancestral hall | Late Song dynasty | Wanli reign, Ming dynasty | Yangzhong community, Yangtou subdistrict | Stage; front hall; rear hall. |
| Z02 | Xue Ancestral Hall | Ancestral hall | Qing dynasty | Qing dynasty | Gaocen hamlet, Xitan town† | Stage; front hall; rear hall. |
| Z03 | Wang Ancestral Hall | Ancestral hall | Ming dynasty | Qing dynasty | Guilin village, Muyun township | Stage ensemble; front-hall ensemble. |
| Z04 | Lian Ancestral Hall | Ancestral hall | Wanli reign, Ming dynasty | Xianfeng reign, Qing dynasty | Qinxi village, Chengyang town | Rear hall. |
| Z05 | Chen Ancestral Hall | Ancestral hall | Jiaqing reign, Qing dynasty | Jiaqing reign, Qing dynasty | Shangjiao Road, Liancun village, Xitan town | Front hall; rear hall. |
| Z06 | Chen Branch Ancestral Hall | Ancestral hall | Jiaqing reign, Qing dynasty | Jiaqing reign, Qing dynasty | Shangjiao Road, Liancun village, Xitan town | Stage; rear hall. |
| Z07 | Chen Senior-Branch Ancestral Hall | Ancestral hall | Qing dynasty | Qing dynasty | Liancun village, Xitan town | Stage; rear hall. |
| Z08 | Lingyan Temple | Buddhist temple | Xiantong reign, Tang dynasty | Early Republican period | Lingyan Mountain, Liancun village, Xitan town | Front hall; main hall. |
| Z09 | Shifeng Temple | Buddhist temple | Jingfu reign, Tang dynasty | Yongle reign, Ming dynasty | Louxia village, Xibing town | Front hall; main hall. |
| Z10 | Xidong Catholic Church | Catholic church | Chongzhen reign, Ming dynasty | 1842 | Xidong village, Chengyang town | Four in the central bay; three in each side bay. |
| Z11 | Mazu Temple | Folk-religious temple | Qianlong reign, Qing dynasty | Qianlong reign, Qing dynasty | Liancun village, Xitan town | Stage; rear hall. |
| Z12 | Nainiang Temple | Folk-religious temple | Qianlong reign, Qing dynasty | Qianlong reign, Qing dynasty | Nixia village, Gantang town | Stage; rear hall. |
| Z13 | Qisheng Temple | Folk-religious temple | Jiaqing reign, Qing dynasty | Jiaqing reign, Qing dynasty | Qisheng Road, Lianchi area, Chengnan subdistrict | Principal hall. |
| Z14 | Qingyun Temple | Folk-religious temple | Kangxi reign, Qing dynasty | Kangxi reign, Qing dynasty | Nanhu community, Chengnan subdistrict | Entrance hall; rear hall. |
| Z15 | Zhaoying Temple | Folk-religious temple | Mid-Qing dynasty | Mid-Qing dynasty | Daliu village, Luojiang subdistrict | Front hall; middle hall; rear-hall ensemble. |
Table A2.
Fixed-window coverage in Mazu Z11-02 and Zhaoying Z15-05.
| Ceiling ID/direction | Valid bins/40 | Opening-side window: bins | Center-side window: bins | T position u |
|---|---|---|---|---|
| Z11-02/S1 | 40 | 8 | 10 | 0.123 |
| Z11-02/S2 | 39 | 8 | 10 | 0.131 |
| Z11-02/S3 | 40 | 8 | 10 | 0.123 |
| Z11-02/S4 | 40 | 8 | 10 | 0.120 |
| Z15-05/S1 | 40 | 8 | 10 | None |
| Z15-05/S2 | 40 | 8 | 10 | None |
| Z15-05/S3 | 40 | 8 | 10 | None |
| Z15-05/S4 | 40 | 8 | 10 | None |
All eight directions meet the 0.02b primary rule. Mazu’s T positions, u = 0.120–0.131, precede the opening-side window at 0.20–0.40; neither window crosses T.
Table A3.
Strip-width checks for the six detailed cases.
| Ceiling ID | 80 mm/b (%) | Valid bins (80 mm/40 mm/1%b) | Largest directional P95 difference (mm): 40/80 mm | Largest directional P95 difference (mm): 1%b/80 mm |
|---|---|---|---|---|
| Z03-11 | 1.70 | 151/151/151 | 3.4 | 3.2 |
| Z11-02 | 1.54 | 159/152/158 | 6.8 | 4.1 |
| Z01-05 | 2.04 | 155/153/153 | 108.0 | 108.1 |
| Z10-01 | 1.52 | 160/160/160 | 23.9 | 13.4 |
| Z09-03 | 1.60 | 151/147/148 | 287.9 | 287.2 |
| Z04-01 | 1.74 | 160/160/160 | 82.2 | 73.1 |
Of 960 bins, 936, 923, and 930 meet the 10-point requirement for the 80 mm, 40 mm, and 1%b strips, respectively.
References
- Liang, S.; Liu, Z. Zaojing. In Architectural Design Reference Atlas; Society for the Study of Chinese Architecture: Beiping, China, 1937; Vol. 10, pp. 1–3. (In Chinese) [Google Scholar]
- Xue, L. The caisson decorative art for the traditional Chinese drama stage. Zhuangshi 2008, No. 11, 115–117. (In Chinese) [Google Scholar]
- Ye, J.; Fivet, C. The zaojing: review of a unique wooden construction typology. Constr. Hist., Author version; 2020, 35(1), 23–49. [Google Scholar]
- Xie, J. From earth to heaven: the origin and development of zaojing in early China. Arq. Archit. Res. Q. 2019, 23, 349–363. [Google Scholar] [CrossRef]
- Jin, S. The Transformation of Domes in Medieval Chinese Mosques: From Immigrant Muslims to Local Followers. Open Archaeol. 2023, 9, 20220319. [Google Scholar] [CrossRef]
- Pei, Q.; Shen, X.; Zhang, Q. The building system and modeling evolution characteristics from the stacked patios to the pingqi of the grotto. J. Asian Archit. Build. Eng. 2025, 24(5), 3517–3541. [Google Scholar] [CrossRef]
- Alexander, C.; Ishikawa, S.; Silverstein, M.; Jacobson, M.; Fiksdahl-King, I.; Angel, S. A Pattern Language: Towns, Buildings, Construction; Oxford University Press: New York, NY, USA, 1977. [Google Scholar]
- Sun, K.; Pan, B.; Liu, J. A preliminary study on the diffusion and evolution of spiral caissons in architectural heritages along the southeastern coast of China. City Built Environ. 2026, 4, 10. [Google Scholar] [CrossRef]
- Xu, Z.; Huo, K. Formal aesthetic organization and architectural representation of caisson ceilings in traditional Chinese architecture. J. Chin. Archit. Urban. 2026, 026100017. [Google Scholar] [CrossRef]
- Ding, Z. Study on the Decoration of Zaojing in Traditional Buildings of Fu’an. Master’s Thesis, Fujian University of Technology, Fuzhou, China, 2025. (In Chinese) [Google Scholar]
- Li, L.; Jiang, Y.; Yang, Z. The sutra library of Zhihua Temple in Beijing and the logic of spatial construction. J. Archit. Hist. 2022, No. 2, 42–62. (In Chinese) [Google Scholar]
- Yu, J.; Jiang, X.; Xu, F.; Chen, H.; Wu, W.; Qiu, R.; Ma, W.; Liu, Y.; Wu, G. Research on the Reconstruction Method of Old Houses in Mindong, Republic of China, Based on a Wearable Mobile Scanning System. Buildings 2024, 14, 1766. [Google Scholar] [CrossRef]
- Mao, Y.; Lu, H.; Xiao, Y.; Lai, Z.; Huang, L. A Parametric HBIM Approach for Preservation of Bai Ethnic Traditional Timber Dwellings in Yunnan, China. Buildings 2024, 14, 1960. [Google Scholar] [CrossRef]
- Zhan, J.; Zhang, T.; Huang, J.; Li, M. Maintenance Approaches Using 3D Scanning Point Cloud Visualization, and BIM+ Data Management: A Case Study of Dahei Mountain Buildings. Buildings 2024, 14, 2649. [Google Scholar] [CrossRef]
- Remondino, F. Heritage Recording and 3D Modeling with Photogrammetry and 3D Scanning. Remote Sens. 2011, 3, 1104–1138. [Google Scholar] [CrossRef]
- Historic England. 3D Laser Scanning for Heritage: Advice and Guidance on the Use of Laser Scanning in Archaeology and Architecture, 3rd ed.; Historic England: Swindon, UK, 2018; Available online: https://historicengland.org.uk/images-books/publications/3d-laser-scanning-heritage/ (accessed on 15 October 2026).
- Liu, J.; Azhar, S.; Willkens, D.; Li, B. Static Terrestrial Laser Scanning (TLS) for Heritage Building Information Modeling (HBIM): A Systematic Review. Virtual Worlds 2023, 2, 90–114. [Google Scholar] [CrossRef]
- Liu, J.; Willkens, D.; Gentry, R. Developing a Practice-Based Guide to Terrestrial Laser Scanning (TLS) for Heritage Documentation. Heritage 2025, 8, 313. [Google Scholar] [CrossRef]
- Murphy, M.; McGovern, E.; Pavia, S. Historic building information modelling (HBIM). Struct. Surv. 2009, 27, 311–327. [Google Scholar] [CrossRef]
- Murphy, M.; McGovern, E.; Pavia, S. Historic Building Information Modelling—Adding intelligence to laser and image based surveys of European classical architecture. ISPRS J. Photogramm. Remote Sens. 2013, 76, 89–102. [Google Scholar] [CrossRef]
- Volk, R.; Stengel, J.; Schultmann, F. Building Information Modeling (BIM) for existing buildings—Literature review and future needs. Autom. Constr. 2014, 38, 109–127. [Google Scholar] [CrossRef]
- Tang, P.; Huber, D.; Akinci, B.; Lipman, R.; Lytle, A. Automatic reconstruction of as-built building information models from laser-scanned point clouds: A review of related techniques. Autom. Constr. 2010, 19, 829–843. [Google Scholar] [CrossRef]
- Barazzetti, L. Parametric as-built model generation of complex shapes from point clouds. Adv. Eng. Inform. 2016, 30, 298–311. [Google Scholar] [CrossRef]
- Wang, D.; Li, S.Y.; Liu, R.; Hu, J.; Wang, A. Parametric Modeling and Column Grid Analysis of the Sakyamuni Pagoda at Fogong Temple: Insights into the Yingxian Wooden Pagoda. Buildings 2024, 14(8), 2464. [Google Scholar] [CrossRef]
- Gu, B.; Dong, Y.; Zhao, H.; Zhang, J.; Guo, Z.; Hou, M. Knowledge-Driven Inference of Hidden Structural Parameters in Ming–Qing Large Woodwork by Integrating Point Clouds and Traditional Construction Rules. Buildings 2026, 16(19), 3871. [Google Scholar] [CrossRef]
- Dong, S.; Wu, D.; Kong, W.; Liu, W.; Xia, N. Research on Intelligent Generation of Line Drawings from Point Clouds for Ancient Architectural Heritage. Buildings 2025, 15, 3341. [Google Scholar] [CrossRef]
- Ding, J.; Liang, M.; Chen, W. Integration of BIM and Chinese Architectural Heritage: A Bibliometric Analysis Research. Buildings 2023, 13, 593. [Google Scholar] [CrossRef]
- Zhang, J.; Wang, Z.; Wang, W. Application of Smart Modelling Framework for Traditional Wooden Architecture. Buildings 2024, 14, 2130. [Google Scholar] [CrossRef]
- Wu, J.; Chi, F.; Wei, Y.; Zhao, Y.; Huang, S.; Xu, H. An Intelligent Modeling Method for Protecting and Inheriting the Construction Techniques of Wooden Stilt Buildings. Buildings 2025, 15, 61. [Google Scholar] [CrossRef]
- Dong, Y.; Li, Y.; Hou, M. The Point Cloud Semantic Segmentation Method for the Ming and Qing Dynasties’ Official-Style Architecture Roof Considering the Construction Regulations. ISPRS Int. J. Geo-Inf. 2022, 11, 214. [Google Scholar] [CrossRef]
- Zhou, C.; Dong, Y.; Hou, M. DGPCD: A Benchmark for Typical Official-Style Dougong in Ancient Chinese Wooden Architecture. Herit. Sci. 2024, 12, 201. [Google Scholar] [CrossRef]
- Zhou, C.; Dong, Y.; Hou, M.; Ji, Y.; Wen, C. MP-DGCNN for the Semantic Segmentation of Chinese Ancient Building Point Clouds. Herit. Sci. 2024, 12, 249. [Google Scholar] [CrossRef]
- Zhao, J.; Yu, H.; Hua, X.; Wang, X.; Yang, J.; Zhao, J.; Xu, A. Semantic Segmentation of Point Clouds of Ancient Buildings Based on Weak Supervision. Herit. Sci. 2024, 12, 232. [Google Scholar] [CrossRef]
- Pan, X.; Lin, Q.; Ye, S.; Li, L.; Guo, L.; Harmon, B. Deep Learning Based Approaches from Semantic Point Clouds to Semantic BIM Models for Heritage Digital Twin. Herit. Sci. 2024, 12, 65. [Google Scholar] [CrossRef]
- Hu, C.; Yang, Y.; Xia, G.; Luo, D.; Xie, Y.; You, Z. Individual Segmentation Method of Ancient Architectural Components Based on Point Cloud and Construction Techniques. Herit. Sci. 2025, 13, 657. [Google Scholar] [CrossRef]
- Zhang, J.; Zhang, L.; Zhao, W.; Lu, Y.; Wang, X.; Yao, S.; Lyu, H. HBIM for the Protection and Management: A Case Study of Chinese Timber Architectural Heritage. Herit. Sci. 2025, 13, 399. [Google Scholar] [CrossRef]
- Chen, L.; Dai, C.; Zhou, M.; Lu, J. Development and Application of an HBIM Method for Timber Structures Integrated with Digital Technologies. Herit. Sci. 2025, 13, 381. [Google Scholar] [CrossRef]
- Salah, R.; Géczy, N.; Ajtayné Károlyfi, K. Architectural Heritage Digitization: A Classification-Driven Semi-Automated Scan-to-HBIM Workflow. Buildings 2026, 16, 21. [Google Scholar] [CrossRef]
- Liu, S.; Mamat, M.J.B. Application of 3D Laser Scanning Technology for Mapping and Accuracy Assessment of the Point Cloud Model for the Great Achievement Palace Heritage Building. Herit. Sci. 2024, 12, 153. [Google Scholar] [CrossRef]
- Markiewicz, J.; Kot, P.; Markiewicz, Ł.; Muradov, M. The Evaluation of Hand-Crafted and Learned-Based Features in Terrestrial Laser Scanning–Structure-from-Motion (TLS–SfM) Indoor Point Cloud Registration: The Case Study of Cultural Heritage Objects and Public Interiors. Herit. Sci. 2023, 11, 254. [Google Scholar] [CrossRef]
- Varbla, S.; Puust, R.; Ellmann, A. Quality Evaluation of Sizeable Surveying-Industry-Produced Terrestrial Laser Scanning Point Clouds That Facilitate Building Information Modeling—A Case Study of Seven Point Clouds. Buildings 2024, 14, 3371. [Google Scholar] [CrossRef]
- López, F.J.; Lerones, P.M.; Llamas, J.; Gómez-García-Bermejo, J.; Zalama, E. A Review of Heritage Building Information Modeling (H-BIM). Multimodal Technol. Interact. 2018, 2, 21. [Google Scholar] [CrossRef]
- Pocobelli, D.P.; Boehm, J.; Bryan, P.; Still, J.; Grau-Bové, J. BIM for heritage science: a review. Herit. Sci. 2018, 6, 30. [Google Scholar] [CrossRef]
- Lovell, L.J.; Davies, R.J.; Hunt, D.V.L. The Application of Historic Building Information Modelling (HBIM) to Cultural Heritage: A Review. Heritage 2023, 6, 6691–6717. [Google Scholar] [CrossRef]
- Dore, C.; Murphy, M. Integration of Historic Building Information Modeling (HBIM) and 3D GIS for Recording and Managing Cultural Heritage Sites. In Proceedings of the 2012 18th International Conference on Virtual Systems and Multimedia, Milan, Italy, 2–5 September 2012; pp. 369–376. [Google Scholar]
- Cursi, S.; Martinelli, L.; Paraciani, N.; Calcerano, F.; Gigliarelli, E. Linking external knowledge to heritage BIM. Autom. Constr. 2022, 141, 104444. [Google Scholar] [CrossRef]
- Poux, F.; Billen, R.; Kasprzyk, J.-P.; Lefebvre, P.-H.; Hallot, P. A Built Heritage Information System Based on Point Cloud Data: HIS-PC. ISPRS Int. J. Geo-Inf. 2020, 9(10), 588. [Google Scholar] [CrossRef]
- Crisan, A.; Pepe, M.; Costantino, D.; Herban, S. From 3D Point Cloud to an Intelligent Model Set for Cultural Heritage Conservation. Heritage 2024, 7, 1419–1437. [Google Scholar] [CrossRef]
- Historic England. BIM for Heritage: Developing a Historic Building Information Model; Historic England: Swindon, UK, 2017; Available online: https://historicengland.org.uk/images-books/publications/bim-for-heritage/heag-154-bim-for-heritage/ (accessed on 15 October 2026).
- Maiezza, P. As-Built Reliability in Architectural HBIM Modeling. Int. Arch. Photogramm. Remote Sens. Spat. Inf. Sci. 2019, XLII-2/W9, 461–466. [Google Scholar] [CrossRef]
- Bonduel, M.; Bassier, M.; Vergauwen, M.; Pauwels, P.; Klein, R. Scan-to-BIM output validation: Towards a standardized geometric quality assessment of building information models based on point clouds. Int. Arch. Photogramm. Remote Sens. Spat. Inf. Sci. 2017, XLII-2/W8, 45–52. [Google Scholar] [CrossRef]
- The London Charter. The London Charter for the Computer-based Visualisation of Cultural Heritage, Version 2.1. 7 February 2009. Available online: https://www.london-charter.org/media/files/london_charter_2_1_en.pdf (accessed on 15 October 2026).
- ICOMOS. Principles of Seville: International Principles of Virtual Archaeology. Ratified by the 19th ICOMOS General Assembly, New Delhi, India; Available online: https://icomos.es/wp-content/uploads/2020/06/Seville-Principles-IN-ES-FR.pdf (accessed on 15 October 2026).
- ICOMOS. Principles for the Recording of Monuments, Groups of Buildings and Sites. Adopted by the 11th General Assembly, Sofia, October 1996; Available online: https://www.icomos.org/images/DOCUMENTS/Charters/archives-eng.pdf.
- ICOMOS. Principles for the Conservation of Wooden Built Heritage. Adopted by the 19th General Assembly, New Delhi, 15 December 2017; Available online: https://www.icomos.org/images/DOCUMENTS/Charters/GA2017_6-3-4_WoodPrinciples_EN_adopted-15122017.pdf.
- Sacco, G.L.S.; Ridella, M.; Calderini, C. A Parametric HBIM Approach to Geometric Uncertainty Modelling for Heritage Bridge Structural Analysis. Buildings 2026, 16, 3054. [Google Scholar] [CrossRef]
- Meriggi, P.; Bianchini Ciampoli, L. V-HBIM: A Vulnerability-Oriented Heritage BIM Workflow for Cultural Heritage Conservation. Buildings 2026, 16, 2570. [Google Scholar] [CrossRef]
- Doria, E.; Moussallieh, M.; Morandotti, M. A Use-Centred Evaluation Framework for HBIM and Heritage Digital Twins. Heritage 2026, 9, 309. [Google Scholar] [CrossRef]
- Parente, M.; Bruno, N.; Ottoni, F. HBIM and Information Management for Knowledge and Conservation of Architectural Heritage: A Review. Heritage 2025, 8, 306. [Google Scholar] [CrossRef]
- Parrinello, S.; Pettineo, A. Databases and Information Models for Semantic and Evolutionary Analysis in Fortified Cultural Heritage. Heritage 2025, 8, 29. [Google Scholar] [CrossRef]
- Zhuo, L.; Zhang, J.; Hong, X. Cultural Heritage Characteristics and Damage Analysis Based on Multidimensional Data Fusion and HBIM—Taking the Former Residence of HSBC Bank in Xiamen, China as an Example. Herit. Sci. 2024, 12, 128. [Google Scholar] [CrossRef]
- Gao, C.; Zhao, G.; Gao, S.; Du, S.; Kim, E.; Shen, T. Advancing Architectural Heritage: Precision Decoding of East Asian Timber Structures from Tang Dynasty to Traditional Japan. Herit. Sci. 2024, 12, 219. [Google Scholar] [CrossRef]
- Peng, H.; Sun, Q. Shifeng Temple in Fu’an. Fujian Daily. 16 May 2023. Available online: https://fjnews.fjsen.com/wap/2023-05/16/content_31315870.htm (accessed on 3 November 2026).
- State Council of the People’s Republic of China. Eighth Batch of Major Historical and Cultural Sites Protected at the National Level, 2019; entry 328 (8-0328-3-131), Huang Ancestral Hall, Fu’an. Available online: https://www.gov.cn/gbgl/75e17ff291dd418f8f758d508087cd8b/files/6250670fc770465787b85d705d4b12f9.pdf (accessed on 3 November 2026).
- Kronmal, R.A. Spurious Correlation and the Fallacy of the Ratio Standard Revisited. J. R. Stat. Soc. Ser. A Stat. Soc. 1993, 156, 379–392. [Google Scholar] [CrossRef]
- Spearman, C. The Proof and Measurement of Association between Two Things. Am. J. Psychol. 1904, 15, 72–101. [Google Scholar] [CrossRef]
- Jolliffe, I.T.; Cadima, J. Principal component analysis: a review and recent developments. Philos. Trans. R. Soc. A 2016, 374, 20150202. [Google Scholar] [CrossRef]
- Hurlbert, S.H. Pseudoreplication and the Design of Ecological Field Experiments. Ecol. Monogr. 1984, 54, 187–211. [Google Scholar] [CrossRef]
Figure 1.
Architectural location and spatial arrangements of traditional zaojing ceilings in the surveyed buildings. (a) Existing architectural sections of Lian Ancestral Hall. (b) Schematic plans of the center–periphery arrangement in the rear hall of Zhaoying Temple, the middle-row–side-row arrangement in Xidong Catholic Church, and the center–flanking arrangement in the front hall of Huang Ancestral Hall.
Figure 1.
Architectural location and spatial arrangements of traditional zaojing ceilings in the surveyed buildings. (a) Existing architectural sections of Lian Ancestral Hall. (b) Schematic plans of the center–periphery arrangement in the rear hall of Zhaoying Temple, the middle-row–side-row arrangement in Xidong Catholic Church, and the center–flanking arrangement in the front hall of Huang Ancestral Hall.
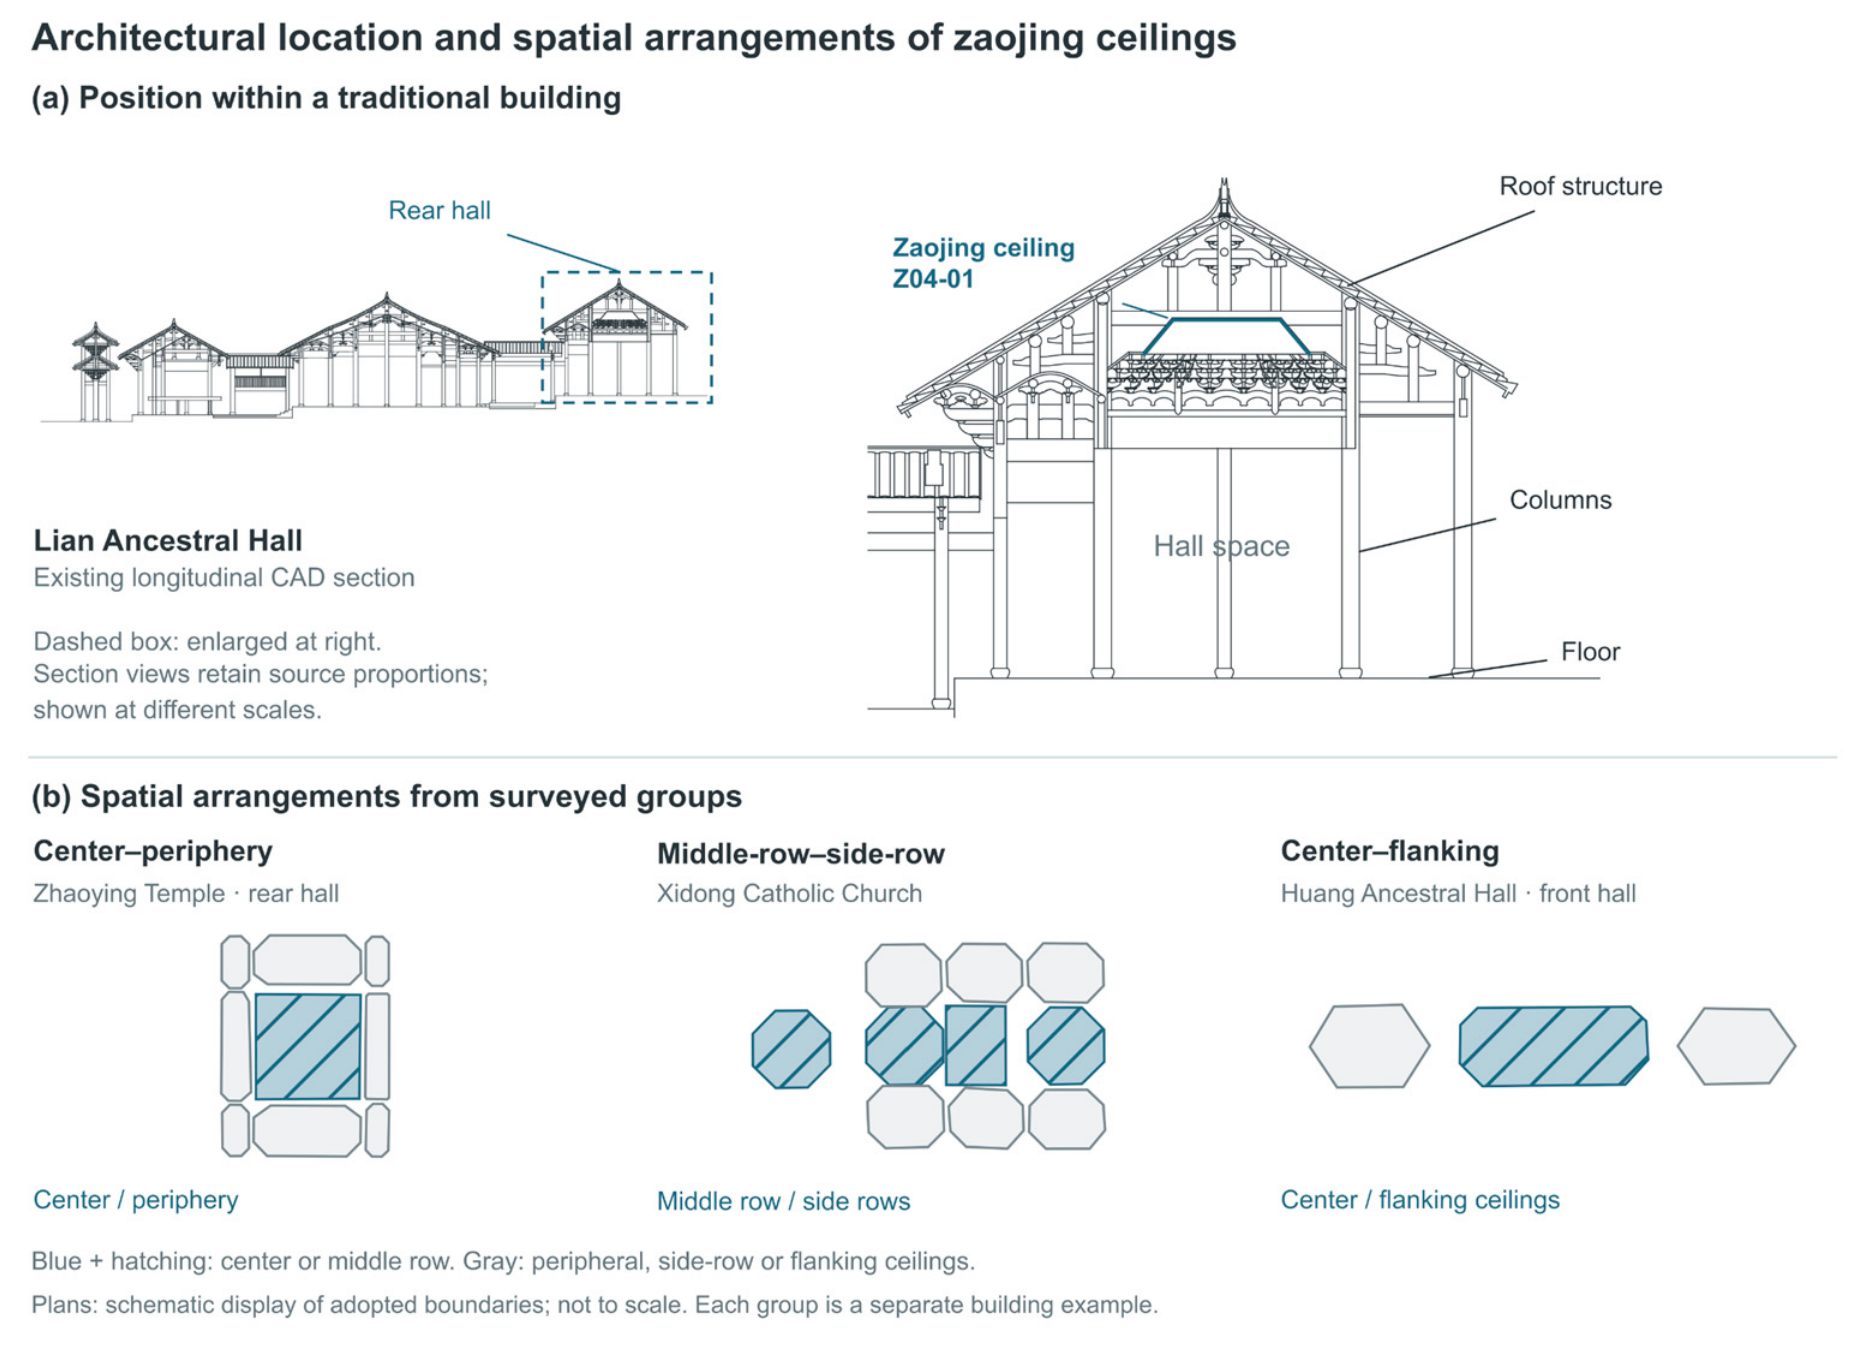
Figure 2.
Geographical distribution of the surveyed traditional buildings in Fu’an, China. (a) Fujian Province within China; (b) Ningde within Fujian; (c) Fu’an within Ningde; (d) surveyed buildings in Fu’an.
Figure 2.
Geographical distribution of the surveyed traditional buildings in Fu’an, China. (a) Fujian Province within China; (b) Ningde within Fujian; (c) Fu’an within Ningde; (d) surveyed buildings in Fu’an.
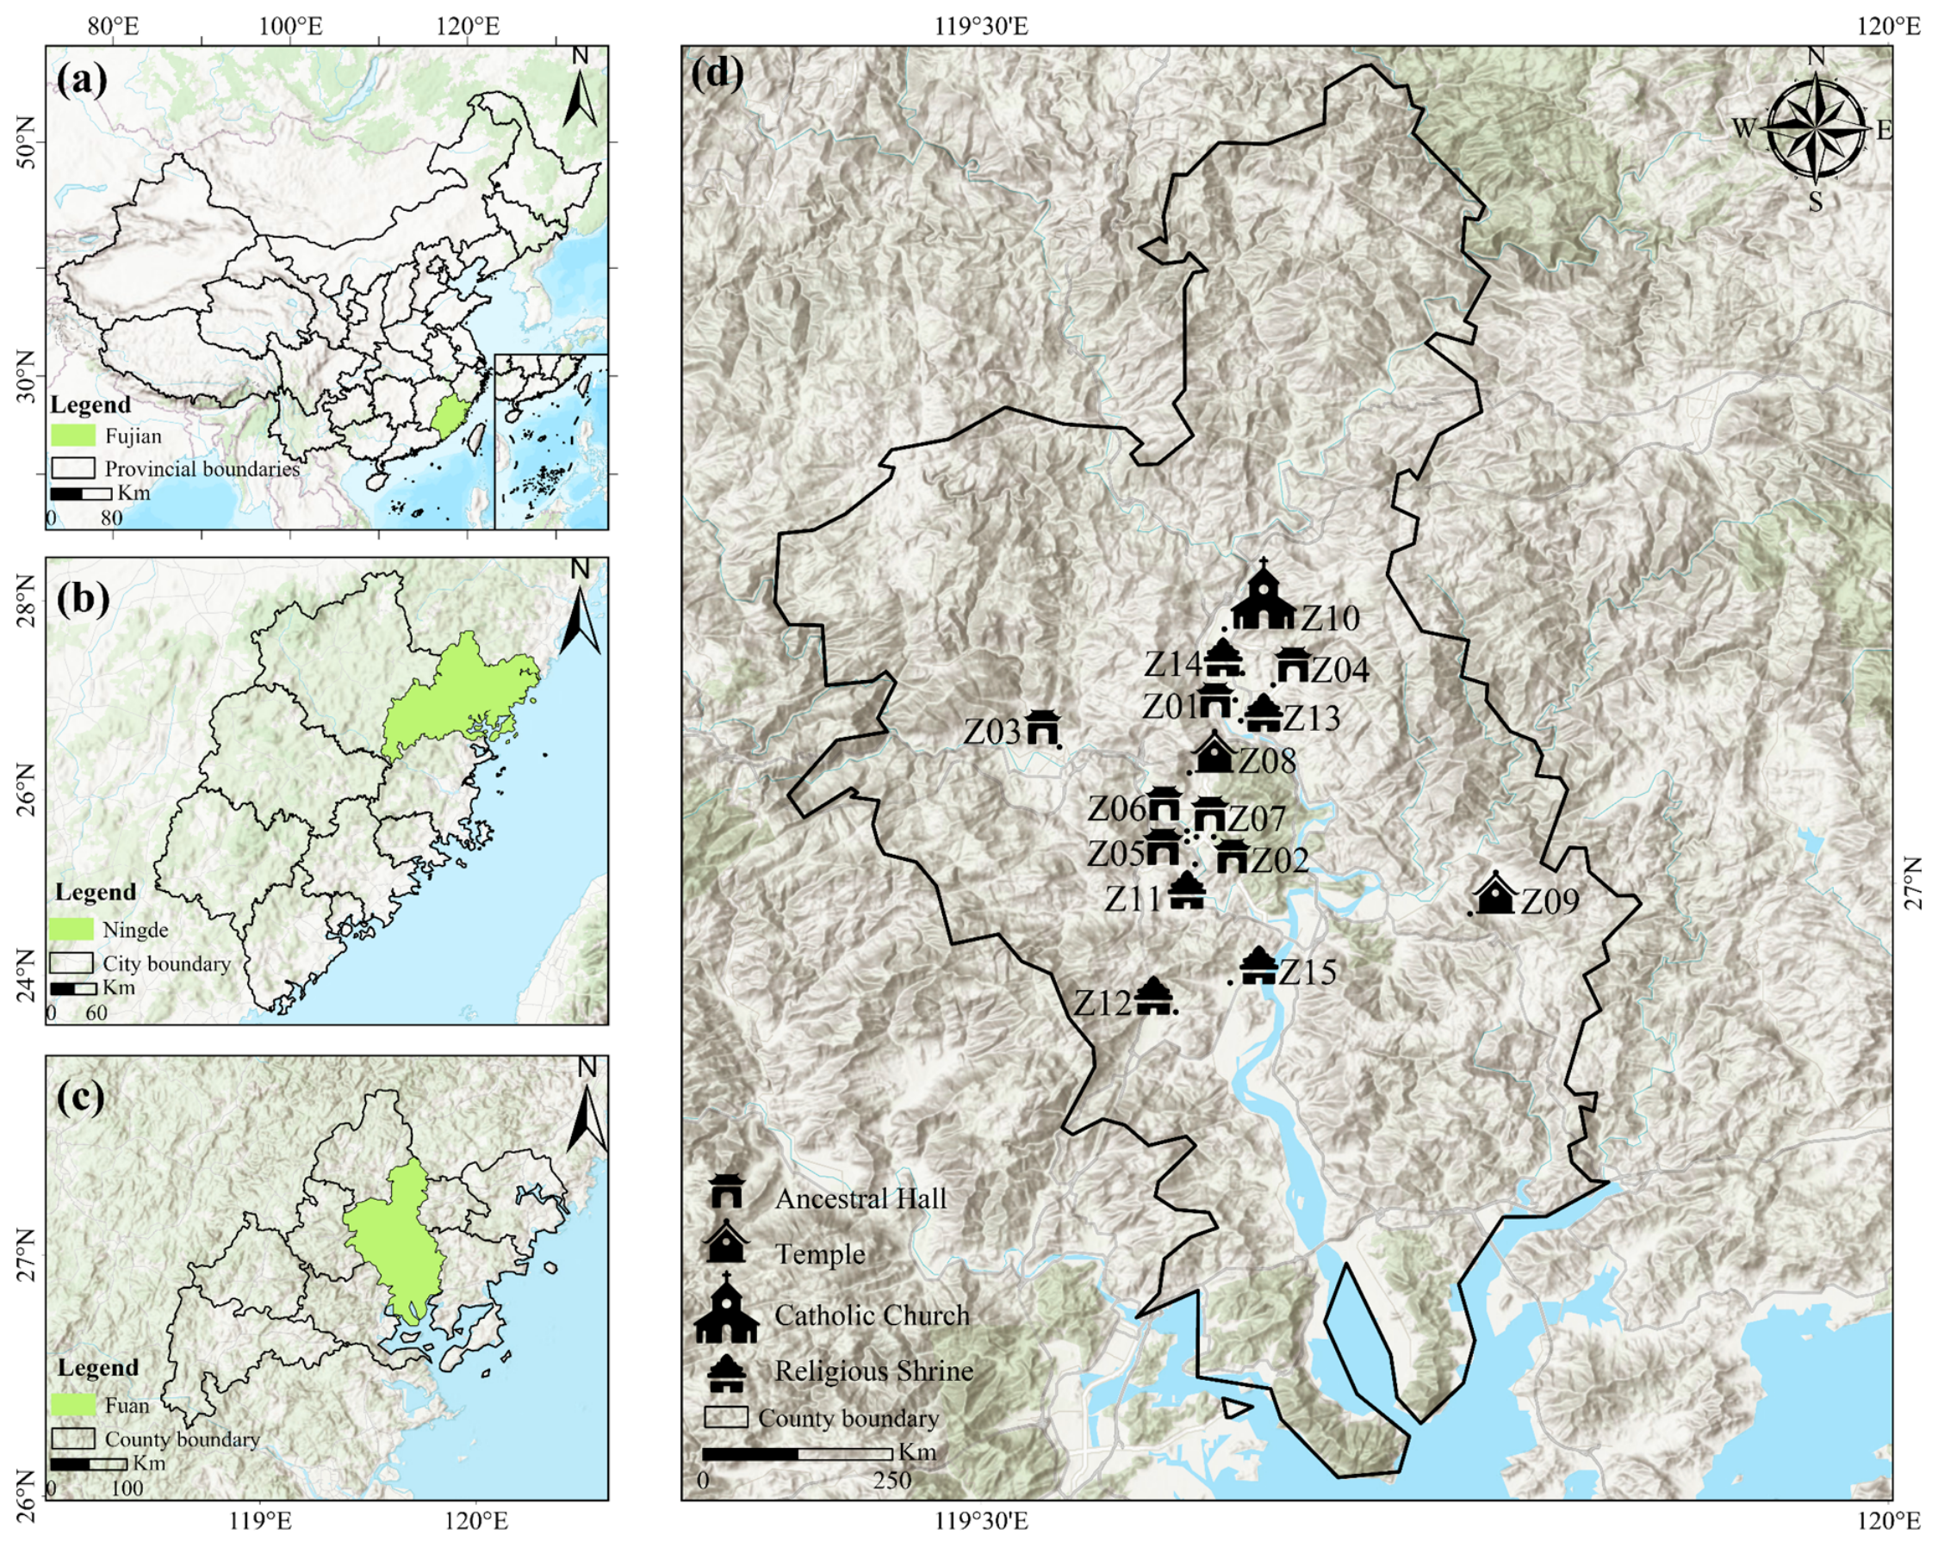
Figure 3.
Research framework, sample selection, and analytical workflow.
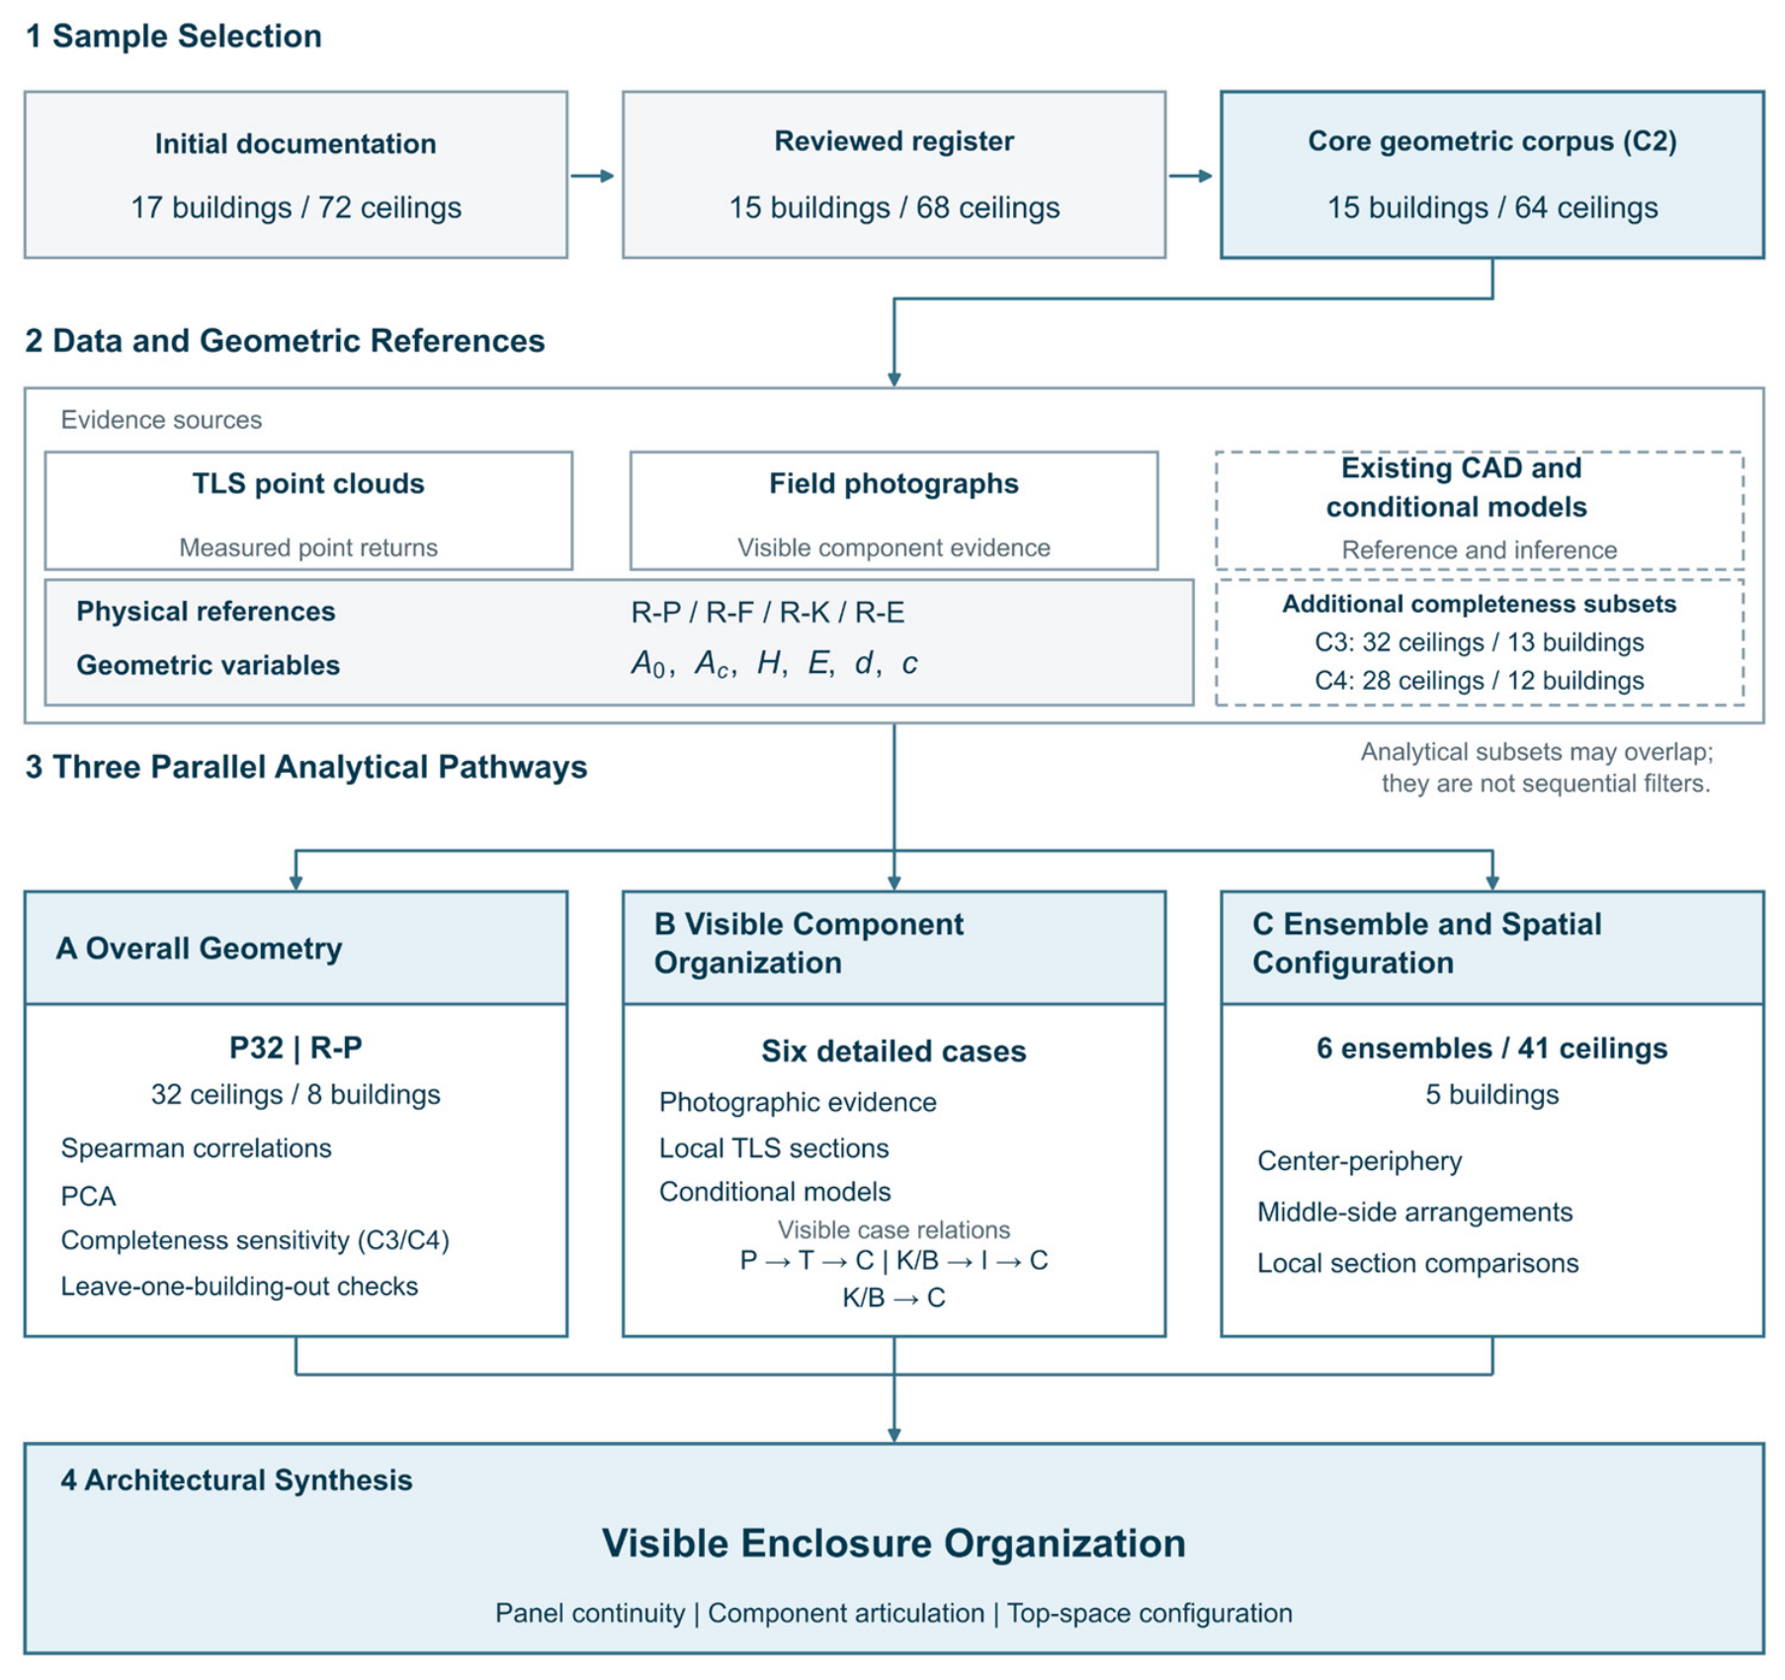
Figure 4.
Geometric proportions in P32. (a) Opening area and reference height difference; (b) principal-component distribution of the proportional indicators; (c) plan elongation and two normalized heights; (d) leave-one-building-out results.
Figure 4.
Geometric proportions in P32. (a) Opening area and reference height difference; (b) principal-component distribution of the proportional indicators; (c) plan elongation and two normalized heights; (d) leave-one-building-out results.
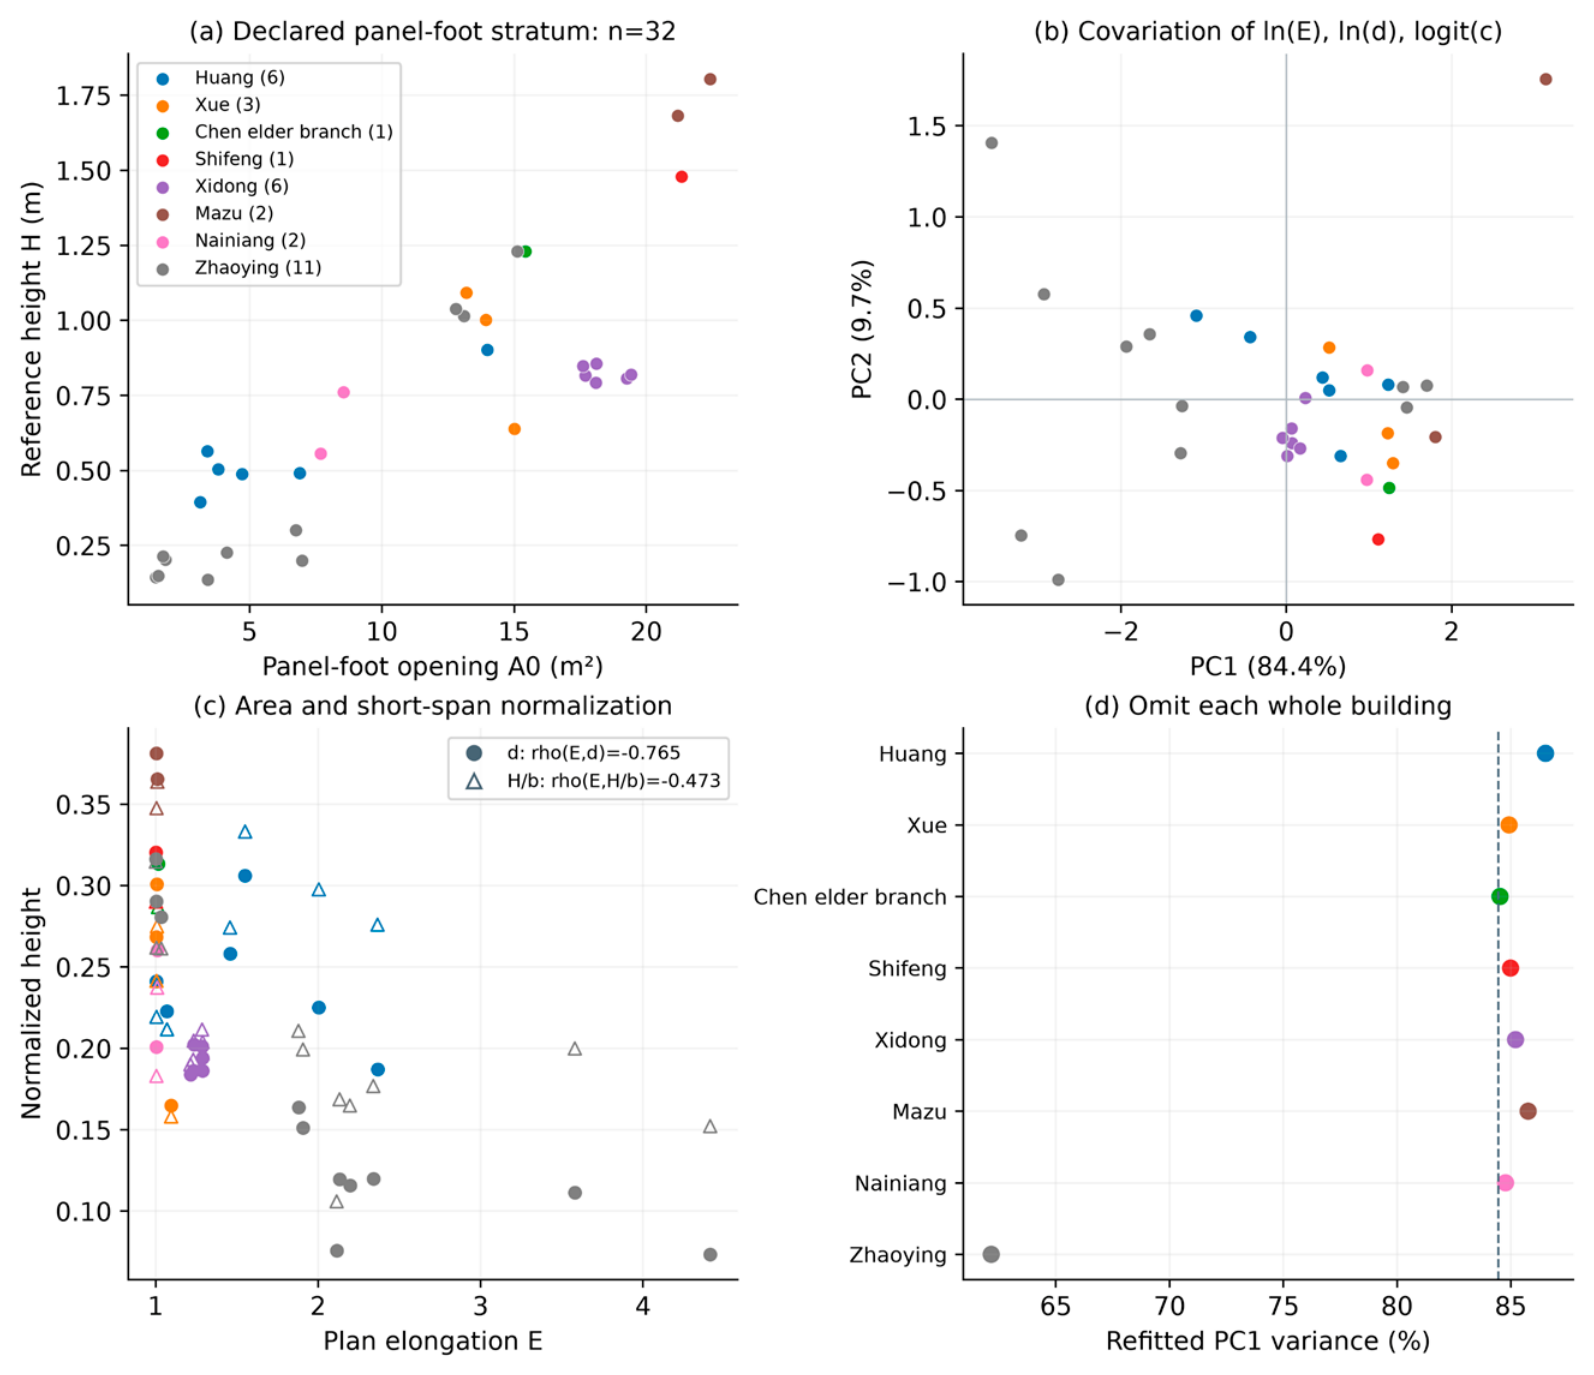
Figure 5.
Adopted opening and internal physical extents in Huang Z01-05 and Lian Z04-01. The nested projected outlines represent the adopted opening, internal reference, and central closure panel in the existing models.
Figure 5.
Adopted opening and internal physical extents in Huang Z01-05 and Lian Z04-01. The nested projected outlines represent the adopted opening, internal reference, and central closure panel in the existing models.
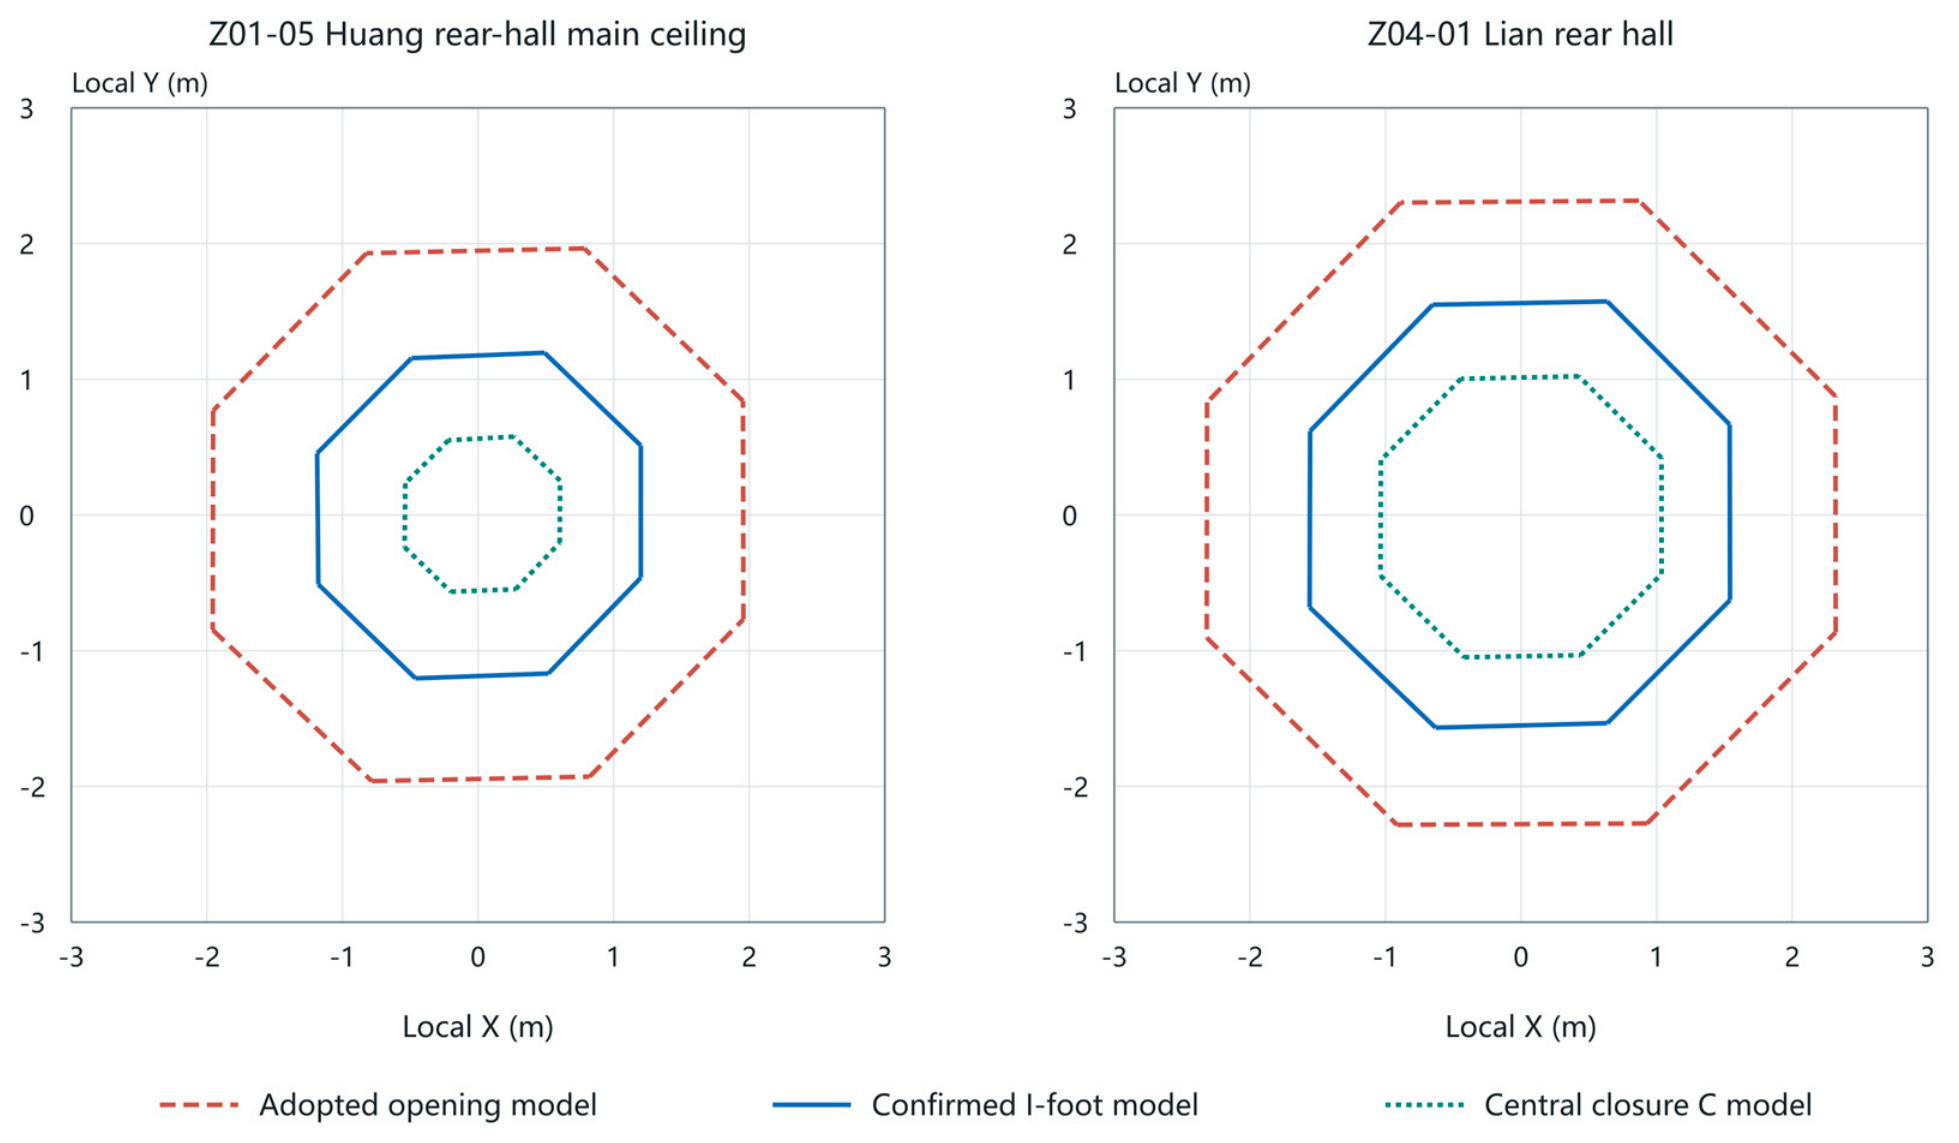
Figure 6.
Visible components and local morphology of six zaojing ceilings. L1/L2 locate photographic observations; D1/D2 identify enlarged details. P, K, B, I, V, and C denote continuous panels, short members, backing panels, independent inner panels, adjacent vertical surfaces, and central closure panels.
Figure 6.
Visible components and local morphology of six zaojing ceilings. L1/L2 locate photographic observations; D1/D2 identify enlarged details. P, K, B, I, V, and C denote continuous panels, short members, backing panels, independent inner panels, adjacent vertical surfaces, and central closure panels.
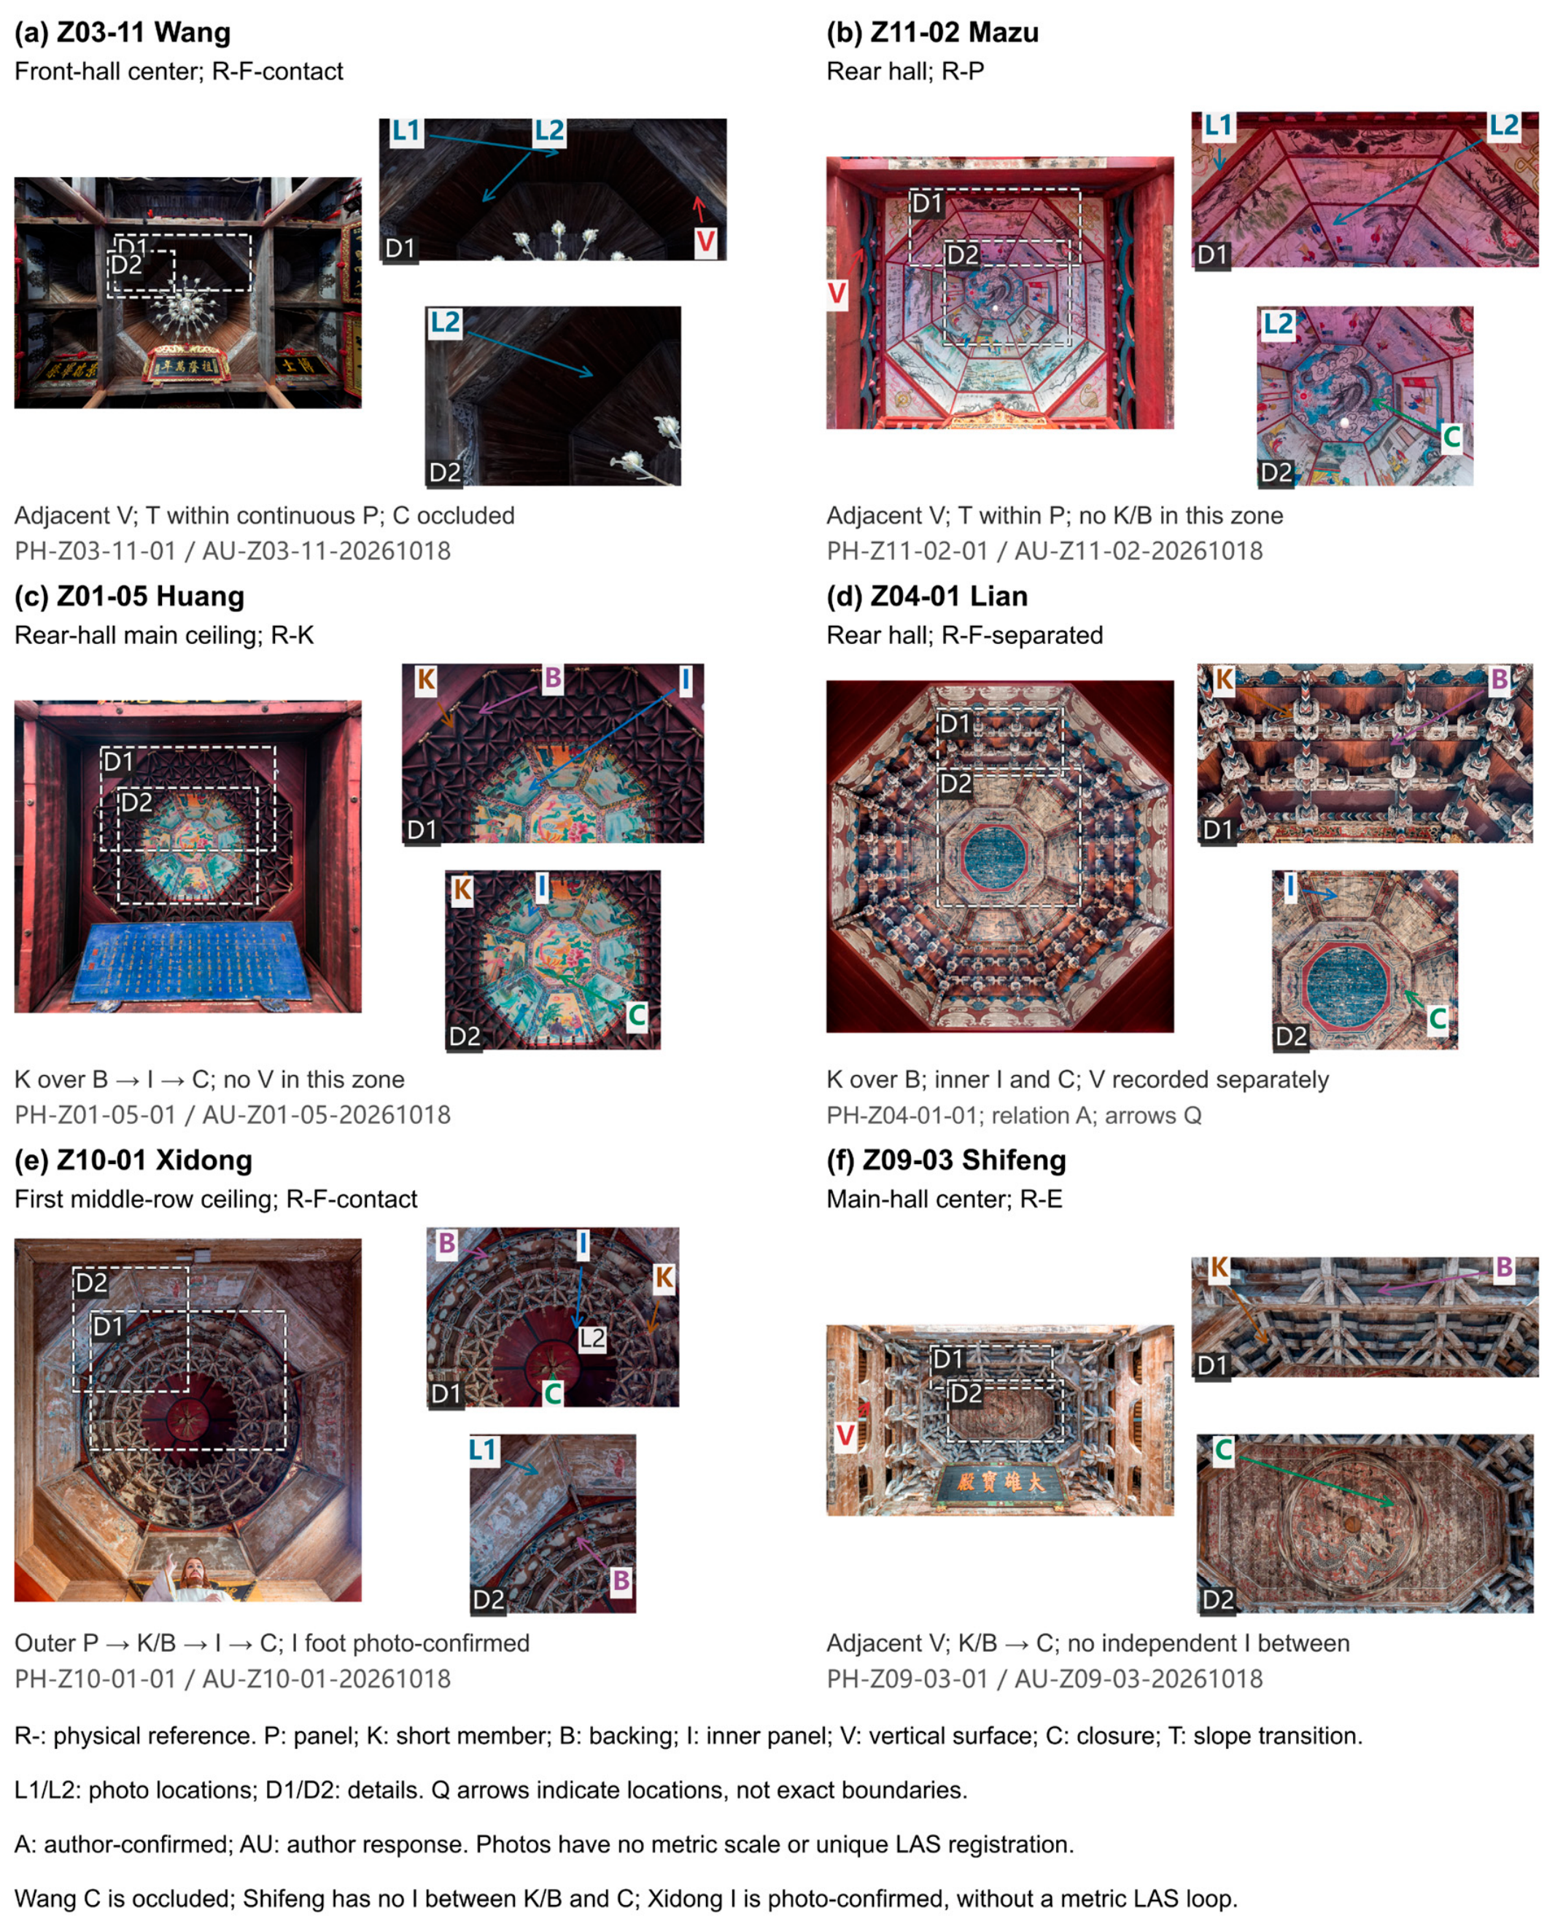
Figure 9.
Spatial arrangements and comparison positions of the six ceiling ensembles.
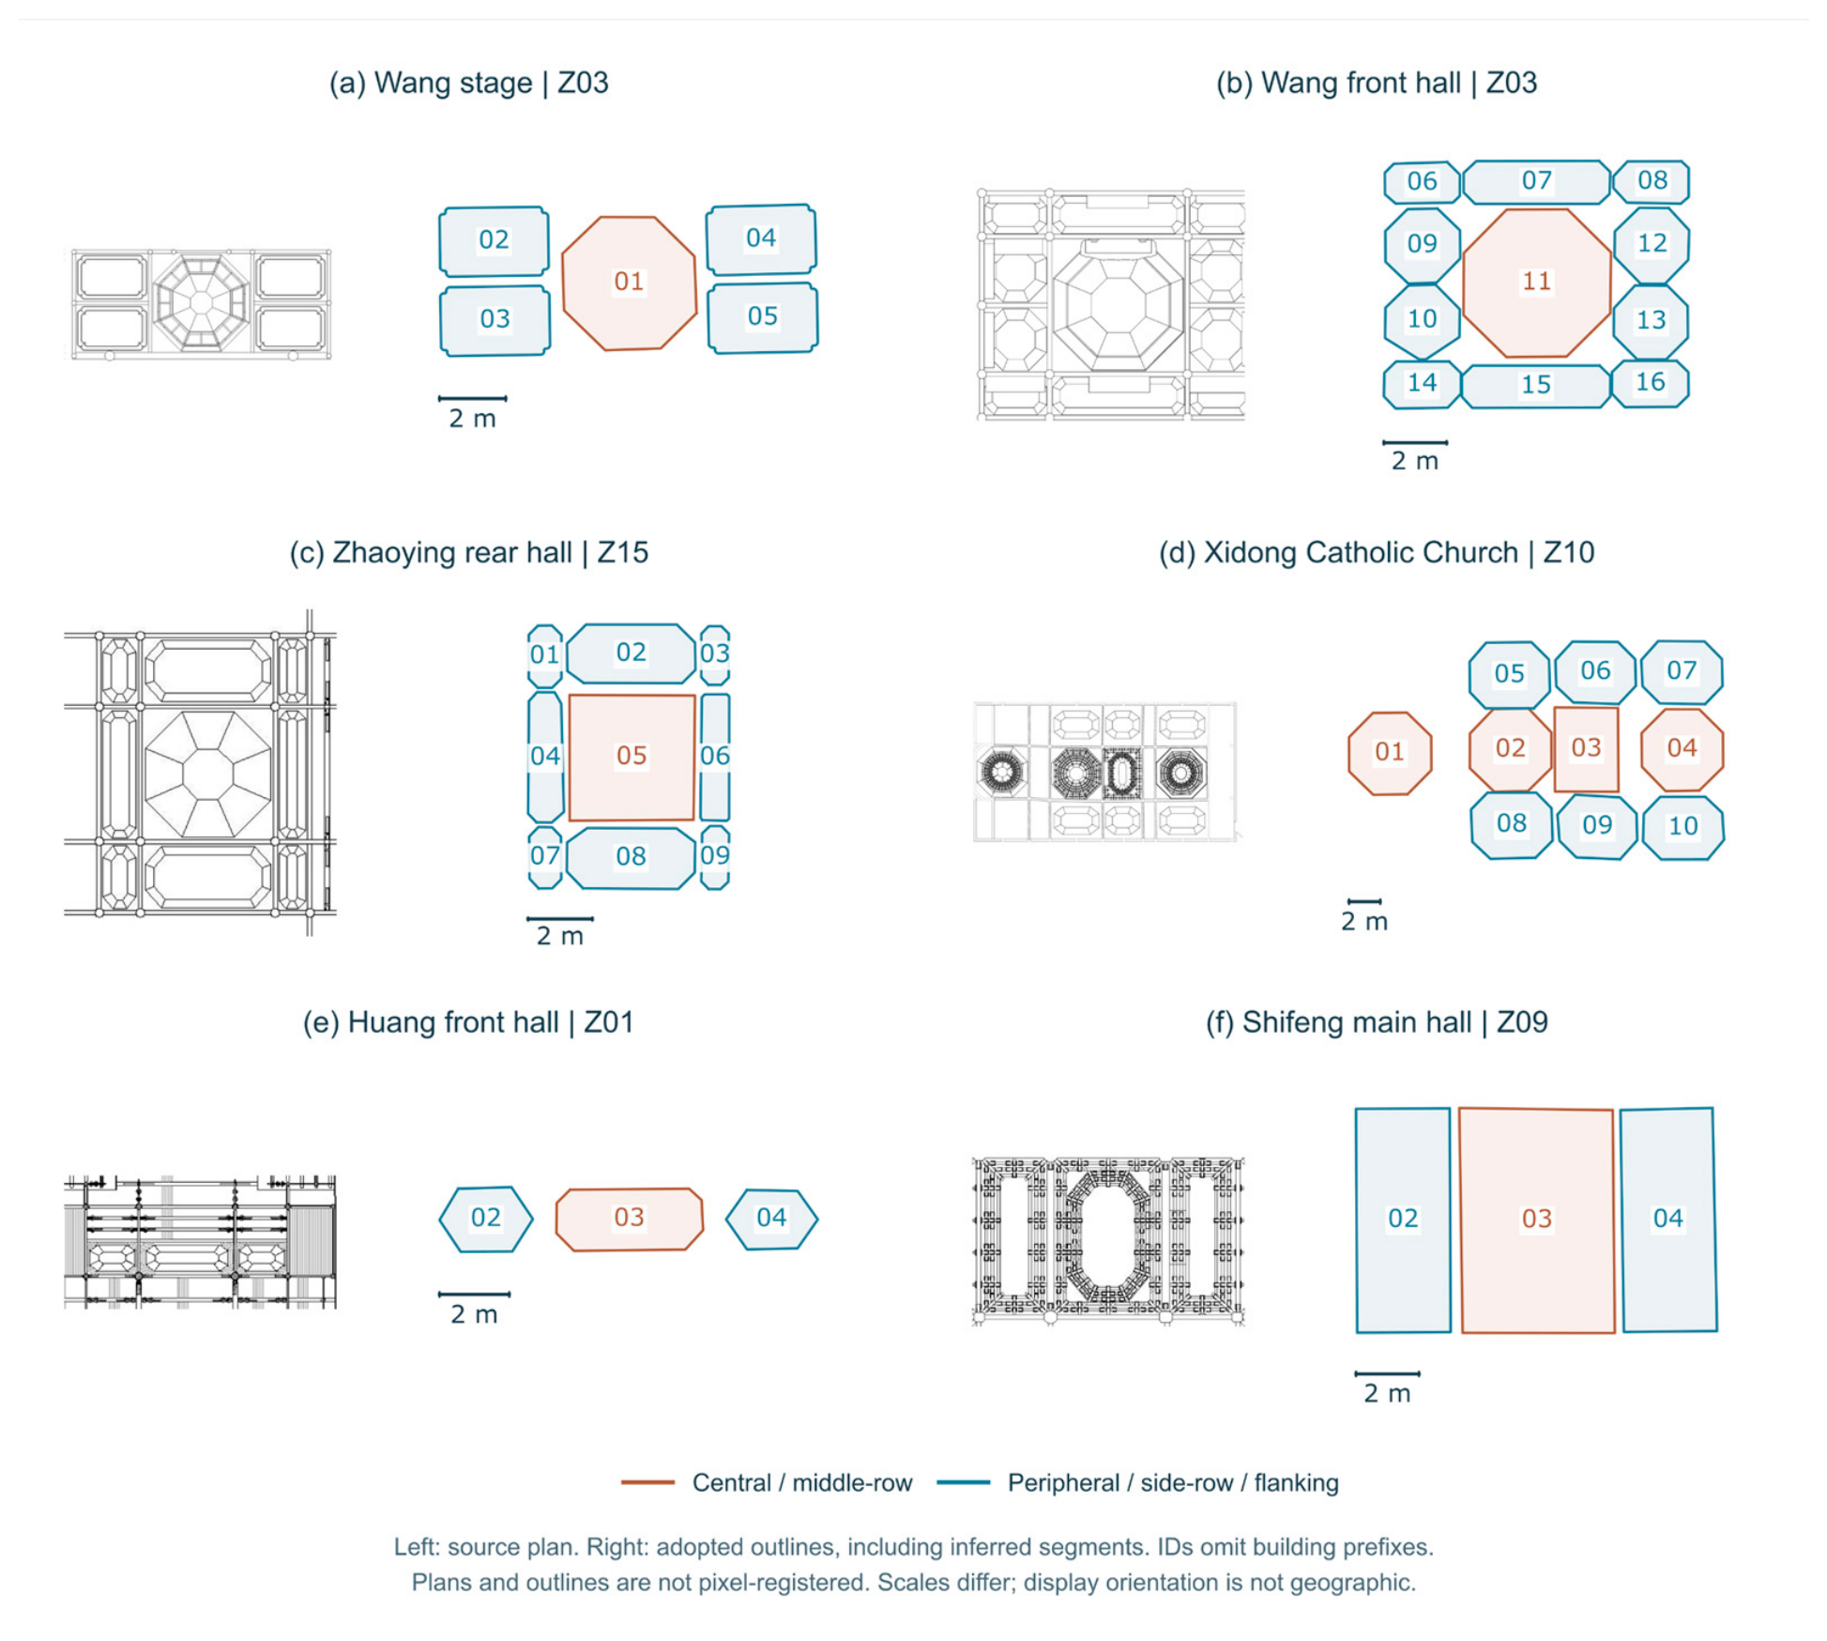
Figure 10.
Geometric ratios between positional groups in the six ceiling ensembles. Ratios compare the central ceiling with the peripheral or flanking median, or the middle-row median with the side-row median, as defined in Table 7.
Figure 10.
Geometric ratios between positional groups in the six ceiling ensembles. Ratios compare the central ceiling with the peripheral or flanking median, or the middle-row median with the side-row median, as defined in Table 7.
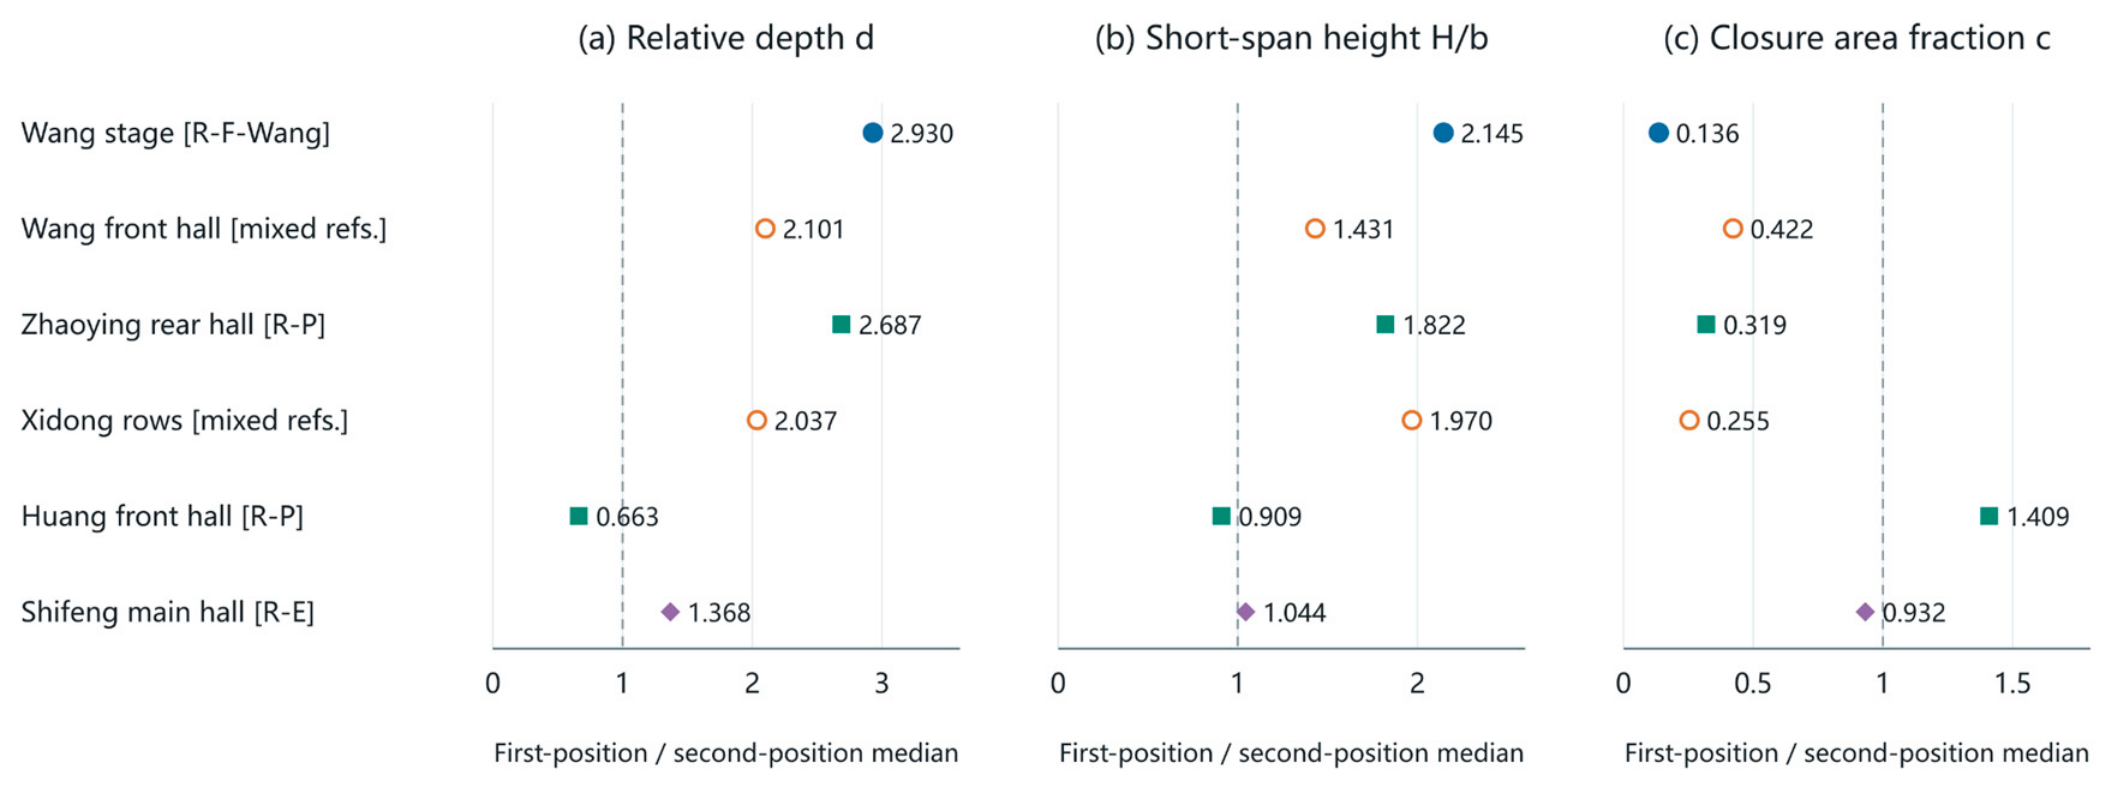
Figure 11.
Local panel sections in the Wang front hall. (a) Ceiling positions; (b) corresponding photograph; (c,d) eligible section directions for central ceiling Z03-11 and peripheral ceiling Z03-09.
Figure 11.
Local panel sections in the Wang front hall. (a) Ceiling positions; (b) corresponding photograph; (c,d) eligible section directions for central ceiling Z03-11 and peripheral ceiling Z03-09.
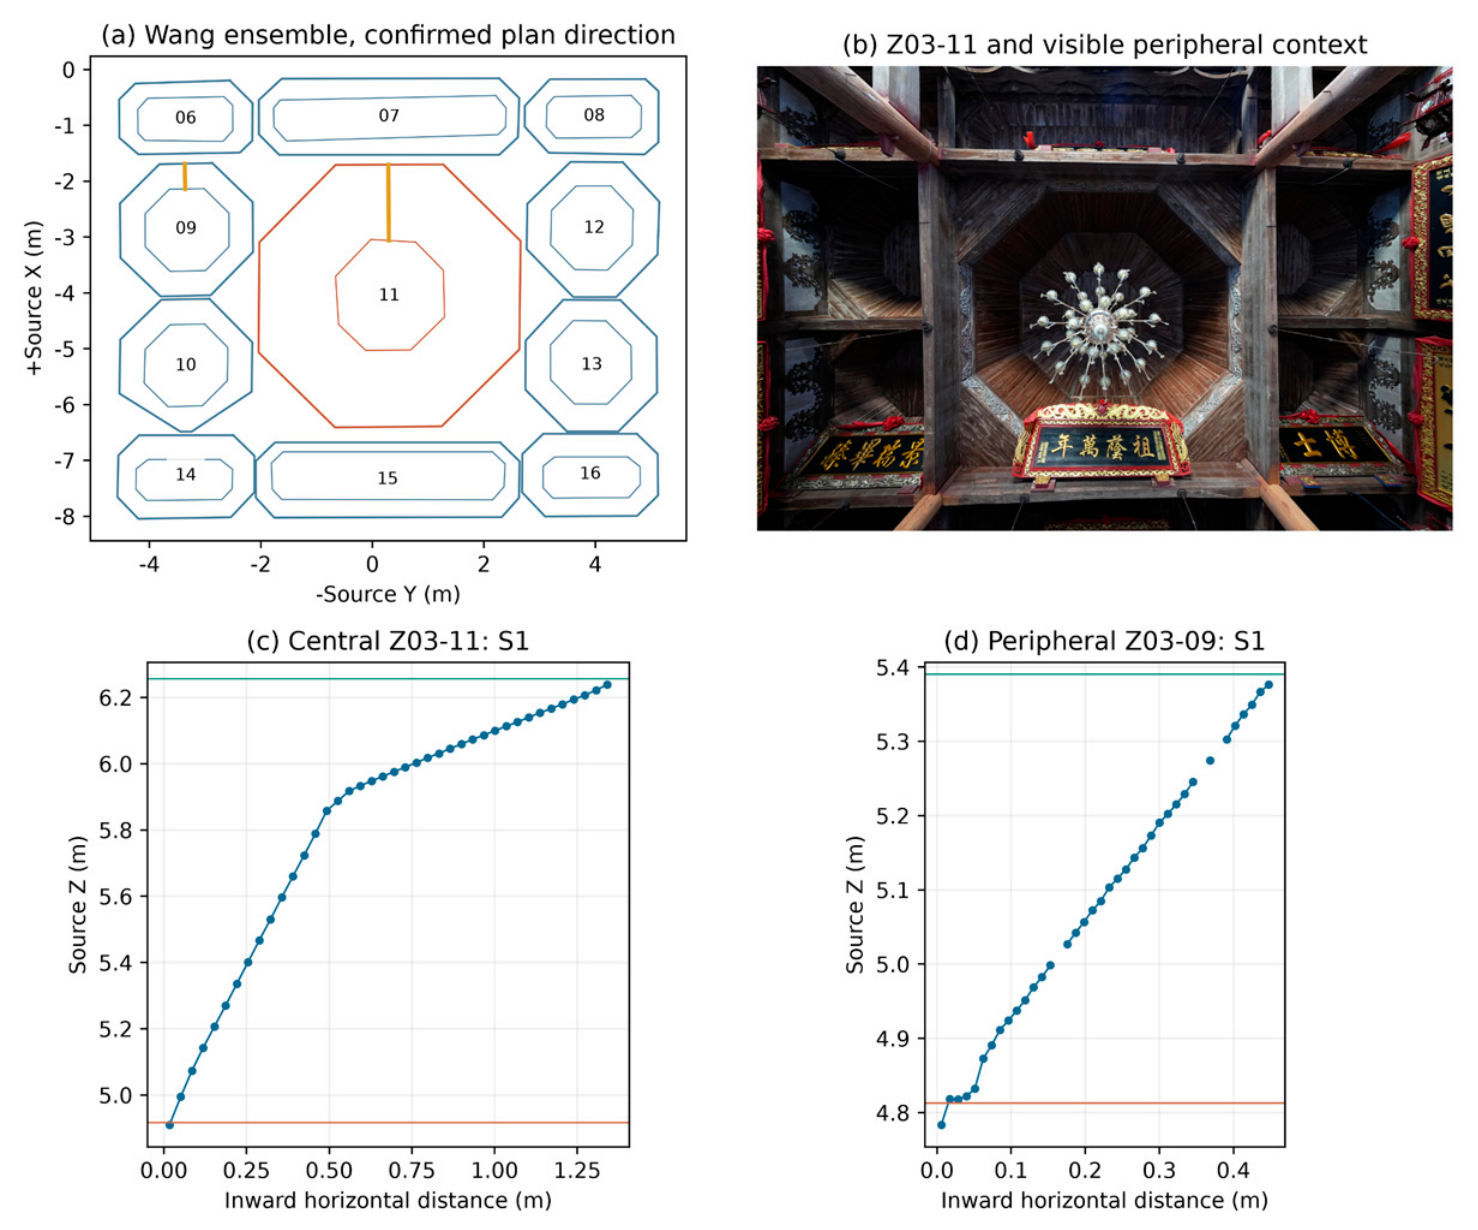
Figure 12.
Local section comparison of two ceilings with similar relative depths: Wang Z03-11 and Zhaoying Z15-05.
Figure 12.
Local section comparison of two ceilings with similar relative depths: Wang Z03-11 and Zhaoying Z15-05.
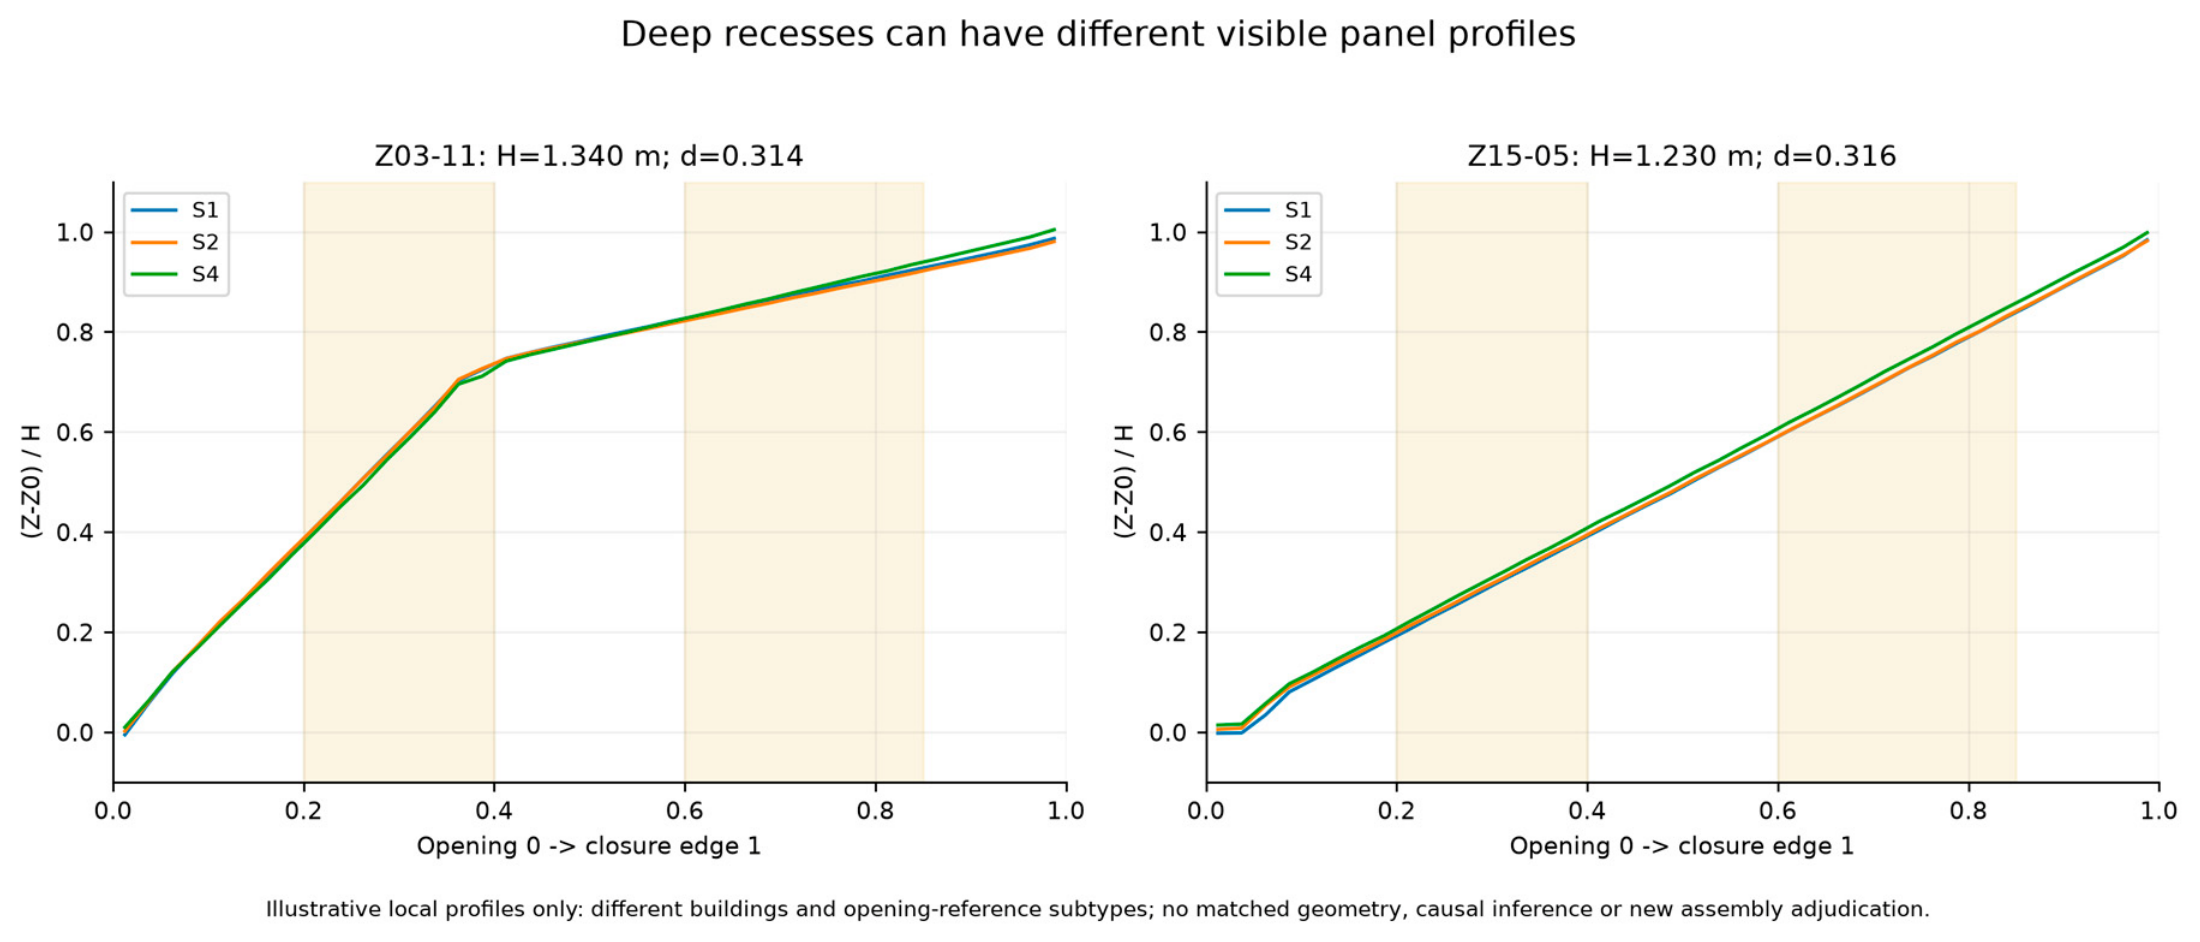
Figure 13.
Comparative morphology of visible enclosure organization in traditional zaojing ceilings in Fu’an. (A) Continuous-panel slope transitions in Wang Ancestral Hall and Mazu Temple at different model-derived relative heights. (B) Independent inner panels in Huang and Lian Ancestral Halls, separating outer member zones (K/B) from inner panel zones (I). (C) Central–peripheral configurations in Zhaoying Temple and Huang Ancestral Hall with opposite relative-depth relationships within the R-P category. Measured LAS traces, photo-supported observations, conditional-model boundaries, and schematic guides are distinguished by evidence source. FH and FA are relative indicators from existing conditional models. Simplified sections do not share a common dimensional scale; height-configuration diagrams are schematic, and ratios use the adopted physical references.
Figure 13.
Comparative morphology of visible enclosure organization in traditional zaojing ceilings in Fu’an. (A) Continuous-panel slope transitions in Wang Ancestral Hall and Mazu Temple at different model-derived relative heights. (B) Independent inner panels in Huang and Lian Ancestral Halls, separating outer member zones (K/B) from inner panel zones (I). (C) Central–peripheral configurations in Zhaoying Temple and Huang Ancestral Hall with opposite relative-depth relationships within the R-P category. Measured LAS traces, photo-supported observations, conditional-model boundaries, and schematic guides are distinguished by evidence source. FH and FA are relative indicators from existing conditional models. Simplified sections do not share a common dimensional scale; height-configuration diagrams are schematic, and ratios use the adopted physical references.
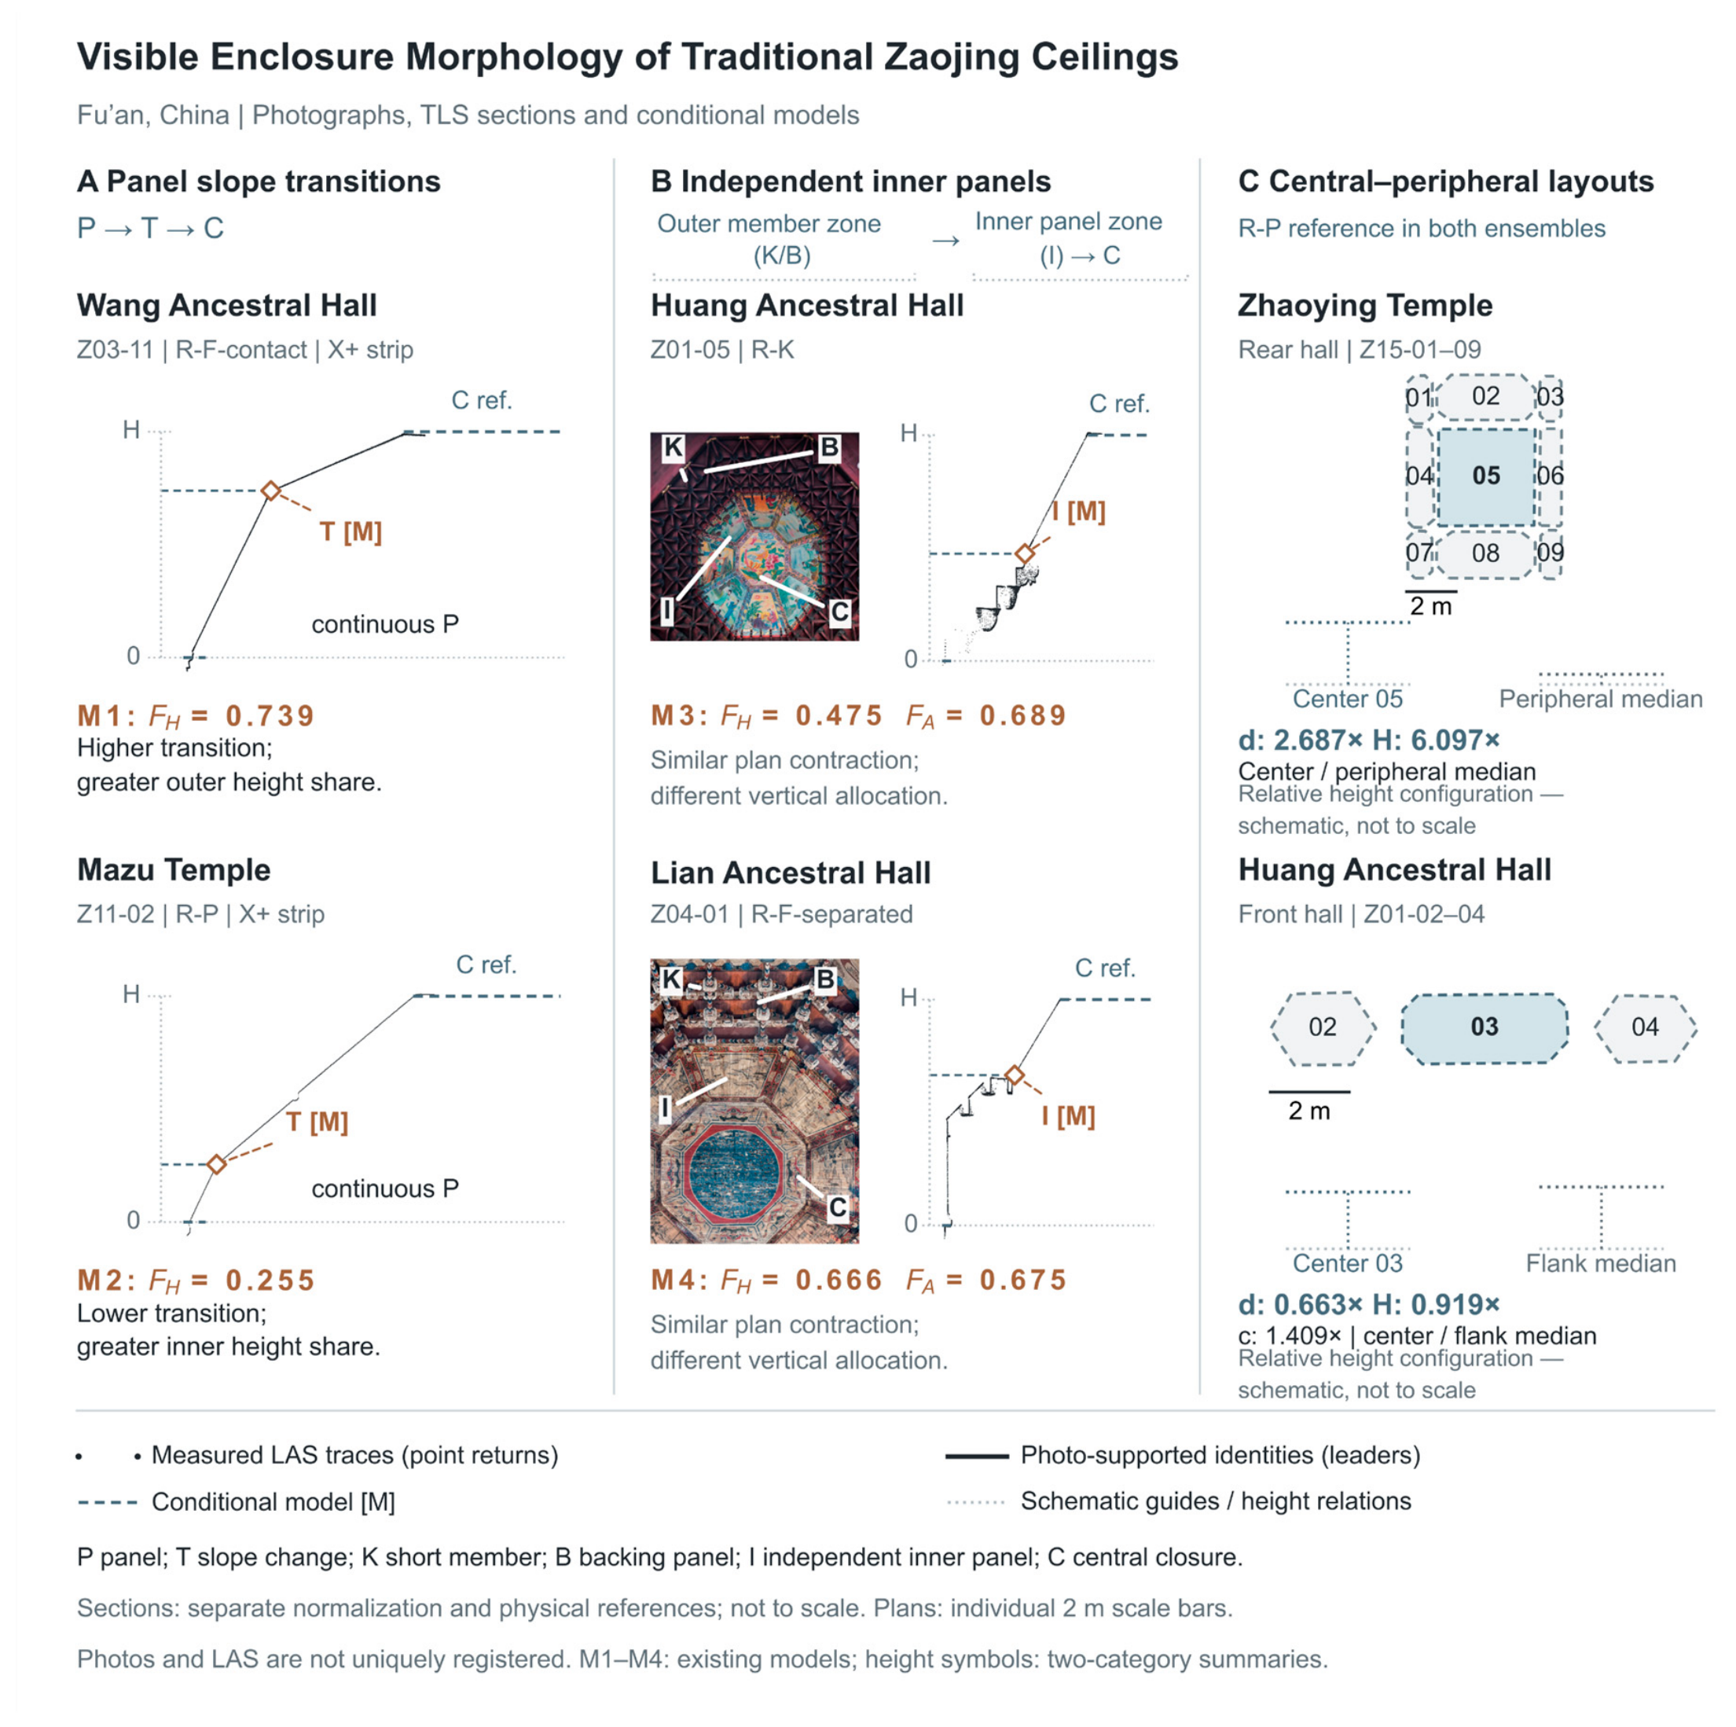
Table 1.
Surveyed buildings and numbers of registered ceilings and ceilings with complete core geometry.
Table 1.
Surveyed buildings and numbers of registered ceilings and ceilings with complete core geometry.
| ID | Building | Use | Registered | Complete geometry |
|---|---|---|---|---|
| Z01 | Huang Ancestral Hall | Ancestral hall | 8 | 7 |
| Z02 | Xue Ancestral Hall | Ancestral hall | 3 | 3 |
| Z03 | Wang Ancestral Hall | Ancestral hall | 16 | 16 |
| Z04 | Lian Ancestral Hall | Ancestral hall | 1 | 1 |
| Z05 | Chen Ancestral Hall | Ancestral hall | 2 | 1 |
| Z06 | Chen Branch Ancestral Hall | Ancestral hall | 2 | 1 |
| Z07 | Chen Senior-Branch Ancestral Hall | Ancestral hall | 2 | 2 |
| Z08 | Lingyan Temple | Buddhist temple | 2 | 1 |
| Z09 | Shifeng Temple | Buddhist temple | 4 | 4 |
| Z10 | Xidong Catholic Church | Catholic church | 10 | 10 |
| Z11 | Mazu Temple | Folk-religious temple | 2 | 2 |
| Z12 | Nainiang Temple | Folk-religious temple | 2 | 2 |
| Z13 | Qisheng Temple | Folk-religious temple | 1 | 1 |
| Z14 | Qingyun Temple | Folk-religious temple | 2 | 2 |
| Z15 | Zhaoying Temple | Folk-religious temple | 11 | 11 |
| Total | 15 buildings | 68 | 64 |
Table 2.
Physical measurement references and R-F subcategories.
| Category or subcategory | n | Adopted physical reference | Representative IDs |
|---|---|---|---|
| R-P | 32 | Lowest continuous inclined-panel foot | Z11-02, Z15-05 |
| R-F total | 28 | Lower frame or transition | Six subcategories below |
| R-K | 1 | Outer edge of the lowest projecting-member layer | Z01-05 |
| R-E | 3 | Four-frame envelope without corner deductions | Z09-02, 03, 04 |
| R-F-Wang | 15 | Wang lower frame and corner combination | Z03-01–10, 12–16 |
| R-F-contact | 2 | Panel-foot/lower-frame junction | Z03-11, Z10-01 |
| R-F-separated | 2 | Lower reference separated from the upper inner panel | Z04-01, Z05-02 |
| R-F-transition | 6 | Lower octagonal transition | Z06-02, Z14-01 |
| R-F-wall | 2 | Rising enclosure surface projected to the lower frame | Z10-02, Z10-04 |
| R-F-rectangle | 1 | Transverse rectangular lower frame | Z10-03 |
R-P, R-F, R-K, and R-E total 64 ceilings; the six R-F subcategories total 28.
Table 3.
Descriptive geometric statistics for the 64 ceilings.
| Indicator | Median | Interquartile interval | Range |
|---|---|---|---|
| A₀/m² | 13.141 | 4.586-18.092 | 1.458-34.375 |
| Ac/m² | 1.942 | 1.210-3.904 | 0.462-9.993 |
| H/m | 0.800 | 0.290-1.230 | 0.136-2.690 |
| E | 1.155 | 1.007-1.680 | 1.001-4.412 |
| d | 0.245 | 0.152-0.317 | 0.073-0.566 |
| c | 0.236 | 0.168-0.374 | 0.025-0.675 |
A0 and Ac are horizontal projected areas; H is the height difference defined by the selected physical reference. E, d, and c are dimensionless.
Table 4.
Proportional relationships in P32 and leave-one-building-out results.
| Subset or omitted building | n | ρ(A₀,H) | ρ(E,d) | ρ(E,H/b) | ρ(d,c) | PC1/% |
|---|---|---|---|---|---|---|
| P32 adopted | 32 | 0.824 | -0.765 | -0.473 | -0.755 | 84.4 |
| P32∩C3 | 16 | 0.874 | −0.574 | −0.456 | −0.585 | 85.9 |
| P32∩C4 | 15 | 0.900 | −0.632 | −0.550 | −0.636 | 87.0 |
| Omit Z01 | 26 | 0.791 | -0.870 | -0.701 | -0.797 | 86.5 |
| Omit Z02 | 29 | 0.848 | -0.778 | -0.500 | -0.813 | 84.9 |
| Omit Z07 | 31 | 0.829 | -0.761 | -0.458 | -0.760 | 84.5 |
| Omit Z09 | 31 | 0.806 | -0.748 | -0.444 | -0.794 | 85.0 |
| Omit Z10 | 26 | 0.891 | -0.774 | -0.486 | -0.727 | 85.2 |
| Omit Z11 | 30 | 0.786 | -0.763 | -0.428 | -0.734 | 85.8 |
| Omit Z12 | 30 | 0.792 | -0.798 | -0.540 | -0.795 | 84.8 |
| Omit Z15 | 21 | 0.760 | -0.426 | -0.017 | -0.351 | 62.2 |
Table 5.
Geometric indicators for different physical measurement extents within the same ceiling.
| Ceiling ID | Physical extent | A / m² | H / m | d | c |
|---|---|---|---|---|---|
| Z01-05 | Adopted opening | 12.595 | 1.127 | 0.318 | 0.084 |
| Z01-05 | Inner-panel foot | 4.652 | 0.592 | 0.274 | 0.228 |
| Z04-01 | Adopted opening | 17.227 | 1.902 | 0.458 | 0.205 |
| Z04-01 | Inner-panel foot | 7.987 | 0.636 | 0.225 | 0.442 |
| Z05-02 | Adopted opening | 23.728 | 1.097 | 0.225 | 0.221 |
| Z05-02 | Candidate internal extent* | 12.340 | 0.376 | 0.107 | 0.425 |
A is the area within the selected extent; H changes with the lower reference. Both d and c are dimensionless. * The internal reference of Z05-02 remains a candidate.
Table 6.
Overall geometry and visible component relationships of the six detailed cases.
| Ceiling ID | A₀/m² | H/m | E | d | c | Visible sequence |
|---|---|---|---|---|---|---|
| Z03-11 | 18.205 | 1.340 | 1.002 | 0.314 | 0.172 | P → C; slope transition within P |
| Z11-02 | 22.410 | 1.805 | 1.006 | 0.381 | 0.146 | P → C; slope transition within P |
| Z01-05 | 12.595 | 1.127 | 1.003 | 0.318 | 0.084 | K over B → independent I → C; outer corner panels recorded separately |
| Z10-01 | 22.932 | 2.008 | 1.006 | 0.419 | 0.040 | Outer P → K with B → curved I → C; I foot confirmed in photograph, metric reference not established |
| Z09-03 | 34.375 | 2.007 | 1.425 | 0.342 | 0.291 | K over B → C; no independent I between K/B and C |
| Z04-01 | 17.227 | 1.902 | 1.009 | 0.458 | 0.205 | Adjacent V → K with B → independent I → C |
Table 7.
Geometric ratios and physical references for six ensembles comprising 41 ceilings. n1 and n2 are the numbers in the first and second positional groups. Each ratio is the first-group median divided by the second-group median.
Table 7.
Geometric ratios and physical references for six ensembles comprising 41 ceilings. n1 and n2 are the numbers in the first and second positional groups. Each ratio is the first-group median divided by the second-group median.
| Ensemble | n1 + n2 | H ratio | d ratio | H/b ratio | c ratio | Physical reference and scope of comparison |
|---|---|---|---|---|---|---|
| Wang stage | 1+4 | 4.135 | 2.930 | 2.145 | 0.136 | Same R-F-Wang subcategory; within-ensemble frame/corner comparison; corner homology unresolved |
| Wang front hall | 1+10 | 4.936 | 2.101 | 1.431 | 0.422 | R-F-contact/R-F-Wang; cross-reference configuration; within-subcategory positional differences not estimable |
| Zhaoying rear hall | 1+8 | 6.097 | 2.687 | 1.822 | 0.319 | Same R-P category; adopted panel-foot comparison with model-derived status retained |
| Xidong complete ceiling | 4+6 | 2.249 | 2.037 | 1.970 | 0.255 | Middle row: multiple R-F subcategories; side rows: R-P. Descriptive cross-reference configuration |
| Huang front hall | 1+2 | 0.919 | 0.663 | 0.909 | 1.409 | Same R-P category; central d below flanking d; central ceiling excluded by C3 screening |
| Shifeng main hall | 1+2 | 1.756 | 1.368 | 1.044 | 0.932 | Same R-E envelope category; four-frame extents, distinct from clear openings |
Table 8.
Primary-rule section results for the 11 ceilings in the Wang front hall.
| Ceiling ID | Position | Eligible directions: primary rule | Median inclination difference |
|---|---|---|---|
| Z03-06 | Peripheral | None | Not estimated |
| Z03-07 | Peripheral | None | Not estimated |
| Z03-08 | Peripheral | None | Not estimated |
| Z03-09 | Peripheral | S1, S2, S3, S4 | 0.5° |
| Z03-10 | Peripheral | S2, S4 | -0.1° |
| Z03-11 | Central | S1, S2, S4 | 39.7° |
| Z03-12 | Peripheral | S4 | 0.2° |
| Z03-13 | Peripheral | S4 | -0.3° |
| Z03-14 | Peripheral | None | Not estimated |
| Z03-15 | Peripheral | None | Not estimated |
| Z03-16 | Peripheral | None | Not estimated |
Table 9.
Primary-rule coverage for 12 ceilings in Huang Ancestral Hall and Zhaoying Temple.
| Ceiling ID | Position | Eligible directions | Valid bins/40: primary rule (S1/S2/S3/S4) | Bins with returns/40 (S1/S2/S3/S4) |
|---|---|---|---|---|
| Z01-02 | Flanking | None | 0/0/0/0 | 26/12/0/0 |
| Z01-03 | Central | None | 5/1/4/0 | 33/40/21/0 |
| Z01-04 | Flanking | None | 6/3/16/31 | 40/40/40/40 |
| Z15-01 | Peripheral | None | 0/0/9/7 | 0/35/40/38 |
| Z15-02 | Peripheral | None | 0/5/32/5 | 30/40/34/40 |
| Z15-03 | Peripheral | None | 0/3/1/1 | 3/35/32/31 |
| Z15-04 | Peripheral | None | 13/7/14/4 | 40/40/40/40 |
| Z15-05 | Central | S1/S2/S3/S4 | 40/40/40/40 | 40/40/40/40 |
| Z15-06 | Peripheral | None | 4/4/4/4 | 38/34/30/34 |
| Z15-07 | Peripheral | None | 2/5/0/3 | 40/35/0/39 |
| Z15-08 | Peripheral | None | 30/17/6/25 | 40/40/39/40 |
| Z15-09 | Peripheral | None | 7/6/0/0 | 39/29/3/0 |
Disclaimer/Publisher’s Note: The statements, opinions and data contained in all publications are solely those of the individual author(s) and contributor(s) and not of MDPI and/or the editor(s). MDPI and/or the editor(s) disclaim responsibility for any injury to people or property resulting from any ideas, methods, instructions or products referred to in the content. |
© 2026 by the authors. Licensee MDPI, Basel, Switzerland. This article is an open access article distributed under the terms and conditions of the Creative Commons Attribution (CC BY) license (http://creativecommons.org/licenses/by/4.0/).
Copyright: This open access article is published under a Creative Commons CC BY 4.0 license, which permit the free download, distribution, and reuse, provided that the author and preprint are cited in any reuse.