

Submitted:
09 November 2026
Posted:
10 November 2026
You are already at the latest version
Abstract
Objectives: To perform a head-to-head comparative evaluation of three Skeletal Muscle Index (SMI) normalization methods (SMIH², SMI100, and SMIBMI) in predicting cardiopulmonary efficiency (oxygen pulse, VO2/HR) and local muscle architecture in male liver transplant (LT) recipients, and to establish population-specific ROC-derived screening cut-off values for detecting low cardiopulmonary reserve. Method: In this cross-sectional study, 32 stable male LT recipients (mean age 61.03 ± 8.53 years) underwent whole-body bioelectrical impedance vector analysis (BIVA) to derive SMI variants, B-mode muscle ultrasound of the rectus femoris cross-sectional area (RF CSA), and cardiopulmonary exercise testing (CPET) on a cycle ergometer. Hierarchical multiple linear regression models evaluated the incremental predictive contribution (ΔR²) of each SMI metric over RF CSA for VO2/HR. Discriminative performance and high-sensitivity screening cut-offs were determined using ROC curve analysis and Youden's index. Result: Hierarchical regression revealed that adding SMIBMI (ΔR² = 0.099, p = 0.033) and SMIH² (ΔR² = 0.084, p = 0.046) significantly increased the explained variance of VO2/HR over the baseline model containing RF CSA alone (R² = 0.195). Conversely, SMI100 did not significantly improve model fit (ΔR² = 0.038, p = 0.131). Both SMIH² (AUC = 0.791, p = 0.009) and SMIBMI (AUC = 0.755, p = 0.022) exhibited good discriminative capacity for impaired oxygen pulse (VO2/HR < 13.5 mL/beat). Optimal high-sensitivity screening cut-off thresholds were identified at SMIBMI ≤ 0.802 (100.0% sensitivity, 45.0% specificity) and SMIH² ≤ 6.89 kg/m² (100.0% sensitivity, 45.0% specificity). Conclusion: SMI normalization methods are not clinically interchangeable when assessing cardiopulmonary efficiency in male LT recipients. SMIBMI and SMIH² demonstrate superior predictive validity for oxygen pulse compared to SMI100, with SMIBMI offering the highest incremental explanatory power over local muscle ultrasound metrics. The population-specific cut-offs (SMIBMI ≤ 0.802 and SMIH² ≤ 6.89 kg/m²) provide reliable clinical decision limits to identify recipients at risk of exercise intolerance and guide referral to targeted rehabilitation.
Keywords:
liver transplantation
; sarcopenia
; skeletal muscle index
; cardiopulmonary exercise testing
; oxygen pulse
; muscle ultrasound
1. Introduction
Sarcopenia (Yuan & Larsson, 2023) a progressive, generalized skeletal muscle disorder characterized by the concurrent loss of muscle mass, quality, and function. According to the revised European consensus (EWGSOP2) (Cruz-Jentoft et al., 2019), its diagnosis relies on three core pillars: reduced muscle strength, decreased muscle quantity or quality, and impaired physical performance. To quantify muscle mass, appendicular skeletal muscle mass (ASMM) is conventionally normalized using different anthropometric adjustments, yielding three distinct variants of the Skeletal Muscle Index (SMI):
- SMIH2 (ASMM/Height2, kg/m2), the classical EWGSOP2 (Cruz-Jentoft et al., 2019) metric designed to scale muscle mass to stature;
- SMI100 ([ASMM/weight] x 100, %), expressing muscle mass as a relative percentage of total body mass (Janssen et al., 2002) ;
- SMIBMI (ASMM/BMI, m2), endorsed by the Foundation for the National Institutes of Health (FNIH) to account for the confounding burden of total body volume and adiposity (Cawthon et al., 2014).
Despite being used interchangeably in clinical research, these three normalization strategies reflect fundamentally different physiological constructs, particularly in populations characterized by fluid shifts, sarcopenic obesity, or severe metabolic derangements.
In liver transplantation (LT), muscle depletion (Miarka et al., 2021) originates from pre-transplant (Dasarathy & Merli, 2016), metabolic dysfunction (Tsien et al., 2014), hyperammonemia (Ebadi et al., 2019), and chronic systemic inflammation (Sogbe et al., 2026), often persisting post-operatively due to prolonged immunosuppressive therapy and physical inactivity. This muscle wasting directly compromises peripheral oxygen extraction and metabolic efficiency during exertion, leading to diminished cardiopulmonary reserve and severe exercise intolerance. In this setting, Cardiopulmonary Exercise Testing (CPET) (Guazzi et al., 2017) serves as the gold-standard diagnostic tool, with oxygen pulse (VO2/HR) (Kokkinos et al., 2022) acting as a key integrative surrogate for stroke volume and peripheral muscle oxygen extraction capacity. Reduced aerobic capacity in these patients represents a powerful predictor of mortality, independent of traditional cardiovascular risk factors.
Furthermore, evaluating structural and bioelectrical muscle health provides vital complementary insights. Ultrasonographic assessment of the Rectus Femoris cross-sectional area (RF CSA) (de Luis Roman et al., 2024) captures local architectural muscle wasting, whereas Bioelectrical Impedance Vector Analysis (BIVA) (Nwosu et al., 2019) evaluates cellular integrity through raw bioelectrical properties, as resistance, reactance, and phase angle, un confounded by fluid overload (Piccoli et al., 1994).
However, despite the established clinical relevance of muscle depletion and cardiopulmonary impairment in LT recipients, a major diagnostic gap remains: there is no consensus on which SMI normalization method (SMIH2, SMI100, SMIBMI) best correlates with integrative cardiopulmonary efficiency and local muscle architecture.
Therefore, the primary objective of this study was to perform a comparative head-to-head evaluation of SMIH2, SMI100, SMIBMI in predicting cardiopulmonary performance (VO2/HR) in LT recipients through multivariable regression models. Secondary objectives were to identify the most accurate SMI variant using non-parametric group comparisons and to establish population-specific ROC-derived cut-off values for detecting low cardiopulmonary reserve.
2. Method
2.1. Study Design
This single-center, retrospective cross-sectional study was conducted in accordance with the Strengthening the Reporting of Observational Studies in Epidemiology (STROBE) guidelines (von Elm et al., 2014). Clinical and physical evaluations were routinely collected during standard outpatient care at the Sports Medicine Center of the University Hospital of Florence between November 2025 and March 2026. Following formal ethics committee approval on 22 September 2026, relevant data were extracted and analyzed.
2.2. Participants
The study cohort comprised 32 stable male LT recipients recruited from an ongoing, monitored exercise-training program. The inclusion criteria were: age > 50 years, time elapsed since transplantation > 12 months, absence of cardiac contraindications to exercise, and ability to perform Cardiopulmonary Exercise Testing (CPET). Exclusion criteria included heart failure, clinically significant anemia, acute systemic inflammation, uncontrolled hypertension, neurological or psychiatric disorders, and severe functional limitations affecting daily physical activity. Testing conditions and protocols were strictly standardized across the entire cohort. Baseline clinical characteristics, including age, body mass index (BMI), time since transplantation, primary etiology of liver disease, comorbidities, and current immunosuppressive regimens, were retrieved from electronic medical records. The study was conducted in accordance with the Declaration of Helsinki and approved by the Ethics Committee of the Area vasta centro, granting ethical approval for this study (Ethical Approval Code: 31603, dated 22 September 2026). Written informed consent was obtained from all participants prior to enrolment.
2.3. Procedures
Participant recruitment and comprehensive evaluations were completed during a single baseline assessment prior to initiation of the exercise prescription program. All assessments were performed in the morning following an overnight fast and after urinary voiding. Participants were instructed to refrain from caffeine, alcohol, and strenuous physical activity for at least 24 hours preceding the evaluations. Testing followed a standardized sequence: initial clinical screening by a sports medicine physician to verify eligibility and evaluate lifestyle habits, followed immediately by instrumental body composition and exercise testing assessments.
2.4. Measurements
To establish a comprehensive prognostic and physical fitness profile, the evaluation protocol integrated a multidisciplinary battery assessing body composition, cardiopulmonary fitness and muscular fitness (Riebe et al., 2026).
2.4.1. Anthropometric Variables and Bioelectrical Impedance Vector Analysis
Anthropometric parameters, including body weight and height, were measured while participants were barefoot and lightly clothed to calculate Body Mass Index (BMI = weight/height2, kg/m2). Whole-body bioelectrical impedance was evaluated using a phase-sensitive BIA 101 Anniversary Sport Edition analyzer (Akern Srl, Florence, Italy), which emits a sinusoidal alternating current of 400 μA at 50 kHz (± 0.1%) (Kyle, Bosaeus, De Lorenzo, Deurenberg, Elia, Gómez, et al., 2004). Prior to testing, device accuracy was verified using the manufacturer-supplied calibration circuit of known impedance (R = 383 ± 10 Ω; Xc = 45 ± 5 Ω).
Measurements were conducted with participants resting in the supine position for at least 10 minutes, with arms and legs abducted from the trunk using non-conductive foam supports to prevent contact (Kyle, Bosaeus, De Lorenzo, Deurenberg, Elia, Manuel Gómez, et al., 2004). Tetrapolar surface electrodes (Biatrodes, Akern, Florence, Italy) were positioned on the dorsal surface of the right hand and foot according to standardized anatomical landmarks (Kyle, Bosaeus, De Lorenzo, Deurenberg, Elia, Manuel Gómez, et al., 2004). The raw BIVA parameters (PhA, Rz/h, and Xc/h) were included strictly for the comprehensive baseline clinical characterization of the cohort and were not entered into the predictive regression models. Muscle mass was quantified via the appendicular skeletal muscle mass (ASMM); subsequently, the Skeletal Muscle Index (SMI) was computed by normalizing for height, weight and BMI.
As shown by literature, SMI was defined by cut-off:
- SMIH2: the diagnostic threshold of ≤7.87 kg/m² established by Gould et al. (2014) (Gould et al., 2014) to identify poor physical fitness,
- SMI100: Janssen et al. described the diagnostic threshold of 31 (Janssen et al., 2002),
- SMIBMI: Cawthon et al. showed an SMI < 0.789 as the cut-off criterion for identifying low appendicular muscle mass in men (Cawthon et al., 2014).
2.4.2. Cardiopulmonary Exercise Testing (CPET)
Cardiopulmonary Exercise Testing (CPET) (Guazzi et al., 2012) was conducted using an electronically braked cycle ergometer (Ergoline) paired with a breath-by-breath metabolic cart (Quark CPET, COSMED, Italy) under standardized environmental conditions (18–24 °C, 30–60% humidity). After a 3-minute unloaded warm-up at 50 rpm, an individualized ramp protocol (60–80 rpm) was applied to achieve volitional exhaustion within 8–12 minutes. Maximal exertion was verified by at least two of the following criteria (Ney et al., 2016): respiratory exchange ratio (RER) > 1.10, a heart rate > 85% of the age-predicted maximum, and a plateau in oxygen consumption (VO2).
Continuous 12-lead ECG and pulse oximetry were recorded throughout the test. Peak oxygen consumption (VO2 peak) was defined as the highest VO2 achieved during exercise (ml/kg/min). Additionally, oxygen pulse (VO2/HR)—a surrogate marker of stroke volume and peripheral extraction efficiency—was calculated along with ventilatory equivalents. A threshold of VO2/HR < 13.5 mL/beat was adopted as the diagnostic cut-off for low physical fitness, according to Laukkanen et al. (Laukkanen et al., 2006). The anaerobic threshold was determined using the V-slope and ventilatory equivalent methods. Finally, the VO₂/workload slope was calculated to assess cardiovascular efficiency.
2.4.3. Musculoskeletal Ultrasound
Real-time B-mode ultrasonography (MyLab XP8, Esaote, Florence, Italy) equipped with a 4–15 MHz linear array transducer was utilized to assess rectus femoris (RF) architectural properties. All assessments were conducted with participants resting in a relaxed supine position with knees fully extended. To prevent tissue compression and muscle deformation, a generous layer of water-soluble acoustic gel was applied, maintaining perpendicular transducer alignment relative to the longitudinal axis of the thigh with minimal contact pressure. Image acquisition was standardized at the junction of the lower one-third and upper two-thirds of the distance between the anterior superior iliac spine and the superior border of the patella. Quantification of RF muscle architecture was performed on frozen images using digital calipers to derive the following structural parameters (Gagliardi et al., 2025):
- Cross-sectional area (RF CSA, cm²): Quantified by manual tracing along the inner hyperechoic epimysial boundary of the RF muscle.
- Muscle circumference (RFC, mm): Calculated as the total perimeter length of the traced RF CSA.
- Muscle thickness (RFT, mm): Measured as the maximum anteroposterior linear distance between the superficial and deep aponeuroses.
2.5. Statistical Analysis
Continuous variables were tested for normality using the Shapiro-Wilk test and presented as mean ± standard deviation (SD) for normally distributed data. Pearson correlation coefficients were calculated to assess linear relationships between the three types of SMI and cardiopulmonary and muscle ultrasound parameters.
To identify the evaluation of SMIH2, SMI100, SMIBMI in predicting cardiopulmonary performance hierarchical multiple linear regression analyses were conducted: RF CSA was entered in Model 1, followed by the addition of the specific SMI metric in Model 2. The incremental predictive contribution of each SMI variant was evaluated using the change in the coefficient of determination (ΔR²). Multicollinearity was systematically ruled out using the Variance Inflation Factor (VIF < 5.0). Subsequently, variables demonstrating statistically significant associations (p < 0.05), by Mann-Whitney test, in the univariable analysis were included in Receiver Operating Characteristic (ROC) curve analyses to evaluate their discriminative capacity, quantified by the Area Under the Curve (AUC). Optimal SMI cut-off thresholds for predicting functional decline were identified for each SMI by maximizing the Youden index. Statistical significance was set at two-tailed p < 0.05 for all analyses. Statistical processing was conducted using IBM SPSS Statistics 27.0® (IBM Corp., Armonk, NY, USA, 2020).
3. Results
A total of 32 male LT recipients, with a mean age of 61.03 ± 8.53 years, were included in the final analysis, who were described by Table 1.
The Pearson correlation matrix exhibits a correlation among variables in study: VO2/HR significantly correlates with SMIH2 and SMIBMI, as well as VO2/Workload correlates with SMI100 and SMIBMI.

Table 2.
Pearson correlation matrix between SMI variables, ultrasound parameters and CPET variables.
Table 2.
Pearson correlation matrix between SMI variables, ultrasound parameters and CPET variables.
| SMIH2 | SMI100 | SMIBMI | |
|---|---|---|---|
| RFT (mm) | 0.254 | -0.066 | 0.026 |
| RFC (cm) | 0.344 | 0.130 | 0.259 |
| RF CSA (cm2) | 0.444* | 0.105 | 0.237 |
| VO2/Kg (ml/Kg/min) | 0.131 | 0.336 | 0.266 |
| VO2/HR (ml/bpm) | 0.499** | 0.297 | 0.447* |
| Ve/VCO2 (l/min) | -0.234 | 0.255 | 0.208 |
| VO2/Workload (ml/min/W) | 0.004 | -0.379* | -0.482** |
Legend: * p < 0.05; ** p < 0.01; *** p < 0.001. RF: Rectus Femoris; RFT: Rectus Femoris Thickness; RFC: Rectus Femoris Circumference; CSA: Cross-Sectional Area; VO2 Peak: Maximal oxygen uptake; VO2/HR: Oxygen pulse; VE/VCO2: Ventilatory equivalent for carbon dioxide; VO2/Workload: Oxygen uptake per watt; * Statistically significant.
To determine which SMI metric served as the strongest independent predictor of oxygen pulse VO2/HR, a hierarchical multiple linear regression analysis was conducted, sequentially incorporating different SMI index formulations alongside relevant ultrasound covariates.
Hierarchical multiple linear regression analyses demonstrated that incorporating SMI metrics into the baseline model (Model 1, R² = 0.195) significantly enhanced the explained variance of oxygen pulse (VO2/HR). Specifically, SMIBMI provided the largest and most significant incremental contribution to the prediction of VO2/HR (ΔR² = 0.099, p = 0.033), followed by SMIH2 (ΔR² = 0.084, p = 0.046). Conversely, the inclusion of SMI100 did not significantly improve model fit (ΔR² = 0.038, p = 0.131), identifying SMIBMI as the strongest independent predictor of oxygen pulse among the evaluated metrics (Table 3).
Prior to evaluating predictive accuracy using Receiver Operating Characteristic (ROC) curve analysis, LT recipients were stratified according to cardiopulmonary efficiency based on the established oxygen pulse threshold (VO2/HR < 13.5 mL/beat). In the Mann-Whitney U test, SMI100 failed to demonstrate a statistically significant difference between groups (p = 0.087), precluding its inclusion in subsequent threshold identification analyses. Conversely, both SMIBMI and SMIH2 exhibited good discriminative capacity for impaired cardiopulmonary reserve, achieving Areas Under the Curve (AUC) greater than 0.70. Specifically, SMIH2 demonstrated an AUC of 0.791 (p = 0.009), while SMIBMI achieved an AUC of 0.755 (p = 0.022). To optimize clinical screening, high-sensitivity cut-off thresholds were derived using Youden’s index:
- SMIBMI: An optimal screening threshold of 0.802 yielded 100.0% sensitivity and 45.0% specificity for detecting reduced VO2/HR.
- SMIH2: An optimal screening threshold of 6.89 kg/m² yielded 100.0% sensitivity and 45.0% specificity.
4. Discussion
Our findings demonstrate that the choice of normalization strategy fundamentally influences both clinical interpretation and predictive accuracy in this specific patient population. Specifically, SMIBMI and SMIH2 emerged as superior independent predictors of oxygen pulse, whereas SMI100 failed to offer significant predictive or discriminative capacity. Furthermore, we established population-specific, high-sensitivity receiver operating characteristic-derived SMI cut-off thresholds to accurately identify liver transplant recipients at risk of impaired cardiopulmonary reserve.
In our study, the Pearson correlation matrix revealed moderate correlations between height- and BMI-adjusted skeletal muscle indices (SMIH2—SMIBMI) and both structural muscle and cardiopulmonary variables. This interrelationship likely stems from the strong influence of the skeletal muscle index on both domains. As shown by (Arai et al., 2023) loss of SMI and muscle weakness are core diagnostic criteria for sarcopenia (Sánchez-Rodríguez et al., 2014). Furthermore, (Sugie et al., 2017) demonstrated a clear link among muscle wasting, exercise intolerance, and deteriorating cardiac function.
Although SMI metrics are frequently used interchangeably in clinical literature, they represent distinct physiological constructs that perform differently in populations with altered body composition. In our cohort, hierarchical linear regression revealed that adding SMIBMI to the baseline model containing RF CSA yielded the largest and most statistically significant incremental contribution to predicting oxygen pulse. SMIH2 also provided a statistically significant incremental contribution to the explained variance, whereas the inclusion of SMI100 did not significantly improve model fit. The superior performance of SMIBMI aligns with recommendations from the Foundation for the National Institutes of Health (Cawthon et al., 2014), which advocate for normalizing appendicular muscle mass to body mass index rather than height alone, particularly in cohorts characterized by sarcopenic obesity or metabolic derangements. These results contrast with those reported by (Sugie et al., 2017) where VO2/HR is described as a dependent variable and showed that SMI was the only independent determinant. Despite this, standardizing muscle mass by height squared scales muscle to stature but fails to account for total body mass and adiposity, potentially underestimating muscle depletion in overweight or obese patients. Moreover, SMI100 expresses muscle mass as a percentage of total body weight, making it highly susceptible to confounding by body fat accumulation and fluid retention, both of which are common in liver disease. This explains why SMI100 failed to demonstrate statistically significant differences between low and healthy oxygen pulse groups in non-parametric group comparisons. The pathophysiological connection between skeletal muscle indices, sonographic muscle metrics, and CPET parameters provides valuable insights into exercise intolerance post-LT. VO2/HR serves as an integrative surrogate for stroke volume and peripheral arteriovenous oxygen extraction capacity (Guazzi et al., 2017; Laukkanen et al., 2006). In chronic liver disease, persistent inflammation, hyperammonaemia, and physical deconditioning drive both structural muscle atrophy and peripheral microvascular or mitochondrial dysfunction (Miarka et al., 2021; Sogbe et al., 2026). Our findings indicate that local muscular architecture (RF CSA) and systemic lean mass (SMIBMI/SMIH²) exert complementary effects on functional capacity. While RF CSA captures local quadriceps wasting (de Luis Roman et al., 2024; Gagliardi et al., 2025), SMIBMI provides a global measure of metabolic oxygen sink capacity. Furthermore, the inverse correlations observed between relative muscle metrics and VO2/Workload (Table 2) reflect mechanical inefficiency: patients with lower relative muscle mass require higher oxygen cost per watt generated, reflecting reduced submaximal work efficiency secondary to sarcopenic deconditioning. To translate these findings into clinical practice, we derived ROC cut-off thresholds for predicting impaired cardiopulmonary reserve (VO2/HR < 13.5 mL/beat). In non-parametric ROC analyses, both SMIH² (AUC = 0.791) and SMIBMI (AUC = 0.755) demonstrated robust discriminative performance. Using Youden’s index to prioritize sensitivity, optimal screening cut-offs were identified at SMIBMI ≤ 0.802 and SMIH² ≤ 6.89 kg/m², both achieving 100.0% sensitivity. It is important to emphasize that while these identified thresholds achieve 100.0% sensitivity, they exhibit a moderate specificity of 45.0%. This design is clinically deliberate: these values are conceptualized as high-sensitivity screening tools rather than rigid diagnostic cut-offs. In routine outpatient practice, prioritizing maximum sensitivity eliminates false negatives, ensuring that any patient with potential cardiopulmonary impairment is captured and prioritized for secondary confirmatory CPET evaluation. Standard diagnostic cut-offs for sarcopenia (e.g., SMIBMI < 0.789 by FNIH or SMIH² ≤ 7.87 kg/m² by (Gould et al., 2014)) were originally developed to detect overt muscle weakness or mortality risk in general geriatric populations (Cawthon et al., 2014; Gould et al., 2014). In contrast, our derived cut-offs are tailored specifically for LT recipients as early clinical decision limits. A threshold with 100% sensitivity ensures that no patient with underlying cardiopulmonary impairment is missed during routine outpatient screening, allowing clinicians to flag high-risk candidates for comprehensive CPET evaluation and targeted exercise rehabilitation programs.
Strength and Limitation
This study possesses several key strengths. To our knowledge, this study represents the first head-to-head comparative evaluation of three distinct SMI normalization methods (SMIH2, SMI100, and SMIBMI) in predicting integrative cardiopulmonary performance and local muscle architecture in male liver transplant recipients. By integrating gold-standard CPET parameters with quadriceps muscle ultrasound and BIVA under strictly standardized conditions, our protocol captured a comprehensive functional and structural profile. Furthermore, our high-sensitivity cut-offs provide clinicians with practical, reliable screening tools to identify recipients at risk of cardiopulmonary impairment. Nevertheless, several limitations must be acknowledged. Although the sample size (N = 32) is relatively small, this reflects the rare clinical nature of the population and the strict inclusion criteria of capturing stable post-liver transplant recipients specifically at the onset of a prescribed exercise program. Additionally, the cross-sectional design precludes establishing causal relationships between muscle depletion and exercise intolerance, and skeletal muscle mass was estimated via BIA rather than CT or DXA imaging. Prospective, multi-centre studies in larger, gender-balanced cohorts are warranted to validate these preliminary thresholds
5. Conclusion
In conclusion, SMI normalization strategies are not clinically interchangeable when predicting cardiopulmonary efficiency in male liver transplant recipients. SMIBMI and SMIH² demonstrate superior predictive validity for oxygen pulse compared to SMI100, with SMIBMI offering the highest incremental explanatory value over local muscle ultrasound metrics. Integrating RF CSA with SMIBMI or SMIH² provides a robust, non-invasive assessment of functional reserve. The derived high-sensitivity screening cut-offs (SMIBMI ≤ 0.802 and SMIH² ≤ 6.89 kg/m²) offer practical clinical decision limits to identify recipients at risk of exercise intolerance and guide early referral to targeted exercise prescription programs.
Author Contributions
Conceptualization, E.L.R, G.M.; methodology, E.L.R., L.S., M.C.; validation, F.M., S. G.; formal analysis, E.L.R.; investigation, M.C., E.L.R., L.S.; data curation, M.C., E.L.R.; visualization, M.B., C.F.; supervision, G.M, L.S.; draft the manuscript, E.L.R., G.M. All authors have read, reviewed and agreed to the published version of the manuscript.
Funding
Fondazione Ciani Passeri Carraresi funds E.L.R.’s Ph.D. Scholarship.
Institutional Review Board Statement
The study was conducted in accordance with the Declaration of Helsinki and approved by the Ethics Committee of the Area vasta centro, granted ethical approval for this study (Ethical Approval Code: 31603, dated 22 September 2026).
Informed Consent Statement
Informed consent was obtained from all subjects involved in the study.
Data Availability Statement
The data that support the findings of this study are available from the corresponding author upon reasonable request.
Conflicts of Interest
The authors declare no conflicts of interest.
References
- Arai, H.; Nozoe, M.; Kamiya, K.; Matsumoto, S.; Morimoto, T. Association Between Skeletal Muscle Mass Index and Falls in Patients With Functional Impairment. American Journal of Physical Medicine & Rehabilitation 2023, 102(10), 913–918. [Google Scholar] [CrossRef]
- Cawthon, P. M.; Peters, K. W.; Shardell, M. D.; McLean, R. R.; Dam, T.-T. L.; Kenny, A. M.; Fragala, M. S.; Harris, T. B.; Kiel, D. P.; Guralnik, J. M.; Ferrucci, L.; Kritchevsky, S. B.; Vassileva, M. T.; Studenski, S. A.; Alley, D. E. Cutpoints for low appendicular lean mass that identify older adults with clinically significant weakness. The Journals of Gerontology. Series A, Biological Sciences and Medical Sciences 2014, 69(5), 567–575. [Google Scholar] [CrossRef]
- Cruz-Jentoft, A. J.; Bahat, G.; Bauer, J.; Boirie, Y.; Bruyère, O.; Cederholm, T.; Cooper, C.; Landi, F.; Rolland, Y.; Sayer, A. A.; Schneider, S. M.; Sieber, C. C.; Topinkova, E.; Vandewoude, M.; Visser, M.; Zamboni, M. & Writing Group for the European Working Group on Sarcopenia in Older People 2 (EWGSOP2), and the Extended Group for EWGSOP2. (2019). Sarcopenia: Revised European consensus on definition and diagnosis. Age and Ageing 48(1), 16–31. [CrossRef]
- Dasarathy, S.; Merli, M. Sarcopenia from mechanism to diagnosis and treatment in liver disease. Journal of Hepatology 2016, 65(6), 1232–1244. [Google Scholar] [CrossRef]
- de Luis Roman, D.; García Almeida, J. M.; Bellido Guerrero, D.; Guzmán Rolo, G.; Martín, A.; Primo Martín, D.; García-Delgado, Y.; Guirado-Peláez, P.; Palmas, F.; Tejera Pérez, C.; García Olivares, M.; Maíz Jiménez, M.; Bretón Lesmes, I.; Alzás Teomiro, C. M.; Guardia Baena, J. M.; Calles Romero, L. A.; Prior-Sánchez, I.; García-Luna, P. P.; González Pacheco, M.; …; Olveira, G. Ultrasound Cut-Off Values for Rectus Femoris for Detecting Sarcopenia in Patients with Nutritional Risk. Nutrients 2024, 16(11), 1552. [Google Scholar] [CrossRef]
- Ebadi, M.; Bhanji, R. A.; Mazurak, V. C.; Montano-Loza, A. J. Sarcopenia in cirrhosis: From pathogenesis to interventions. Journal of Gastroenterology 2019, 54(10), 845–859. [Google Scholar] [CrossRef]
- Gagliardi, R.; Campadello, P.; Brocco, S.; Barone, A.; Incicco, S.; Calvino, V.; Sikadi, B.; Tonon, M.; Gambino, C. G.; Zeni, N.; De Conti, G.; Giraudo, C.; Bolognesi, M.; Angeli, P.; Piano, S. Rectus femoris ultrasound identifies sarcopenia and predicts poor outcomes in patients with acute decompensation of cirrhosis. JHEP Reports: Innovation in Hepatology 2025, 7(11), 101564. [Google Scholar] [CrossRef]
- Gould, H.; Brennan, S. L.; Kotowicz, M. A.; Nicholson, G. C.; Pasco, J. A. Total and appendicular lean mass reference ranges for Australian men and women: The Geelong osteoporosis study. Calcified Tissue International 2014, 94(4), 363–372. [Google Scholar] [CrossRef]
- Guazzi, M.; Adams, V.; Conraads, V.; Halle, M.; Mezzani, A.; Vanhees, L.; Arena, R.; Fletcher, G. F.; Forman, D. E.; Kitzman, D. W.; Lavie, C. J.; Myers, J.; EACPR; AHA. EACPR/AHA Joint Scientific Statement. Clinical recommendations for cardiopulmonary exercise testing data assessment in specific patient populations. European Heart Journal 2012, 33(23), 2917–2927. [Google Scholar] [CrossRef]
- Guazzi, M.; Bandera, F.; Ozemek, C.; Systrom, D.; Arena, R. Cardiopulmonary Exercise Testing: What Is its Value? Journal of the American College of Cardiology 2017, 70(13), 1618–1636. [Google Scholar] [CrossRef]
- Janssen, I.; Heymsfield, S. B.; Ross, R. Low relative skeletal muscle mass (sarcopenia) in older persons is associated with functional impairment and physical disability. Journal of the American Geriatrics Society 2002, 50(5), 889–896. [Google Scholar] [CrossRef]
- Kokkinos, P.; Faselis, C.; Samuel, I. B. H.; Pittaras, A.; Doumas, M.; Murphy, R.; Heimall, M. S.; Sui, X.; Zhang, J.; Myers, J. Cardiorespiratory Fitness and Mortality Risk Across the Spectra of Age, Race, and Sex. Journal of the American College of Cardiology 2022, 80(6), 598–609. [Google Scholar] [CrossRef]
- Kyle, U. G.; Bosaeus, I.; De Lorenzo, A. D.; Deurenberg, P.; Elia, M.; Gómez, J. M.; Heitmann, B. L.; Kent-Smith, L.; Melchior, J.-C.; Pirlich, M.; Scharfetter, H.; Schols, A. M. W. J.; Pichard, C.; Composition of the ESPEN Working Group. Bioelectrical impedance analysis--part I: Review of principles and methods. Clinical Nutrition 2004, 23(5), 1226–1243. [Google Scholar] [CrossRef]
- Kyle, U. G.; Bosaeus, I.; De Lorenzo, A. D.; Deurenberg, P.; Elia, M.; Manuel Gómez, J.; Lilienthal Heitmann, B.; Kent-Smith, L.; Melchior, J.-C.; Pirlich, M.; Scharfetter, H.; Schols, M W J; Pichard, A.; ESPEN, C. Bioelectrical impedance analysis-part II: Utilization in clinical practice. Clinical Nutrition 2004, 23(6), 1430–1453. [Google Scholar] [CrossRef]
- Laukkanen, J. A.; Kurl, S.; Salonen, J. T.; Lakka, T. A.; Rauramaa, R. Peak oxygen pulse during exercise as a predictor for coronary heart disease and all cause death. Heart 2006, 92(9), 1219–1224. [Google Scholar] [CrossRef]
- Miarka, M.; Gibiński, K.; Janik, M. K.; Główczyńska, R.; Zając, K.; Pacho, R.; Raszeja-Wyszomirska, J. Sarcopenia-The Impact on Physical Capacity of Liver Transplant Patients. Life 2021, 11(8), 740. [Google Scholar] [CrossRef]
- Ney, M.; Haykowsky, M. J.; Vandermeer, B.; Shah, A.; Ow, M.; Tandon, P. Systematic review: Pre- and post-operative prognostic value of cardiopulmonary exercise testing in liver transplant candidates. Alimentary Pharmacology & Therapeutics 2016, 44(8), 796–806. [Google Scholar] [CrossRef]
- Nwosu, A. C.; Mayland, C. R.; Mason, S.; Cox, T. F.; Varro, A.; Stanley, S.; Ellershaw, J. Bioelectrical impedance vector analysis (BIVA) as a method to compare body composition differences according to cancer stage and type. Clinical Nutrition ESPEN 2019, 30, 59–66. [Google Scholar] [CrossRef]
- Piccoli, A.; Rossi, B.; Pillon, L.; Bucciante, G. A new method for monitoring body fluid variation by bioimpedance analysis: The RXc graph. Kidney International 1994, 46(2), 534–539. [Google Scholar] [CrossRef]
- Riebe, D.; Magal, M.; Kaminsky, L. A.; Ross, R.; Phillips, S. M.; Alhassan, S.; Arena, R.; Behm, D. G.; Camhi, S. M.; Church, T. S.; Evans, E. M.; Feito, Y.; Faigenbaum, A. D.; Heymsfield, S. B.; Hillman, C. H.; Jankowski, C. M.; Konrad, A.; Liguori, G.; Robinson, L. E.; …; Garber, C. E. The Components of Physical Fitness: A Roundtable Statement by the American College of Sports Medicine. Medicine and Science in Sports and Exercise 2026, 58(8), 1827–1850. [Google Scholar] [CrossRef]
- Sánchez-Rodríguez, D.; Marco, E.; Miralles, R.; Fayos, M.; Mojal, S.; Alvarado, M.; Vázquez-Ibar, O.; Escalada, F.; Muniesa, J. M. Sarcopenia, physical rehabilitation and functional outcomes of patients in a subacute geriatric care unit. Archives of Gerontology and Geriatrics 2014, 59(1), 39–43. [Google Scholar] [CrossRef]
- Sogbe, M.; Park, S. W.; Bromfield, B.; Tellez, R.; Hughes, C. B.; Ruiz-Margáin, A.; Duarte-Rojo, A. Inflammatory spectrum of frailty: Association between the systemic immune-inflammation index and frailty in liver transplant candidates. European Journal of Internal Medicine 2026, 146, 106687. [Google Scholar] [CrossRef]
- Sugie, M.; Harada, K.; Takahashi, T.; Nara, M.; Ishikawa, J.; Koyama, T.; Kim, H.; Tanaka, J.; Fujimoto, H.; Obuchi, S.; von Haehling, S.; Kyo, S.; Ito, H. Relationship between skeletal muscle mass and cardiac function during exercise in community-dwelling older adults. ESC Heart Failure 2017, 4(4), 409–416. [Google Scholar] [CrossRef]
- Tsien, C.; Garber, A.; Narayanan, A.; Shah, S. N.; Barnes, D.; Eghtesad, B.; Fung, J.; McCullough, A. J.; Dasarathy, S. Post-liver transplantation sarcopenia in cirrhosis: A prospective evaluation. Journal of Gastroenterology and Hepatology 2014, 29(6), 1250–1257. [Google Scholar] [CrossRef]
- von Elm, E.; Altman, D. G.; Egger, M.; Pocock, S. J.; Gøtzsche, P. C.; Vandenbroucke, J. P.; STROBE Initiative. The Strengthening the Reporting of Observational Studies in Epidemiology (STROBE) Statement: Guidelines for reporting observational studies. International Journal of Surgery 2014, 12(12), 1495–1499. [Google Scholar] [CrossRef]
- Yuan, S.; Larsson, S. C. Epidemiology of sarcopenia: Prevalence, risk factors, and consequences. Metabolism: Clinical and Experimental 2023, 144, 155533. [Google Scholar] [CrossRef]
Figure 1.
ROC curve for detecting optimal cut-off threshold (Youden Index) for SMIBMI, through VO2/HR.
Figure 1.
ROC curve for detecting optimal cut-off threshold (Youden Index) for SMIBMI, through VO2/HR.
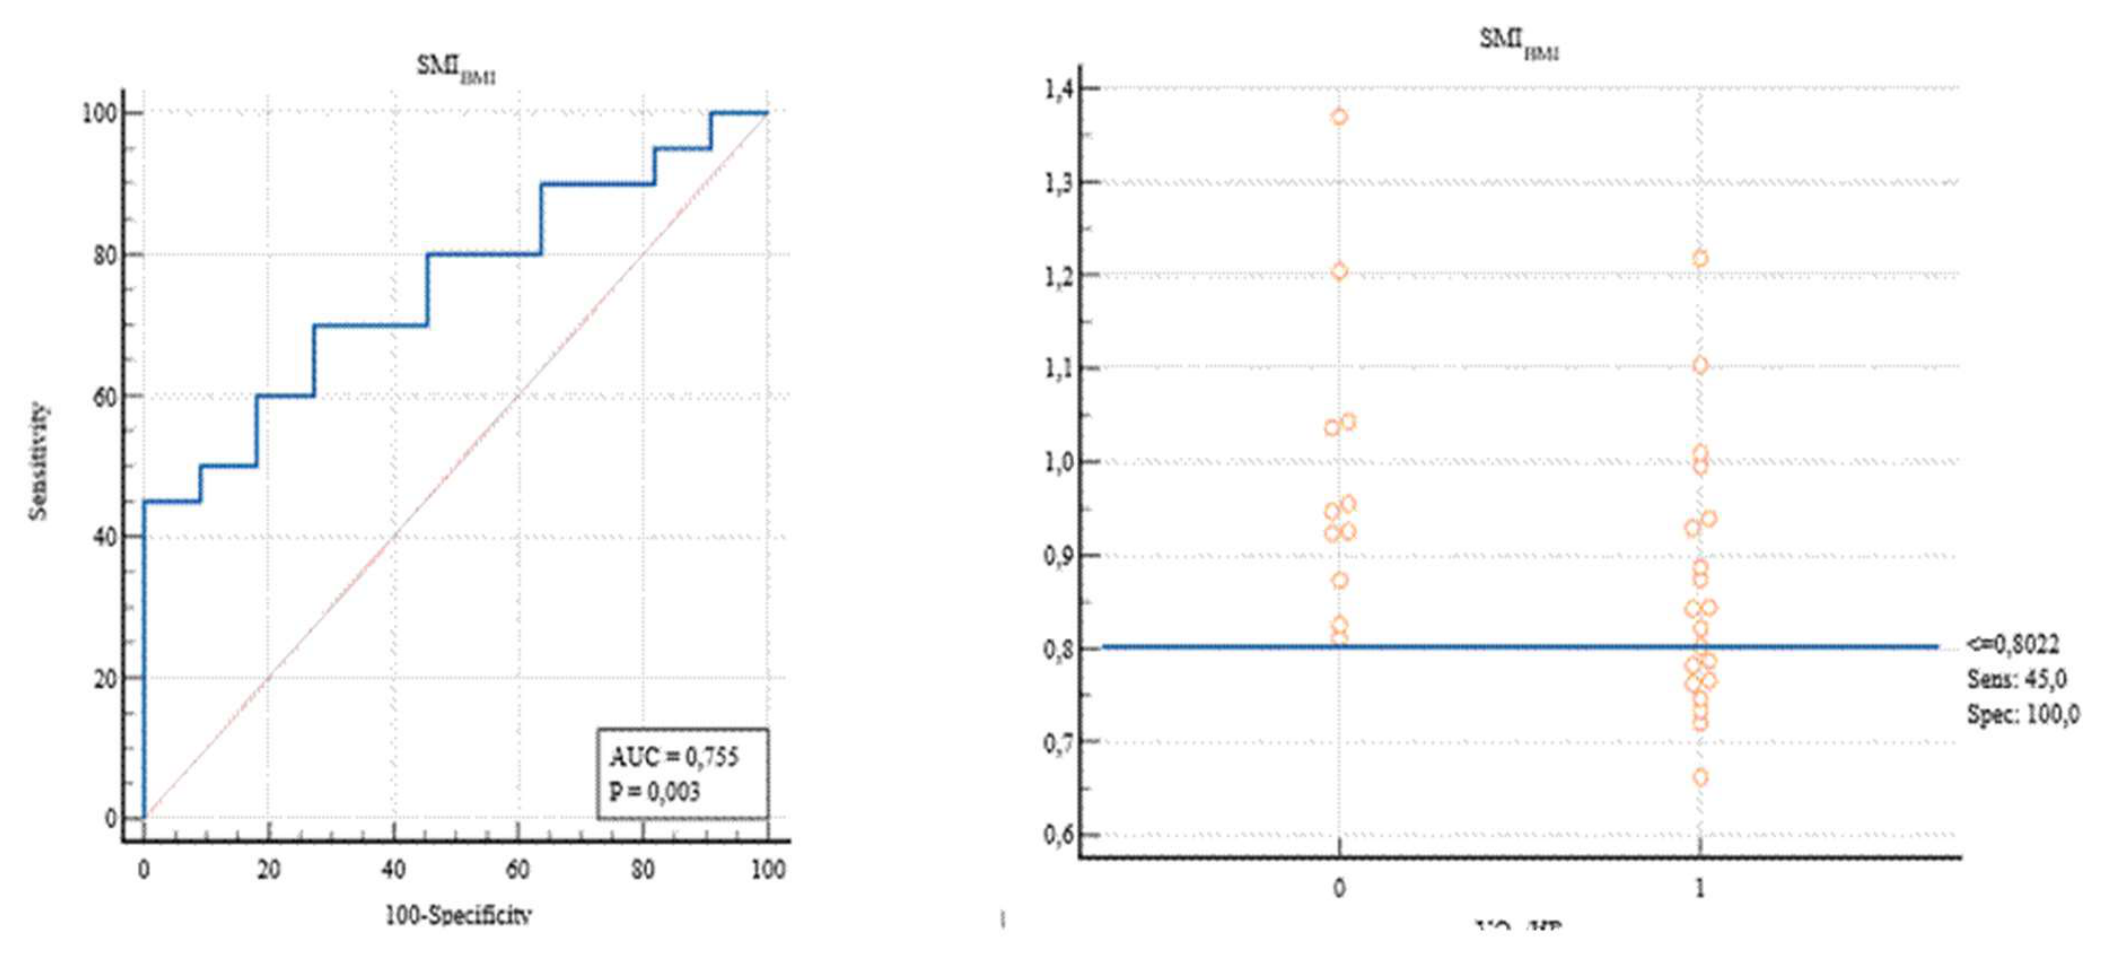
Figure 2.
ROC curve for detecting optimal cut-off threshold (Youden Index) for SMIH2, through VO2/HR.
Figure 2.
ROC curve for detecting optimal cut-off threshold (Youden Index) for SMIH2, through VO2/HR.
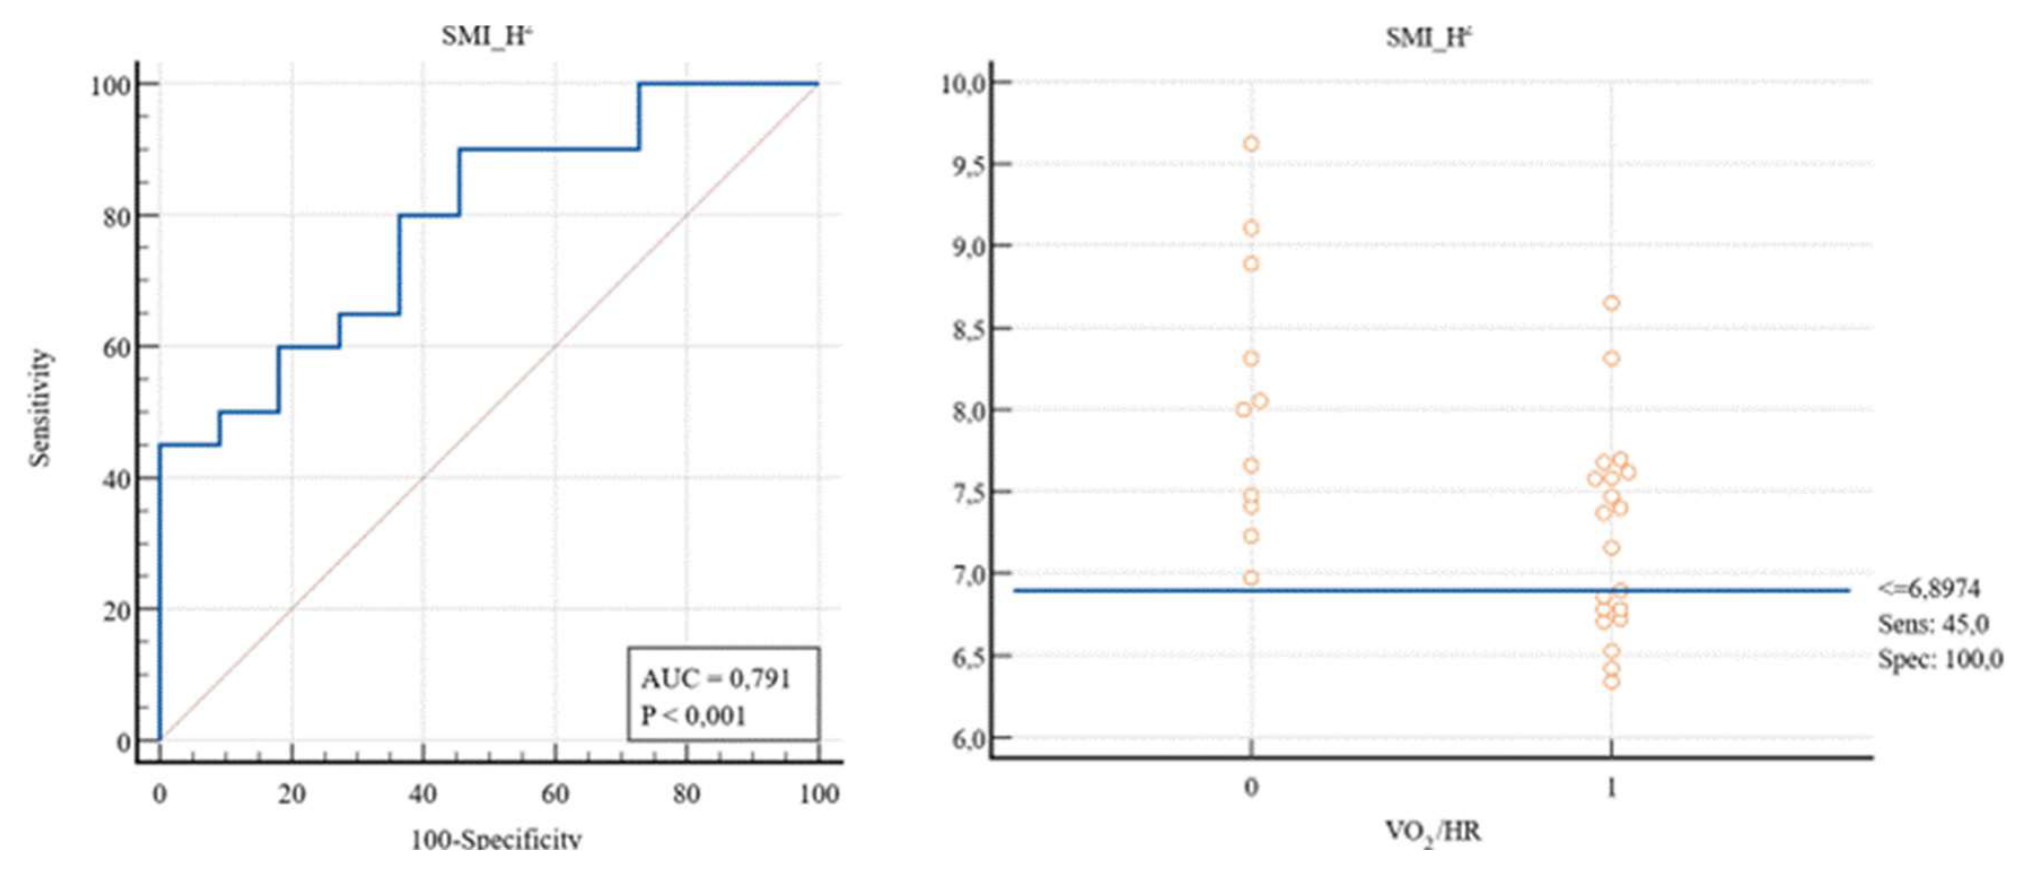
Table 1.
Liver transplant recipients descriptives table.
| Overall | |
|---|---|
| Height (cm) | 171.66 ± 6.28 |
| Weight (Kg) | 73.46 ± 9.39 |
| BMI (Kg/m2) | 24.95 ± 3.02 |
| SMIH2 | 7.52 ± 0.80 |
| SMI100 | 30.59 ± 4.15 |
| SMIBMI | 0.91 ± 0.16 |
| RFT (mm) | 9.88 ± 3.15 |
| RFC (cm) | 75.03 ± 16.49 |
| RF CSA (cm2) | 2.65 ± 1.27 |
| PhA (°) | 5.84 ± 0.40 |
| Rz/h (Ohm/h) | 295.48 ± 40.48 |
| Xc/h (Ohm/h) | 30.31 ± 5.88 |
| VO2 Peak (ml/Kg/min) | 24.88 ± 5.62 |
| VO2/HR (ml/bpm) | 13.12 ± 2.82 |
| Ve/VCO2 (l/min) | 38.23 ± 5.90 |
Table 3.
Hierarchical regression analysis: predictive contribution of SMI indices to VO2/HR.
| SMI Variables | Model 1 R² | Model 2 R² | ΔR² | P-Value |
|---|---|---|---|---|
| SMIH2 | 0.195 | 0.279 | 0.084 | 0.046 |
| SMI100 | 0.195 | 0.233 | 0.038 | 0.131 |
| SMIBMI | 0.195 | 0.294 | 0.099 | 0.033 |
Disclaimer/Publisher’s Note: The statements, opinions and data contained in all publications are solely those of the individual author(s) and contributor(s) and not of MDPI and/or the editor(s). MDPI and/or the editor(s) disclaim responsibility for any injury to people or property resulting from any ideas, methods, instructions or products referred to in the content. |
© 2026 by the authors. Licensee MDPI, Basel, Switzerland. This article is an open access article distributed under the terms and conditions of the Creative Commons Attribution (CC BY) license (http://creativecommons.org/licenses/by/4.0/).
Copyright: This open access article is published under a Creative Commons CC BY 4.0 license, which permit the free download, distribution, and reuse, provided that the author and preprint are cited in any reuse.