

Submitted:
06 November 2026
Posted:
10 November 2026
You are already at the latest version
Abstract
A potential route to reducing material complexity in flexible packaging is to improve the oxygen barrier of polyethylene (PE)-based films. This study investigated the influence of ethylene-glycidyl-methacrylate copolymer (EGMA) on the structure and properties of low-density PE (LDPE) composites containing montmorillonite (MMT). Eight formulations containing, 0, 3,5 or 7 wt.%, with or without 10 wt.% EGMA, were produced via melt compounding. Microstructural analysis, density, thermal behaviour, surface wettability, tensile properties and oxygen permeation were evaluated. EGMA reduced the volume fraction of large MMT agglomerates by approximately 52-73% though localised clay-rich regions persisted. Oxygen barrier performance varied in a non-monotonical fashion with respect to formulation. LDPE containing a 5 wt.% MMT loading without the inclusion of EGMA compatibiliser exhibited the lowest permeation value, displaying a 25.1% reduction compared to neat LDPE. Within the EGMA-containing formulations, the best barrier performance was shown for a 3 wt.% loading, noting a 12% reduction compared to neat LDPE. There was no substantial impact on the tensile strength of composite samples regardless of loading level though higher MMT loadings generally increased modulus while reducing elongation. All measured densities remained below 0.97 cm3 in line with RecyClass guidelines. These findings show that EGMA improves large-scale MMT dispersion but does not consistently enhance barrier performance with the uncompatibilised 5 wt.% MMT formulation showing the most favourable combination of oxygen barrier and retained tensile properties.
Keywords:
polyethylene
; organoclay
; recyclability
; flexible packaging
; MMT
1. Introduction
1.1. Global Packaging Context (Waste Issues, Waste Hierarchy)
The ever-increasing production and consumption of plastic products presents significant challenges for resource management and environmental sustainability. Under the Organisation for Economic Co-operation and Development (OECD) baseline scenario whereby no further policy interventions are assumed, globally plastic usage is expected to increase to 1,231 million tonnes by 2060 [1]. Transportation, construction and packaging, which together contribute to 60% of plastics use, are expected to contribute significantly to this increase though packaging in particular accounts for 40% of worldwide plastic use, making it the single largest plastic production market [2]. Packaging is of particular relevance to waste prevention as it has a relatively short service life which in turn results in rapid transition from production to disposal. As such, improvements in both the design of packaging structures and end-of-life (EoL) management are necessary to reduce the environmental pressure associated with increased consumption of plastics. The waste hierarchy provides a foundational framework for how to address these pressures by prioritising reducing waste, reuse, recycling and recovery over controlled or unregulated disposal [3,4]. Within this framework, recycling acts complementary with measures to reduce overall material consumption whilst extending product use. For packaging, however, reduction in material usage must coincide with retention of the protective functionality of the packaging structure. Reducing overall structure complexity or structure thickness is only beneficial when the newly designed structure can continue to provide adequate performance during handling, storage and distribution.
The current packaging sector is dominated by petroleum plastics owing to their material properties such as lightweight nature, durability, processability and within the context of food packaging, capable of delivering exceptional barrier properties. Unfortunately, though most petroleum plastics used for packaging are recyclable via mechanical recycling methods, only 14% of plastic packaging is actually collected for recycling with the collected material conventionally downcycled into lower-grade applications [5]. Though mechanical recycling is an industrially established method for the reprocessing of plastic packaging, flexible packaging films present specific challenges due to its reduced thickness and low bulk density [6] which complicates both collection and transportation. Similarly, the complex mixture of various polymers, inks, adhesives and residual contents may reduce the quality of the recyclate [7]. Often this has resulted in flexible packaging waste mainly being discarded via landfill or incineration [8,9]. The multilayer structure of most conventional packaging films aims to combine materials with complementary properties within a single structure as the individual components themselves do not meet the specific functionalities required. Polyethylene (PE), for example provides excellent flexibility, moisture resistance and a heat-sealable surface but does not provide sufficient barrier properties for oxygen (O2) transmission thus necessitating the addition of a barrier layer, commonly provided by ethylene vinyl alcohol (EVOH) [10,11,12,13,14]. Combining these differing materials allows for the final packaging performance to be tailored to meet the intended final application that cannot be met by an individual polymer alone. The resulting material complexity however also complicates material recovery. Recycling of multilayered structures often requires separation of the constituent polymers rather than directly reprocessing as a homogeneous material. Walker et al. showed the potential to recover PE, EVOH and polyethylene terephthalate (PET) from a commercially available multilayer film using solvent-based recovery and precipitation [15]. Similarly, Licht et al. demonstrated a solvent-assisted delamination process for recovery of PE and PET as distinct monomaterial films from a commercially available multilayer film [16]. Though it has clearly been demonstrated that this is a viable route for recovering otherwise difficult to reclaim materials, an alternative approach is to reduce the overall complexity of the structure at the design stage by improving the functional properties of the primary packaging polymer.
Low-density polyethylene (LDPE) represents an attractive matrix for this approach as it already has widespread use in flexible packaging. Its high flexibility, clarity, excellent tear strength and moisture resistance provide useful functionality in packaging structures [17] however its displays a high O2 transmission rate (OTR) which is detrimental for packaging perishable products [18]. Improvements in the OTR of LDPE could therefore broaden the use of LDPE-based films and reduce dependence on dissimilar barrier polymers in selected packaging structures. Incorporation of layered mineral fillers offers a mean to modify gaseous barrier properties within a polymer matrix [19,20] rather than introducing a separate barrier layer. Montmorillonite (MMT) has received growing attention as a barrier-improving filler. Its high aspect ratio and layered structure have been shown to decrease the O2 permeability of polymer films due to the generation of a tortuous diffusion path for permeating gas [21]. Golebiewski et al. produced blown films of LDPE/MMT and showed that the O2 permeability of the produced films was associated with the extent of exfoliation and platelet orientation of the incorporated clay [22]. The hydrophilic nature of unmodified MMT however limits its affinity with a non-polar material such as LDPE [23]. In general there exist two methods to improve the dispersibility of MMT clay within PE matrices; in-situ polymerisation [24,25] and melt-intercalation [26]. Melt-intercalation is currently considered the most desirable route for thermoplastic polymers whereby the clay layers are dispersed directly within the molten thermoplastic carrier by means of conventional melt-processing equipment utilising a compatibilising agent to match the polarity of the clay surface with the surrounding polymer melt [27]. Previously, homogenous dispersion of clay layers within a PE matrix was achieved with the addition of maleic-anhydride grafted PE (MA-g-PE) [28], however the introduction of maleic anhydride had detrimental effects on certain properties such as durability [29]. Zhong et al. showed this competing behaviour in PE-organoclay composite blown films containing MA-g-PE. It was found that incorporation of MA-g-PE weakened the O2 barrier properties of the films, especially so in the case of HDPE resulting from reduced compactness of the large side groups and increasing polarity of the MA-g-PE. However, with the inclusion of 5 wt.% of the organoclay the O2 barrier increased by 30% [30]. These results show that the benefit gained from the inclusion of the clay must be considered in tandem with the effect of the chosen compatibiliser itself.
Ethylene-glycidyl methacrylate copolymer (EGMA) offers a different compatibilisation route through the combination of ethylene segments and polar glycidyl methacrylate functionality. Chen et al. investigated the use of EGMA and MA-g-PE as compatibilisers to produce composites of recycled HDPE, recycled PET and organic clay. It was shown that of the two, EGMA exhibited the greatest polymer-clay miscibility, compatibility and flexural properties [31]. Minkova et al. additionally investigated EGMA with organically modified clays and showed the generation of intercalated structures. Subsequently, EGMA-clay masterbatches were incorporated into LDE and HDPE with the intercalated structure remaining post-inclusion. It was additionally suggested that the silicate platelets remain preferentially within the EGMA segments. For barrier properties this is of note as intercalation established polymer penetration between clay laers but it does not establish that platelets are distributed throughout the continuous PE phase [32].
The present work aims to investigate EGMA-containing LDPE-MMT films as a potential route towards improved O2 resistance in primarily PE-based packaging. The core objective is to evaluate the barrier response of this system and determine whether the use of EGMA provides a useful basis for further developing LDPE-MMT-based packaging films.
2. Experimental
2.1. Materials
Ethylene-glycidyl methacrylate copolymer (Lotader AX8840) was used as a compatibiliser (melt flow index of 5 g 10 min-1 (190 °C / 2.16 kg), density of 0.94 g cm-3). The matrix, Low Density Polyethylene (LDPE) (Lotrène FD0274), referred as PE from now on, had a melt flow index of 2.4 g 10 min-1 and a density of 0.923 g cm-3. The montmorillonite (MMT) used was Montmorillonite K 10, purchased from Merck.
2.2. Preparation of Nanocomposites
2.2.1. Melt-Compounding
As part of the DOE, the PE/EGMA/MMT nanocomposites were compounded with the formulations described in Table 1. All processing was completed on a Brabender Metastation 4E (Duisburg, Germany), where the PE was first extruded with EGMA and the PE/EGMA blend was then granulated and compounded with MMT. This extrusion was completed using a counter-rotating conical twin-screw with a temperature profile from barrel to nozzle of 120 °C, 130 °C, 140 °C, 150 °C, 150 °C and 150 °C, and a screw rotational speed of 100 rpm.
2.2.2. Injection Moulding
After compounding, the nanocomposite was granulated and prepared into tape and barbell samples. The tape samples were extruded through a Brabender Metastation 4E with a single-screw 19/25 D, a compression ratio of 2:1, and a 50 mm × 2 mm ribbon die. The temperature profile from barrel to nozzle of 120 °C, 130 °C, 140 °C, 150 °C, 150 °C and 150 °C, with a screw rotational speed of 20 rpm. The barbell samples were injection moulded using a Babyplast 6/12 injection moulding machine (Rambaldi, Italy) with a temperature profile of 140 °C, 150 °C and 150 °C and a shot size of 41 mm.
2.3. Fourier-Transform Infrared (FTIR) SPECTROSCOPY
Any chemical structure changes that occurred with the addition of EGMA and/or MMT were capture through FTIR. The FTIR measurements were carried out at 23±2 °C by a Nicolet iS20 FTIR spectrometer (ThermoFisher, Waltham, MA, USA). Spectra were obtained in the wavelength of 650-4000 cm-1 region and a scanning resolution of 4 cm-1.
2.4. Scanning Electron Microscopy (SEM)
SEM was preformed to capture any microstructure and morphology changes of the MMT dispersion with and without the addition of EGMA. Tape samples were subjected to a cryofracture process using liquid nitrogen, where the cross-section of the samples was examined. Samples were then placed onto sample holders using carbon tape and subsequently sputtered with gold using an Agar Sputter Coater with a current of 30 mA and sputter time of 55 s per run. The samples were double coated for a total sputter time of 110 s. The morphology was then investigated by a Mira SEM (TESCAN, Oxford Instruments, Cambridge, UK) with 20 kV voltage. After exposure to electron beam radiation in a vacuum condition, images of the samples were obtained at various magnifications. At a magnification of 1000× Energy Dispersive X-Ray (EDX) analysis was used to elementally map the distribution and dispersion of the composite.
2.5. Micro-Computed Tomography (μ-CT)
To visually capture the dispersion of the MMT and the percentage of agglomeration above 33.4 µm in size throughout the structure of the sample, μ-CT analysis was performed. The analysis was performed on Zeiss Metrotom 1 μ-CT scanner in high resolution mode. Volume scans were obtained with a sensitivity of 33.4 µm with volumes of each material determined and calculated as a percentage of the sample. Each sample was scanned stepwise using 2560 steps over a 360° rotation using a 160 kV Xray source, 0.5 AL beam filter and image acquisition of 600 ms. The samples measured were the barbell sample type V in accordance with ASTM D638-14, and were scanned in triplicate.
2.6. Density
Density measurements were performed to ensure the density of the material remained below the limits set by RecyClass for Natural PE Flexible Films of 0.97 g cm-3. The densities were measured based on the standard ASTM D 792 (Method A) using a Sartorius MC201P high sensitivity balance. The samples used for density measurements were the barbell sample type V in accordance with ASTM D638-14. The densities were calculated by measuring the samples in air to a precision of 0.1 mg, then measuring the samples suspended in deionised water at 23±2 °C, where an average of six specimens per batch was measured. The measured densities were compared to theoretically calculated density values using (1) and (2).
Where Mf1 is the mass fraction of one component, ρf1 is the literature reported density of the component and Vf1 is the volume fraction of the component
Where Mtot is the total mass fraction of the composite material, Vtot is the total volume fraction of the composite material and ρtheor is the theoretical density of the composite.
2.7. Differential Scanning Calorimetry (DSC)
DSC was used to investigate the changes in the chain mobility and crystallinity of PE by the addition of EGMA and MMT. The tests were carried out using a Polyma DSC 214 (Netzsch, Germany) at temperatures between -20 °C and 200 °C under a nitrogen atmosphere. Samples of 10±0.5 mg taken from the tape samples were used at a heating and cooling rate of 10 °C min-1 across three consecutive scans: heating, cooling, and heating. Tm1 and ∆Hm1 were recorded during the first heating cycle, and Tm2 and ∆Hm2 during the second. The Xc was calculated using (3).
Where ΔHm is the melting enthalpy of fusion, ΔHm* is the melting enthalpy of fusion for a theoretically 100% crystalline PE, accepted as 293 J g-1 [33] and φ is the mass fraction of MMT in the composites.
2.8. Surface Wettability
To determine the wettability of each composite, water contact angle measurements were carried out using the sessile drop method on the FTA1000 Analyzer System (First ten Angstroms, Virgina). A droplet (8-10μl) of deionised water at 23±2 °C was placed on the surface of the samples using a 3 ml syringe. The contact angle of the droplet was then recorded using the FTA software. The test was performed on five independent samples.
2.9. Mechanical Properties
Tensile testing was performed to assess the effect of EGMA and MMT addition on the mechanical properties of the PE matrix, specifically Young’s modulus, elongation at maximum, and stress at maximum. A Zwick/Roell Z010 universal testing machine with a 10 kN load cell and non-contacting video extensometer (ZwickRoell Ltd., Ulm, Germany) was used in accordance with ASTM D638-14. Type V dog bone specimens were tested at a crosshead speed of 10 mm min-1 with a gauge length of 50 mm (n=5).
2.10. Oxygen Permeability
The permeability of the composites was measured by oxygen transmission rate (OTR) to measure the effect of the introduction of EGMA and/or MMT to the PE matrix. The OTR measurements of the tapes were based on the standard ASTM D 3985, reporting values in cm3∙μm∙ m−2∙24h−1. The tests were performed at 0% RH (relative humidity) and 23 °C. As the width of the tape samples was not sufficient to completely cover the chamber, all measurements for OTR were performed with the surface reduction masks. The tape was enclosed within the aluminium masks and the testing surface was reduced from 50 cm2 to 2 cm2.
2.11. Statistical Analysis
A full factorial design of experiments (DOE) was employed to investigate the effects of MMT content (0, 3, 5 and 7 wt.%) and EGMA (0 and 10 wt.%) yielding eight formulation combinations. Statistical analysis was performed using Minitab® 21.2 (64-bit) for responses obtained from tensile testing, DSC, contact angle, density and OTR. Model fit was assessed using the coefficient of determination (R2). The statistical significance of main effects and interactions was evaluated at a 95% confidence level (P<0.005) with pareto charts used to visualize the standardized effects. Main effects and interaction plot were used to interpret statistically significant effects on the measured responses.
3. Results and Discussion
3.1. FTIR Spectroscopy
An overlay of all produced spectra is shown in Figure 1. In the PE/3NC, PE/5NC, and PE/7NC spectra, the dominant PE bands at 2915, 2850, 1462, and 720 cm−1 are retained without shift, confirming that no chemical reaction occurs between the apolar PE matrix and the MMT. The absence of new peaks, with existing peaks remaining unchanged, confirms that the mixing is purely a physical process. The MMT Si-O bands at 1040/1014 cm−1 [34] remain visible in the composites but appear to grow in relative intensity with increasing MMT loading, as expected for a higher filler content. The absence of any peak shift or new band formation in this series is consistent with the known thermodynamic incompatibility of unmodified, hydrophilic MMT with a non-polar polyethylene matrix, which limits intercalation and adhesion at the interface.
The introduction of EGMA introduces the carbonyl band at 1734 cm−1 [35], visible in the PE/EGMA spectrum and all PE/EGMA/NC variants. The FTIR absorption peak at ~1730 cm−1 is the most suitable band for identification of GMA content, assigned to the carbonyl stretching of the ester group. The 1734 cm−1 band persists in the PE/EGMA/NC composites without evidence of disappearance or strong shift. This suggests the epoxy groups of EGMA have not undergone extensive ring-opening reaction with the MMT surface hydroxyl groups under the processing conditions used. FTIR spectra of EGMA-containing blends have been used to confirm whether epoxy groups of EGMA have reacted with terminal hydroxyl groups, as ring-opening would result in loss of the characteristic epoxide signal. In the absence of surface modification on Montmorillonite K10, the hydroxyl surface sites may not be sufficiently accessible or reactive under melt extrusion conditions to drive significant covalent coupling with the epoxide [36].
The Si-O bands at 1040/1014 cm−1 appear more clearly defined in the PE/EGMA/NC series compared to the PE/NC series at equivalent MMT loadings. In LDPE/clay nanocomposites, a peak at ~1082 cm−1 has been assigned to Si-O stretching, with the clarity of this band reflecting the clay content and its state of dispersion within the matrix. The relative improvement in band definition in the EGMA-containing series may reflect improved MMT dispersion facilitated by EGMA acting as a compatibiliser, reducing agglomerate size and increasing interfacial contact area, which would make the clay signal more apparent in transmission mode [37].
The FTIR data confirm that no new covalent bonds are formed across any of the composites; all spectra represent a superposition of component bands. This is consistent with published findings on PE/clay systems where in FTIR spectra of LDPE/organoclay composites, characteristic PE peaks are retained alongside clay-associated bands, with no evidence of new chemical bonding [38]. The role of EGMA in this system therefore appears to be primarily physical compatibilisation, improving interfacial wetting and dispersion of MMT within the PE matrix rather than acting via reactive coupling, at least under the conditions applied.
3.2. Microstructure
The results for μ-CT analysis of the produced composites are shown pictorially in Figure 2 with the calculated volume fractions of MMT agglomerates ?33.4 μm shown in Table 2. For the non-compatibilised blends, the calculated volume fractions were 0.52, 0.47 and 1.13 vol% at the 3, 5 and 7 wt.% loadings respectively. The similar values at both 3 and 5 wt.% indicate little change in the volume occupied by larger agglomerates over this loading range, whereas at 7 wt.% there is a greater incidence of agglomerate formation. This effect of MMT agglomeration has previously been shown to occur in instances where the filler level increases beyond a 5 wt.% threshold [39,40]. The incorporation of EGMA compatibiliser meanwhile had a noticeable impact on the detectable MMT agglomerates and overall dispersion of the clay within the PE matrix. With values of 0.14, 0.21 and 0.54 vol% for the same loading levels these values correspond to a 73, 55 and 52% reduction in detectable volume fraction relative to equivalent non-compatibilised formulations.
The μ-CT analysis was further complemented by SEM and EDX mapping to examine the sample morphology and MMT distribution (Figure 3). As silicon is present in the MMT clay but not in the surrounding LDPE matrix or EGMA compatibiliser, it was used as an elemental marker [41]. The Si maps displayed dispersed signals alongside localised Si-rich regions, indicative of clay-rich clusters remaining in both sets of formulations. At the 5 wt.% loading of MMT without the EGMA compatibiliser there are several prominent Si-rich clusters whereas in the corresponding EGMA-containing samples, there are fewer large, intense features seen within the selected field of view. This supports the reduction in large-aggregate volume evaluated via the μ-CT analysis. Localised Si-rich regions still remain evident in the EGMA-containing samples, especially at the 7 wt. % loading, showing that while helpful, the EGMA did not eliminate the presence of agglomeration. The distinction between formulations is less evident at the 3 wt.% loading of MMT, highlighting the limitation of individual 2-dimensional fields of view when assessing bulk dispersion of particulate fillers. The SEM micrographs meanwhile reveal irregular ridges, cracks and cavities with distinct cavities observed in the uncompatibilised sample containing 7 wt.% MMT. These features are indicative of morphological heterogeneity. As the MMT is hydrophilic by nature, it tends to have poor interaction with hydrophobic nature of the PE matrix leading to the increased presence of agglomerates at higher loadings and the presence of voids caused by particle pull-out during the cryo-fracturing process [42,43]. In general, the SEM-EDX results are broadly consistent with the evidence displayed by the μ-CT analysis of reduced large-scale agglomeration following the incorporation of EGMA.
3.3. Density
The calculated and theoretical densities of the PE-MMT and PE-EGMA-MMT formulations are shown in Table 3. As expected, progressive increasing in MMT loadings increased the density of the composite films. For the PE-MMT systems, the density increased from 0.921 (± 0.003) g cm-3 for the unfilled PE to 0.937 (± 0.002) g cm-3, 0.949 (± 0.001) g cm-3 and 0.966 (0.002) g cm-3 for the samples with 3, 5 and 7 wt.% MMT respectively. A similar incremental increase was observed for the EGMA containing formulations with density increasing from 0.921 (± 0.001) g cm-3 for the PE-EGMA sample without additional filler to 0.940 (± 0.001) g cm-3, 0.946 (± 0.001) g cm-3 and 0.963 (± 0.002) g cm-3 for the 3, 5 and 7 wt.% increments of MMT. At the final 7 wt.% loadings of MMT, this is representative of an increase in 4.9% and 4.6% relative to the respective unfilled polymer matrices.
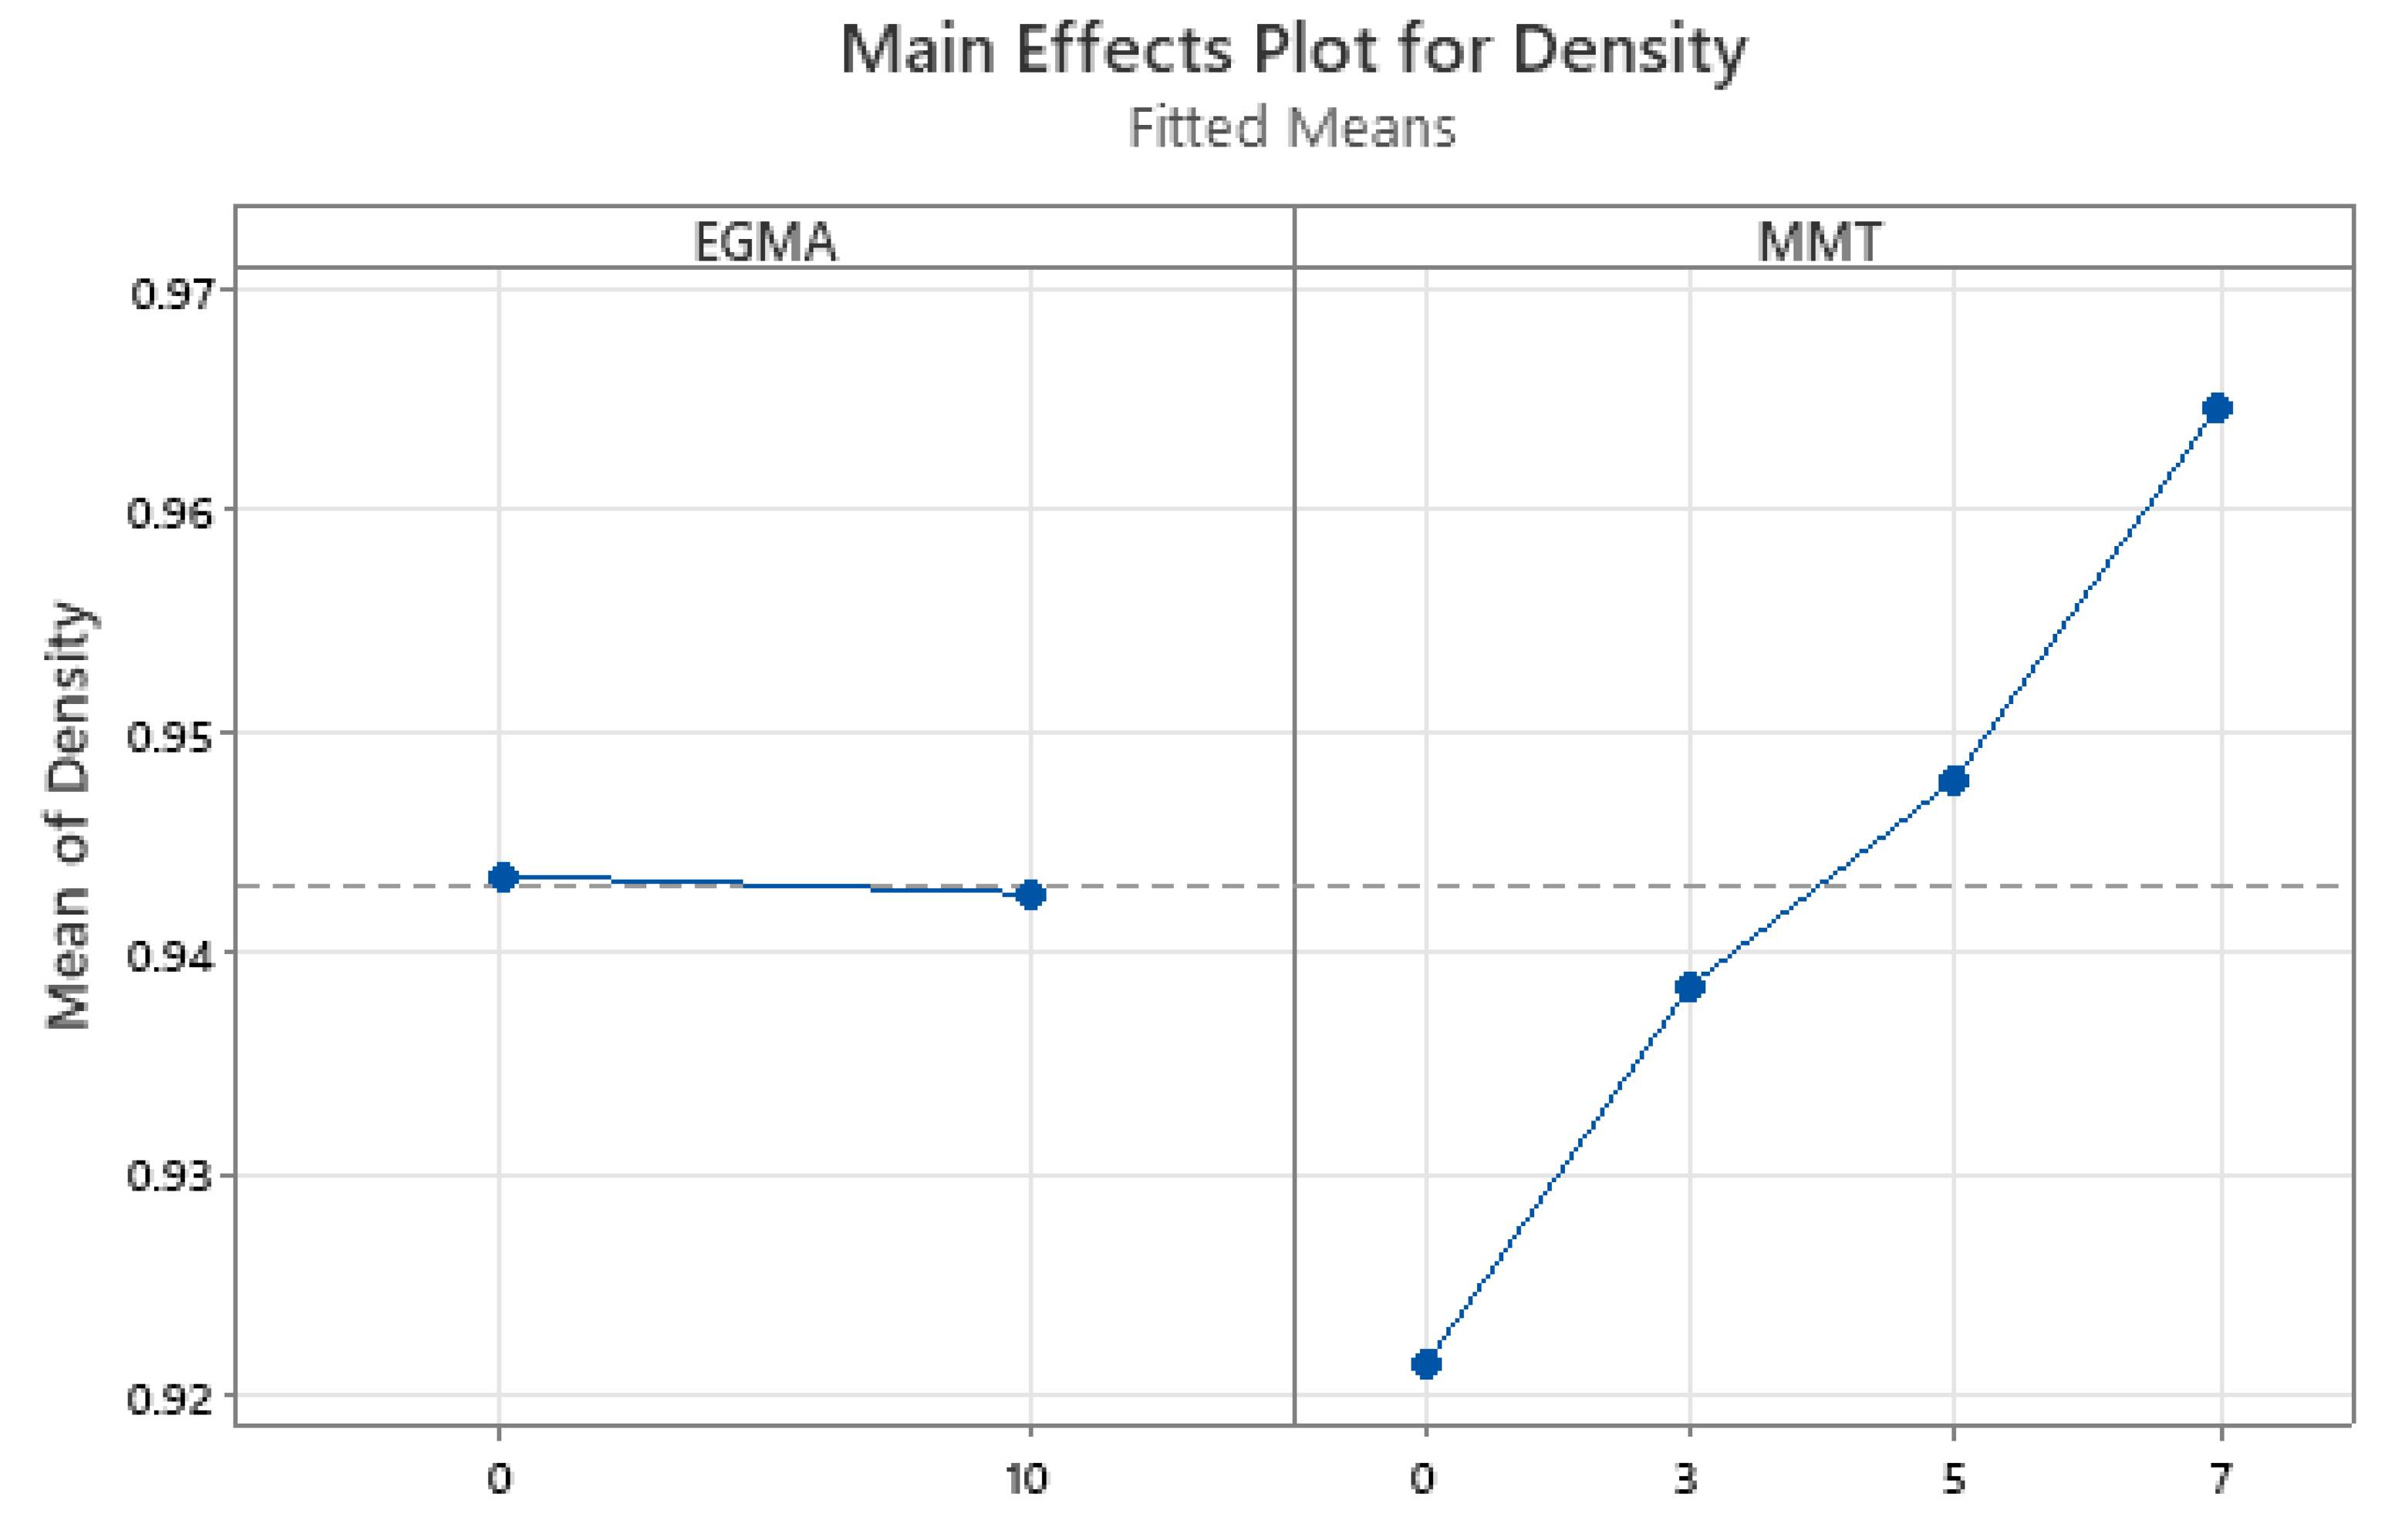
The general linear model explained 98.31% of the observed variation in density (R2 = 98.31%)/ The MMT content had a statistically significant effect (p<0.001), consistent with the increasing density shown in the main effects plot (Figure 2). The main effect of EGMA meanwhile was not shown to be statistically significant (p=0.151), though the MMT and EGMA interaction was significant (p=0.004) indicating that the effect of EGMA on composite density was dependent on MMT loading. At 3 wt.% MMT, the EGMA-containing formulation displayed a mean density 0.003 g cm-3 greater that the corresponding formulation without the EGMA, while at 5 and 7 wt.% MMT the mean density was 0.003 g cm-3 lower. Therefore, although the interaction was statistically significant it involved small absolute differences compared to the overall increase observed with MMT addition.
The loading percentages of MMT were chosen based on the theoretically calculated values cross-correlated with the specifications laid out by RecyClass regarding recyclability of PE flexible packaging films. As the separation of waste plastics is generally performed via flotation separation it is necessary for any composite material to maintain a sufficiently low density so as to not end up in the higher density fraction of polymer waste. Recyclass state that for full compatibility with recycling guidelines, any additive to be added to PE flexible films must not increase the density beyond 0.97 g cm-3 [44]. As shown by both theoretically calculated values and experimentally determined values, all prepared composite films displayed density values <0.97 g cm-3 ensuring full compatibility with RecyClass guidelines.
Figure 4.
Density Main Effects Plot.
3.4. Thermal Properties
The melting and crystallisation behaviour of the PE-MMT and PE-EGMA-MMT composites were evaluated using 1st- and 2nd-heating DSC measurements as shown in Table 4. Percentage of crystallinity (Xc) was calculated using a melting enthalpy of 293 J g-1 for a theoretically 100% crystalline PE [33] and corrected for the MMT mass fraction following the approach used by Zazoum et al.[45]. In the 1st-heating, the pure PE displayed a Tm of 115.55 °C compared with 113.85 °C, 114.65 °C and 115.25 °C for the 3, 5 and 7 wt.% loadings of MMT respectively, showing that the incremental increase in MMT loading did not systematically alter the melting behaviour of the PE matrix. 1st-heating Xc% increased from 47.20% for the neat PE sample to 47.20% and 46.29% for the 3 and 5 wt.% MMT respectively before decreasing to 41.34% for the 7 wt.% loading. These results retain the influence of the melt processing the sample had undergone whereas the 2nd-heating results characterise the material that has been recrystallised under imposed DSC cooling conditions. This distinction has been demonstrated to be important in the case of PE whereby imposing a common thermal history can affect both the melting behaviour and calculated crystallinity of the material [46].
Upon cooling, the neat PE showed a Tc of 96.55 °C while the PE-MMT composites crystallised within a narrow range of 96.55-96.85 °C. As such, the MMT incorporation did not substantially alter the crystallisation peak temperature. The crystallisation enthalpy increased from 121.15 J g-1 for the neat PE to 134.70 J g-1 at a 3 wt.% loading of MMT before decreasing to 126.85 and 116.50 J g-1 at a 5 and 7 wt.% loading respectively. This reflects an alteration in the extent of crystallisation without a comparable alteration in the peak crystallisation temperature. The effect of incorporating clay into PE and the subsequent effect on crystallisation can include various competing processes. He and Zhang hypothesised that the clay promoted heterogenous nucleation while additionally restricting polymer-chain transport which further slows crystal growth in PE-clay composites prepared via in situ polymerisation [47]. Zazoum and Ngô, conversely prepared PE-clay composites via melt extrusion and found that the clay had no nucleating effect on the matrix, noting that the Tm, Tc and Xc% were almost the same as that of the neat PE [45] with similar results published by Morawiec et al. [48].
3.5. Oxygen Permeability
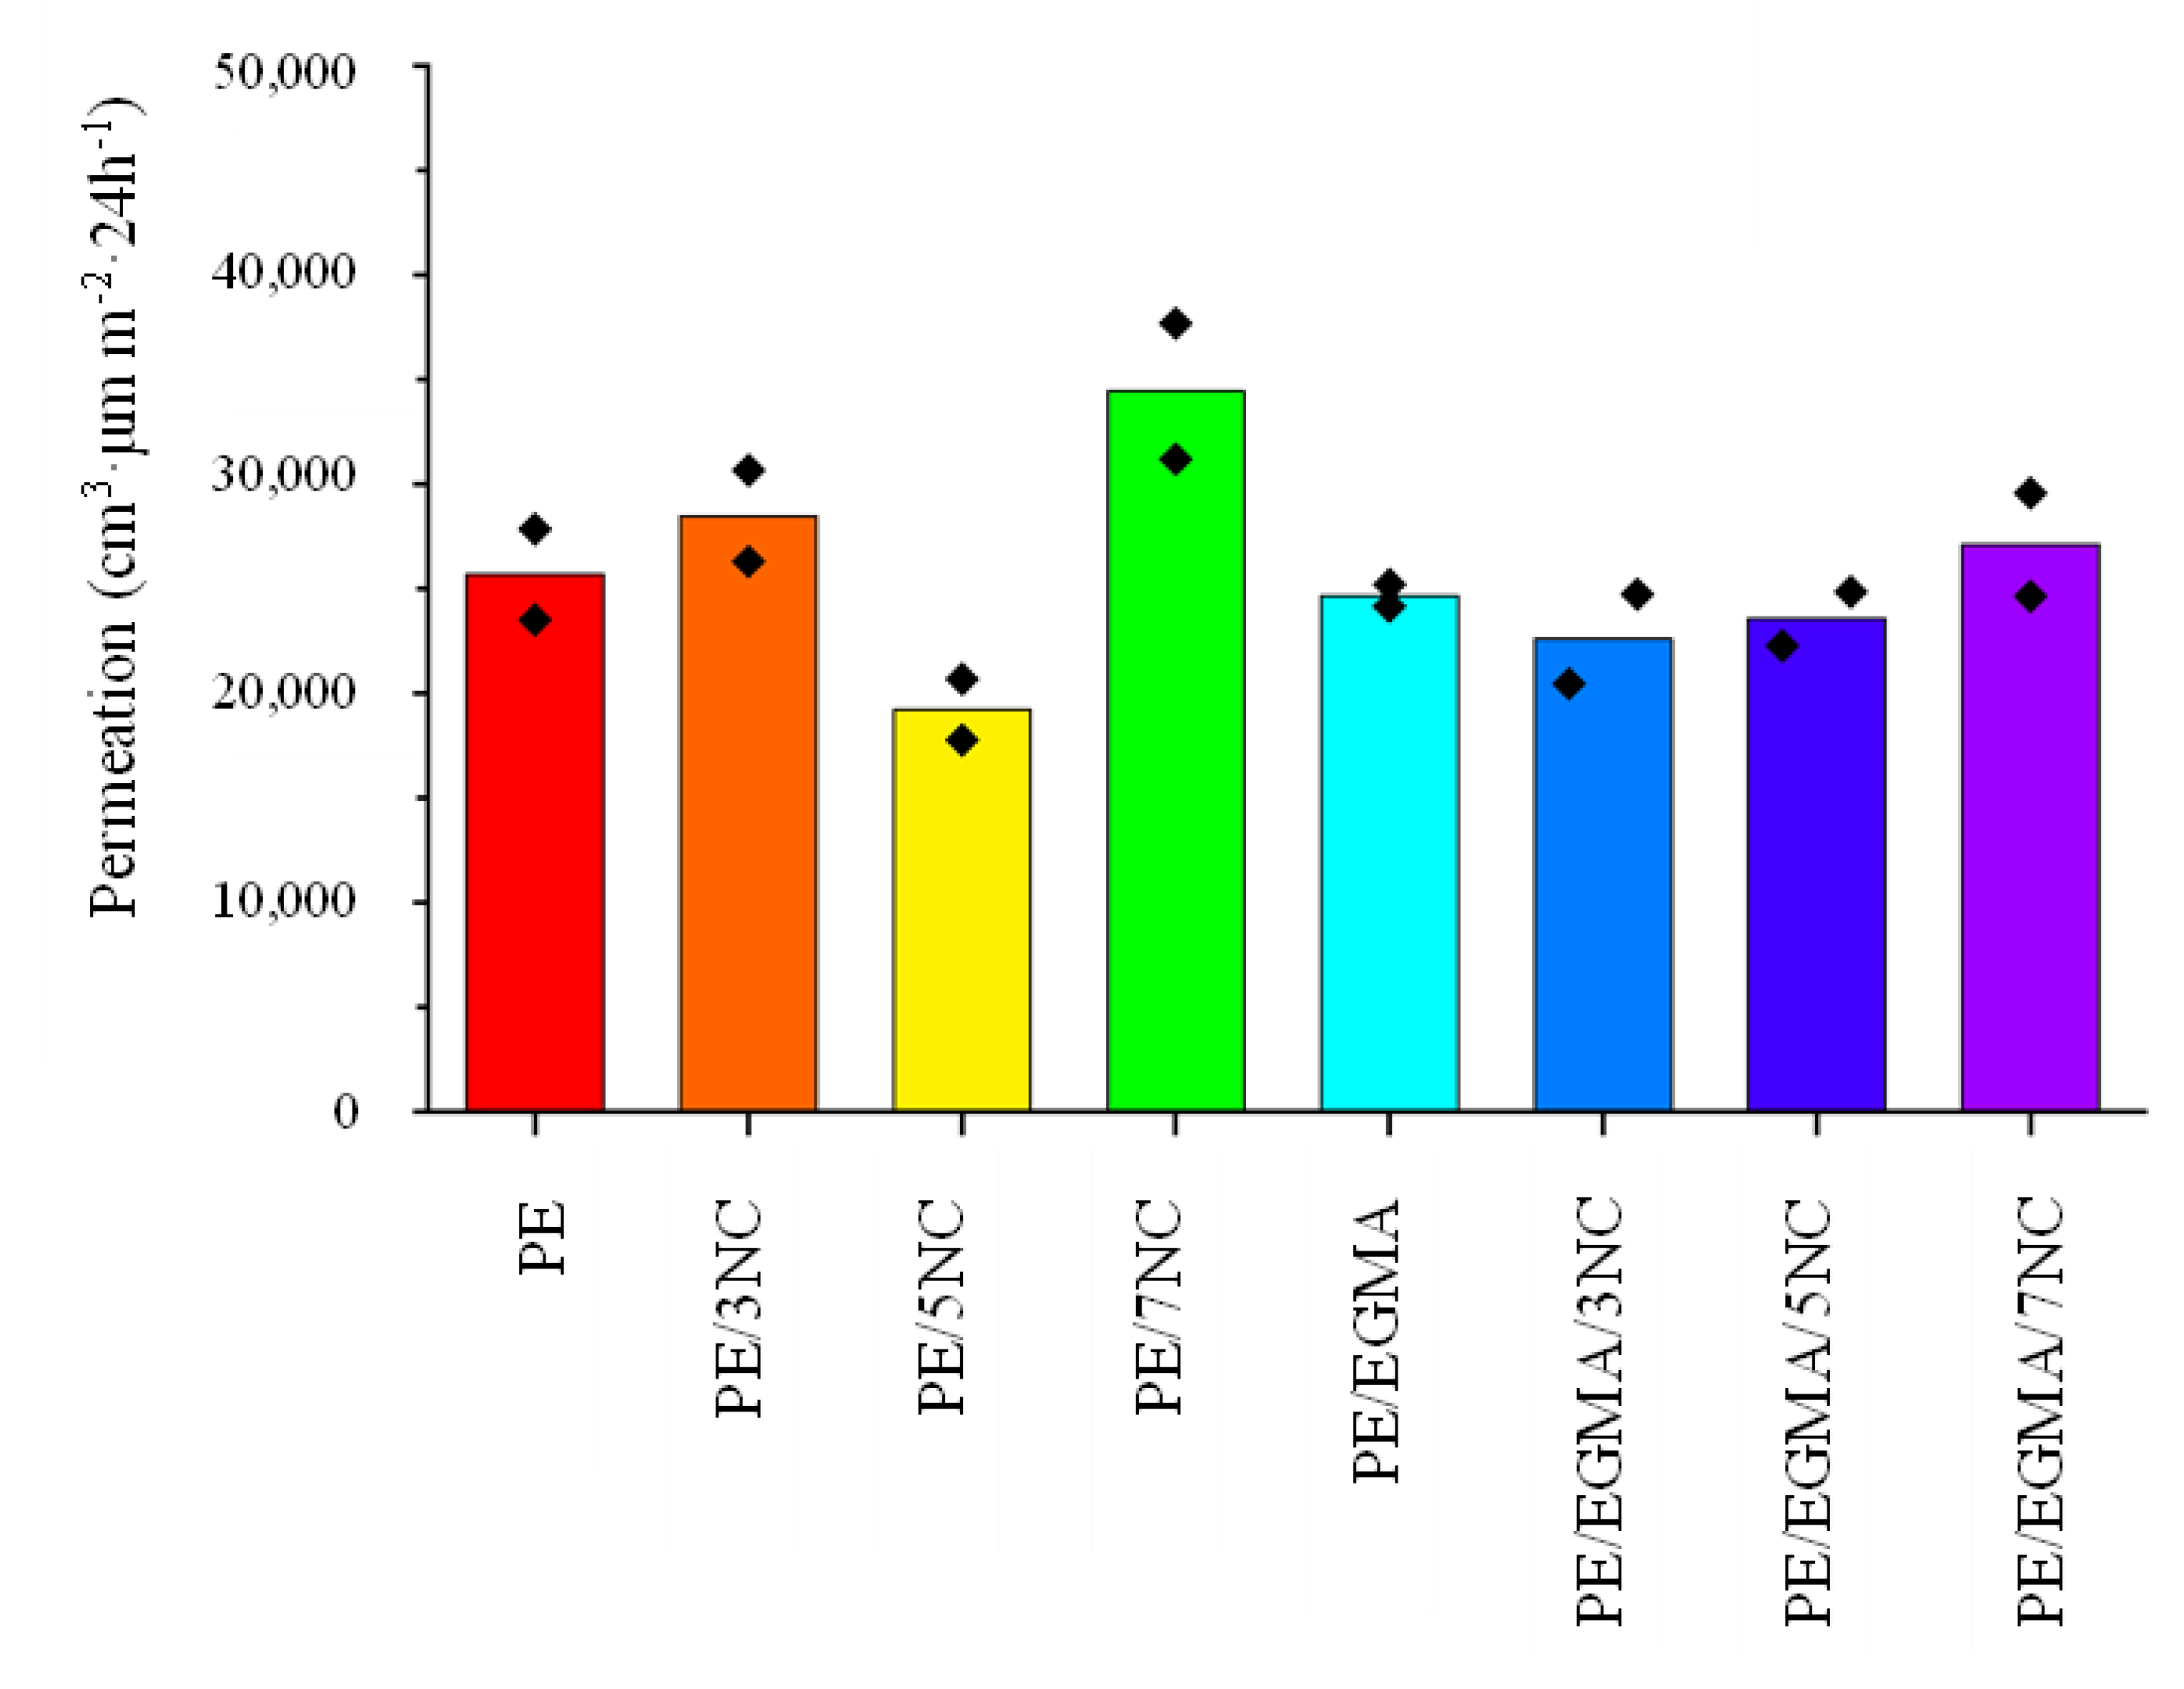
The evaluated results of oxygen permeability of the composite and virgin film samples are shown in Table 5 and Figure 5. The incorporation of plate-like MMT filler, within a polymer matrix increases the diffusionary path-length for oxygen molecules by creating a tortuous path and subsequently increasing the barrier properties of the composite film [49,50]. The oxygen permeability of the composite samples varied non-monotonically with MMT content and/or EGMA incorporation. Within the uncompatibilised samples, the addition of 3 wt.% MMT slightly increased the permeability relative to the neat PE, whereas at the 5 wt.% loading of MMT the lowest permeability was recorded amongst all tested formulations. This improvement is consistent with clay platelets increasing the tortuosity of of the diffusion pathway. The effectiveness of this mechanism, however, is highly dependent on both dispersion and orientation of platelets rather than just the concentration alone. Previously it has been reported that PE/MMT composites have shown recued oxygen permeability with clay incorporating and platelet organisation [51,52]. Increasing the MMT content to 7 wt.% meanwhile resulted in the highest permeability, indicating a deterioration of the oxygen barrier. This coincides with the increase in μ-CT-detected large-agglomerate volume fraction from 0.47 vol% for the PE/5NC to 1.13% vol% for the PE/7NC. The SEM micrographs also reveal the presence of cavities in the 7 wt.% formulation. Combined, these observations suggest that an increase morphological heterogeneity may have limited the beneficial barrier properties of the clay.
Within the EGMA-containing formulation, EGMA by itself produced a minor decrease in permeation relative to the neat PE sample. Within this series of formulations, the lowest permeability value was recorded for the 3 wt.% sample, followed by progressive increases at 5 and 7 wt.%. At 7 wt.%, EGMA reduced both permeation and the large-agglomerate volume fraction relative to the uncompatibilised formulation, consistent with a beneficial contribution from improved dispersion of the nanoparticulate filler. Overall, the best measured oxygen barrier was recorded for PE/5NC whilst PE/EGMA/3NC performed best of the compatibilised formulations. These results indicate that increasing MMT loading or improving dispersion at the μ-CT scale does not necessarily produce a proportional improvement in barrier performance.
Figure 6.
Oxygen permeability of film samples.
3.6. Surface Wettability
Contact angle (CA) measurements were performed to examine the effect of incorporating the MMT clay with or without compatibiliser on the surface wettability of the polymeric films with the tabulated results shown in Table 6, The CA for the neat LDPE film was 93.42°, denoting the characteristic hydrophobic nature of PE [53]. The incorporation of MMT without compatibiliser lead to progressive increase in the hydrophilic nature of the composite materials with decreases in CA of 4.79, 5.71 and 7,49% with respect to the 3, 5 and 7 wt. % loadings of MMT. This result is as expected owing to the hydrophilic nature of the MMT caused by the hydroxylated silicate layers of the clay [54,55]. This is not, however, to state that the increasing hydrophilicity of the clay is the sole explanation of the enhanced wettability of the composites as alteration in surface roughness may also result in changes in CA. Mallayan et al. for instance reported on increased CA following incorporation of organically modified clay into LDPE matrices. In general, good dispersion of the nanoparticles and good interaction between the clay and matrix would lead to an increase in CA though again, at increased loading levels and the arising of agglomerates can lead to a decrease in CA [56].
The addition of EGMA to unfilled PE increased the CA to 97.78±3.55° despite the polar functionality of the compatibiliser. This suggests that bulk polarity did not directly determine the surface wettability of the exposed surface with studies of amphiphilic polymer blends showing that hydrophilic segments can become buried underneath hydrophobic segments at the surface interface [57]. Within the EGMA series, the CA similarly shows a progressive decrease in value with respect to additional clay incorporation. Thus, in both series of samples, increasing MMT content promoted greater wettability in both. The near identical values for PE/5NC and PE/EGMA/5NC indicate that the EGMA incorporation has little effect on the wettability at this loading. Overall, all samples exhibited values close to the conventional 90° hydrophilic-hydrophobic boundary.
3.7. Mechanical Properties
The mechanical properties of a polymer and composites thereof are highly dependent on the structure of the composite as well as the formation of a strong adhesive bond between the filler material and the surrounding polymer matrix [58]. As can be seen in Table 7, the incorporation of MMT into the PE matrix has no substantial impact on the ultimate tensile strength of the composites, with their being only a 0.67 and 2.19% increase for the 3 and 5 wt.% samples respectively whilst the 7 wt.% sample shows a decrease of 2.01% relative to the virgin PE. Danilova et al. demonstrated similar results when incorporating MMT into ultrahigh molecular weight PE (UHMWPE). An initial substantial increase in tensile strength (20.59%) was shown at a loading of 0.5 wt.% MMT with progressively decreasing additive value at higher loadings, terminating at a 5.88% increase at a 5 wt.% loading [58]. It has previously been reported that the optimal loading range of MMT in LDPE composites tends to reside in the 1-3 wt.% range, with filler content beyond this point leading to a decrease in tensile strength. Al-Jumaili et al. have attributed this to micro-aggregation of the clay particles caused by a tendency of the MMT particles to be held together to form microsized particles which may behave as stress concentrators and defects [59]. MMT loading played a more pronounced effect on the elongation at maximum (Ag) than on the ultimate tensile strength (σu). Within the uncompatibilised series of formulations, Ag decreased progressively from 49.96±5.18% for the neat PE to 42.47±2.71%, 39.68±1.34% and 34.89±12.07% for the 3, 5 and 7 wt. % increments of MMT respectively. Youngs modulus (E) remained relatively stable between the neat PE and 3 wt.% loading of MMT whilst at 5 and 7 wt.% there was an increase of 16.6% and 18.1% respectively. Thus, increasing the MMT content from 5 to 7 wt.% produced little marked improvements in composite stiffness while both σu and Ag decreased. This coincides with an increase in the calculated volume fraction of MMT agglomerates >33.4μm from 0.47 to 1.13 vol. %, consistent with the published role of agglomerated clay particles acting as stress concentrators [60]. The most pronounced effect of the EGMA compatibiliser on the tensile properties of the composite materials was on the Ag. In the unfilled PE, EGMA incorporation increased this value fro 49.96 to 60.97% while the average E remained similar. A related effect was reported by Djellali et al. [60] for a 60/40 LDPE/PLA blend, in which greater plastic deformation preceded rupture as EGMA content increased, with elongation at break reaching 14.7% at 15 phr EGMA [61]. The addition of MMT reduced the Ag relative to the unfilled PE/EGMA blend, though the MMT containing formulation maintained a higher value than that of their non-EGMA-containing counterparts. The 5 wt.% formulation for example, with the EGMA incorporated, increased the Ag from 39.68% to 47.68% relative to the erstwhile uncompatibilised sample., while maintaining a similar value in E. Al-Jumaili et al. have noted that at the incorporation of increasing loadings of MMT reduces the Ag of LDPE matrices with a 1 and 2 wt.% loading leading to decreases of ~20 and 30% respectively [62].
4. Conclusion
LDPE/MMT composite samples containing up to 7 wt.% clay were successfully produced by melt compounding with and without 10 wt.% EGMA as a compatibiliser. EGMA reduced the volume fraction of agglomerates >33.4μm by approximately 52-73%, showing improved dispersion at the scale resolved by μ-CT. Nevertheless, SEM-EDX displayed persistent localised heterogeneity and the measurements did not quantify intercalation or exfoliation. Though large-scale dispersion was improved, this did not translate to consistent improvements in oxygen barrier. The uncompatibilised formulation containing 5 wt.% MMT showed the lowest thickness-normalised oxygen transmission, 25.1% below that of the neat PE sample. Increasing the MMT loading to 7 wt.% however, negatively impacted the barrier performance coinciding with a larger large-agglomerate volume fraction. Within the EGMA-containing formulations, the lowest transmission occurred at 3 wt.% MMT loading, corresponding to an 8.4% reduction relative to unfilled LDPE.EGMA and 12.0% relative to the neat LDPE sample. Thus, EGMA mitigated the barrier deterioration seen at the highest clay loading level but did not outcompete the best performing uncompatibilised sample. Across all samples, tensile strength was broadly retained with higher clay loadings exhibiting enhanced stiffness and reduced elongation. The EGMA formulations showed greater elongation compared to their uncompatibilised counterparts. The addition of clay additionally increased density and surface wettability though measured CA still remained within range of hydrophobicity with measured densities remaining below the 0.97 g cm-3 threshold set out by RecyClass. The results identify LDOE containing a 5 wt.% addition of MMT as the most promising formulation within the tested rang eof formulations for improving oxygen barrier while retaining mechanical strength. Further development should establish platelet organisation using complementary nanoscale characterisation, verify barrier reproducibility and evaluate recycling performance prior to assessment as an alternative material for more complex packaging structures.
References
- OECD Global Plastics Outlook: Policy Scenarios to 2060; OECD Publishing: Paris, 2022. [CrossRef]
- Geyer, R.; Jambeck, J.R.; Law, K.L. Production, use, and fate of all plastics ever made. Sci. Adv. 2017, 3, e1700782. [Google Scholar] [CrossRef] [PubMed]
- Ma, J.; Hipel, K.W. Exploring social dimensions of municipal solid waste management around the globe – A systematic literature review. Waste Manag 2016, 56, 3–12. [Google Scholar] [CrossRef] [PubMed]
- Awino, F.B.; Apitz, S.E. Solid waste management in the context of the waste hierarchy and circular economy frameworks: An international critical review. Integr. Environ. Assess. Manag 2024, 20, 9–35. [Google Scholar] [CrossRef] [PubMed]
- Dokl, M.; Copot, A.; Krajnc, D.; Fan, Y.V.; Vujanović, A.; Aviso, K.B.; et al. Global projections of plastic use, end-of-life fate and potential changes in consumption, reduction, recycling and replacement with bioplastics to 2050. Sustain Prod. Consum 2024, 51, 498–518. [Google Scholar] [CrossRef]
- Cerbone, A.; Palazzo, I.; Ceriello, A.; Castaldo, R.; Stanzione, M.; Lavorgna, M.; et al. Delamination of multilayer flexible packaging: a promising approach towards the recycling of their components. A review. Resour. Conserv Recycl 2025, 222, 108493. [Google Scholar] [CrossRef]
- Horodytska, O.; Valdés, F.J.; Fullana, A. Plastic flexible films waste management – A state of art review. Waste Manag 2018, 77, 413–25. [Google Scholar] [CrossRef] [PubMed]
- Phanisankar, B.S.S.; Vasudeva Rao, N.; Manikanta, J.E. Conversion of waste plastic to fuel products. Mater. Today Proc. 2020, 33, 5190–5. [Google Scholar] [CrossRef]
- Yu, F.; Wu, Z.; Wang, J.; Li, Y.; Chu, R.; Pei, Y.; et al. Effect of landfill age on the physical and chemical characteristics of waste plastics/microplastics in a waste landfill sites. Environ. Pollut. 2022, 306, 119366. [Google Scholar] [CrossRef] [PubMed]
- Marangoni Júnior, L.; Oliveira LMde Bócoli, P.F.J.; Cristianini, M.; Padula, M.; Anjos, C.A.R. Morphological, thermal and mechanical properties of polyamide and ethylene vinyl alcohol multilayer flexible packaging after high-pressure processing. J. Food Eng. 2020, 276, 109913. [Google Scholar] [CrossRef]
- Nasri, Y.; Benaniba, M.T.; Bouquey, M. Elaboration and characterization of polymers used in flexible multilayer food packaging. Mater. Today Proc. 2022, 53, 91–5. [Google Scholar] [CrossRef]
- Soares CTde, M.; Ek, M.; Östmark, E.; Gällstedt, M.; Karlsson, S. Recycling of multi-material multilayer plastic packaging: Current trends and future scenarios. Resour. Conserv Recycl 2022, 176, 105905. [Google Scholar] [CrossRef]
- Ferrari, D.; Radice, S.; Sciarrillo, V.; Marrani, A.; Ciolca, D.; Kounalis, K.; et al. PVDC multilayer films: Chemical recycling by means of catalytic conversion into aromatics (BTX). Sustain Chem. Environ. 2023, 2, 100010. [Google Scholar] [CrossRef]
- Turriziani, B.B.; Vieira, R.P.; Marangoni Júnior, L.; Alves, R.M.V. Mechanical Recycling of Multilayer Flexible Packaging Employing Maleic Anhydride as Compatibilizer. J. Polym. Environ. 2024, 32, 1393–405. [Google Scholar] [CrossRef]
- Walker, T.W.; Frelka, N.; Shen, Z.; Chew, A.K.; Banick, J.; Grey, S.; et al. Recycling of multilayer plastic packaging materials by solvent-targeted recovery and precipitation. Sci. Adv. 2020, 6, eaba7599. [Google Scholar] [CrossRef] [PubMed]
- Licht, J.S.; Ferger, C.M.; Tsianou, M.; Alexandridis, P. Delamination recycling of multilayer plastic films: Solvent-assisted separation pathways and recovery of solid polyolefins. Resour. Conserv Recycl 2026, 234, 109079. [Google Scholar] [CrossRef]
- Safandowska, M.; Makarewicz, C.; Rozanski, A. Tuning Barrier Properties of Low-Density Polyethylene: Impact of Amorphous Region Nanostructure on Gas Transmission Rate. Molecules 2024, 29, 4950. [Google Scholar] [CrossRef] [PubMed]
- Zia, J.; Paul, U.C.; Heredia-Guerrero, J.A.; Athanassiou, A.; Fragouli, D. Low-density polyethylene/curcumin melt extruded composites with enhanced water vapor barrier and antioxidant properties for active food packaging. Polymer 2019, 175, 137–45. [Google Scholar] [CrossRef]
- Wang, Z.F.; Wang, B.; Qi, N.; Zhang, H.F.; Zhang, L.Q. Influence of fillers on free volume and gas barrier properties in styrene-butadiene rubber studied by positrons. Polymer 2005, 46, 719–24. [Google Scholar] [CrossRef]
- Fajdek-Bieda, A.; Wróblewska, A. The Use of Natural Minerals as Reinforcements in Mineral-Reinforced Polymers: A Review of Current Developments and Prospects. Polymers 2024, 16, 2505. [Google Scholar] [CrossRef] [PubMed]
- Bodaghi, H.; Mostofi, Y.; Oromiehie, A.; Ghanbarzadeh, B.; Hagh, Z.G. Synthesis of clay–TiO2 nanocomposite thin films with barrier and photocatalytic properties for food packaging application. J. Appl. Polym. Sci. 2015, 132. [Google Scholar] [CrossRef]
- Golebiewski, J.; Rozanski, A.; Dzwonkowski, J.; Galeski, A. Low density polyethylene–montmorillonite nanocomposites for film blowing. Eur. Polym. J. 2008, 44, 270–86. [Google Scholar] [CrossRef]
- Zhao, C.; Qin, H.; Gong, F.; Feng, M.; Zhang, S.; Yang, M. Mechanical, thermal and flammability properties of polyethylene/clay nanocomposites. Polym. Degrad. Stab. 2005, 87, 183–9. [Google Scholar] [CrossRef]
- Heinemann, J.; Reichert, P.; Thomann, R.; Mülhaupt, R. Polyolefin nanocomposites formed by melt compounding and transition metal catalyzed ethene homo- and copolymerization in the presence of layered silicates. Macromol. Rapid Commun. 1999, 20, 423–30. [Google Scholar] [CrossRef]
- Rong, J.; Jing, Z.; Li, H.; Sheng, M. A Polyethylene Nanocomposite Prepared via In-Situ Polymerization. Macromol. Rapid Commun. 2001, 22, 329–34. [Google Scholar] [CrossRef]
- Gopakumar, T.G.; Lee, J.A.; Kontopoulou, M.; Parent, J.S. Influence of clay exfoliation on the physical properties of montmorillonite/polyethylene composites. Polymer 2002, 43, 5483–91. [Google Scholar] [CrossRef]
- Kawasumi, M.; Hasegawa, N.; Kato, M.; Usuki, A.; Okada, A. Preparation and Mechanical Properties of Polypropylene−Clay Hybrids. Macromolecules 1997, 30, 6333–8. [Google Scholar] [CrossRef]
- Wang, K.H.; Chung, I.J.; Jang, M.C.; Keum, J.K.; Song, H.H. Deformation Behavior of Polyethylene/Silicate Nanocomposites As Studied by Real-Time Wide-Angle X-ray Scattering. Macromolecules 2002, 35, 5529–35. [Google Scholar] [CrossRef]
- Morlat, S.; Mailhot, B.; Gonzalez, D.; Gardette, J.-L. Photo-oxidation of Polypropylene/Montmorillonite Nanocomposites. 1. Influence of Nanoclay and Compatibilizing Agent. Chem. Mater. 2004, 16, 377–83. [Google Scholar] [CrossRef]
- Zhong, Y.; Janes, D.; Zheng, Y.; Hetzer, M.; De Kee, D. Mechanical and oxygen barrier properties of organoclay-polyethylene nanocomposite films. Polym. Eng. Sci. 2007, 47, 1101–7. [Google Scholar] [CrossRef]
- Chen, R.S.; Ahmad, S.; Gan, S. Characterization of recycled thermoplastics-based nanocomposites: Polymer-clay compatibility, blending procedure, processing condition, and clay content effects. Compos Part B Eng. 2017, 131, 91–9. [Google Scholar] [CrossRef]
- Minkova, L.; Peneva, Y.; Valcheva, M.; Filippi, S.; Pracella, M.; Anguillesi, I.; et al. Morphology, microhardness, and flammability of compatibilized polyethylene/clay nanocomposites. Polym. Eng. Sci. 2010, 50, 1306–14. [Google Scholar] [CrossRef]
- Niemczyk, A.; Dziubek, K.; Sacher-Majewska, B.; Czaja, K.; Dutkiewicz, M.; Marciniec, B. Study of thermal properties of polyethylene and polypropylene nanocomposites with long alkyl chain-substituted POSS fillers. J. Therm. Anal. Calorim. 2016, 125, 1287–99. [Google Scholar] [CrossRef]
- Gürses, A.; Güneş, K. Preparation of Polyethylene Clay Composites via Melt Intercalation Using Hydrophobic and Superhydrophobic Organoclays and Comparison of Their Textural, Mechanical and Thermal Properties. Polymers 2024, 16, 272. [Google Scholar] [CrossRef] [PubMed]
- Almaroof, A.; Rojo, L.; Mannocci, F.; Deb, S. A resin composite material containing an eugenol derivative for intracanal post cementation and core build-up restoration. Dent. Mater. 2016, 32, 149–60. [Google Scholar] [CrossRef] [PubMed]
- Raimondo, M.; Naddeo, C.; Vertuccio, L.; Lafdi, K.; Sorrentino, A.; Guadagno, L. Carbon-Based Aeronautical Epoxy Nanocomposites: Effectiveness of Atomic Force Microscopy (AFM) in Investigating the Dispersion of Different Carbonaceous Nanoparticles. Polymers 2019, 11, 832. [Google Scholar] [CrossRef] [PubMed]
- Gürses, A.; Güneş, K. Preparation of Polyethylene Clay Composites via Melt Intercalation Using Hydrophobic and Superhydrophobic Organoclays and Comparison of Their Textural, Mechanical and Thermal Properties. Polymers 2024, 16, 272. [Google Scholar] [CrossRef] [PubMed]
- Depan, D.; Chirdon, W.; Khattab, A. Morphological and Chemical Analysis of Low-Density Polyethylene Crystallized on Carbon and Clay Nanofillers. Polymers 2021, 13, 1558. [Google Scholar] [CrossRef] [PubMed]
- Chen, R.S.; Ahmad, S.; Gan, S.; Ab Ghani, M.H.; Salleh, M.N. Effects of compatibilizer, compounding method, extrusion parameters, and nanofiller loading in clay-reinforced recycled HDPE/PET nanocomposites. J. Appl. Polym. Sci. 2015, 132, app.42287. [Google Scholar] [CrossRef]
- Delli, E.; Gkiliopoulos, D.; Bikiaris, D.N.; Vourlias, G.; Kehagias, T.; Chrissafis, K. The effect of montmorillonite concentration on the properties of random polypropylene/montmorillonite nanocomposites. Polymer 2026, 343, 129482. [Google Scholar] [CrossRef]
- Giovannini, G.; Garoli, D.; Rupper, P.; Neels, A.; Rossi, R.M.; Boesel, L.F. Metal-Modified Montmorillonite as Plasmonic Microstructure for Direct Protein Detection. Sensors 2021, 21, 2655. [Google Scholar] [CrossRef] [PubMed]
- Almansoori, A.; Majewski, C.; Rodenburg, C. Nanoclay/Polymer Composite Powders for Use in Laser Sintering Applications: Effects of Nanoclay Plasma Treatment. JOM 2017, 69, 2278–85. [Google Scholar] [CrossRef] [PubMed]
- Al-Jumaili SKh Alkaron, W.A.; Atshan, M.Y. Mechanical, thermal, and morphological properties of low-density polyethylene nanocomposites reinforced with montmorillonite: Fabrication and characterizations. Cogent Eng. 2023, 10, 2204550. [Google Scholar] [CrossRef]
- RecyClass. Natural PE Flexible Films for Household and Commercial Packaging. RecyClass 2026. [Google Scholar]
- Zazoum, B.; David, E.; Ngô, A.D. LDPE/HDPE/Clay Nanocomposites: Effects of Compatibilizer on the Structure and Dielectric Response. J. Nanotechnol. 2013, 2013, 138457. [Google Scholar] [CrossRef]
- I. Groves, T. Lever, N. Hawkins, TA Instruments. Determination of Polymer Crystallinity by DSC 2023.
- He, F.-A.; Zhang, L.-M. Study on Thermal Stability and Non-Isothermal Crystallization Behaviour of Polyethylene/Clay Nanocomposites. Polym. Polym. Compos 2015, 23, 545–54. [Google Scholar] [CrossRef]
- Morawiec, J.; Pawlak, A.; Slouf, M.; Galeski, A.; Piorkowska, E.; Krasnikowa, N. Preparation and properties of compatibilized LDPE/organo-modified montmorillonite nanocomposites. Eur. Polym. J. 2005, 41, 1115–22. [Google Scholar] [CrossRef]
- Rauschendorfer, J.E.; Vana, P. Increasing the Gas Barrier Properties of Polyethylene Foils by Coating with Poly(methyl acrylate)-Grafted Montmorillonite Nanosheets. Polymers 2021, 13, 3228. [Google Scholar] [CrossRef] [PubMed]
- Vilarinho, F.; Vaz, M.F.; Silva, A.S. The Use of Montmorillonite (MMT) in Food Nanocomposites: Methods of Incorporation, Characterization of MMT/Polymer Nanocomposites and Main Consequences in the Properties. Recent Pat. Food Nutr. Agric. 2020, 11, 13–26. [Google Scholar] [CrossRef] [PubMed]
- M Fernanda Horst, Lidia M Quinzani, Marcelo D Failla. Rheological and barrier properties of nanocomposites of HDPE and exfoliated montmorillonite. J. Thermoplast. Compos Mater. 2012, 27. [CrossRef]
- Ma, Y.; Yang, J.; Wang, X.; Tian, M.; Yang, W.; Xie, P. Preparation of high-density polyethylene/montmorillonite nanocomposites with high gas barrier by micro-nano torsional laminated extrusion. Polym. Compos 2023, 44, 6747–57. [Google Scholar] [CrossRef]
- Aktas, C.; Polat, O.; Beitollahpoor, M.; Farzam, M.; Pesika, N.S.; Sahiner, N. Force-Based Characterization of the Wetting Properties of LDPE Surfaces Treated with CF4 and H2 Plasmas. Polymers 2023, 15, 2132. [Google Scholar] [CrossRef] [PubMed]
- Cyras, V.P.; Manfredi, L.B.; Ton-That, M.-T.; Vázquez, A. Physical and mechanical properties of thermoplastic starch/montmorillonite nanocomposite films. Carbohydr. Polym. 2008, 73, 55–63. [Google Scholar] [CrossRef]
- Jalalvandi, E.; Majid, R.; Ghanbari, T.; Ilbeygi, H. Effects of montmorillonite (MMT) on morphological, tensile, physical barrier properties and biodegradability of polylactic acid/starch/MMT nanocomposites. J. Thermoplast. Compos Mater. 2015, 28, 496–509. [Google Scholar] [CrossRef]
- Mallayan, S.; Raja Prabhu, R.; Desai, B.M.A.; Velmurugan, R.; Sarathi, R.; Rao, B.N. Understanding the electrical, thermal and mechanical properties of LDPE-clay nanocomposites. Micro Nano Lett. 2019, 14, 650–5. [Google Scholar] [CrossRef]
- Bousquet, A.; Pannier, G.; Ibarboure, E.; Papon, E.; Rodríguez-Hernández, J. Control of the Surface Properties in Polymer Blends. J. Adhes. 2007, 83, 335–49. [Google Scholar] [CrossRef]
- Danilova, S.N.; Ivanov, A.N.; Spiridonov, A.M.; Abakunova, E.V.; Okhlopkova, A.A. Polymer-silicate composites based on ultra-high molecular weight polyethylene and organo-modified montmorillonite. Mater. Today Commun. 2023, 37, 107408. [Google Scholar] [CrossRef]
- Al-Jumaili SKh Alkaron, W.A.; Atshan, M.Y. Mechanical, thermal, and morphological properties of low-density polyethylene nanocomposites reinforced with montmorillonite: Fabrication and characterizations. Cogent Eng. 2023, 10, 2204550. [Google Scholar] [CrossRef]
- Chen, J.; An, R.; Tey, W.S.; Zeng, Q.; Zhao, L.; Zhou, K. In Situ Filler Addition for Homogeneous Dispersion of Carbon Nanotubes in Multi Jet Fusion–Printed Elastomer Composites. Adv. Sci. 2023, 10, 2300593. [Google Scholar] [CrossRef] [PubMed]
- Djellali, S.; Haddaoui, N.; Sadoun, T.; Bergeret, A.; Grohens, Y. Structural, morphological and mechanical characteristics of polyethylene, poly(lactic acid) and poly(ethylene-co-glycidyl methacrylate) blends. Iran. Polym. J. 2013, 22, 245–57. [Google Scholar] [CrossRef]
- Al-Jumaili SKh Alkaron, W.A.; Atshan, M.Y. Mechanical, thermal, and morphological properties of low-density polyethylene nanocomposites reinforced with montmorillonite: Fabrication and characterizations. Cogent Eng. 2023, 10, 2204550. [Google Scholar] [CrossRef]
Figure 1.
FTIR Spectra of PE and PE/EGMA matrix and MMT composites.
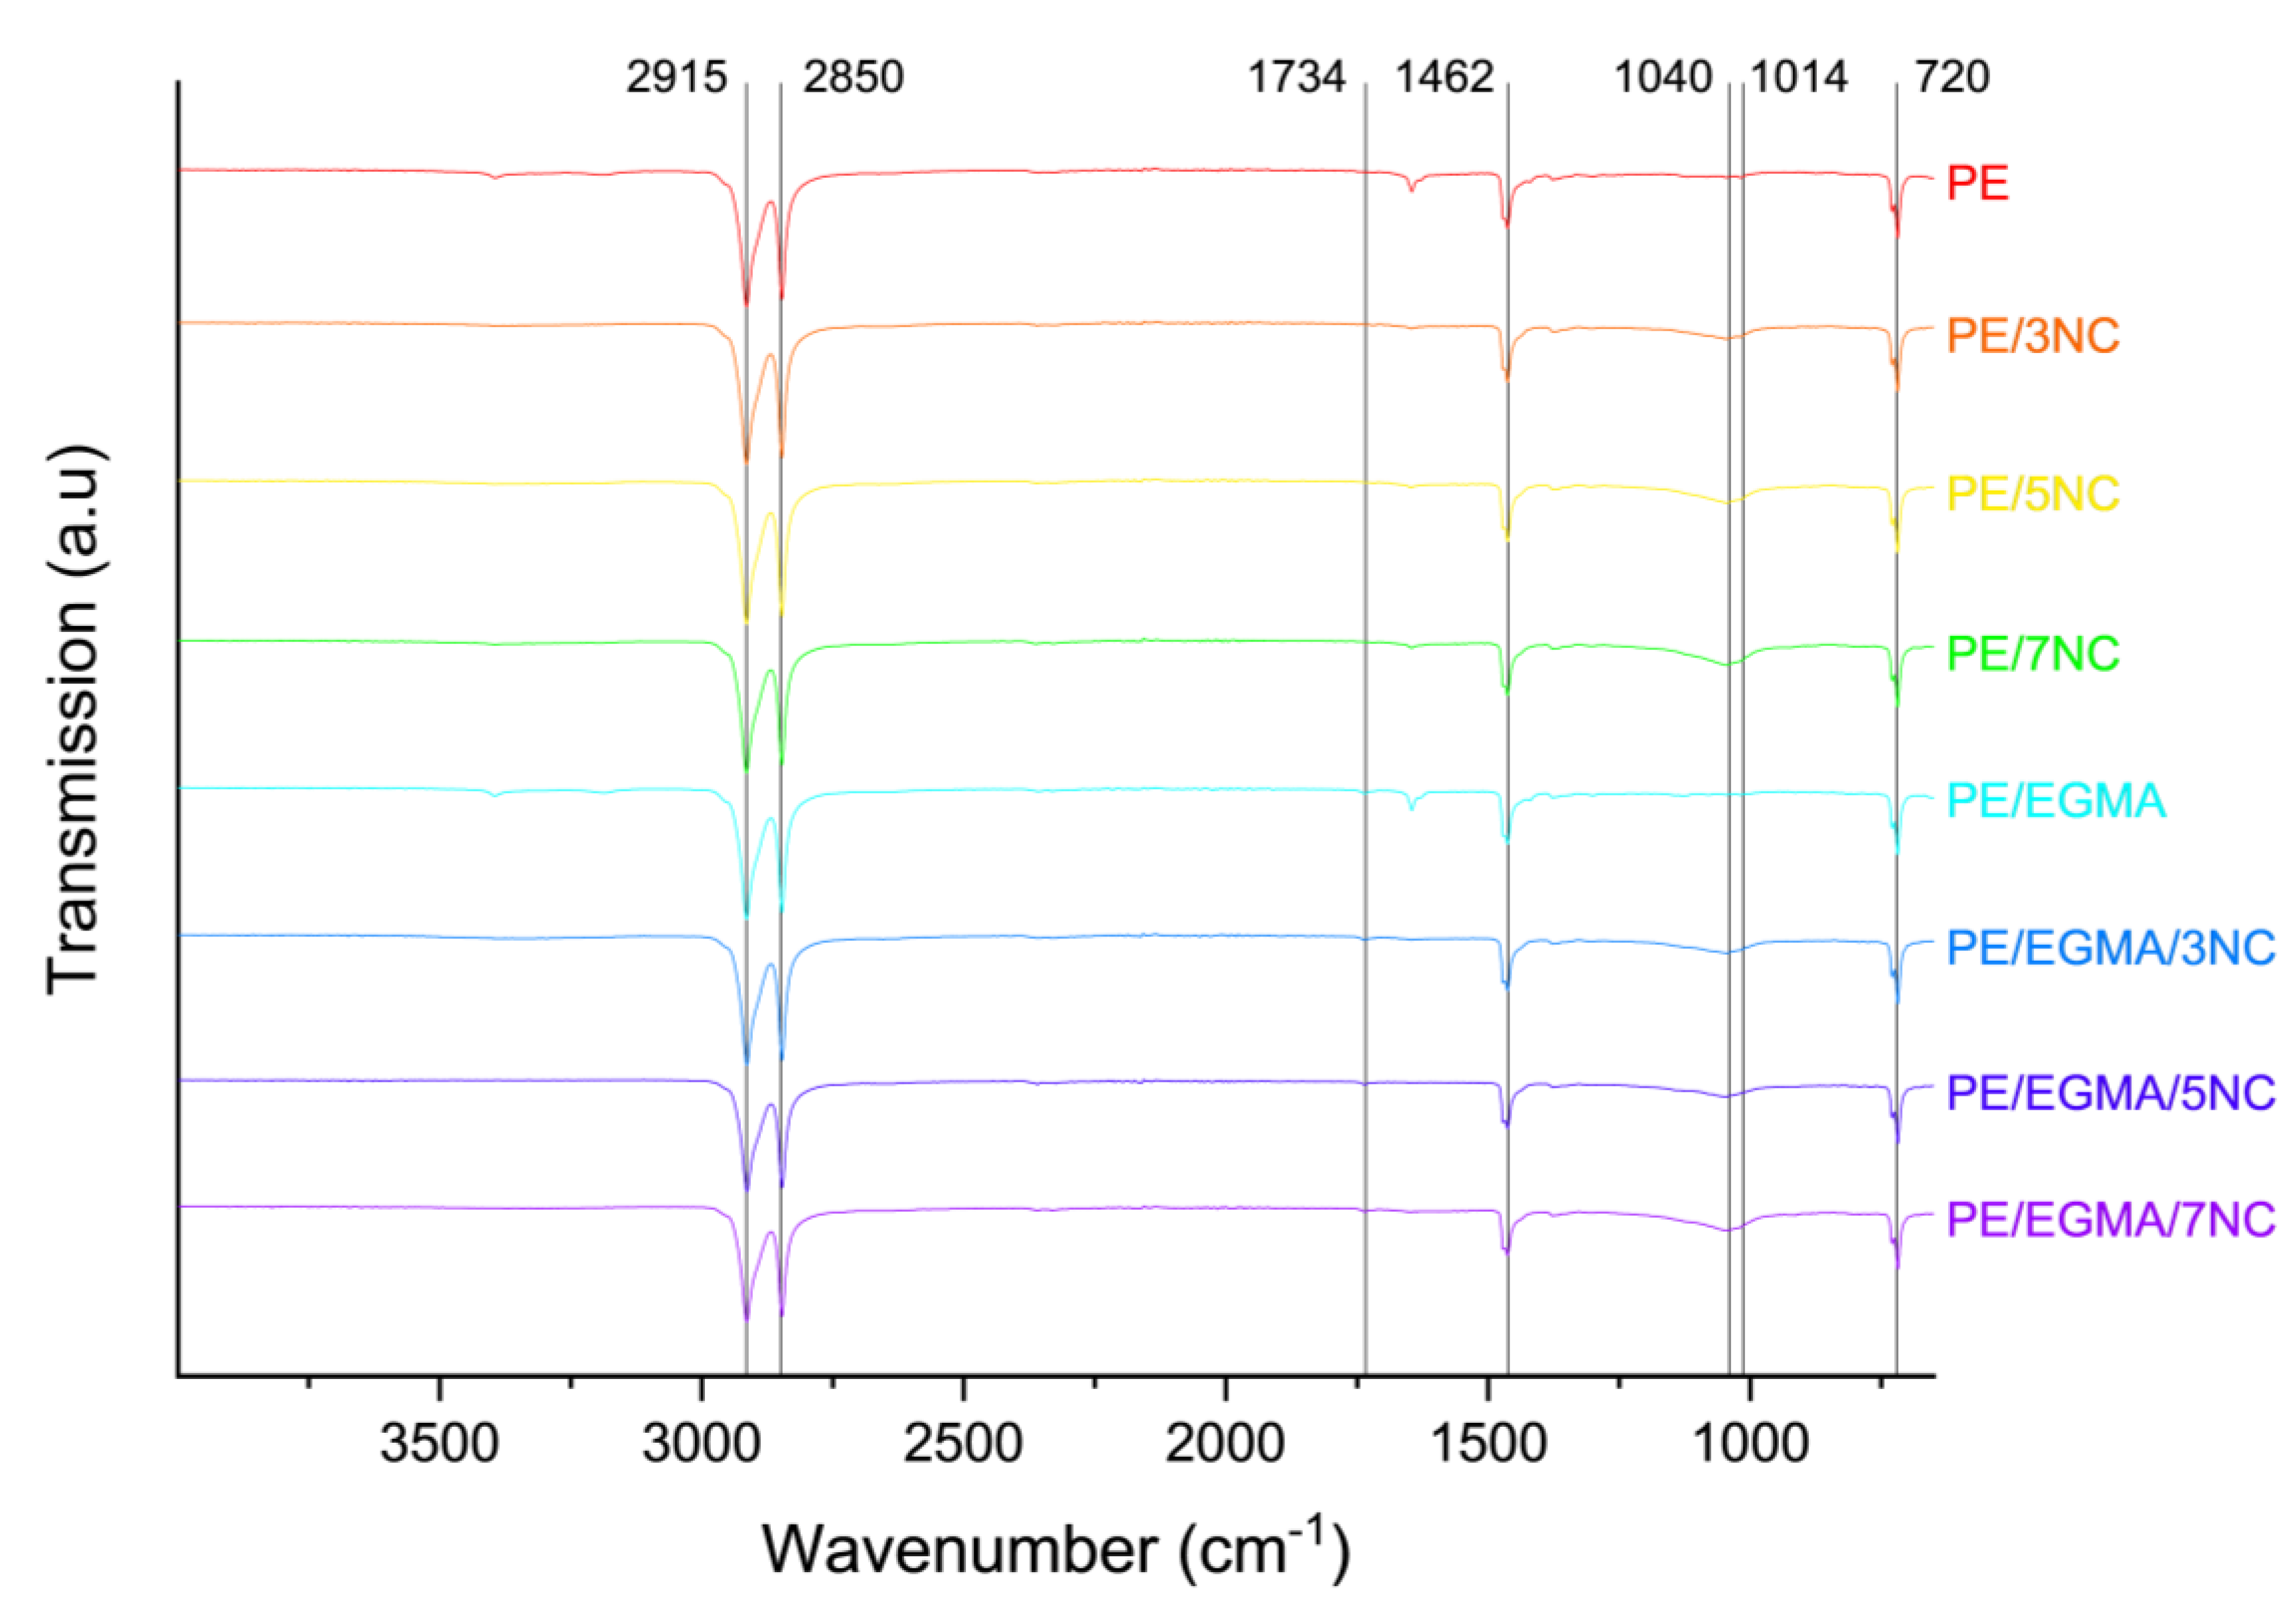
Figure 2.
μ-CT images of samples without (top row) and with EGMA incorporated (bottom row).
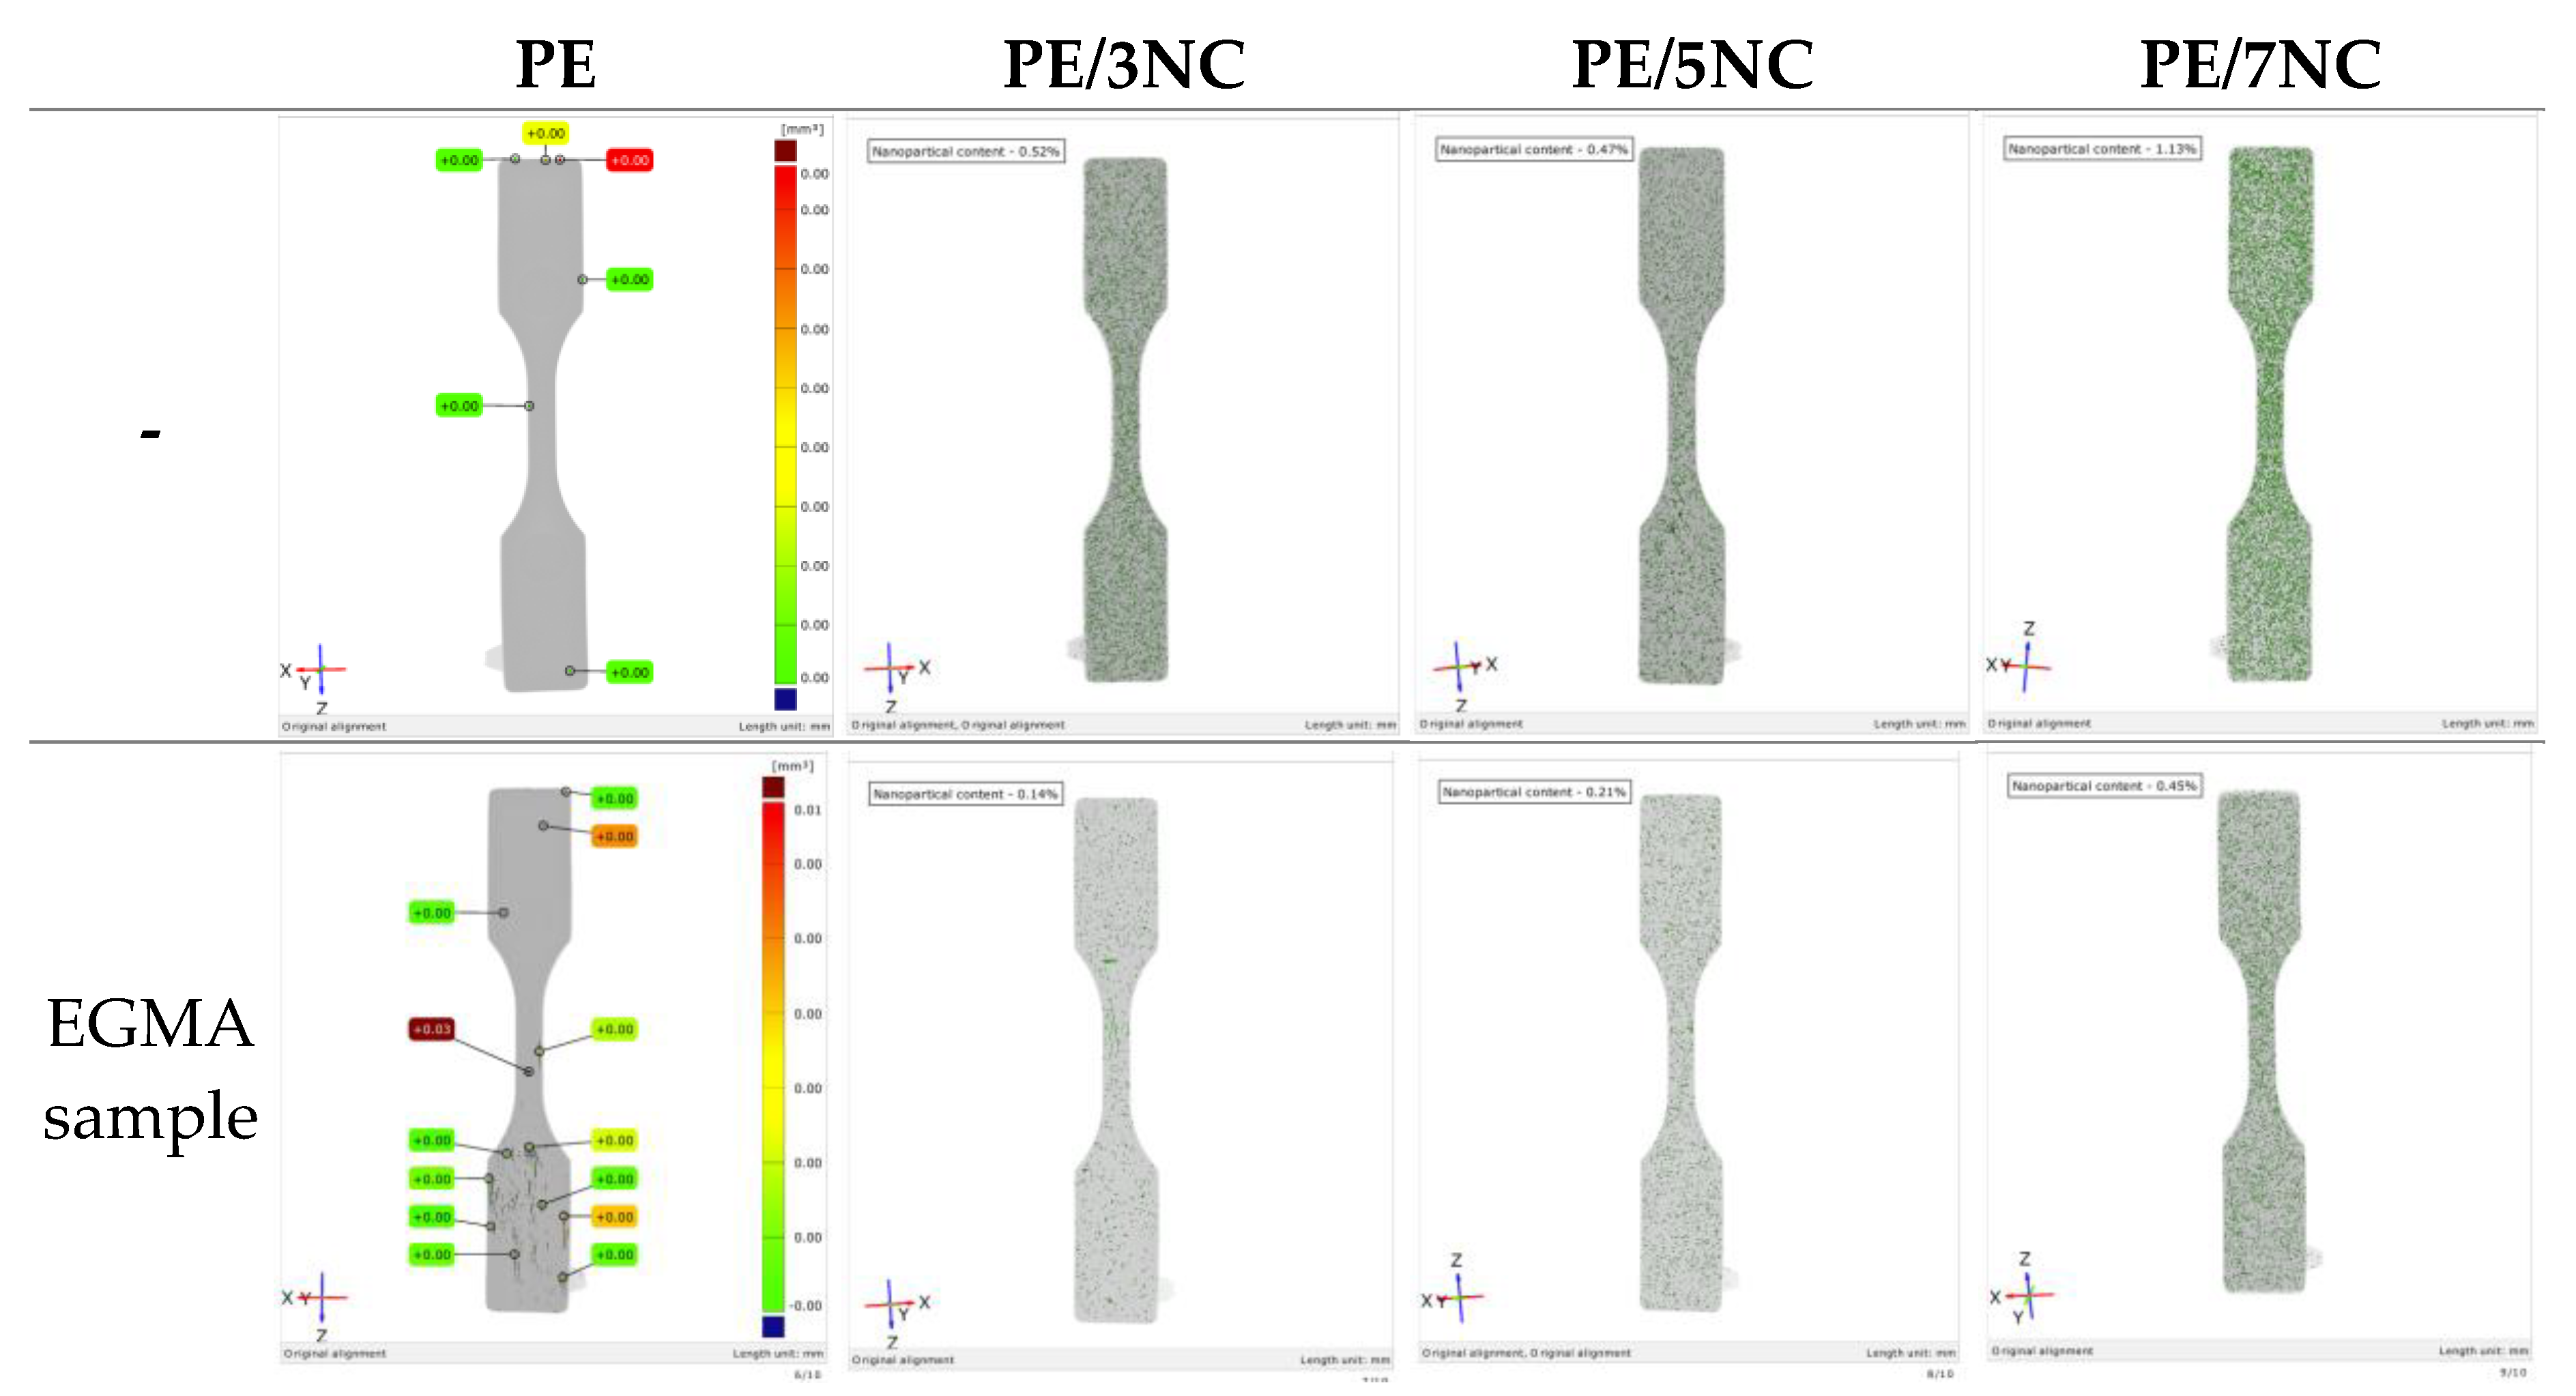
Figure 3.
SEM micrographs of composite film samples. Column [1] determined silicon content of sample; Column [2] micrograph of formulation not containing EGMA; Column [3] determined silicon content of EGMA-containing formulation; Column [4] micrograph of EGMA-containing formulation. [a] 3wt. % MMT, [b] 5 wt. % MMT and [c] 7 wt. % MMT.
Figure 3.
SEM micrographs of composite film samples. Column [1] determined silicon content of sample; Column [2] micrograph of formulation not containing EGMA; Column [3] determined silicon content of EGMA-containing formulation; Column [4] micrograph of EGMA-containing formulation. [a] 3wt. % MMT, [b] 5 wt. % MMT and [c] 7 wt. % MMT.
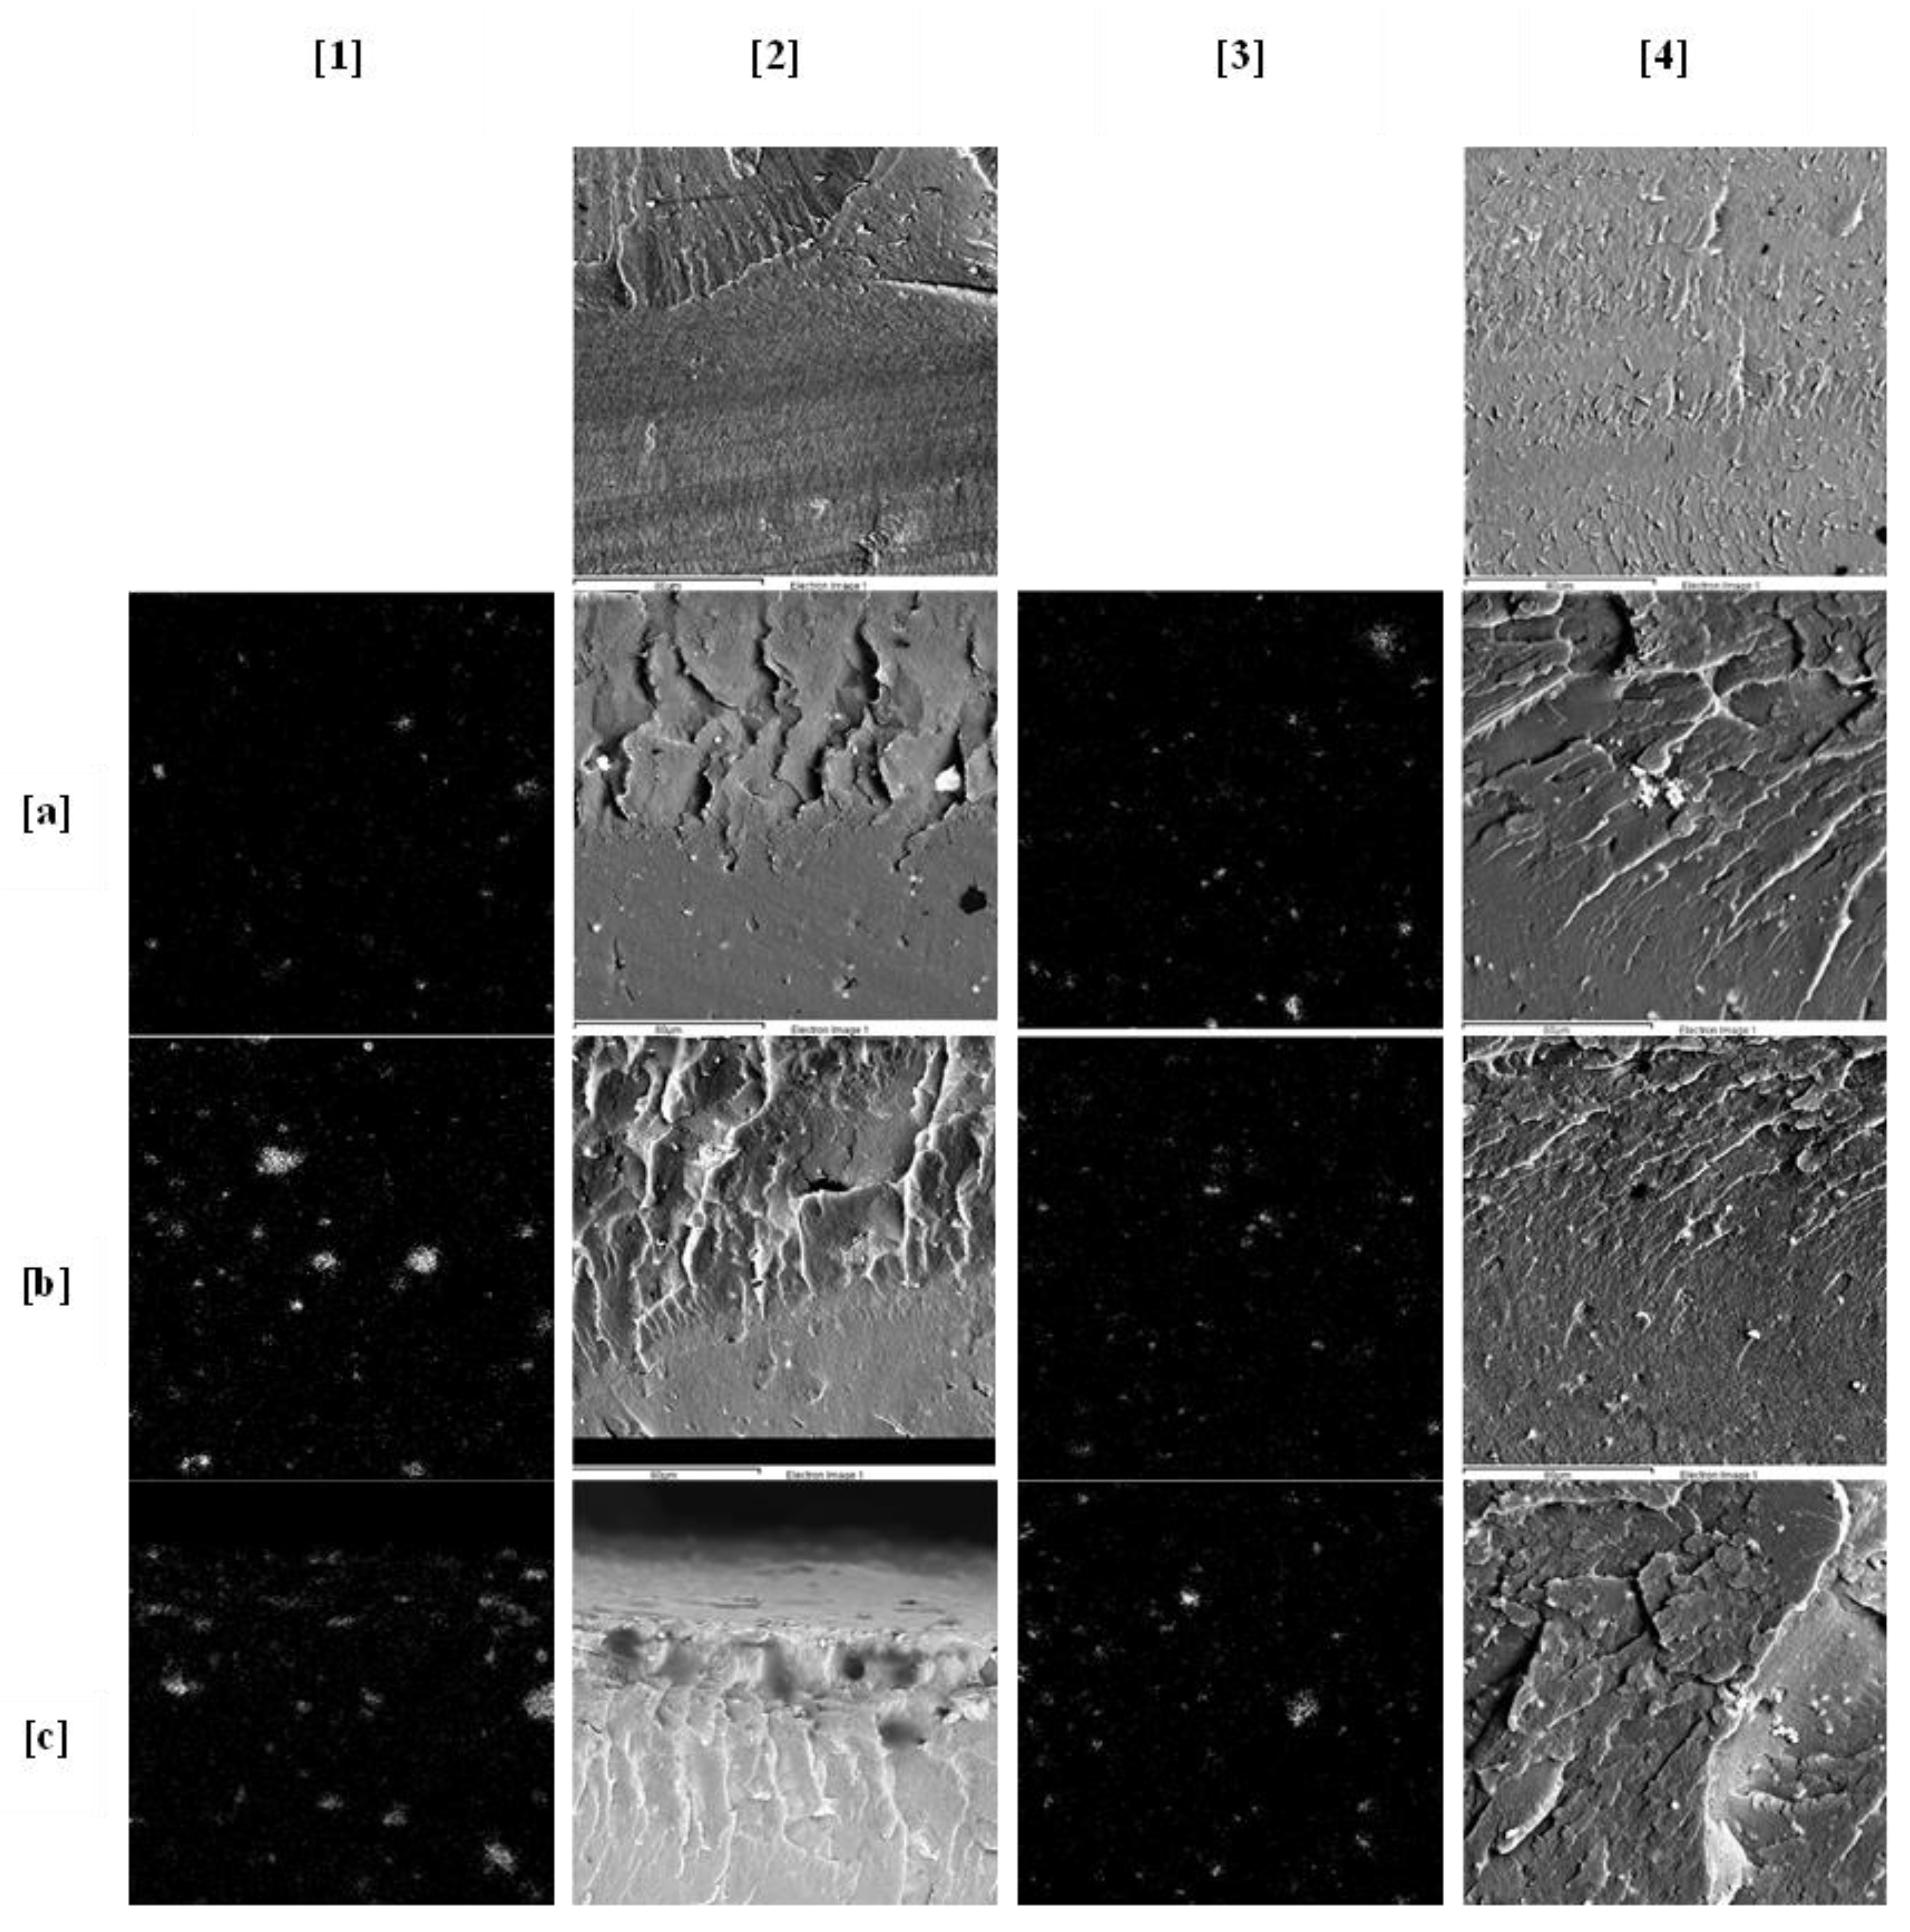
Figure 5.
DSC thermogram for 2nd heating cycle of PE, PE-MMT and PE-EGMA-MMT composite samples.
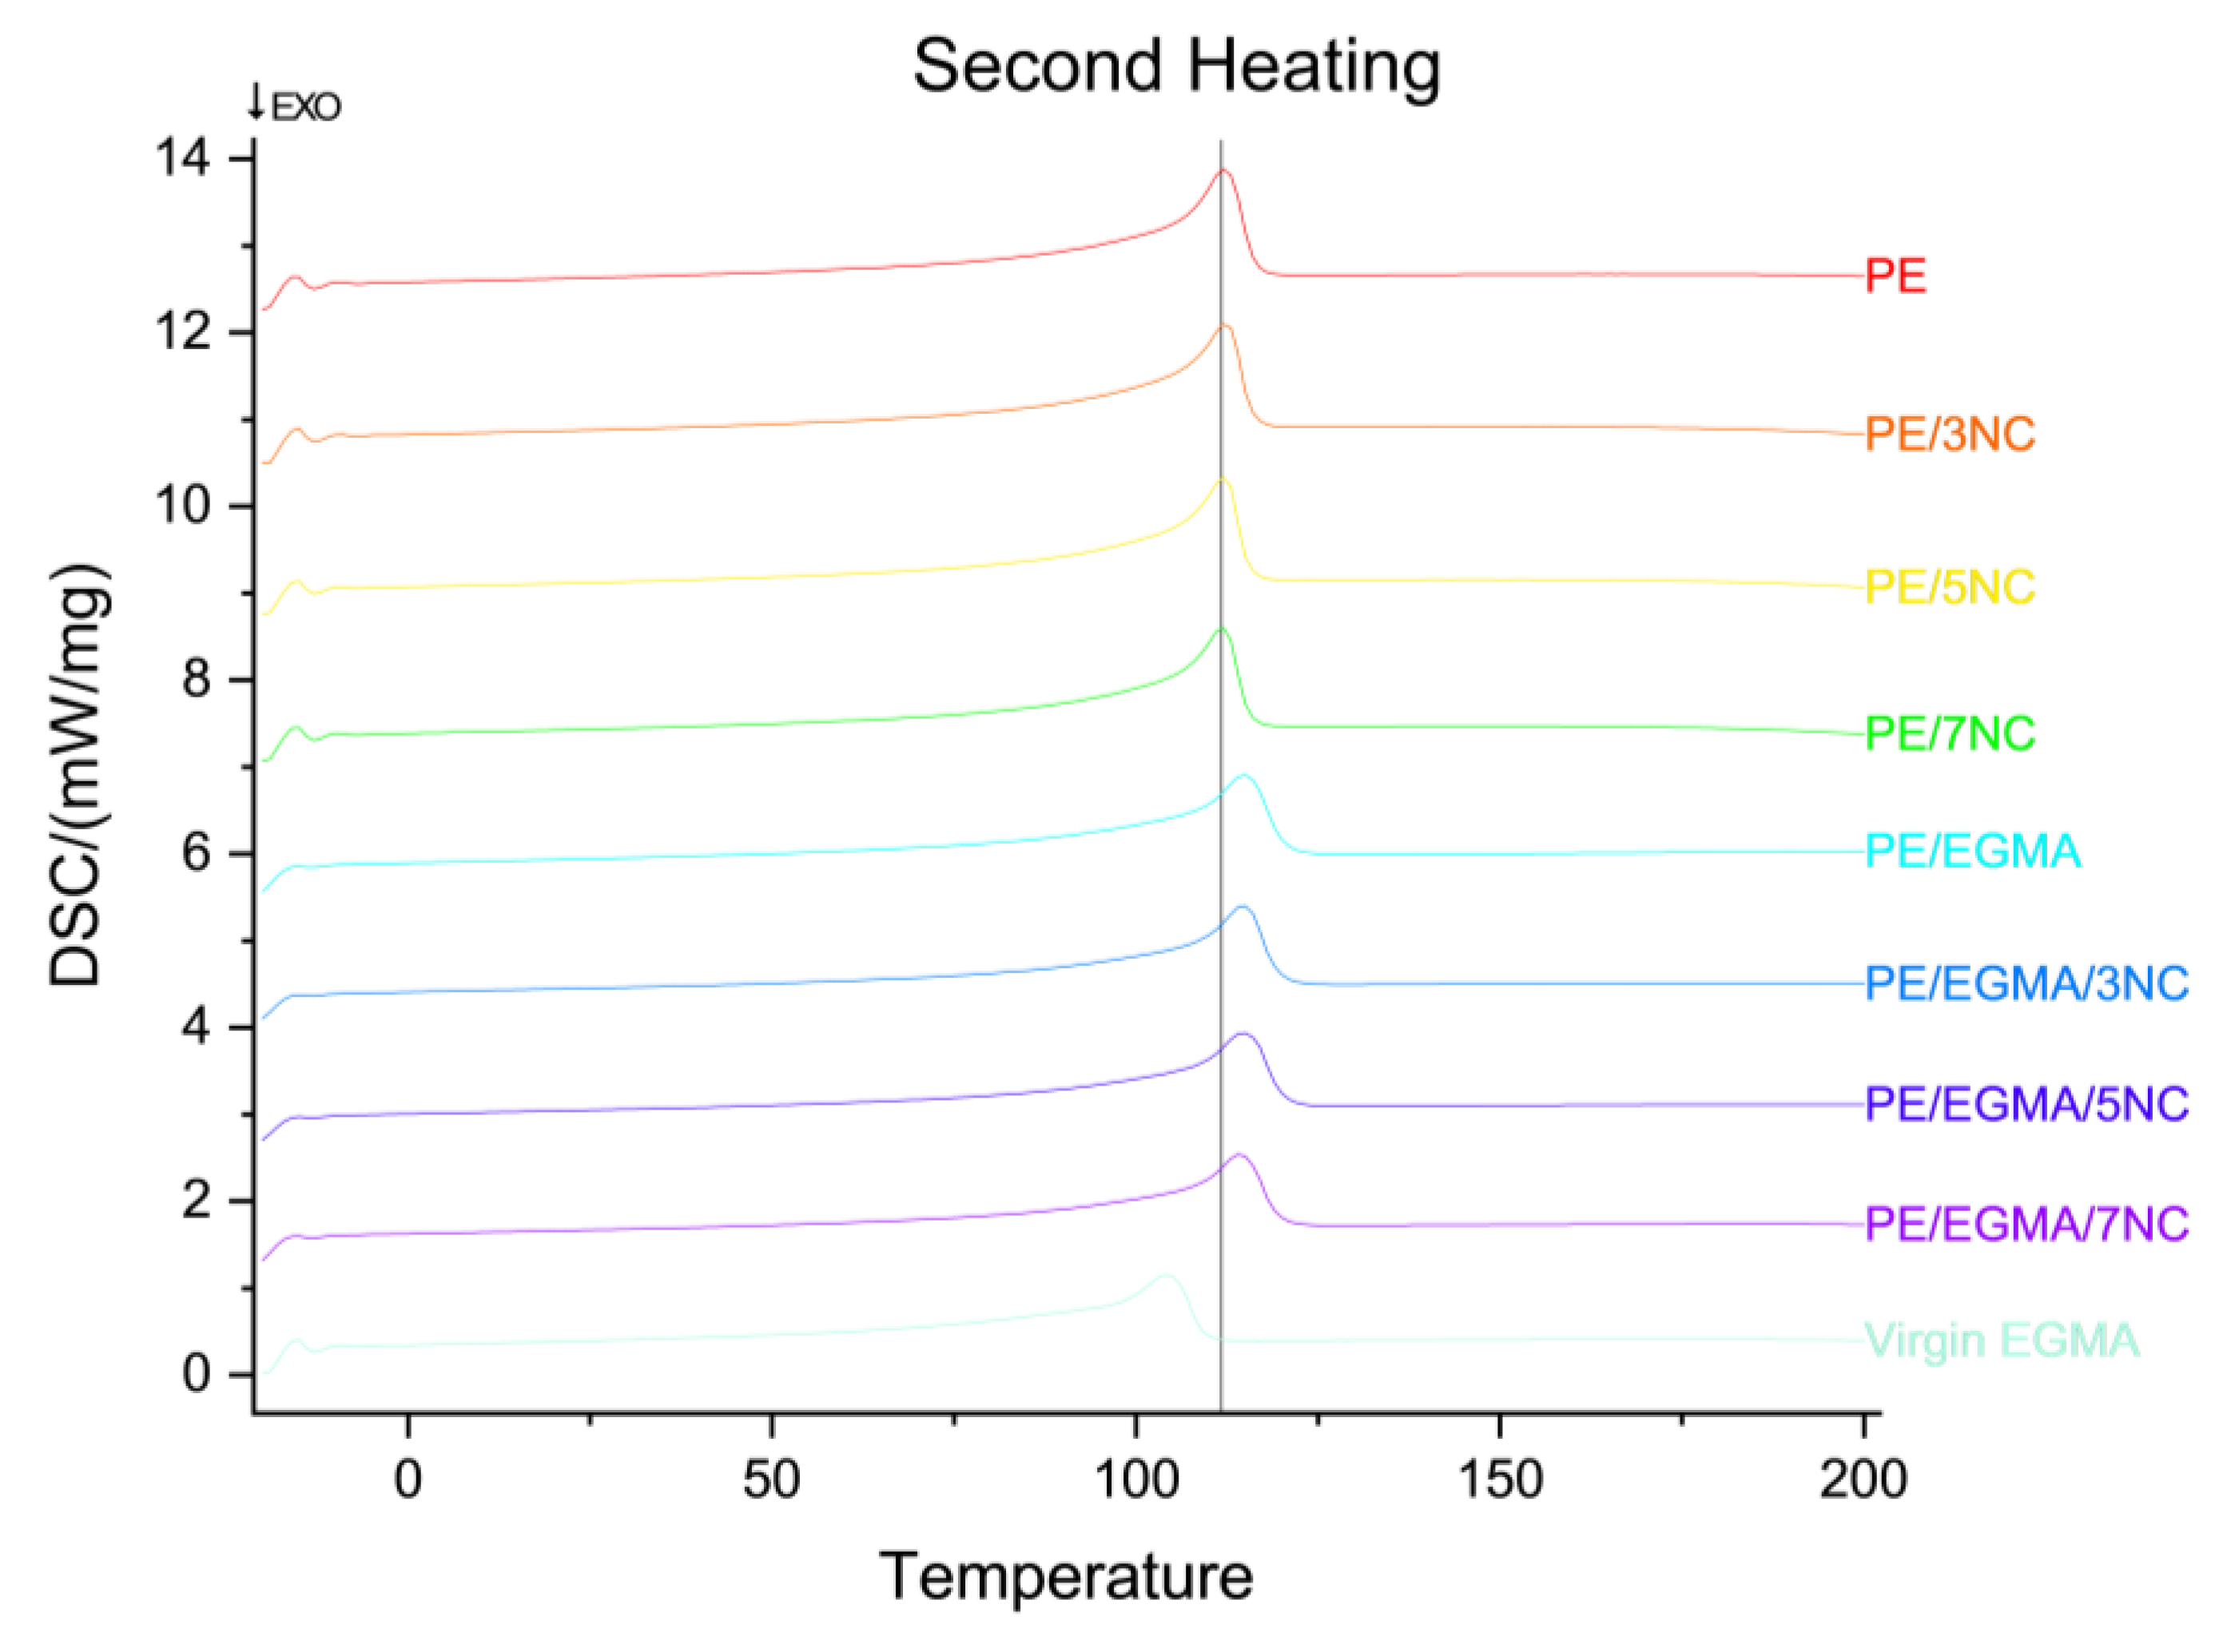

Table 1.
The composition of PE, EGMA & MMT in samples for the DOE.
| PE (wt.%) | EGMA (wt.%) | MMT (wt.%) | |
| PE | 100 | 0 | 0 |
| PE/3NC | 97 | 0 | 3 |
| PE/5NC | 95 | 0 | 5 |
| PE/7NC | 93 | 0 | 7 |
| PE/EGMA | 90 | 10 | 0 |
| PE/EGMA/3NC | 87 | 10 | 3 |
| PE/EGMA/5NC | 85 | 10 | 5 |
| PE/EGMA/7NC | 83 | 10 | 7 |
Table 2.
Percentage of MMT content observed though SEM & Micro CT.
| Sample | Micro CT (vol. %) |
|---|---|
| PE | 0.00 |
| PE/3NC | 0.52 |
| PE/5NC | 0.47 |
| PE/7NC | 1.13 |
| PE/EGMA | 0.00 |
| PE/EGMA/3NC | 0.14 |
| PE/EGMA/5NC | 0.21 |
| PE/EGMA/7NC | 0.54 |
Table 3.
Density values of PE-MMT & PE-EGMA-MMT samples. Ρtheo = theoretical density as calculated using (1) & (2).
Table 3.
Density values of PE-MMT & PE-EGMA-MMT samples. Ρtheo = theoretical density as calculated using (1) & (2).
| Experiment density (g cm-3) | Ρtheor (g cm-3) | |
|---|---|---|
| PE | 0.921 ± 0.003 | 0.91 |
| PE/3NC | 0.937 ± 0.002 | 0.93 |
| PE/5NC | 0.949 ± 0.001 | 0.94 |
| PE/7NC | 0.966 ± 0.002 | 0.95 |
| PE/EGMA | 0.921 ± 0.001 | 0.91 |
| PE/EGMA/3NC | 0.940 ± 0.001 | 0.93 |
| PE/EGMA/5NC | 0.946 ± 0.001 | 0.94 |
| PE/EGMA/7NC | 0.963 ± 0.002 | 0.95 |
Table 4.
Thermal properties of PE-MMT and PE-EGMA-MMT composite samples. Tm = melting temperature, ∆Hm = enthalpy of fusion, Tc = crystallisation temperature, ∆Hc = enthalpy of crystallisation and Xc = percentage of crystallinity as calculated by (3).
Table 4.
Thermal properties of PE-MMT and PE-EGMA-MMT composite samples. Tm = melting temperature, ∆Hm = enthalpy of fusion, Tc = crystallisation temperature, ∆Hc = enthalpy of crystallisation and Xc = percentage of crystallinity as calculated by (3).
| First Heating | Cooling | Second Heating | ||||||
|---|---|---|---|---|---|---|---|---|
| Tm (°C) | ∆Hm (J g-1) | Xc1 (%) | Tc(°C) | ∆Hc (J g-1) | Tm 2 (°C) | ∆Hm2 (J g-1) | Xc2 (%) | |
| PE | 115.55 | 131.90 | 45.02 | 96.55 | 123.15 | 112.20 | 129.55 | 44.22 |
| PE/3NC | 113.85 | 134.15 | 47.20 | 96.55 | 134.70 | 112.45 | 128.45 | 45.20 |
| PE-/5NC | 114.65 | 128.85 | 46.29 | 96.85 | 126.85 | 112.10 | 122.00 | 43.83 |
| PE/7NC | 115.25 | 112.65 | 41.34 | 96.75 | 116.50 | 113.25 | 112.15 | 41.16 |
| EGMA Virgin | 104.15 | 89.64 | 30.59 | 87.55 | 99.44 | 104.25 | 92.11 | 31.44 |
| PE/EGMA | 117.75 | 106.10 | 36.21 | 95.90 | 116.60 | 114.85 | 111.20 | 37.95 |
| PE/EGMA/3NC | 116.50 | 104.60 | 36.80 | 96.25 | 102.35 | 114.85 | 107.80 | 37.93 |
| PE/EGMA/5NC | 115.40 | 103.55 | 37.20 | 96.30 | 112.65 | 114.40 | 106.00 | 38.08 |
| PE/EGMA/7NC | 115.60 | 97.36 | 35.73 | 96.55 | 104.10 | 114.00 | 99.41 | 36.48 |
Table 5.
Determined permeability values for PE, PE-MMT and PE-EGMA-MMT composite films. T21% = transmission at 21% & T100% = transmission at 100%.
Table 5.
Determined permeability values for PE, PE-MMT and PE-EGMA-MMT composite films. T21% = transmission at 21% & T100% = transmission at 100%.
| PE | PE/3NC | PE/5NC | PE/7NC | PE/EGMA | PE/EGMA/3NC | PE/EGMA/5NC | PE/EGMA/7NC | |
|---|---|---|---|---|---|---|---|---|
| T21% | 121 | 215.5 | 153 | 342 | 132 | 137 | 102 | 202 |
| T100% | 575 | 1025 | 729 | 1627.5 | 625 | 655 | 487 | 961 |
| Permeability | 256,718 | 284,799 | 192,201 | 344,431 | 246,742 | 225,939 | 235,642 | 250,884 |
Table 6.
Measured water contact angles of the PE, PE/MMT and PE/EGMA/MMT composite samples (n=5).
| PE | PE/3NC | PE/5NC | PE/7NC | PE/EGMA | PE/EGMA/3NC | PE/EGMA/5NC | PE/EGMA/7NC | |
|---|---|---|---|---|---|---|---|---|
| Contact angle (°) | 93.42 | 89.15 | 88.37 | 86.91 | 97.78 | 93.05 | 88.41 | 88.82 |
| Std.Dev. | 5.34 | 4.74 | 1.78 | 2.81 | 3.55 | 2.29 | 3.85 | 2.31 |
Table 7.
Determined tensile properties of the composite samples. σu = ultimate tensile strength, E = Youngs modulus & Ag = elongation at max.
Table 7.
Determined tensile properties of the composite samples. σu = ultimate tensile strength, E = Youngs modulus & Ag = elongation at max.
| PE | PE/3NC | PE/5NC | PE/7NC | |
| σu (MPa) | 22.37±0.06 | 22.52±0.26 | 22.86±0.21 | 21.92±0.48 |
| E (MPa) | 295.45±37.57 | 295.25±92.50 | 344.50±48.70 | 348.80±63.40 |
| Ag (%) | 49.96±5.18 | 42.74±2.71 | 39.68±1.34 | 34.89±12.07 |
| PE/EGMA | PE/EGMA/3NC | PE/EGMA/5NC | PE/EGMA/7NC | |
| σu (MPa) | 21.98±0.40 | 21.88±0.27 | 22.1±0.24 | 21.69±0.34 |
| E (MPa) | 297.38±45.17 | 338.63±45.88 | 343.81±31.29 | 349.87±98.36 |
| Ag (%) | 60.97±5.38 | 47.60±3.68 | 47.68±0.96 | 42.01±3.76 |
Disclaimer/Publisher’s Note: The statements, opinions and data contained in all publications are solely those of the individual author(s) and contributor(s) and not of MDPI and/or the editor(s). MDPI and/or the editor(s) disclaim responsibility for any injury to people or property resulting from any ideas, methods, instructions or products referred to in the content. |
© 2026 by the authors. Licensee MDPI, Basel, Switzerland. This article is an open access article distributed under the terms and conditions of the Creative Commons Attribution (CC BY) license (http://creativecommons.org/licenses/by/4.0/).
Copyright: This open access article is published under a Creative Commons CC BY 4.0 license, which permit the free download, distribution, and reuse, provided that the author and preprint are cited in any reuse.