

Submitted:
06 November 2026
Posted:
09 November 2026
You are already at the latest version
Abstract
Recent advances in ambient sensing, speech processing, and smart-home technologies have enabled the passive monitoring of human activities in domestic environments. Existing systems primarily focus on detecting speech presence, social interaction occurrence, emotional states, or individual behavioral indicators. However, limited work has explored how continuous in-home sensing can support reflection on family-level social dynamics while preserving privacy and avoiding judgmental or diagnostic interpretations. We present and evaluate a privacy-preserving, locally processed household sensing architecture that integrates distributed audiovisual sentinels, speech analytics, structured interaction abstractions, and longitudinal evidence retrieval. The study evaluates selected components under controlled and household deployment conditions and identifies the limitations of automated relational interpretation, particularly in the presence of incomplete observations and generative language-model errors. This work aims to gradually bring AI agents at home towards a more intimate human-machine relationship. We initiate this co-existence through a privacy-preserving platform that utilizes distributed room-level audiovisual sentinels and on-premises speech analytics to derive longitudinal indicators of household relational dynamics. These indices include Warmth, Joy, Tension, and Withdrawal. Rather than attempting to infer subjective constructs such as happiness, depression, or marital satisfaction, it focuses on observable conversational behaviors including participation balance, responsiveness, conflict intensity, repair after conflict, and social inclusion. The system introduces a smartwatch-like visualization framework that communicates family-level and dyadic social dynamics through ambient and interpretable visualizations. Weekly reports summarize patterns of connection while maintaining a non-judgmental approach. Our aim is to establish an evidence-grounded relational representation of the family system, in which software agents coexist with human residents as tools for observation, communication, and reflection that will follow them for decades. In this work, we narrow our aim as to whether the system can identify observable interactional behaviors under clearly defined conditions. We have the ambition to initiate a trend where everyone is allowed to design their personal in-home agent, therefore we provide a large open codebase that enables researchers and developers to implement, examine, and extend the proposed framework within their own homes.
Keywords:
artificial intelligence
; family dynamics
; smart home
; ESPRESSIF systems
1. Introduction
Everyday home activities generate a continuous stream of audiovisual data regarding behaviors, routines, and interpersonal interactions. Most of this information remains unutilized. This work investigates whether selective data from this stream can be transformed into functional representations for residents without compromising their well-being [1]. We propose extending the concept of the home from a static physical structure to a context-aware system—termed here an "affectionate home"—capable of perceiving, interpreting, and adaptively responding to changing resident needs.
Families increasingly interact with digital technologies that continuously monitor aspects of everyday life [2,3]. Smartwatches, smartphones, smart speakers, and ambient sensing systems routinely capture behavioral information that can be transformed into indicators of physical activity, sleep quality, stress, recovery, and social engagement [4]. Although family informatics and passive sensing have addressed family interaction and affect, relatively little work has investigated longitudinal household-level representations of interpersonal dynamics from distributed audiovisual sensing [5,6,7,8,9].
Several streams of prior research have investigated components related to this problem. Family informatics systems have explored the visualization of family interactions and affective states using passive sensors. FamilyScope [10] demonstrated how sensor-derived information can support reflection on family interactions and social behavior. Parent-child sensing studies have examined the feasibility and acceptability of capturing conversational and behavioral signals in domestic environments [11]. Smart-home research has investigated the detection of social interaction and activity patterns using ambient sensors, while wearable systems such as SocialBit [12] have shown that conversational activity can be inferred from opportunistically captured audio. Additionally, extensive work in speech emotion recognition, computational paralinguistics, speaker diarization, and conversational analysis has enabled the extraction of increasingly sophisticated behavioral signals from natural speech [13,14,15,16,17,18].
Despite these advances, existing systems exhibit several limitations. First, many approaches focus on individual users rather than the family as a social system. Second, most audio-based systems are designed to detect the presence of interaction, emotional states, or isolated behavioral events rather than characterize the quality of interpersonal relationships over time. Third, current wellbeing technologies rarely model processes such as conflict recovery, warmth, tension, and social repair, which are central to healthy family functioning.
Our proposed architecture consists of low-cost audiovisual sensing devices, referred to as sentinels, distributed across the rooms of a house reporting through Wi-Fi connectivity incidents to a local computing server that hosts software agents. The sentinels provide information about events and verbal exchange occurring within the home, while the local server performs the analysis required to derive higher-level representations of these events. This local architecture is intended to make services available without requiring the computational infrastructure of a remote data center.
Researchers have explored technologies that help families reflect on their activities and relationships [19,20,21] but many proposed solutions rely on cloud processing and opaque analytics, creating concerns regarding privacy, transparency, and user trust. Privacy is a central design constraint. The system is omnipresent but raw audiovisual data are not intended to ever leave the home. The system endows the home with a cortex that lives and acts only inside the home and only in emergencies and with moderation can reach outside the home.
The main application considered in this work is the analysis of interpersonal dynamics within the home. The system can combine observations collected over time to identify patterns in interactions, activities, and changes in relationships. The purpose is not to assign blame or criticize participants. Instead, the system can present facts and formulate questions on a weekly basis that may support reflection by the residents. If residents decide to cooperate with automated voice agents, the agents must provide a sufficiently broad set of services to justify their continuous presence within the home. Interpersonal-dynamics analysis is therefore considered one component (a milestone) of a larger home-assistance framework. The range of possible services ranging from surveillance when residents are absent, tutoring and language support, psychological support, legal counseling will be examined in subsequent work.
Voice assistants already influence family communication patterns [22,23,24]. The novelty of this work lies in applied systems engineering, where innovation is realized through domain selection, architectural integration, and constraint-driven implementation rather than purely theoretical formulation. Rather than inventing isolated algorithms, this research addresses a high-impact, unsolved human and social problem and introduces new services by synthesizing a broad spectrum of established techniques—spanning digital signal processing, pattern recognition, and edge AI—into a unified, operational architecture. To our knowledge, previous systems have not combined these capabilities into a single longitudinal, locally processed household architecture. We identify three concrete contributions:
a) We introduce family-centered sensing, i.e. treating the household and its dyadic/group interactions as the primary analytical unit rather than only individual states.
b) We support longitudinal relational abstraction: transforming heterogeneous observations into structured indicators of interactional phenomena such as participation, inclusion, tension, repair and recovery. The system introduces a longitudinal family-informatics architecture in which privacy-preserving daily observations are incrementally accumulated into a structured household knowledge graph, enabling evidence-grounded reasoning over relational patterns that emerge across extended periods of domestic life.
c) We suggest a privacy-preserving local architecture. We implement this pipeline using distributed low-cost sentinels and on-premises processing, with progressive abstraction and controlled retention of audiovisual information.
We acknowledge that many individuals exhibit resistance toward technological intervention in domestic life, with some harboring deep skepticism or anxiety driven by artificial intelligence hype. Furthermore, while individuals frequently express high confidence in their personal decisions, published statistics consistently demonstrate a stark divergence from initial intentions. First, although marriages are overwhelmingly initiated under long-term commitments, evolving relational dynamics contribute to divorce rates approaching 40–50% across Western nations [25]. Second, despite the recognized importance of family support structures, pediatric psychiatric hospitalizations have experienced a sustained upward trajectory over the past decade [26]. Third, domestic environments harbor significant non-intentional hazards; preventable home injuries account for over 100,000 fatalities annually in the United States alone [27].
Rather than evaluating technological systems against an idealized model of human self-regulation or family harmony, this work adopts a pragmatic framework centered on real-world operational realities. Because individuals operating in complex social environments often become absorbed in their own perspectives and goals, we investigate whether automated ambient monitoring can provide objective observations within non-ideal living conditions. Conversation structure can reveal conflict, cooperation, and repair [28,29]. By being an independent observer delivering unobtrusive, factual reports and questions directly to residents, such systems offer actionable behavioral self-reflection, enabling individuals to identify early relational or environmental drift and proactively adjust their domestic trajectories [30,31]. This is a proof of concept paper inclined towards technology and recruiting more households is not currently feasible for us. Therefore, what we present is a single-household feasibility and systems evaluation of a privacy-preserving architecture for longitudinal family interaction analysis. We provide a substantial open codebase to ensure reproducibility (see Appendix).
2. Materials and Methods
It is already recognized that audio and conversational signals provide insight into family interactions [32,33,34]. The sentinels we use are designed to be sufficiently low-cost to allow one device to be installed in each room, forming a distributed sensing and communication network throughout the home. Each sentinel integrates some or all of the following: a microphone, loudspeaker, display, camera, and Wi-Fi connectivity.
The microphone captures acoustic information within the room, including speech and non-speech sounds. This enables the system to detect and analyze events that may be relevant to the operation of the home, including mechanical sounds, environmental events, and human activity.
The loudspeaker combined with the microphone provides a bidirectional communication channel between home’s ambient intelligence and its residents. Consenting family members (or authorized caregivers in case of elderly care) outside home can use this closed network to broadcast audiovisual content to a sentinel inside a particular room where the person of interest resides directly, without accept-call procedure [35,36]. The home agent can use the same channel to deliver notifications, provide information, or engage a resident in a spoken interaction using a text to speech (TTS).
Our most sophisticated sentinel type features an integrated display capable of video presentation. Beyond standard text messages and graphical data, the screen can display either an avatar representing the home agent during interactions or an abstracted stick-figure rendering of a resident, offering a visual communication channel alongside speech. While we have implemented response through avatars with cloned voices, in this work, we focus primarily on family dynamics to maintain the thematic coherence of this presentation.
The camera serves a different function in this work. Its primary purpose is not communication but observation and disambiguation of events. Visual information can be analyzed locally by the home server to determine aspects of the current situation, such as the presence and location of people so that the presence and location of residents is known and the system routes messaging to the correct sentinel.
The sentinels communicate with the local server through Wi-Fi. The server integrates information from the different rooms and provides the computational resources required for multimodal analysis and interaction. The distributed architecture therefore allows the system to associate information from individual rooms while maintaining the physical and computational infrastructure within the home. Because family dynamics analysis relies on generating increasingly complex abstractions, maintaining raw data is unnecessary. By design, raw daily feeds are completely inaccessible—even to the primary residents. This reflects a fundamental privacy paradigm: individual household members possess an absolute right to privacy, even at the interpersonal and intra-household level.
2.1. Hardware
The sentinel network was evaluated incrementally to determine the minimum hardware configuration required for each class of service. We do not follow the approach of one strong or loud device to cover as much of the home as possible and we suggest smaller sentinels and their ability to operate as a network. This approach was motivated by the requirement to deploy one sentinel in each room. Therefore, the cost and complexity of the individual device are relevant to the scalability of the system. The evaluated platforms were the ESP32, ESP32-S3, ESP32-S3-BOX-3, and a Waveshare ESP32-P4-WIFI6-Touch-LCD-5 with an OV5647 camera and loudspeaker. All firmware was developed using Espressif IoT Development Framework (ESP-IDF) version 5.5.3 with chipsets ESP, ESP32 and ESPP4 respectively.
The simplest configurations were based on ESP32 and ESP32-S3 devices equipped with a MEMS microphone and Wi-Fi connectivity (see [35,36] for details). These devices were used primarily as acoustic sensing nodes. Their embedded flash memory was allocated to firmware and system operation rather than to persistent storage of audiovisual recordings. Consequently, they were incapable of storing audio or video content locally. Their role was to acquire sensor data and transmit the required information to the local server on the fly. An indicative price is 20E/device.
The ESP32-S3-BOX-3 provides a more complete human–machine interface. The device is based on an ESP32-S3-WROOM-1 module and includes 512 kB SRAM, 16 MB flash, 16 MB octal PSRAM, 2.4-inch 320 × 240-pixel touch display, two digital microphones, a loudspeaker, and 2.4-GHz Wi-Fi and Bluetooth Low Energy connectivity. The audio subsystem includes an ES8311 codec and an ES7210 microphone interface/ADC. The display is sufficient for text, status information, and graphical interfaces and insufficient for video streaming. Its indicative market price is approximately 50E, depending on supplier.
The highest-capability platform evaluated was the Waveshare ESP32-P4-WIFI6-Touch-LCD-5. It combines an ESP32-P4 RISC-V processor with an ESP32-C6-MINI module acting as a Wi-Fi 6/Bluetooth 5 co-processor. The board provides 32 MB PSRAM and 32 MB NOR flash, a 5-inch 720×1280-pixel capacitive IPS touchscreen, dual microphones, an ES7210 echo-cancellation circuit, an ES8311 audio codec, an 8-Ω 2-W speaker, MIPI-CSI camera input, MIPI-DSI display output, USB 2.0 OTG, and an SDIO 3.0 TF-card interface. The version we used in this work was equipped with the 5-Mpixel OmniVision OV5647 camera. The camera supports still images up to 2592×1944 pixels and video modes including 1920 × 1080 at 30 frames/s and 1280×720 at 60 frames/s. The manufacturer lists the ESP32-P4 Wi-Fi 6, 5" Touch Display board at approximately 70E.
The ESP32-P4 provides hardware support for image processing and video compression that is not available on the simpler ESP32 configurations. Audio input and output are handled through the onboard ES7210 and ES8311 devices, providing the hardware interfaces required for microphone acquisition, echo cancellation, audio encoding/decoding, and loudspeaker output.
Only the ESP32-S3-BOX-3 and ESP32-P4 platforms provide SD card-readers. However, these interfaces were not used for persistent storage of audiovisual content in this study. This was an intentional architectural decision rather than a limitation of the hardware. Our target architecture is different: future audiovisual sentinels should not contain persistent storage capable of retaining audio or video recordings at all. The purpose of the sentinel is to acquire, process, and forward information, while persistent storage and higher-level analysis remain under the control of the local server.
To minimize hardware requirements, the local server was initially implemented on a laptop equipped with an NVIDIA RTX 3060 GPU (6 GB VRAM). We also evaluated the system on a laptop featuring an NVIDIA RTX 5050 GPU (8 GB VRAM), which provided smoother performance. GPU acceleration is required for ASR, CLAP, and LLM processing, as these models perform computationally intensive tasks—such as audiovisual analysis, higher-level event interpretation, and agent interaction—that are impractical on individual sentinels or CPU only.
The progressive evaluation of these platforms was also intended to establish a cost–capability hierarchy. Simple ESP32/ESP32-S3 nodes provide acoustic sensing at low hardware cost; the ESP32-S3-BOX-3 adds bidirectional audio and are used as bedside sentinels while the ESP32-P4 platform adds camera input and high-resolution video display for talking faces, real or artificial (see Figure 1). This hierarchy allows the system to deploy the least capable device that satisfies the requirements of a particular room or service, rather than requiring every room to contain the most capable and expensive sentinel. All devices sample audio at 16 kHz PCM WAV mono. Once connected to power they autoboot and auto trigger based on audio activation. Triggering is based on the RMS value of audio. The threshold of audio events is tracked so that the threshold dynamically adjusts to different levels of background noise through the day (typically higher in the morning and lower at night).
2.2. System Deployment in Residence
The system was evaluated in a real-world single-household deployment over a period of 90 days. The occupied primary residence comprised three people. The location of the sentinels is depicted in a diagram (see Appendix A1). Sentinels are strategically positioned in high-interaction domestic zones—such as bedsides, living rooms, sofas, and kitchen tables—to ensure localized audio capture. The core architectural principle is to achieve complete acoustic coverage across all rooms using cost-effective sentinels. When a resident speaks or an acoustic event occurs, the nearest sentinel captures the signal, yielding the highest direct-to-reverberant ratio and minimal room reverberation. To eliminate redundant recordings when multiple units capture the same acoustic event, the central server performs cross-correlation across incoming audio streams within a 30-second rolling window. When two or more streams exhibit a cross-correlation coefficient exceeding 0.50, the system retains only the candidate stream with the highest Signal-to-Noise Ratio (SNR) and discards the rest. To derive the SNR, the amplitude envelope is first extracted using a 20 ms moving average on the absolute value of the samples. The 90th percentile of this envelope serves as a proxy for speech level, while the 10th percentile establishes the noise floor. The decibel ratio of these two values yields the score. Strictly speaking, this metric quantifies the dynamic range of the envelope rather than a true SNR, serving as a lightweight ranker that requires no downstream model or Voice Activity Detection (VAD). Furthermore, this approach implicitly penalizes acoustic reverberation: residual energy fills inter-syllabic pauses, elevating the 10th-percentile noise floor and automatically down-weighting distant, echoic audio streams. Filtering based on a cross-correlation threshold over a 30-second window, paired with discarding streams with a signal-to-noise ratio (SNR) below 10 dB, proved highly effective at removing duplicate and low-quality recordings. Deploying one sentinel per room ensured no loss of useful audio, as the closest device consistently captured the primary signal. During research deployments, multi-sentinel processing and analytics were managed via the dashboard (Figure 2). In operational settings, this interface is not accessible. In the following paragraphs of section 2, we present the components that lead to the server’s dashboard, part of which is depicted in Figure 2.
2.3. Software
While end-to-end vision-language models (VLMs) may eventually streamline home’s audiovisual processing or even become integrated parts of cameras serving as action-based smart-filters, current architectures (as of 2026) remain substantially less reliable on causal reasoning and counterfactual visual inference [37,38]. Although VLMs that carry out high-level semantic tasks to some extent—such as real-time hazard detection or action recognition—they lack understanding of physical laws and domain context, and they require complex infrastructure. Many current VLMs remain computationally demanding for the low-power embedded devices targeted by our architecture. To overcome these constraints, our framework decomposes the raw feed into distinct structural perspectives using classical signal processing, then routes these localized fragments to local LLMs to synthesize high-level scene abstractions. Hereinafter, we analyze these software components.
2.3.1. System Messaging (MQTT)
Rather than using different channels for different tasks, all communication between sensing units and the server goes through Message Queuing Telemetry Transport (MQTT), a lightweight networking built for efficient device-to-server messaging. A central Mosquitto broker hosted on the server manages this traffic. Every device and server module connects using paho-mqtt 2.1.0, leveraging its per-topic callbacks and securing local network links with Transport Layer Security (TLS) using client certificates. This single MQTT network handles everything the system needs to do: announcing available devices, uploading audio files in tracked chunks, delivering commands to specific units, streaming live Opus audio, and exchanging offer/answer details via Interactive Connectivity Establishment (ICE) to route and establish video calls. On the server, a single adapter handles all raw MQTT traffic. It pieces incoming file fragments back together, writes finished files to an inbox folder, and logs unit statuses. Because this adapter manages the connection, no other server module needs to connect to the broker directly.
2.3.2. Processing Voice and Text
To keep performance fast and accurate, the system only transcribes audio when it knows someone is actually speaking. First, an audio classifier checks if speech is present. If it is, Silero VAD 6.0.0—a Voice Activity Detection (VAD) tool via the PyTorch 2.9.1 framework —scans the clip to find exact start and end times for spoken words. The system then uses this speech map in two different ways. For analyzing emotion and index retrieval, it cuts out all silence and glues the spoken parts together. But for transcribing text, it leaves the original audio intact—because cutting audio creates abrupt jumps that throw off transcription models. The text transcription is handled on a GPU using a local model: Whisper large-v3 AI model powered by CTranslate2 4.6.3 and fixed to the local language. In natural domestic life, speech-turns can be short and autodetection of language will not work. To get reliable results, the model uses zero temperature (so it doesn't improvise words) and a beam width of 5 (meaning it double-checks five candidate sentences before picking the best one). Finally, the system filters out repeated hallucinated and filler words. If an audio clip produces no text, the system labels why—whether it was stopped by the initial classifier, the speech detector, or the transcriber itself—so silent audio isn't confused with filtered errors. In Figure 3, we organize in a chart the listening and streaming mode of sentinels.
2.3.3. Speaker Recognition and Diarization
The system handles recognition and diarization as two separate questions, using two different pretrained models. The first is diarization — partitioning a recording into stretches of speech and deciding how many distinct voices are present, without knowing whose they are. This is handled by the pyannote/speaker-diarization-3.1 pipeline, (Hugging Face) and run through pyannote.audio 4.0.4 (with pyannote.core 6.0.1, pyannote.database 6.1.1), on the GPU where one is present. Its output is anonymous: a timeline of turns labelled SPEAKER_00, SPEAKER_01, and so on. The second objective— speaker recognition — attaches the names of the residents to those anonymous labels. Every stretch belonging to one diarization label is pooled into a single audio excerpt and passed through an ECAPA-TDNN voice-embedding network, speechbrain/spkrec-ecapa-voxceleb running under SpeechBrain 1.0.3, which condenses a voice into a 192-dimensional vector that characterises the speaker largely independently of the words spoken. Those fingerprints are compared, by cosine similarity, against an enrolled household roster: three residents (e.g., Ilyas, Rafael, Voula), each represented by the average of several reference recordings and stored in a small 4.5 KB profile file. The matching is deliberately closed-set — the nearest enrolled person always wins, on the assumption that a voice in this house belongs to someone who lives in it. Note that a threshold on top of the closed set turns weak matches into an ‘Unknown’ speaker. Without the floor, a visitor or a TV voice would be named as whichever resident it resembles most.
The three-minute acoustic corpus per speaker to derive each speaker’s model was collected as participants read a standard passage while walking slowly through the residence, automatically triggering nearby sentinels to capture their voice.
2.3.4. Attributing Emotional State in Speech
Understanding emotional tone is based on wav2vec2-large-robust fine-tuned on the MSP-Podcast dataset (a benchmark library for emotional speech) [39]. It is imported using transformers 4.45.2 and executes on the system's CPU to leave the GPU available for speech recognition. Instead of guessing categories immediately, the model scores speech across three fundamental emotional dimensions from 0 to 1: Valence (pleasant vs. unpleasant), Arousal (excited vs. calm), Dominance (assertive vs. submissive). Before analyzing any clip, the system resamples the audio to 16 kHz and balances its volume (peak-normalization). Without volume control, quiet voices are falsely flagged as sad or negative. Clips under 0.1 seconds are discarded. Next, the continuous numbers are translated into four practical labels (Happy, Neutral, Anger, or Sadness) using customized cutoff values tuned on 532 home audio samples. For instance, high positivity results in "Happy," while low positivity paired with high energy yields "Anger." To prevent false confidence, the system's confidence rating reflects how far a score is from a category boundary. If a sound sits right on the edge between "Neutral" and "Sad," the system reports it as uncertain rather than forcing a guess. All raw numerical scores are saved so these emotional boundaries can be fine-tuned later without re-running the heavy AI models.
2.3.5. Accessing Home Through a Mobile App
A second interface supports mobile devices so members of the family can access live channels and historical records directly from a mobile android phone that connects to the home server. Although applicable to various family communication scenarios, it was primarily introduced for remote monitoring of elderly parents with mobility issues by a family caregiver. The guardian can listen to the events through the android application to realize what happens at home and if one finds something concerning that demands verification, it can connect immediately with the home. The home server routes in streaming bilateral audio mode (see 2.3.7 for videocalls as well), without the need of call-acceptance to confirm a situation or reassure the elderly. Built using FastAPI 0.128.0 running under Uvicorn 0.40.0, this module runs as an independent process on its own dedicated port while sharing the existing network security certificates. This separation is technically necessary because the web dashboard uses a WSGI web server framework while FastAPI uses an asynchronous ASGI framework, preventing both from sharing a single process. To maintain clean architecture, the code is structured into API routes for user validation, dedicated services for each system feature, and a unified data adapter layer that interfaces with the system's underlying storage. Rather than duplicating logic, database queries leverage the same SQLite database and pandas 2.2.3 data analysis library as the main dashboard, accessing recordings directly from existing storage directories and reading device presence from a shared status file. A few visual summary functions were rewritten specifically for the mobile service because importing the original dashboard modules would mistakenly trigger dashboard page registrations and open active microphone connections. User security relies on PBKDF2-HMAC-SHA256 password hashing with unique user salts, temporary memory-stored bearer tokens, short-lived access credentials, long-lived refresh tokens, and rate limits to block brute-force login attempts, all implemented using standard built-in programming libraries suited for single-household deployment. Mobile features include daily system overviews, paginated event lists with category filtering, detailed event records, audio playback with scrubbable seeking, daily statistical summaries, hourly activity heatmaps, and a device directory indicating which hardware units support two-way audio and video calls. Two-way live audio runs over a continuous WebSocket connection where the mobile client sends 16 kHz uncompressed PCM audio that the server breaks down into 30-millisecond chunks expected by device firmware, while incoming audio streams from the unit are decoded from the Opus audio format on the server so mobile devices do not need specialized decoding software. Inactive audio sessions automatically time out to prevent dropped connections from causing units to stream indefinitely. Video calls use the same connection rules as standard web browsers through a central server, backed by extra security checks. Media content is handled entirely separately from this service process.
2.3.6. Videocalls
The dashboard also serves as the main operator control panel for managing P4 units, providing two completely independent video pathways. We have created this functionality mainly because we anticipate services originating out of home but served inside the home like remote attendance of elderly people with mobility problems and/or dementia. The first panel shows the unit's camera feed using a continuous HTTP JPEG uplink rather than an active call, ensuring the feed stays live whenever the unit is powered on regardless of call status while displaying frame rate, image resolution, total frame counts, and frame latency if the connection slows. The system automatically lists available devices from a shared status file, filtering for units with camera or video calling features. The second pathway handles active calls directly within the web browser, allowing the operator to choose local hardware for microphone, camera, and speaker inputs while locking the audio offer to the G.711 A-law codec at 8 kHz to ensure unit compatibility. Call audio is fully two-way, whereas video travels one-way toward the hardware unit over an SCTP data channel as complete JPEG frames matching the device's exact screen dimensions, skipping standard RTP protocols entirely. Operators can manually adjust frame rate and compression quality to prevent lag. Microphones and cameras can be muted independently during calls. The interface also supports incoming video frames from OV5647 at a low frame per second (fps) rate. This rate is sufficient to establish presence in a room and discern if there is a fall if the line of sight is clear. This media player captures displayed video frames to send over the data channel while routing file audio through the call's microphone path—automatically initiating a call if one is not already active—and allows operators to restore live camera and microphone feeds afterward. This media streaming pipeline provides the primary mechanism for delivering pre-rendered video content or generated avatar messages to residents.
2.3.7. The Four Relational Dimensions
Warmth denotes mutual affection, care, respect, reassurance, appreciation, and positive regard between interactants. It is explicitly distinguished from superficial politeness; for example, routine courtesies such as saying "thank you" during mundane interactions score as neutral. Furthermore, warmth may be communicated bluntly—a brief, direct parental directive such as "eat, you'll be late" may encode greater relational care than an elaborate, polite request.
Joy represents shared positive affect among participants, operationalized through mutual laughter, playfulness, teasing, delight, or celebration. The requirement of mutual experience differentiates joy from an individual positive mood; an instance where one participant is amused while another is not does not constitute joy and may instead signal tension or mockery. Joy is not inferred from standard friendly tones or conventional politeness. Its primary behavioral marker is laughter, which is frequently absent from text transcripts alone.
Withdrawal occurs when a participant actively rejects a relational bid initiated by another. It represents an intentional move within an interaction rather than the mere absence of one; for instance, solitary singing does not indicate withdrawal, as no interactant is present to avoid. Withdrawal is thus distinct from lack of engagement and typically co-occurs with it, as an initial relational bid is required prior to rejection. Two conditions must simultaneously hold: an interactional bid was initiated, and the target failed to engage it. Disengagement manifests through explicit refusal (e.g., "leave me alone" or "ask your mother"), topic switching, flat or perfunctory responses that terminate the exchange, or physical departure mid-conversation. Notably, silence or turn gaps cannot be operationalized as withdrawal; because audio capture is voice-activated, inter-turn intervals represent unrecorded time rather than confirmed silence, and missing responses may simply reflect uncaptured audio.
Tension reflects interpersonal friction or conflict between participants, characterized by criticism, accusation, irritation, hostility, insult, threat, confrontation, or escalating disagreement. Tension operates independently of engagement volume; a heated argument scores high in tension without reducing interactional density. Fact-based disagreements conducted calmly do not register as tension, whereas disagreements accompanied by overt irritation do. Tension is inferred from communicative intent rather than literal vocabulary. For example, sarcastic remarks are categorized as complaints despite polite phrasing (e.g., "wow, the dishes will not wash on their own again"), whereas blunt or unpolished language between cooperative participants does not constitute hostility. In practice, the primary classification challenge lies in differentiating true conflict from rough-and-tumble play, as both exhibit high acoustic energy.
While a complaint is categorized as tension regardless of subject matter, its target is recorded separately to distinguish direct interpersonal grievances from external venting (e.g., a child complaining to a parent about a bus driver). Targets are classified into four categories: a co-present participant, an absent household member, an external individual, or a situational circumstance. Only complaints directed at a co-present participant are classified as interpersonal conflict; participant responses to external complaints (e.g., offering empathy, advice, or agreement) are categorized under interaction types rather than tension.
2.3.8. Mapping Audiovisual Incidents to Interpersonal Dynamics
A single event label does not provide evidence about relationships between people. Knowing that a tap was running, a voice was recognised, or an utterance was classified as angry does not indicate how people in the household interacted. If these labels are given directly to a language model, the model may infer relationships that are not supported by the data. To reduce this risk, the dashboard processes the measurements through a hierarchy of abstraction before interpretation. Each layer uses the output of the previous layer, allowing individual layers to be replaced or new data modalities to be added without changing the rest of the system. Five of the six layers are deterministic and reproducible, while only one layer performs semantic interpretation, at the level where relational meaning can be inferred (Figure 4).
The raw event records contain the timestamp, room, device, acoustic energy level, the three highest-ranked AudioSet classes and their probabilities, the diarised transcript, and the emotion estimate. These records are first converted into standardised observations at Level 0. At this stage, timestamps, speaker-attributed speech segments, and emotion codes are extracted from the free-text fields produced by the recording system, and each event is associated with a room. Level 1 converts these observations into semantic events that are independent of the original modality. Separate extractors process sound labels, speaker diarisation, and emotion. For example, an AudioSet class such as “Water tap” is converted into a water_use event, while a recognised voice is converted into an identified_speaker event. Higher levels therefore do not depend on the original sensing modality, allowing other sources, such as vision or door sensors, to be incorporated at this stage. When the available evidence is insufficient for a reliable inference, the result is marked as a candidate and the supporting evidence is retained. Thus, uncertainty is preserved throughout the hierarchy.
Levels 1 to 4 can establish that two people spoke, where the interaction occurred, how much each person spoke, and the associated emotional estimates. However, these levels cannot determine what the interaction meant. This interpretation is performed at Level 1.5. Consecutive speech turns within the same room are grouped into candidate exchanges. An exchange is considered for interpretation when it consists either of a sufficiently long speech segment or of a two-way interaction containing at least two turns from two different speakers and meeting a minimum word threshold. Shorter segments are considered insufficient for reliable interpretation. Each eligible exchange is represented as a time-ordered sequence in which speech and other sounds detected in the same room are placed according to their actual occurrence. This temporal order is important because the same sound may have different meanings depending on when it occurred. For example, a sound occurring before a spoken response may have triggered the response, whereas the same sound occurring afterwards may represent a reaction. Neighboring speech turns are provided as read-only context. Speakers identified by diarisation are explicitly represented, while speakers whose contribution is too small to support reliable attribution are not assigned to the exchange.
The language model then produces a structured record for each exchange. This record contains the participants, one or more interaction types from a predefined vocabulary, any complaints and their targets, a short factual description of the evidence, and four relational dimensions: warmth, joy, withdrawal, and tension. Each dimension is assigned a value between zero and one or is returned as null when it cannot be assessed. The distinction between zero and null is maintained throughout the system. A value of zero indicates that the dimension was assessed as absent, whereas null indicates that there was insufficient evidence for an assessment. The model output is validated before it is accepted. Speakers who are not present in the exchange are removed, labels outside the predefined vocabulary are assigned to a residual category, and interaction types that explicitly indicate a relational dimension impose a minimum value for that dimension to avoid contradictory results. Abstention is treated as a valid outcome. If no interpretation model is available, candidate exchanges are still recorded and marked as not interpreted. Thus, the rest of the pipeline does not depend on the availability of a language model, and missing interpretations remain explicitly identified as missing. For example, a parent's “how was your day?” followed four seconds later by a child's “fine” is identified deterministically as a two-speaker exchange in the kitchen with two speech turns. Only at Level 1.5 can the system interpret this exchange as a possible interactional bid and response.
At Level 2, semantically and spatially related events are grouped into activity episodes using activity-specific time windows. These are approximately two minutes for speech, five minutes for water use, and ten minutes for cooking or media activities. When the combination of detected event types supports a more specific interpretation, the episode is relabeled accordingly. For example, water use combined with running taps in a bathroom may be classified as a personal-care episode. Level 3 reorganizes the information around people rather than individual sounds. It produces conversation, co-presence, and shared-activity episodes, together with speaker-specific turn counts, turn balance, and aggregated emotion distributions. Interpretations from Level 1.5 are associated with the episodes that contain them, but they do not change the deterministic rules used to define those episodes. Level 4 aggregates the results by calendar day and produces measures of household activity, a daily reciprocity rate indicating the proportion of speech episodes in which participants responded to one another, individual activity patterns, pairwise and group dynamics, notable patterns, explicit uncertainty measures, data-quality information, and comparisons with the household's preceding days.
Only this derived information, in reduced form, is provided to a reporting language model. The daily aggregates are sent to the model, while the underlying episode data remain stored locally. The dashboard allows the reporting model to be selected between a locally hosted Qwen3.5:4b model served through Ollama, which is the default and keeps household data on the premises, and OpenAI's cloud-hosted GPT-4o-mini, which is used only for research and comparison. Each request consists of a single non-streaming completion. The model receives a fixed prompt stored as an editable file. The prompt defines the model as a “family reflection mirror, not a surveillance judge” and requires observation, interpretation, alternative explanations, and confidence to be reported separately. It also requires comparisons with the household's own baseline rather than absolute judgements. The prompt explicitly prohibits diagnosis, interpreting loudness as anger, silence as sadness, or laughter as happiness, treating missing sensor data as evidence that an event did not occur, and identifying an individual family member as the source of a problem. A preamble also reminds the model that recording is event-triggered and that emotion values are raw model outputs.
Figure 5a shows a representative output of the reflection interface. The household's weekly pattern is summarized using four indicators: warmth, joy, withdrawal, and tension. Each indicator is displayed using three possible intensity states. Warmth and joy are interpreted in the positive direction, whereas withdrawal and tension represent potentially negative patterns and are therefore interpreted inversely. For example, a green state for withdrawal or tension indicates that the corresponding pattern was not detected. The indicator states are constrained by the available evidence rather than being determined solely by the reporting model. When interpreted exchanges provide sufficient evidence for a dimension, these results take priority over the reporting model's interpretation. If the available evidence is below the required minimum, the corresponding indicator is set to a neutral state, indicating that the system cannot make a reliable assessment. Below the indicators, the system provides an overall interpretation and generates three questions for family discussion, each linked to an observed pattern. A longer narrative report then summarizes the week across nine predefined themes and provides examples based on the recorded episodes. An example of running this approach on real household recordings clustered in time is in Figure 5b. On a weekly basis, we reach a smartwatch-like evaluation of family dynamics and corresponding suggestions as in Figure 6.
2.3.9. Privacy Override Mechanism: A Hardware Kill-Switch for Guests and intimacy
The system supports a global privacy toggle activated via voice command using the wake-word "Kokora" (Greek for rooster). The wakeup keyword is chosen so that the succession of its vowels is efficiently propagated through rooms and because it is not expected to appear accidentally in normal typical conversations. The keyword is not enough to pause operation, and speech is transcribed so that proper verbs are associated with the keyword. If any sentinel across the home captures and transcribes a phrase matching "Kokora, stop" or "Kokora, don't," the server immediately executes an override that mutes incoming sentinel feeds and ignores relevant Mosquitto MQTT broker topics. The halting of the process is clearly announced through the same sentinel it was received. This allows residents to temporarily suspend all ambient monitoring whenever guests are present, residents talk on the phone or privacy is desired. The active override duration is configurable through the server, with a live countdown timer displayed directly on the dashboard.
2.3.10. GraphRAG
The temporal structure of the proposed system extends beyond daily event interpretation. Each day is processed independently through the preceding sensing and abstraction stages, producing an immutable, time-stamped sequence of textual observations. These observations constitute the persistent evidence layer of the system and are incrementally incorporated into a household-level GraphRAG representation. Consequently, the system does not require an LLM to repeatedly process the complete audiovisual history of the home. Instead, longitudinal reasoning is performed by retrieving the temporally and relationally relevant observations from the accumulated household record.
Importantly, the longitudinal reasoning layer does not treat LLM-generated interpretations as primary observations. The underlying time-stamped records remain immutable, while the LLM operates on retrieved evidence and produces an interpretation of the observed pattern. This separation between sensing, persistent evidence, retrieval, and interpretation provides a mechanism for grounding abstract household-level questions in the accumulated observations from which they arise. It also allows the same underlying record to be queried at different temporal scales, from individual events and daily summaries to long-term changes in household interaction.
GraphRAG enables high-level thematic queries—such as assessing household dynamics, tracking daily conflict, or identifying longitudinal disconnect—by retrieving grounded evidence directly from the knowledge graph. For example, a resident can ask abstract questions grounded in daily events, such as "Was there tension during dinners last month?" or "When did communication between family members begin to decline?", and receive synthesized answers supported by specific recorded interactions. We aim at a long lasting companion analyzing years of developmental patterns to offer guidance ("Based on data from 5 to 17 years old, on how our child arranges his toys, what he reads, what he watches on TV, the way he structures his speech, his marks at school, his expression on what he reads or acts, what career paths might suit him now that he turned 18?"). Beyond enabling user self-reflection, this architecture provides a door, i.e. a functional foundation for downstream future applications in psychological support and family counseling, allowing tools to programmatically query the domestic graph to extract the information they need to construct their abstract objects related to the service they want to offer. This is however future work that is not examined here.
3. Results
3.1. Assessment Based on Fixed Dialogues
We created an artificial text corpus comprising 40 dialogues, each containing 5–7 turns and representing a diverse range of family dynamics (see Figure 7 and Appendix A2). The dialogues bear the annotation of the situation they are made for, and this serves as the ground truth. During the experiments, residents physically moved within the room and enacted the dialogues, uttering the scripted content while the system captured their speech and processed it through the complete pipeline. The benefit of this test is that the scripted content allows objective evaluation at several levels. The downside is that, acted speech is generally clearer than spontaneous speech: participants reading from a script tend to articulate more clearly and project their voices, while producing fewer overlaps, interruptions, trailing utterances, or instances of mumbling. This represents a well-known limitation of acted speech corpora [39], and performance observed under these conditions is therefore likely to transfer optimistically to real-world settings. Accordingly, the reported ASR and speaker-recognition performance should be interpreted as an upper bound on performance in everyday domestic environments. Nevertheless, this evaluation provides a more realistic upper-bound estimate than directly feeding the textual dialogues into the downstream pipeline, since the speech must still pass through the room and the sentinels and then through the complete audio-processing chain.
3.1.1. Corpus and Evaluation Protocol
The evaluation used a corpus of 40 scripted Greek dialogues performed by the three residents of the monitored household: two adults (Ilyas, male; Voula, female) and a 16 years old teenager (Rafael, male). Names are fictitious. The dialogues were written to span eight relational profiles, from warmth and play to open conflict, covert hostility, withdrawal and repair after conflict (design groups P1–P8, Table 1), and each of their 219 lines carries the name of its speaker. The script therefore provides an exact reference for three quantities at once: the words, the speaker and the intended relational profile of every exchange.
The dialogues were performed in a single session on 10 September 2026. The residents performed them while walking slowly through the home, so that the speakers of a dialogue were often in different rooms and each sentinel heard all, part or none of a dialogue depending on where they were. Three sentinels, each in a different room (two bedrooms and the entrance), captured the session simultaneously: two ESP32-S3-BOX-3 units (B1 and B2) and one ESP32-P4 unit (P4). Each unit records 16-kHz, 16-bit audio, opens a clip when an adaptive energy detector triggers and uploads the clip to the server; the capture settings of the units were not harmonised for the session. The server processed every clip with the deployed pipeline, unmodified for the experiment: clip-level suppression of duplicates between sentinels, sound-event tagging with the Audio Spectrogram Transformer, speech recognition with Whisper large-v3 (faster-whisper implementation, language fixed to Greek), speaker diarisation with pyannote 3.1 and identification of the residents from ECAPA-TDNN speaker embeddings compared with enrolled profiles. For the clarity of the exposition, we define as ‘take’: one complete performance of one scripted dialogue, from its logged start to end time. It's neither a line nor a turn. Each take holds 5–7 lines; a line is one speaker's scripted utterance, so the 40 takes contain 219 lines. We define as oracle a condition where all copies of each line from all three sentinels are kept, and the scorer uses the script to pick whichever copy matches best. As an example the oracle shows the best any merge rule could reach (word error rate 22.2% against the deployed rule's 23.5%). During the takes the sentinels delivered 207 clips (55 from B1, 84 from B2 and 68 from P4), of which 189 contained transcribed speech.
The start and end of every take were logged by hand by observing the dashboard’s timestamp. Six of the forty logged intervals could not be used as written (an end preceding the start, a zero duration or transposed digits) and were corrected from the timestamps of the clips they enclose. All measures were computed from the transcripts and speaker labels that the running pipeline had stored; no clip was re-transcribed for the evaluation.
3.1.2. Performance Metrics
Recognition was assessed line by line against the script. Within each take, transcribed turns were assigned to scripted lines by greedy one-to-one matching on the normalized sequence similarity of the two strings (Ratcliff–Obershelp), and a line counts as recognized when its best remaining turn reaches a similarity of 0.45. Line recall is the share of scripted lines recognized and is reported with a 95% Wilson interval. The word error rate (WER) and character error rate (CER) of each line are computed against the matched turn after lower-casing and removing Greek diacritics and punctuation, and an unrecognized line counts as a complete deletion. Error rates are pooled over lines; their 95% intervals come from a bootstrap over takes (5000 resamples), which respects the clustering of lines within takes. As a ceiling for the selection among copies delivered by different sentinels, an oracle keeps every copy of every turn and lets the alignment choose, with knowledge of the script, the copy that best matches each line.
Because the residents moved between rooms, the share of lines that one sentinel delivers on its own describes where the speakers were rather than the quality of the unit. Single-sentinel results are therefore used only to describe how the sentinels complemented one another, by classifying each line according to the set of sentinels that, each scored on its own, delivered a recognizable copy of it.
Speaker identification was scored on recognized lines only, so that a line the system never heard is not counted a second time as a misidentification. It is reported as accuracy, per-class precision, recall and F1, macro-averaged F1 and Cohen's κ.
The relational reading was assessed by presenting each take to the interpretation layer of the system twice: once as the original text of its script, with the true speakers, and once as recorded, with the merged turns of all three sentinels, the identified speakers and the automatic annotations the pipeline attaches to each clip. The layer uses either gpt-4o-mini for fast research evaluation or Qwen3 for a local model with a fixed prompt and default sampling parameters and returns interaction types and four relational dimensions on a 0–1 scale (warmth, joy, withdrawal and tension), abstaining on any dimension it cannot judge. Because sampling is not deterministic, every take was read three times in each condition (240 readings in total). Run-to-run stability is reported as the intraclass correlation ICC(2,1) (two-way random effects, absolute agreement, single rating) and as the mean absolute difference between runs. Agreement between the two conditions is reported on per-take means over runs as the mean absolute error (MAE), the bias (recording minus original text), Pearson's r, Spearman's ρ and the share of takes within ±0.25. At the level of the design, the ten orderings between groups that were specified before the session are reported as differences between group means with 95% bootstrap intervals and one-sided Mann–Whitney tests; the eight paired contrasts between single takes as directional checks; and the separation of the eight groups as the leave-one-out accuracy of a nearest-centroid classifier, tested against the chance level of one in eight with a binomial test. Repair after conflict is scored as detected when the layer labels a take with a repair-type interaction (for example, apology or reassurance).
3.1.3. House-Level Capture and Speech Recognition
Due to movement of residents between rooms while performing, no single sentinel could be expected to hear a whole dialogue; what matters is how much of each dialogue the three sentinels captured together. Table 2 reports this for the deployed configuration, in which the clips of the three sentinels are merged into one stream. Together the sentinels recognized 200 of the 219 scripted lines (91.3%, 95% CI 86.8–94.4%) with a WER of 23.5% (95% CI 19.2–28.1%) and a CER of 16.9%. Note that the WER for close distance speech is 13.7% and 10.9% as measured in two different corpora for Greek (https://github.com/openai/whisper). We attribute the gap to reverberation and to spontaneous speech.
The oracle, which chooses among the copies with knowledge of the script, recognised the same 200 lines with a WER of 22.2%. Choosing among the copies without the script, as the deployed merge rule does, therefore cost only 1.3 percentage points of WER, and no line that any sentinel delivered in recognizable form was lost in the choice. The remaining 19 lines were not delivered recognisably by any sentinel, which places the residual error in capture and recognition rather than in the fusion of the sentinels.
3.1.4. Complementarity of the Sentinels
Figure 8 classifies every scripted line by the set of sentinels that, each scored on its own, delivered a recognizable copy of it. As the movement of the residents implies, the sentinels overlapped only partly: 116 lines (53%) were delivered by exactly one sentinel, 67 (31%) by two and only 11 (5%) by all three, while 25 (11%) were delivered by none. The lines that one sentinel alone delivered followed the residents through the home: 24 of the 25 lines delivered only by B1 were Rafael's, 56 of the 71 delivered only by B2 were Ilyas's, and 19 of the 20 delivered only by P4 were Voula's. Every sentinel therefore contributed lines that no other sentinel captured, which is what makes the network necessary, while the lines that two sentinels shared, most often B2 and P4 (54 lines), are what make the merge unavoidable. Of the 25 lines that no sentinel delivered on its own, 6 were recognised once the streams were combined, because the alignment could then draw on turns from more than one sentinel.
Table 3 gives the resulting recognition by speaker. With the three sentinels together, recall reached 93% for Ilyas, 93% for Voula and 83% for Rafael. Recognition was best for the speaker whose lines most often reached more than one sentinel: 52% of Voula's lines were delivered by two or three sentinels, against 29% of Ilyas's and 15% of Rafael's, and Voula's lines had the lowest WER (16.5%, against 28.0% for Ilyas and 28.6% for Rafael). Rafael's lines, the least often available from more than one sentinel, had the lowest recall.
3.1.5. Merging Copies of One Utterance Heard by Several Sentinels
When several sentinels hear the same moment, a line spoken once can arrive two or three times. Although as explained in Section 2.2 we cross-correlate signals and monitor the SNR in a window to delete duplicates, if different parts of an utterance are picked then they are kept as separate turns, and such copies could inflate turn counts and present the same sentence repeatedly to every later stage. The deployed rule treats two turns as one utterance when they come from different sentinels, overlap in time within a tolerance of 3 s, name the same resident (or at least one names nobody), and the shorter is contained in the longer (character-level containment of at least 0.7, and near-identity for turns shorter than eight characters); it keeps the copy with the most words. Table 4 compares this rule with keeping every copy and with the same rule without the speaker condition.
Keeping every copy passed 347 turns downstream for 219 scripted lines, 92 of which were surplus copies of a line already recognized from another sentinel. Containment alone removed 100 copies but also 7 genuine lines, everyone a short reply absorbed into the neighboring line of a different speaker that another sentinel had captured moments earlier, and line recall fell to 88.1%. Requiring the two copies to name the same resident removed 82 copies without losing any line: it retained all 200 lines recognized by the oracle, reduced the surplus cross-sentinel copies from 92 to 19 and cost 1.3 percentage points of WER relative to the oracle. Because the speaker condition was selected on this corpus, the recognition results in Section 3.1 and Section 3.2 should be regarded as development-set figures; the oracle, which does not depend on the rule, bounds them from above.
3.1.6. Speaker Identification
Errors are most frequent among same-gender speakers, in our case particularly between male voices in reverberant speech environments. Speaker identification was accurate on the recognized lines (Figure 9, Table 5). Of the 200 recognized lines, 194 were attributed to the scripted speaker (97.0%; Cohen's κ = 0.95; macro-averaged F1 = 0.97), and no line was left unattributed. Voula's lines were always attributed correctly (recall 100.0%); the errors were 3 lines of Ilyas attributed to Voula, 2 lines of Ilyas attributed to Rafael and 1 line of Rafael attributed to Ilyas. The results were expected as this test follows scripted text and the residents of a house are always few people.
3.1.7. The Relational Reading from the Original Text and from the Recordings
The interpretation layer read every take from the original text of its script and from its recording, three times each, and all 240 readings returned usable scores. Table 6 sets the two conditions side by side on every measure used in the remainder of this section. The readings of the recordings were about as stable across runs as those of the original text and agreed closely with them; every pre-specified ordering between the design groups and every paired contrast held in both conditions; the design groups were separated well above chance in both, somewhat less well from the recordings (40.0% of the takes assigned to their group, against 47.5%); and repair after conflict was recognized less often from the recordings (48% of the readings of the repair takes, against 63%).
3.1.8. Stability of the Reading and Agreement with the Original Text
Run-to-run stability was similar for the original text and for the recordings (Table 7). Across the six dimensions, the intraclass correlation between the three runs was 0.54–0.92 for the original text and 0.58–0.92 for the recordings. It was high for tension, joy and warmth, on which the design produces large differences between takes, and moderate for withdrawal.
Averaged over runs, the reading of each recording closely tracked the reading of its original text (Figure 10, Table 8). Across the six dimensions, the mean absolute error between the two conditions was 0.05–0.14, the bias never exceeded 0.06 in absolute value, and Pearson's correlation was 0.88, for joy (p < 0.001 for every dimension). Depending on the dimension, 85–100% of the takes fell within ±0.25 of the reading of the original text.
Figure 11 sets these differences against the variability of the interpretation layer itself. For the other four dimensions the difference exceeded the run-to-run variation, most clearly for warmth (0.14 against 0.08), tension (0.11 against 0.06) and joy (0.07 against 0.02); this excess is the part of the disagreement attributable to the recording chain.
3.1.9. Relational Structure Across the Design Groups
Figure 12 shows the mean of each dimension in each design group for both conditions. The readings of the recordings reproduce the structure of the readings of the original text. Tension was highest in open conflict (P5: 0.75 from the original text and 0.74 from the recordings); warmth was highest in the warmth-and-support and joy-and-play groups (P1: 0.64 and 0.68; P2: 0.64 and 0.81) and joy in joy and play (P2: 0.50 and 0.64); and withdrawal was raised only in withdrawal and neglect (P7: 0.38 and 0.20), which also makes it the dimension most attenuated by the recording. The single take of the cold, logistics-only profile (P4) is the clearest discrepancy: it was read with a tension of 0.00 from the original text but 0.50 from the recording.
The ten pre-specified orderings are quantified in Figure 13 and Table 9. All 10 held in both conditions, and in both the 95% bootstrap interval of every difference excluded zero (10 of 10 for the original text and 10 of 10 for the recordings). The orderings that separate conflict from support were measured on the recordings almost exactly as on the original text: open conflict exceeded warmth and support on tension by 0.67 (95% CI 0.58 to 0.75; original text 0.69), and warmth and support exceeded open conflict on warmth by 0.55 (original text 0.63). The recording attenuated the orderings that rest on subtler cues. The withdrawal group exceeded the support group on withdrawal by 0.20 against 0.36 from the original text, repaired conflict exceeded open conflict on warmth by 0.25 against 0.41, and covert hostility exceeded support on tension by 0.25 against 0.35. One-sided Mann–Whitney tests on the recordings reached p < 0.05 for 7 of the 9 orderings that could be tested. The exceptions were covert hostility against support on tension (p = 0.051) and withdrawal against joy and play (p = 0.084), the latter with three takes in the joy group; the ordering involving the single cold take could not be tested.
The eight paired contrasts between single takes all held in both conditions (Table 10). They include the two contrasts between takes of similar surface: the cold and the calm exchange (#14 against #28), which were separated on warmth, and sarcasm against genuine warmth (#3 against #1), in which the sarcastic take was read as the less warm of the two.
A nearest-centroid classifier, which assigns each take to the group whose mean profile is closest, placed 19 of the 40 takes in their design group from the original text (47.5%, 95% CI 32.9–62.5%) and 16 of 40 from the recordings (40.0%, 95% CI 26.3–55.4%), against a chance level of 12.5% (binomial test, p < 0.001 in both conditions). Figure 14 shows where the takes were assigned in each condition; the single cold take (P4) cannot be assigned to its own group under leave-one-out, because removing it leaves the group without a centroid. Open conflict was assigned correctly in all 7 of its takes in both conditions, whereas the positive profiles (warmth, play and calm) were often confused with one another and the repair takes were spread over the neighboring profiles, as might be expected of exchanges that contain both a conflict and its resolution.
Repair after conflict was the least reliable capacity. Over the three runs, the layer labelled a repair move in 63% of the readings of the nine repair takes from the original text and in 48% of the readings of their recordings (by majority over runs, 5/9 and 4/9 takes), while labelling repair in only 5% and 2% of the readings of the other takes. Repair was thus rarely asserted where there was none, but it was missed in about half of the recorded takes that contained it.
3.1.10. Propagation of Recognition Errors into the Reading
Figure 15 relates, take by take, the WER of the recording to the mean absolute difference between the reading of the recording and the reading of its original text over the six dimensions. The two were weakly associated (Spearman's ρ = 0.33, p = 0.038, n = 40): takes that were transcribed less accurately tended to be read less like their original text, but recognition error explained only a small part of the difference. The largest difference, for take #24 (Playful competition, mean difference 0.36), occurred at a WER of 14.3%, against a median of 22.7% across takes.
3.1.11. Segmentation in the Deployed Report
The evaluation of the relational reading in previous Sections presents each take to the interpretation layer as one exchange, delimited by the logged take boundaries. The deployed report forms exchanges itself, by joining turns from the same room that follow one another within 120 s. Because each sentinel is assigned to a room, a conversation that moves through the home, or is heard by several sentinels, is split along room lines (Figure 16). With every copy kept, the 40 takes produced 247 exchanges (median 5.5 per take, maximum 13), and only 2 takes formed a single exchange. Merging copies reduced this to 179 exchanges (median 4.5, maximum 9), with 3 takes forming a single exchange, and reduced the exchanges passed to the interpretation layer from 108 to 79. Reconstructing a conversation across rooms is not attempted by the deployed report, so the readings reported in previous Sections are an upper bound on what it obtains for conversations that move between rooms.
3.1.12. Summary of Assessment Based on Fixed Dialogues
On a corpus of 40 scripted family dialogues performed by residents walking between rooms and recorded by three low-cost sentinels, each in a different room, capture depended on the network rather than on any one unit. The sentinels overlapped only partly, with 53% of the lines delivered by exactly one sentinel, and together they recognised 91.3% of the 219 scripted lines (95% CI 86.8–94.4%) at a WER of 23.5%, within 1.3 percentage points of an oracle that selects among the copies with knowledge of the script. Merging the copies of one utterance required the speaker condition, without which short replies of one speaker were absorbed into the line of another. Speaker identification on the recognised lines was reliable (97.0%, κ = 0.95).
The relational reading proved robust to the recording chain. Read from the recordings rather than from the original text, it was about as stable across runs, it agreed with the reading of the original text within a mean absolute error of 0.05–0.14 and with correlations of 0.59–0.88, and all 10 pre-specified orderings and all 8 paired contrasts held in both conditions. The design groups were separated well above chance from both inputs (47.5% and 40.0% of the takes, against a chance level of 12.5%). Withdrawal was the least reliable dimensions, and repair after conflict was recognised in only about half of the recorded takes that contained it.
These results carry the limitations of their design. The corpus comprises one household, one session and read, scripted speech; the design groups contain between one and nine takes; the speaker condition of the merge rule was selected on the same corpus; and the relational reading was evaluated on takes delimited by their logged boundaries, whereas the deployed report divides a conversation that moves between rooms into separate exchanges per room. The recognition results are therefore best read as the performance of the capture and recognition chain under favourable conditions, and the relational results as evidence that the interpretation layer tolerates realistic recognition errors, not yet as the performance of the deployed report in everyday use.
3.2. Component Evaluation on Unscripted Household Audio
The scripted-dialogue study reported in Section 3.1 measures the system against a reference that was written before the recording and therefore knows, for every line, the words, the speaker and the intended relational profile. This second evaluation asks a different question: how each perception component behaves on ordinary household audio, where nobody is performing, most clips carry no speech at all, and the reference has to be established after the fact by listening.
The material was drawn from five consecutive days of continuous operation in the same household, 15 to 19 September 2026. Six sentinels were installed, one per room: two ESP32-S3-BOX-3 units in the kitchen and the second bedroom, three ESP32-S3 units in the first bedroom, the laboratory and the bathroom, and one ESP32-P4 unit at the entrance. Each unit opens a clip when an adaptive energy detector triggers and uploads it to the server, which processes it with the deployed pipeline: sound-event tagging with the Audio Spectrogram Transformer (AST) over the 527 AudioSet classes, a gate that passes a clip to speech processing when any of the three returned labels is a speech label, voice activity detection, speech recognition with Whisper large-v3 (faster-whisper, language fixed to Greek), speaker diarisation with pyannote 3.1 and closed-set identification of the three residents from ECAPA-TDNN embeddings, and a four-class affect label derived from a dimensional wav2vec2 model. Over the five days the sentinels delivered 17,429 clips, of which the gate judged 7,053 to contain speech and 10,376 not to.
From the clips the gate had passed, 250 were drawn at random and stored, with their audio, into a standalone evaluation folder on 21 September. The live database was read only; nothing was written back to it, and no clip was re-processed for the evaluation, so every prediction scored here is the one the running system stored at the time. Freezing matters because the deployment deletes rows older than its retention window and archives their audio: an evaluation set that changes underneath the annotator is not an evaluation set (see Table 11).
The sampler was written to draw 15% of the sample from clips the gate had rejected, which is what would measure the gate's false negatives. Annotation proceeds in two stages per clip. In the first the listener hears the audio alone and answers whether anybody spoke, who spoke, and what affect the voice conveyed, with the model's output hidden; showing the prediction first would measure agreement rather than accuracy. The first stage is committed before the second is rendered. In the second the system's output is revealed: the three AudioSet labels are judged correct, partly correct or wrong, which is a judgement of the output and therefore has nothing to hide, and the transcript is corrected from a pre-filled box. Either stage offers Skip, for a clip that cannot honestly be judged. Of the 250 clips, 149 were annotated completely and 101 (40.4%) were skipped. Skipped clips leave the queue and are excluded from every denominator: they are not zero-error clips, not wrong answers, and not part of any rate reported below.
3.2.1. Performance Metrics
Sound labelling is scored by whether an acceptable label appears within the top K of the three the model returns, under two criteria: strict, counting only labels the listener judged fully correct, and lenient, also counting partly correct labels.
Speech recognition is scored on the 95 clips for which the listener wrote a reference transcript. The word error rate (WER) and character error rate (CER) are computed after lower-casing and removing Greek diacritics and punctuation; the raw rate before normalization is reported beside it. Substitutions, deletions and insertions are pooled over clips, and the 95% interval for the WER comes from a bootstrap over clips. Because the aggregate rate can conceal its own shape, the median and interquartile range of the per-clip WER are given as well.
Speaker identification is scored on the 69 clips in which exactly one resident spoke, so that a clip with several voices is not counted as a misidentification of one of them. It is reported as accuracy over those clips, per-class precision, recall and F1, macro-averaged F1, and balanced accuracy. Because the system may decline to name anyone, a second figure is given over the clips where a name was returned, with Cohen's κ, which separates "wrong name" from "no name". For the 39 clips with several speakers, where a single name cannot be right or wrong in the same sense, the weaker property is reported: whether the name the system gave belongs to somebody the listener heard in the clip.
The affect label is scored over the 113 clips the listener could rate and the model labelled, as accuracy, per-class precision, recall and F1, macro-averaged F1, balanced accuracy and κ. Accuracy is reported against the majority-class baseline of the same sample, which is the accuracy of answering "neutral" every time.
Proportions carry 95% Wilson intervals. Classes with fewer than five annotated clips are reported but marked as not quotable: their rates are arithmetic on a handful of clips, and a zero among them means "never sampled enough", not "never works".
One configuration note belongs with the protocol. The predictions scored here are those the pipeline produced during the window, when closed-set identification named its best candidate whatever the similarity (speaker_id.min_similarity = 0). Seven of the 149 annotated clips, captured after a restart on 19 September at 20:16, ran with a 0.45 abstention floor and with a revised speech-recognition path in which a clip the diarizer found no speaker in is no longer retried.
3.2.2. The Speech Gate
The speech gate results are depicted in Figure 17. Of the 149 annotated clips, all of which the gate had passed, 117 contained speech and 32 did not, giving a precision of 78.5% (95% CI 71.3–84.4%). Rather more than one clip in five reaching speech processing therefore holds no speech.
What happens to those 32 clips downstream matters more than the rate itself. Only 3 of them produced any transcript text and only 2 received a speaker name, so the guards behind the gate — voice activity detection, the diarisation check and the boilerplate filters — absorbed the great majority of the gate's false positives. The design asymmetry is the defensible one: a clip admitted in error can still be discarded later, whereas a conversation never transcribed is unrecoverable.
The complementary error cannot be measured here. The deployment retains no audio for the 10,376 clips it rejected in this window, so no listener can establish whether any of them contained speech. Within the annotated set no speech was dropped, but that is true by construction and is not evidence about the gate.
3.2.3. Sound Labelling
The AST labels were judged on 147 clips (Figure 18). The first label was fully correct on 85.7% of clips (95% CI 79.1–90.5%), and an acceptable label appeared within the top two on 95.9% and within the top three on 98.0% (94.2–99.3%). Counting partly correct labels as acceptable raises these to 89.8%, 98.0% and 99.3%.
This is the most accurate component measured, and it is also the one the rest of the description rests on: the activity events of Level 1 and the whole of Level 2 are keyed on these labels rather than on words.
3.2.4. Speech Recognition
Of the 117 clips containing speech, 22 held speech the listener could not transcribe either; these are excluded, since a reference cannot be written for them. On the remaining 95 clips, with 1,613 reference words, the word error rate was 24.9% (95% CI 19.2–31.8%) after normalization and 25.2% before it, and the character error rate was 19.5% (Figure 19). That the CER sits well below the WER indicates that most errors are morphological rather than invented content: the gist of an utterance often survives them.
The aggregate conceals the shape of the distribution. Per-clip WER was bimodal, with a median of 22.2% and an interquartile range of 5.7% to 87.5%: clips either transcribe well or fail almost completely, and the pooled rate describes no actual clip. A spread of that width points at recording conditions — distance from the microphone, reverberation, competing noise — rather than at the model.
The error composition was 221 substitutions, 118 deletions and 62 insertions. Deletions outnumber insertions by roughly two to one, so the recognizer omits more than it invents, but the 62 inserted words remain 3.8% of the reference: words reach the record that nobody spoke.
The most consequential failure is not measured by the error rate at all. Nineteen of the 69 clips in which a resident demonstrably spoke (27.5%) were never transcribed. No person reaches Level 3 from such a clip, and because a conversation candidate requires two named speakers within one recording, a two-person exchange with one end missing does not degrade gracefully — it disappears.
3.2.5. Speaker Identification
Over the 69 clips with a single resident speaking, the system named the correct resident on 45 (65.2%, 95% CI 53.4–75.4%), with a macro-averaged F1 of 0.68 and a balanced accuracy of 58.7% (Figure 20, Table 12). Read alone, that figure understates what the component does and misstates how it fails.
The system returned a name on 49 of the 69 clips, and on those it was right 45 times (91.8%, κ = 0.855). Cross-resident confusion is rare: four clips in the whole set. The dominant failure is silence rather than error — 20 clips received no name, and 19 of them carried no transcript at all, so they never reached speaker identification. That is a recognition miss counted a second time here, and it is the same 19 clips as in Section 3.3.
Precision is high and recall low for both well-sampled residents (Ilyas 95.5% and 75.0%, Voula 95.7% and 61.1%). Rafael, the child, was the single speaker in only five annotated clips; his rates are reported in Table 12 but are not quotable.
Two properties of the closed set are visible in the sample. Seven clips carried a non-resident voice — a visitor, or a television — and the system named a resident on four of them and declined on three: with three enrolled profiles and no reject option, a voice from outside the household is attributed inside it. On the 39 clips with several speakers, the name returned belonged to somebody the listener had heard in 27 (69.2%); taken together with the single-speaker clips, the name was one of the people present on 72 of 108 clips (66.7%, 95% CI 57.3–74.8%).
3.2.6. The Affect Label
Emotion could not be reliably inferred from the in-home audio recordings. These recordings are affected by reverberation and noise from household appliances, while verbal interactions in the home are typically brief and spontaneous. The model reliably classified neutral emotional states; however, its classification of other states, such as joy or sadness, was reliable mainly in extreme cases where laughter or crying was clearly audible. A broader audiovisual context may therefore be necessary to identify more subtle variations in emotional state from speech. A human coder is able to extract emotion from various cues e.g. humorous context that is derived from the linguistic message, therefore a discrepancy arises between the system and the coder. The coder, a member of the lab was independent of the system developers and household members. The affect label was scored on 113 clips (Figure 21, Table 13). Its accuracy was 70.8% (95% CI 61.8–78.4%) against a majority-class baseline of 91.2%: answering "neutral" for every clip, with no model at all, would have been more accurate than the model. Macro-averaged F1 was 22.9%, balanced accuracy 22.3%, and κ was −0.02, which is chance agreement.
The per-class figures locate the whole of the performance in the majority class. Neutral was recovered with a recall of 76.7% over 103 clips; happy was recovered on 1 of 8 clips, with 15 clips wrongly called happy; angry and sad were represented by one clip each and are not quotable. Twenty clips in which the listener heard nobody speak nevertheless carried an affect label.
The emotion channel carries little information, while still producing a well-formed per-person distribution that has the appearance of evidence at Level 4. It is included in the pipeline but the system is instructed that emotion from audio should not be decisive on a claim about a person.
3.2.7. The Character of the Errors
For a record that a reader cannot audit clip by clip, whether the system omits or invents matters more than how often it is wrong. An omission is recoverable — better microphones, more enrolment, a denser network of sentinels all move it toward truth — while an invention is not, because nothing in the record distinguishes it from evidence.
Classified this way, 39 of the annotated clips carry an omission-shaped error (36 left unnamed, 16 without a usable transcript) and 28 carry a fabrication-shaped one: 20 affect labels attached to clips with no speech in them, 4 non-residents given a resident's name, 4 clips attributed to the wrong resident, and 3 transcripts produced where nothing was said. Within speech recognition the ratio favors omission, 118 deleted words against 62 inserted. A further 22 clips are neither: the listener agreed that somebody spoke and also could not make out the words, so the gate and the empty transcript were both correct.
Fabrication-shaped errors are thus a material share of the total, and they are concentrated in two identifiable places — the affect label on non-speech audio, and the closed set naming voices from outside the household. Both are addressable without touching the recognition chain.
3.2.8. Summary
On 149 clips annotated from five days of ordinary operation, the components rank in an order that is stable across the measures used. Sound labelling is the most accurate (85.7% at rank 1, 98.0% within three) and is what the activity description rests on. The speech gate passes clips generously, with a precision of 78.5%, and the filters behind it absorb most of what it lets through. Speech recognition reaches a word error rate of 24.9% on the clips that can be transcribed, with a strongly bimodal per-clip distribution, and fails completely on 27.5% of the clips in which a resident demonstrably spoke. Closed-set speaker identification is accurate when it answers — 91.8% of the names it returns are correct, κ = 0.855 — and its failure mode is declining to answer rather than naming the wrong person, though it has no way to decline for a voice from outside the household. The affect label performs at chance beyond the majority prior and should be excluded from any claim.
3.3. Evaluating the System Against Manual Observation of Family Dynamics
3.3.1. Why this Evaluation is Different in Kind
Section 3.2 evaluated the system’s perceptual channels against objective ground truth. A recording either contains a barking dog or it does not; a sentence was either spoken or it was not; a voice attributed to a resident was either correct or incorrect. Each of these queries possesses an objective answer embedded in the acoustic signal, recoverable by an annotator listening to the clip.
The relational layer, however, has no such binary truth. Asking whether an exchange was 'tense' does not address a physical property of a waveform; rather, it requires a qualitative judgment about a human interaction that no raw recording can independently settle. Ground truth for relational dynamics cannot be observed directly—it must be constructed by trained coders applying explicit written definitions. Consequently, the scientific validity of this layer depends entirely on how rigorously that construction is documented and the degree to which independent listeners agree.
This approach builds on long-established paradigms in observational family research. Observational coding frameworks—such as the Specific Affect Coding System (SPAFF) and the macro-level rating scales of the Iowa Family Interaction Rating Scales (IFIRS)—establish relational constructs through detailed behavioral anchors, rigorous coder training, and reported inter-rater reliability metrics. The present study adapts these methodologies to ambient household audio, drawing on the precedent of the Electronically Activated Recorder (EAR), a system in which naturalistic everyday sound is sampled continuously and coded by human raters rather than processed automatically.
3.3.2. The Annotation Procedure
A customized coding manual was developed specifically for this household and system architecture. It defines four relational dimensions—warmth, joy, withdrawal, and tension—each rated on a six-point scale: 0 (absent), 1 (trace), 2 (present), 3 (strong), 4 (extreme), alongside a distinct sixth option, 'cannot tell'. This final option is strictly differentiated from a zero score, as categorizing an inaudible exchange as zero warmth would inaccurately record an unobserved cold interaction in a family's history. The human rating scale incorporates five graded levels to align with the interpreter's five-tier output space (0.0, 0.25, 0.5, 0.75, 1.0), to which 95% of its responses adhere. Aligning scale granularities prevents arbitrary rounding discrepancies from being misclassified as inter-rater disagreements. Three architectural properties of the coding manual directly inform the interpretation of these results: First, the definitions are explicitly mirrored between the manual and the interpreter's prompt. Guidelines regarding sarcasm and the four complaint targets are similarly shared. This structural alignment ensures the study measures model performance against a unified standard rather than contrasting two different construct definitions; however, it also means the validity of the definitions themselves remains unassessed. Second, human coders evaluate audio streams alone. Third, the human coder serves as the intentional benchmark. A human listener easily distinguishes television audio from human speech, detects vocal affect or flat inflection, and identifies guest voices. Conversely, the interpreter receives raw text transcripts paired with coarse sound classifications. Where human and model ratings diverge, this asymmetry represents a substantive finding rather than measurement noise. Beyond relational metrics, each exchange is coded for its situational context (e.g., co-present residents, phone calls, visitors, screen media, or solitary individuals), the accuracy of clip segmentation, audible resident identities, up to three interaction categories from the system's fixed vocabulary, any complaints and their targets, and a mandatory free-text evidence line highlighting the precise moment underpinning the scores. Requiring explicit textual evidence ensures every rating remains auditable and scientifically valid.
3.3.3. Sample and Procedure
To evaluate the relational scoring pipeline on multi-participant interactions, single-speaker exchanges were excluded prior to sampling. From 588 multi-resident candidate exchanges generated over a five-day evaluation window (15–19 September), we selected a stratified random sample of 100 exchanges (99 coded, containing 111 minutes of audio across 670 clips spanning six rooms). To ensure sufficient variance for discrimination analysis, word-count strata were deliberately over-sampled in favor of longer interactions. To preserve independence, sampling was restricted to a maximum of one exchange per conversational episode (defined as contiguous exchanges within two minutes in the same room). System outputs were generated strictly post-coding to ensure double-blind evaluation. Because longer exchanges were intentionally over-represented, this sample evaluates model-coder agreement rather than household behavioral prevalence.
3.3.4. What the Exchanges Turned out to be
Qualitative analysis confirmed that the vast majority of evaluated exchanges represented genuine multi-resident interactions within a shared room, with human coding verifying correct clip grouping in 91.9% of cases (91 of 99). However, because the system relies on a closed speaker architecture, external audio sources—such as television broadcasts and telephone calls—were forcibly mapped onto household resident identities rather than filtered out, causing four of five non-resident cases to trigger interaction indicators erroneously. In terms of overall intelligibility, human coders and the system concurred on exchange readability in most instances (71 of 99). The primary area of divergence involved degraded audio: while human raters could follow exchanges that the model only partially transcribed in twelve instances, a more critical failure mode emerged in three cases where the interpreter confidently processed and scored audio that human raters found entirely unintelligible. Though infrequent, this latter error represents a significant risk for downstream analysis, as hallucinated interpretations of unreadable audio are functionally indistinguishable from valid empirical evidence.
3.3.5. Agreement on the Relational Dimensions
To evaluate model-coder consistency on ordinal scales, we report Cohen’s quadratic-weighted kappa (κ) alongside mean signed differences. This dual reporting distinguishes overall measurement divergence from systematic model bias (e.g., directional over- or under-estimation). As shown in Figure 23, the model achieved moderate, statistically significant agreement on tension, weak agreement on joy, and non-significant agreement on warmth. The model systematically over-estimated tension relative to the human coder while under-estimating warmth and joy. This disparity stems from a core modality constraint: vocal tone, prosody, and laughter—which carry warmth and shared joy—are lost in text transcription, whereas lexical markers of irritation and conflict survive into prose (see Table 14).
Two dimensions were unmeasurable due to methodological and architectural constraints. Withdrawal was excluded from evaluation entirely due to a construct mismatch: human coders scored short or perfunctory replies as disengagement, whereas the model prompt strictly prohibited scoring brief turns to prevent misinterpreting voice-activation truncation as silence.
3.3.6. What Explains the Disagreement
We evaluated two potential causes for low model-coder agreement: speaker misidentification and exchange length. Speaker attribution errors were not the primary driver of disagreement; filtering for exchanges with completely accurate resident identification yielded virtually identical agreement scores compared to those with speaker errors. Instead, exchange brevity was the primary constraint. Agreement rose steadily alongside interaction length, increasing from baseline levels across all exchanges to strong agreement for exchanges containing at least 57 words. This finding highlights a critical deployment flaw: under the initial segmentation rules, the median interaction contained only 22 words, forcing the model to infer complex relational dynamics from brief conversational fragments (see Figure 24).
3.3.7. Pipeline Corrections and Their Effect
Empirical evaluation revealed three critical pipeline defects, which were sequentially corrected and evaluated against the fixed human-coder baseline for the same 99 exchanges (see Figure 25). First, cross-room microphone interference frequently severed continuous conversations; adjusting cluster logic to group same-room turns restored average exchange lengths from 22 to 52 words and raised tension agreement from 0.23 to 0.39. Second, speaker identification suffered from single-turn errors that incorrectly placed absent residents into entire exchanges; enforcing a minimum 15% turn-share threshold for participant attribution improved exact presence agreement from 33% to 58%. Third, passing unverified speaker names to the language model confused its internal context; masking sub-threshold speakers as unidentified brought the model's internal participant lists into alignment with human coders and yielded the strongest overall improvement in relational scoring, raising tension agreement to 0.45. Cumulative evaluation demonstrated that restoring exchange continuity, refining speaker attribution thresholds, and masking unverified speaker names roughly doubled inter-rater agreement on tension—increasing Cohen's κ from 0.23 to 0.45—without altering the underlying language model, modifying prompt definitions, or adjusting human coding criteria. Warmth agreement similarly improved from κ = 0.11 to 0.21, (see Figure 26).
3.3.8. Section Synthesis
This study provides the first empirical evaluation of an ambient relational interpretation layer against constructed behavioral ground truth. Initial deployment revealed weak agreement between automated models and human observations across all relational dimensions. Diagnostic analysis traced this failure not to LLM reasoning capacity, but to pipeline-level inputs: severe conversation fragmentation caused by cross-room segmentation defects, alongside contaminated participant context caused by overly broad diarization rules. Targeted pipeline repairs—re-linking fragmented exchange boundaries and enforcing turn-share thresholds for speaker attribution—roughly doubled tension agreement to a moderate level (κ = 0.45) while exposing misconfigured UI thresholds.
The empirical standing of the system is refined: tension is reliably measurable in substantial conversational exchanges; joy and warmth are systematically under-detected due to transcript prosody loss (see Figure 27).
3.4. Longitudinal Reasoning: Evaluating GraphRAG
3.4.1. Evaluation Objectives and System Constraints
Section 3.3 examined whether individual exchanges were interpreted correctly. The present section extends this analysis to questions about entire days: whether a quarrel occurred on a particular day, who was involved, and when the incident began and ended. To answer these questions, the system first processes each day's records and compiles a list of incidents. These may include quarrels, complaints, expressions of worry, warm moments, rebuffs, or reconciliations. Each incident is recorded together with the people involved and its start and end times. The system then uses this list to answer the query.
Errors can arise at two levels. First, the incident list itself may be inaccurate, either by including incidents that did not occur (low precision) or by omitting incidents that did occur (low recall). Second, errors may occur in the question-answering pipeline: the planner may select the wrong operation, retrieval may return incorrect records, or the generated answer may contain claims that are not supported by the available evidence. We evaluated both levels and attributed each error to the layer in which it originated.
Table 15 summarises the five query types evaluated in this section and the corresponding metric used for each. We also included recall, although it is not itself one of the five query types, because it is relevant to all of them. A question cannot be answered reliably if the underlying incident list omits relevant events.
3.4.2. Experimental Setup
The dataset comprises 27 consecutive days of recordings from one household, spanning 29 September to 26 October 2026. It contains 51,273 recorded events and 18,480 utterances attributed to the three residents. The system processed 1,227 five-minute windows and identified 222 incidents. No incidents were identified on one day, 17 October.
Ground truth was established using three procedures involving the residents.
Confirmation or rejection. Each morning, the report page displayed the previous day's incident list. For each incident, it showed the time span, incident type, people involved, a one-line description, and the transcript lines on which the identification was based. A resident then marked each incident as confirmed (it occurred) or rejected (it did not occur). All 222 incidents were assessed. This procedure measures precision. However, because the resident saw the system's description before making a judgement, the procedure may introduce a bias towards confirmation.
Blind labelling. From 13 October onwards, the page presented a second task before displaying the incident list. It showed approximately 15 five-minute windows from the day, presented in random order and without labels. These included all windows in which the system had identified an incident and eight windows randomly selected from those in which it had identified none. For each window, the resident read the transcript, could listen to the corresponding recording, and labelled every incident type present or selected "nothing". The resident could not determine which windows had been flagged by the system. The incident list was revealed only after all windows had been labelled.
This procedure was conducted on 13 days between 13 and 26 October, excluding 16 October, covering 211 windows: 111 flagged by the system and 100 sampled from the 408 windows in which it had identified no incidents. Since the 100 unflagged windows were randomly sampled, each sampled window represents the unflagged windows from its corresponding day. This procedure measures recall and provides a second estimate of precision that is not subject to the confirmation bias described above.
Dated questions. During the first ten days of the dataset (29 September to 8 October), the complete system—including planning, retrieval, and answer generation—was evaluated using 123 questions generated from fixed templates (Section 3.4.5). Each answer was scored automatically against the residents' confirmations.
3.4.3. Precision: What the System Listed Had Mostly Happened
Of the 222 listed incidents, the residents confirmed 196: a precision of 88% (95% interval 83% to 92%). Figure 28 and Table 16 show precision by kind.
Results. As Figure 28 shows, errors were concentrated in quarrels. Of the 26 rejected incidents, 19 were classified as quarrels, 15 of which involved the two adults. Among incidents classified as quarrels lasting ten minutes or longer, 25 of 36 were confirmed (69%, 95% CI: 53–82%), compared with 36 of 44 shorter quarrels (82%, 95% CI: 68–90%). Of the 80 incidents whose end times were determined by the rule extending a quarrel into subsequent windows, 61 were confirmed (76%). By comparison, 104 of 108 incidents whose start and end times were determined within a fixed margin were confirmed (96%).
Overall precision remained relatively stable over time, at 91% (73 of 80 incidents) during the first ten days and 87% (123 of 142) over the subsequent seventeen days. Confirmation rates also differed according to the number of people involved: 91 of 96 incidents involving one person were confirmed (95%), compared with 102 of 123 incidents involving two people (83%). Across residents, the corresponding rates were 120 of 141 for Ilyas (85%), 144 of 165 for Voula (87%), and 37 of 42 for Rafael (88%).
Interpretation. The concentration of rejected incidents in quarrels suggests that the system sometimes classified ordinary disagreements about household matters as quarrels, particularly when the exchanges involved the two adults. The lower confirmation rate for longer quarrels may also reflect the difficulty of determining when a disagreement becomes a quarrel and when it ends. The difference between incidents whose end times were determined by temporal extension and those whose boundaries were set within a fixed margin further suggests that the extension rule warrants review. However, the difference between long and short quarrels is not statistically conclusive. The relatively stable precision across the two periods and the similar confirmation rates across residents provide no clear indication of substantial temporal drift or resident-specific differences. The main opportunity for improvement therefore appears to lie in distinguishing quarrels from ordinary disagreements and refining the rules used to determine their duration.
3.4.4. Evidence Grounding and Retrieval Accuracy
The blind labels show that the list is accurate but incomplete. Figure 29 shows recall and precision for any incident and for three groups of kinds.
When the system flagged a window, the resident found an incident in it in 103 of 111 cases. Precision at the level of "something happened here" is therefore 93% (88% to 98%), close to the 91% (80 of 88) obtained by confirm-or-reject on the same days. The confirmations were not inflated much by the resident seeing the system's description first.
Recall is much lower. The resident tagged an incident in 64 of the 100 windows that the system had left empty. Scaled to all 408 empty windows, this means the system found incidents in 103 windows and missed incidents in an estimated 252. Recall is 29% (21% to 38%): the system finds a little under one third of the five-minute windows in which a resident sees an incident.
The misses are not spread evenly (Table 17). In the empty windows the resident most often tagged warm moments (28 of 100 windows) and complaints (21). Warm moments have the lowest recall, 7%. The reader was told that a warm moment is "affection, praise, support, shared laughter" and that ordinary conversation is not an incident; the resident tagged as warm many friendly conversations that contain none of these. Part of this low recall is therefore a difference in definition, even though the definitions were shown on the labelling page. Conflict, the group the system was built for, has a recall of 29%.
Precision by kind is lower than precision for "any incident". Where the system listed a conflict, the resident agreed it was a conflict in 54% of windows (42% to 67%); for worry the figure is 13%. Agreement on the kind, between the resident's tags and the system's, was low: Cohen's kappa was 0.22 for conflict, 0.10 for worry and 0.25 for warm moments, over the 111 flagged windows. In many of these windows the resident saw an incident, but of another kind: of 68 windows the system labelled as a quarrel, the resident tagged 17 as a quarrel, 17 as a complaint and 29 as a warm moment (a window can have more than one tag). Many of these windows are the edges of a long quarrel, which, as in 3.4.3, the system extends too far.
In short: when the system says something happened, it is usually right that something happened, but often wrong about what it was, and it misses about two thirds of what the resident sees.
3.4.5. Answering Dated Questions
Results. During the first ten days, 123 questions were submitted to the full system (Table 18). The questions were generated from fixed templates covering each day: “Was there a [kind] on [date]? When did it start and finish, and between whom?” for each of the six incident types; “Was [person] involved in a quarrel on [date]?” for each resident; and “Did [A] and [B] quarrel with each other on [date]?” for each pair of residents. The first question template was also applied to three days that had not been read by the system. A question was labelled positive if the residents had confirmed a matching incident for that day and negative otherwise. Answers were evaluated using their first sentence.
Interpretation. The negative questions corresponded to days on which no matching incident had been confirmed by the residents, rather than to artificially constructed negative examples. This allowed the evaluation to assess whether the system could distinguish days on which an incident occurred from those on which it did not, using resident-confirmed incidents as the reference.
Event retrieval. Of the 60 answers, 57 were correct (95%). All three errors concerned days on which the only listed quarrel had been rejected by the residents. The planner selected the correct operation in every case, and the generated answers consistently reflected the retrieved records. The errors therefore originated in the incident list rather than in the question-answering layers.
Person attribution. Of the 30 answers, 24 were correct (80%). The six errors arose from the same three rejected quarrels, each counted once for each of the two adults involved. No answer attributed an incident to a resident who was not among the recorded participants. Since the speaker assigned to each utterance depends on speaker identification, the accuracy of this measure is also constrained by the speaker-identification performance reported in Section 3.3.
Relational retrieval. The initial system could not answer questions about specific pairs of residents correctly. It retrieved quarrels involving the first person, regardless of the other participant, and consequently answered yes to all 22 questions about days on which the specified pair had not quarrelled. In eight cases, the answers were internally contradictory, stating, for example, “Yes, Ilyas and Rafael did not quarrel.” After a filter requiring the second person to match was introduced, 27 of 30 pair questions were answered correctly (90%). The three remaining errors again concerned rejected quarrels. Both runs are reported because the initial results expose a design flaw that would not have been apparent from questions about individual residents alone.
Negative queries. On the 28 days when no incident of the queried type had been listed, all 28 answers correctly stated that no such incident was recorded (100%, 95% CI: 88–100%). However, when a listed incident had been rejected by the residents, the system still answered yes in all three cases. This limitation reflects the system's reliance on its incident list: it cannot independently determine whether an entry in that list is incorrect. For days that had not been read, the retrieval step consistently indicated that no conclusion could be drawn. The generated answer conveyed this limitation in two of the three cases. In the third, it began with “No” before explaining that the day had not been read.
An earlier pilot conducted from 14 to 19 September revealed a further limitation: when no matching operation was available, the system generated invented events in five of six runs. With the incident-list approach, a query for an absent incident type returns an empty result. No invented events appeared in the 28 negative-query answers evaluated here.
3.4.6. Time
Every clock time reported in an answer is derived from the recorded data. The system retains a start or end time only when it is supported by a timestamped line, and answers use the times associated with the retrieved incidents. Across the 123 answers, the system cited 199 clock times, all of which corresponded to the start or end times of retrieved incidents.
The accuracy of these times was examined for two incidents on 2 October that a resident reported without first being shown the system's incident list. The quarrel was recorded as lasting from 20:11:24 to 20:18:13, while the resident placed its end between 20:15 and 20:19. The complaint about working conditions was recorded as lasting from 15:22:09 to 15:27:24, while the resident placed it at approximately 15:21–15:28. Beyond these two cases, start- and end-time accuracy was not evaluated separately, because confirmation applied to the incident as presented, including its reported times. The rejected long quarrels discussed in Section 3.4.3 nevertheless suggest that end-time estimation may be less reliable than start-time estimation.
3.4.7. Where the Errors Come From
The planner and answer writer are GPT-4o-mini. Retrieval is deterministic code.
Table 19 shows that almost all errors come from the incident list. After the pair fix, the planner, the retrieval and the answer writer added at most one error in 123 questions. The quality of an answer is therefore the quality of the list. The list is precise (88%) but has low recall (29%) and only fair agreement on the kind of incident. Improving the system means improving how the reader lists incidents, especially quarrels that are extended too far and warm moments that are not listed at all.
3.4.8. Limitations
Study limitations. The evaluation was conducted in a single household over 27 days. Recall was assessed on 13 days using 211 windows. Its confidence interval (21–38%) is wide, and the limited number of examples prevents reliable estimation of recall for rare incident types, particularly rebuffs and reconciliations. Blind labelling avoids the bias introduced by seeing the system's predictions before making a judgement, but it does not eliminate the influence of the rater's own interpretation of what constitutes an incident. This limitation is particularly relevant to warm moments, for which the rater's interpretation appeared to differ from the reader's operational definition.
Recall was measured only for events represented in the recordings and attributed to a resident. Incidents that were not recorded, or speech that was not attributed to a resident, were absent from the evaluated windows and therefore could not contribute to the recall estimate.
The unit of recall measurement was the five-minute window rather than the individual incident. Consequently, a single long incident could span several windows, while multiple incidents could occur within one window.
The incident list was not fully reproducible across repeated readings. In five readings of 2 October, the system identified between 17 and 22 incidents. Since each day was processed only once in the main evaluation, this variability was not captured by the confidence intervals reported above.
4. Discussion
4.1. On results
4.1.1. Layer-Specific Evaluation Architecture
In short, the system ‘understands’ quite reliably family dynamics based on fragmented evidence. The empirical evaluation in Section 3 isolates system performance across four complementary studies, with each designed to evaluate distinct failure modes throughout the pipeline stack. The scripted corpus study (Section 3.1) fixes lexical content, speaker identities, and intended relational profiles to isolate the specific degradation introduced by room acoustics and capture hardware. The component study (Section 3.2) removes script constraints to evaluate the accuracy of individual perceptual modules on unscripted, ambient household audio. The manual-observation study (Section 3.3) evaluates system predictions against human behavioral coding, acknowledging that higher-level relational constructs (e.g., assessing interactional tension) cannot be inferred directly from raw acoustic waveforms. Finally, the longitudinal retrieval study (Section 3.4) evaluates multi-day semantic reasoning built atop the outputs of the preceding three layers. By evaluating these stages independently, this methodology localizes system capabilities and failure modes to specific architectural layers rather than offering generalized performance estimates—a core contribution of this work. Consequently, observed errors are mapped directly to specific processing stages, most of which are paired with targeted architectural remedies.
4.1.2. Relational Layer Resilience Against Recognition Pipeline Degradation
Natural household interactions exhibit high conversational complexity, including overlapping speech, truncated turns, indirect speech acts, sarcasm, nonverbal vocalizations, spatial movement, contextual affect, ambient background noise, unexpected interruptions, and context-dependent silences. A principal empirical finding of this work is that high-level relational interpretations remain highly resilient to real-world automatic speech recognition errors. When evaluating model readings generated from transcripts containing a 23.5% word error rate against readings derived from clean reference scripts, relational scores maintained strong cross-run stability and close numerical alignment (yielding low mean absolute error). Crucially, transcription errors did not disrupt ordinal rank orderings across pre-specified experimental design groups or paired contrast conditions. Open conflict was consistently classified as a distinct interaction category across all seven experimental takes under both clean and ASR-degraded conditions. Furthermore, the model correctly identified sarcastic exchanges containing positive words as less warm than genuinely affectionate exchanges, while successfully differentiating cold, detached interactions from calm, low-arousal baseline exchanges. While a large language model's capacity to detect sarcasm in clean text is well-established, these results demonstrate that this analytical capacity persists after raw speech has traversed physical room acoustics, undergone capture via low-cost edge sensors, experienced spatial merging across three distributed audio streams, and passed through automated Whisper transcription—a finding validated against pre-registered hypotheses.
4.1.3. Reconciling Controlled and In-the-Wild Evaluations
The controlled scripted evaluation in Section 3.1 demonstrates that the relational interpretation layer closely tracks target behavioral profiles, whereas the live deployment evaluation in Section 3.3 initially reports low baseline agreement with human coders. This apparent divergence stems from differences in the unit of analysis provided to the language model.
In Section 3.1, each experimental take was presented to the model as a single, complete conversational unit bounded by known execution parameters. Conversely, the live pipeline segmented conversations automatically, yielding a median of 4.5 fragmented exchanges per take across those same forty takes. Section 3.3 quantifies the measurement penalty introduced by this over-segmentation: inter-rater agreement scales directly with exchange length, rising from low baseline values on brief fragments to strong agreement on exchanges containing at least 57 words. Correcting cross-room segmentation defects increased median two-resident exchange lengths from 22 to 52 words while raising the share of long exchanges from 13% to 47%. Re-evaluating the evaluation sample under repaired segmentation increased tension agreement from 0.23 to 0.39; applying two subsequent speaker-attribution filters further increased agreement to 0.45.
This reconciliation confirms that the two studies measure complementary aspects of system performance. Section 3.1 confirms that the relational interpretation layer functions reliably when provided complete conversational contexts, while Section 3.3 exposed a pipeline failure in delivering complete units during live deployment. Resolving this gap required fixing upstream exchange segmentation rather than retraining the language model, altering prompts, or adjusting behavioral definitions.
4.1.4. Distribution and Taxonomy of System Errors
In passive sensing architectures where users cannot manually audit raw recordings, omission errors are substantially less damaging than fabrication errors. Omissions naturally resolve as hardware density, enrollment profiles, and data capture volumes improve, whereas fabrications insert unsupported assertions into downstream summaries that cannot be distinguished from genuine behavioral evidence.
Under this framework, the primary perception stages exhibit a clear bias toward conservative abstention over false assertion. Automatic speech recognition deletions outnumber insertions nearly two-to-one (118 vs. 62). Closed-set speaker identification achieves high attribution accuracy across returned names, generating cross-resident misidentifications in only four clips. Acoustic event classification ranks a valid label first in 85.7% of clips and within the top three in 98.0%. Finally, while the initial speech-detection gate operates generously (yielding 78.5% precision), only 3 of 32 non-speech false positives produced a text transcript, demonstrating that downstream transcription steps effectively filter out non-vocal acoustic noise.
This conservative design is embedded throughout the system stack: the relational layer distinguishes missing data from negative evidence by emitting null values rather than zero scores, the speaker identification module abstains when confidence falls below operational thresholds, and unreadable exchanges are logged as uninterpreted. The primary breakdown in this design discipline occurred in the prose generation layer evaluated in Section 3.4, where the model asserted an unrecorded event in five out of six runs on an unserviceable control query. This failure stands out precisely because the underlying deterministic layers performed reliably: across that same study, all 85 output quotations were verified against primary source records without a single fabricated quote. Addressing this vulnerability requires two structural updates: constraining the narrative synthesis prompt to rely strictly on retrieved database rows, and requiring explicit system abstention when queries cannot be served by available tools.
4.1.5. Current Operational Capabilities and Limitations
A realistic assessment reveals an operational profile narrower than initial design goals suggest, yet significantly more robust than any isolated metric indicates. Multi-unit audio capture using low-cost edge nodes proves highly effective, deriving resilience from sensor network redundancy: although 53% of spoken turns were captured by only a single room node, the combined network achieved a 91.3% overall speech recognition rate. Acoustic event classification operates reliably, and speaker identification remains trustworthy when configured to abstain on low-confidence inputs. Furthermore, the relational interpretation layer successfully reproduces structured relational patterns through a full hardware-to-software pipeline, achieving moderate agreement with human raters on tension during continuous conversations. Finally, multi-day retrieval across the underlying event store functions deterministically with zero quotation errors.
Conversely, explicit system boundaries remain clearly defined: one perceptual channel operates below majority baseline, one relational dimension is inactive, warmth remains unvalidated by human coders, retrieval precision requires pooled evaluation, and narrative prose synthesis requires strict grounding constraints. Each issue maps to a specific architectural layer with a clear engineering fix. Three pipeline corrections implemented during testing—fixing exchange segmentation, enforcing speaker attribution thresholds, and recalibrating UI indicator levels—yielded substantial performance improvements without requiring model retraining.
This represents the primary contribution of this work: proving not that automated dynamic interpretation of household interactions is fully solved, but that a live ambient system can be audited thoroughly enough to pinpoint functional components, isolate failure modes, and establish concrete remedies across the stack.
4.2. Ethics
Inviting an AI agent into the domestic environment is voluntary, and individuals retain the right to decline its use. However, choosing not to adopt such technology also means rejecting the assistance, monitoring, and support that it can provide. Undoubtedly, some of these functions, including emergency detection, support for older adults [40,41,42,43], home monitoring, and couples’ consultation, can be obtained today through separate services, but combining multiple specialized solutions may be financially and practically difficult for many households. Regarding residents’ interactions, the challenges that arise within families are real as statistics show and, to some extent, inherent in everyday human relationships. Differences in personality, expectations, stress, different characters, needs, and non-aligning goals can create misunderstandings, tension, or periods of reduced communication even within otherwise healthy and supportive families. We therefore do not view family difficulties as evidence of dysfunction in a pathological sense, but as a natural aspect of shared human life that may, at times, benefit from the factual-based awareness and support AI can provide. An integrated in-home AI system could therefore make a wide range of diverging services accessible at substantially lower cost.
The privacy implications of ambient AI should nevertheless be taken seriously and should not be justified simply by the availability of potential benefits. Rather, they should be evaluated in relation to the risks and opportunities associated with both the presence and absence of such technology. Individuals may reasonably prefer not to be continuously observed, even when monitoring could provide additional safety or assistance and raw information is purged. At the same time, the absence of ambient monitoring does not guarantee privacy, safety, independence, or meaningful human relationships. For example, a person living alone may face prolonged periods without assistance following an accident, while families with limited time available for caregiving may have fewer opportunities to recognize changes in a child's or older person's wellbeing. In this context, the ethical question is not whether privacy should be exchanged for technological assistance, but how the two can be balanced according to the circumstances, needs and cultural profile of the occupants. The proposed framework therefore treats privacy as a fundamental constraint on system design while also recognizing safety, autonomy, care, and access to assistance as legitimate considerations in evaluating the overall impact of in-home AI.
4.3. Legal Data
The architecture takes into account the principles of the General Data Protection Regulation (GDPR; Regulation (EU) 2016/679). Under Article 5, personal data must be processed lawfully and transparently, collected for specified purposes, limited to what is necessary, and retained only for as long as necessary. These requirements are implemented by restricting sensing to the defined functions of the system, processing raw audiovisual data locally, retaining them for a maximum of 24 h, and permanently deleting them thereafter. Persistent storage contains only derived representations, aggregated records and reports. Under Article 25, data protection must be implemented by design and by default. Accordingly, raw audiovisual streams are not accessible to residents, including the household member operating the system; all household users receive only derived observations, abstractions, and reports. This prevents one resident from obtaining the raw recordings of another and limits access to the information required for the stated purpose. Article 32 further requires appropriate security of processing; the local architecture, restricted access, authentication mechanisms, and encrypted device-to-server communication provide these controls within the home. The system therefore applies data minimisation, storage limitation, purpose limitation, access restriction, and data protection by design at the architectural level rather than relying solely on user behaviour. Where processing involves special categories of personal data, such as health information, Article 9 applies and requires an additional legal basis and safeguards. The system does not make decisions producing legal or similarly significant effects about residents and presents its outputs as observations and reflections rather than diagnoses or judgements. On this basis, the implemented processing model is consistent with the GDPR principles applicable to the system, while the specific lawful basis for processing remains dependent on the deployment context and must be established by the data controller.
5. Challenges and Future Prospects
5.1. Local Intelligence and Semantic Understanding
While present-day edge hardware cannot fully process large multimodal models locally, rapid advances in model compression and vision-language architecture are closing the gap. Currently quantized vision-language models—such as the Qwen family—struggle with multi-frame temporal reasoning on low-power devices. However, upcoming generations of multimodal LLMs will enable edge-native understanding of complex human actions and physical context directly on-premises, eliminating reliance on cloud infrastructure. As hardware efficiency improves, sentinels will shrink into near-invisible form factors, such as microphones and cameras integrated directly into ceiling lamps and ambient light fixtures.
5.2. New Services
The architecture supports complex, multimodal task execution initiated by high-level natural-language directives. Users can delegate multistep operational tasks that combine temporal monitoring, cloud-based LLM reasoning, and local hardware execution, enabling new services to be introduced without redesigning the underlying system.
A) Zero-friction spatial communication. Unlike conventional telecommunication tools, which require an explicit call-acceptance workflow, our platform enables unmediated, zero-friction spatial communication, subject to prior household consent. When a resident issues a target-directed utterance, such as “Rafael, did you do your homework?”, the system tracks the recipient's real-time location within the home and dynamically routes the audio stream to the nearest audiovisual sentinel. As occupants move freely around the residence, spatial tracking updates the routing parameters in real time, maintaining uninterrupted communication without requiring the participants to be physically co-present. Webcams and existing communication software offer only part of the flexibility afforded by small audiovisual sentinels with dynamic audio routing.
B) Applications in elder care. The platform is immediately applicable to the care of older adults with dementia and/or mobility limitations, facilitating communication between residents and their guardians, who are often their adult children. In preliminary work [35,36], we show that when a guardian monitors household events through an organized dashboard, they can intervene to resolve practical problems, enhance residents' safety, and maintain a sense of connection. The sentinel network can also automatically notify guardians or nursing staff of falls and other events requiring attention.
C) On-demand conversational participation and service orchestration. Users can explicitly invite the agent to participate in a conversation and perform associated tasks. For example, in response to a directive such as “Listen to this conversation for the next hour, request legal counseling, and print the report,” the platform can coordinate a multistep workflow: transcribing localized audio streams over the specified period, formulating structured queries for an external legal LLM service, and sending the resulting report to a local printer. The architecture can be extended to other specialized services through retrieval-augmented generation (RAG), with domain-specific resources supporting applications in law, elder psychology, adolescent psychology, and couples counseling. Because these applications involve sensitive personal matters, particularly psychological issues, the local agent should participate in such discussions only when explicitly invited by the residents and within clearly defined consent and privacy boundaries.
D) Home monitoring and security. The architecture could be extended to residential security, enabling the sentinel network to detect potential intrusions and initiate predefined, appropriately authorized responses, such as activating alarms or fog release. Such applications would require dedicated validation, safeguards and human confirmation against false positives and unintended consequences.
5.3. Shortcomings
This work is a proof of concept built on MCU-class edge devices and a single low-end laptop with a GPU, and the evaluations of Section 3 make its limits specific rather than general.
The hardware is the binding constraint on what the sentinels can do rather than on what they hear. The ESP32-P4, the most capable unit tried, only marginally sustains bilateral video (15 fps uplink, 3 fps downlink), and all units would benefit from more RAM, faster processing and a louder speaker able to carry a voice across a 30 m2 room. A better acoustic model than AST would help less than these: sound labelling is already the most accurate component measured, placing an acceptable label first on 85.7% of clips and within three on 98.0%. The weakest links lie elsewhere.
Audio capture is the first of them, and it is a property of the network rather than of any unit. When the residents moved through the home while performing the scripted corpus, 53% of the 219 lines reached exactly one sentinel, 5% reached all three and 11% reached none at all. Together the three units recognised 91.3% of the lines, so the network compensates for what no single device can do; but a room-bound sentinel cannot follow a conversation that walks out of the room, and the deployed report consequently divided each scripted dialogue into a median of 4.5 separate exchanges. Section 3.3 showed what that costs downstream: the relational reading agrees with a human listener far better on exchanges that contain a substantial conversation (κ 0.43 above 57 words) than on the fragments that room-bound segmentation produces (κ 0.23 overall). Repairing the segmentation rule recovered much of the loss without new hardware, but denser coverage, or sentinels able to hand a conversation to one another, would address the cause.
Speech recognition deteriorated in the presence of appliance noise — vacuum cleaner, air fryer, washing machine, cooker hood — particularly at low signal-to-noise ratios, and the unscripted evaluation now quantifies the effect. Less common speech impairments included speaking while eating, vocalizing while brushing teeth, and misattributing speaker identity during morning speech affected by a sore throat. The aggregate word error rate of 24.9% conceals a strongly bimodal distribution: the median clip sits at 22.2% but the interquartile range runs from 5.7% to 87.5%. Clips either transcribe well or fail almost completely, and a spread of that width points at the recording conditions rather than at the model. Two consequences follow. First, 27.5% of the clips in which a resident demonstrably spoke produced no transcript at all; because a conversation candidate requires two named speakers within one recording, a two-person exchange with one end missing does not degrade gracefully but disappears. Second, two in five of the clips drawn for annotation had to be skipped because a human listener could not honestly judge them, which means every recognition and identification rate reported in Section 3.2 is flattered by the exclusion of the audio that was hardest to hear.
Because domestic dialogue consists mainly of short turns, language auto-detection in Whisper is disabled and recognition is fixed to the local language: an erroneous language selection on a three-word turn produces severe errors. The cost is that widely borrowed English words — spray, fryer, OK — are mapped into Greek orthography. That the character error rate (19.5%) sits well below the word error rate indicates that most errors are of this morphological kind rather than invented content, so the gist of an utterance usually survives. Word error rates should be expected to be lower for languages with larger training resources.
Two further limitations belong to the design rather than to the equipment. The closed speaker set has no reject option: with three enrolled residents, a visitor or a television is attributed to somebody in the household, which occurred on four of the seven clips carrying a non-resident voice. A similarity floor has since been introduced, and enrolment of an explicit reject class remains the fuller remedy. Separately, the deployment retains audio only for clips whose labels contain speech, so the clips the speech gate rejected cannot be presented to a listener and the gate's recall is not estimable by any amount of annotation. Retaining the audio of a small random fraction of rejected clips would remove that blind spot at negligible cost, and is the single change that would most improve the next evaluation.
5.4. Ethical Guardrails and Algorithmic Misinterpretation
Human communication is multi-level and complicated. It carries context beyond transcribed text — past actions, connotations, family jokes incomprehensible outside the household, impersonations, playfulness, and phrases borrowed from songs and films. Once reduced to text and propagated downstream, that context is gone, and a scene can be read as something it was not. The evaluations allow this concern to be stated more precisely than before, and the precision is useful, because the risk turns out not to lie where it was assumed to lie.
The interpretation layer handles figurative and playful speech better than anticipated. On the scripted corpus, a sarcastic exchange dressed in kind words was read as less warm than a genuinely warm one, and a cold exchange was separated from a calm one of the same low arousal; both contrasts held from the recordings as well as from the original text, as did all eight paired contrasts and all ten pre-specified orderings between design groups. Reading intent rather than vocabulary is something a language model over a transcript can evidently do.
The acoustic affect classifier cannot. Scored against a listener on 113 clips of ordinary household audio it reached 70.8% accuracy against a majority-class baseline of 91.2%, with a Cohen's κ of −0.02: answering "neutral" every time, with no model at all, would have been more accurate. It also attached an affect label to twenty clips in which nobody spoke. The concern that classifiers mistake sarcasm, rough playfulness or adolescent frustration for genuine anger is therefore not hypothetical, and the appropriate guardrail is not calibration but exclusion: this channel does not support a claim about any person on any day, and it is reported so that it can be set aside knowingly rather than trusted by default.
The household's own recordings show why the distinction is hard. Among the exchanges coded by a listener were an adult loudly staging a dispute while the other could not stop laughing, and an adult shouting at the child in a manner the listener described as feigned but convincing, with no laughter to mark it. Only the second would deceive a person; both would deceive an acoustic classifier. Laughter is the strongest available signal that a heated exchange is play rather than conflict, and it is largely absent from a transcript — the same gap that leaves the joy dimension under-read and withdrawal, which lives in tone and brevity rather than in words, unable to register at all.
Furthermore, our empirical component evaluation underscores the necessity of strict functional boundaries for acoustic emotion recognition within domestic environments. As demonstrated in Section 3.2, the dimensional wav2vec2 affect classifier performed below a flat baseline (achieving 70.8% accuracy compared to a 91.2% majority-class prior, with a Cohen's κ of −0.02), frequently misattributing affect labels to non-speech ambient audio. Because domestic interactions are frequently characterized by sarcasm, playful roughhousing, or adolescent frustration that acoustic models misread as hostility, automated affect classification cannot reliably support objective claims about individual wellbeing. Consequently, the appropriate architectural safeguard is not heuristic calibration or threshold tuning, but explicit functional exclusion: affect classification channels must be barred from influencing aggregate relational scores, ensuring that system reflections are anchored strictly in deterministic transcripts and behavioral event data rather than unreliable vocal affect models.
Two further failure modes were identified that no amount of decision-boundary calibration would address, because they are assertions rather than misclassifications.
The first is asserting absence. The withdrawal dimension was scored 0.0 on every one of the 670 exchanges in a six-day window, yet the indicator derived from it reported "no isolation detected" — an inverted lamp reading green. A channel that has never produced a non-zero value cannot support a negative finding, and absence of measurement was being presented to the household as measurement of absence. The system now reports no evidence in that case, and the same principle should govern any indicator whose evidence is thin.
The second is confident invention in generated prose. Asked six times, over an identical store, when a resident had withdrawn from a conversation, the system returned five assertions of an event the data does not contain — naming specific and mutually inconsistent dates, one of them appended with "Confidence: High" — and declined correctly only once. Every other layer behaved: the planner was stable across all six runs, and in the same study all 85 quotations the system printed were traced back to the events they cited without a single invented quote. The failure is confined to the narration layer and the remedies are correspondingly narrow: constrain generated prose to assert only what the retrieved rows contain, and refuse a question that no operation serves rather than routing it to the nearest available one.
Taken together these results suggest a workable division of responsibility. The deterministic parts of the system — selecting exchanges, quoting utterances, attaching identifiers and timestamps — proved trustworthy and should carry the evidential weight. The generative parts are where unwarranted certainty enters, and they should be constrained to the record rather than calibrated against it. Operating a proactive agent in a home requires not only that its decision boundaries be tuned, but that it be architecturally unable to state more than it observed.
6. Conclusions
We envision the affective home of tomorrow as an environment that can provide continuous, affordable support on many voice-based services to its residents while preserving the privacy and autonomy of the domestic space by not leaking the data outside home. We are confident that we will reach this stage when we achieve precise evaluation of all components and purging any raw audiovisual content after processing (i.e. all processing stages created on-the-fly and only reports are stored). The system presented in this work combines audiovisual sensing from distributed in-home sentinels with local processing on a central server to provide a broad range of capabilities, from activity and event recognition to conversational assistance and the monitoring of social and emotional wellbeing. Rather than treating these capabilities as isolated applications, we propose an integrated framework in which observations accumulated over time can contribute to a richer understanding of everyday life within the home.
A central contribution of this work is the shift from individual emotion recognition toward family-centered sensing. Existing smart-home and wellbeing systems predominantly focus on detecting activities, speech, social interactions, individual emotional states, or indicators of personal wellbeing. These observations are valuable, but they provide only a partial account of domestic wellbeing, which is also shaped by interactions between people and by how relationships evolve over time. Our framework therefore considers the family as a dynamic relational system and introduces longitudinal indicators of relational functioning, including warmth, conflict load, repair, social recovery, and resilience. The objective is not to assign judgments or blame to individual family members, but to identify patterns that may otherwise remain difficult to perceive in the continuous flow of everyday domestic life because, like rust, they accumulate slowly and become visible only after they have significantly affected relationships and well-being.
The emphasis on local processing is equally important. By performing audiovisual analytics within the home rather than requiring continuous transmission of raw domestic data to cloud services, the proposed architecture provides a practical foundation for privacy-conscious ambient intelligence. In this sense, the system is conceived not as a replacement for human relationships or professional care, but as an additional layer of awareness that can help residents recognize changes in their shared environment and relationships.
Taken together, these elements suggest a broader direction for human-centered family informatics: the home can be understood not only as a collection of individually sensed occupants and activities, but as a continuously evolving social system that can co-exist with artificial intelligence. Future work should validate the proposed relational indicators against established psychological and family-science measures, upgrade the role of visual sentinels, evaluate their robustness across households and cultural contexts, and examine how families interpret and act upon the information provided. Such validation will be essential for determining whether ambient AI can move beyond detecting what happens in the home toward responsibly supporting the wellbeing and resilience of the people who live there.
Supplementary Materials
The following supporting information can be downloaded at the website of this paper posted on Preprints.org.
Supplementary Materials
The following supporting information can be downloaded at: https://zenodo.org/records/23501750
Videos: (1) Home_sense_platform.mp4: The dashboard as a situational awareness tool. (2) sentinel_box3.mp4: The audio sentinel in action.
Funding
This research received no external funding.
Institutional Review Board Statement
Not applicable. The researchers analyzed only anonymized event metadata generated on the device; no identifiable audio or video was accessed or transferred.
Augmented Ethical Compliance & Informed Consent Statement
Ethics Approval and Regulatory Compliance
This study was conducted in strict accordance with the ethical principles originating in the Declaration of Helsinki and local legal frameworks governing non-interventional human research in Greece (Law 4521/2018). Under the guidelines of the Hellenic National Commission for Bioethics and Technoethics and relevant academic research codes (e.g., the Code of Ethics and Conduct of Research of the University of West Attica and FORTH/ITE), formal institutional review board (IRB) approval is not legally or institutionally mandated for non-clinical, minimal-risk observational research that collects no biological samples, applies no psychological interventions, and maintains strict data protection safeguards. Consequently, formal ethical committee review was deemed exempt.
Informed Consent and Participant Autonomy
All participants provided prior written informed consent before any deployment or audio monitoring commenced. Participants were explicitly briefed on the operational nature of the system, the scope of acoustic and conversational recording, and their absolute right to withdraw from the study at any time without justification or prejudice, triggering the immediate purge of their stored data. We thank our lab collaborators for taking the role of coders that assess audio recordings.
Data Protection, Anonymization, and Privacy by Design
Data processing complied fully with the European Union General Data Protection Regulation (GDPR) and Greek Law 4624/2019:
Pseudonymization and Encryption: All continuous audio, feature vectors, embeddings, and generated transcripts were immediately pseudonymized using random cryptographic identifiers. No directly identifying personal data (names, addresses) were stored alongside raw or processed acoustic events.
On-Premises Processing: Raw audio streams were processed locally on dedicated edge/server architecture with an ephemeral 24-hour retention window. Raw audio feeds were automatically and irreversibly purged after feature extraction and daily summary generation, leaving only high-level abstraction metadata.
Intra-Household Privacy Override: To protect third-party visitors and uphold household autonomy, the system incorporated a physical and voice-activated privacy override mechanism, immediately halting VAD ingestion and MQTT topic publishing for a user-configurable duration.
No Third-Party Transmission: No raw audio recordings, facial models, or biometric embeddings need to be transmitted to unvetted external services or third-party cloud platforms. If we have done so in this work is only for the need of faster response in repeated experimentation.
Appendix
A1. Sketch of the apartment
A sketch of the apartment and positioning of the sentinels can be found in Figure 28.
Figure 30.
Placement of edge-processing audiovisual sentinels in an apartment.
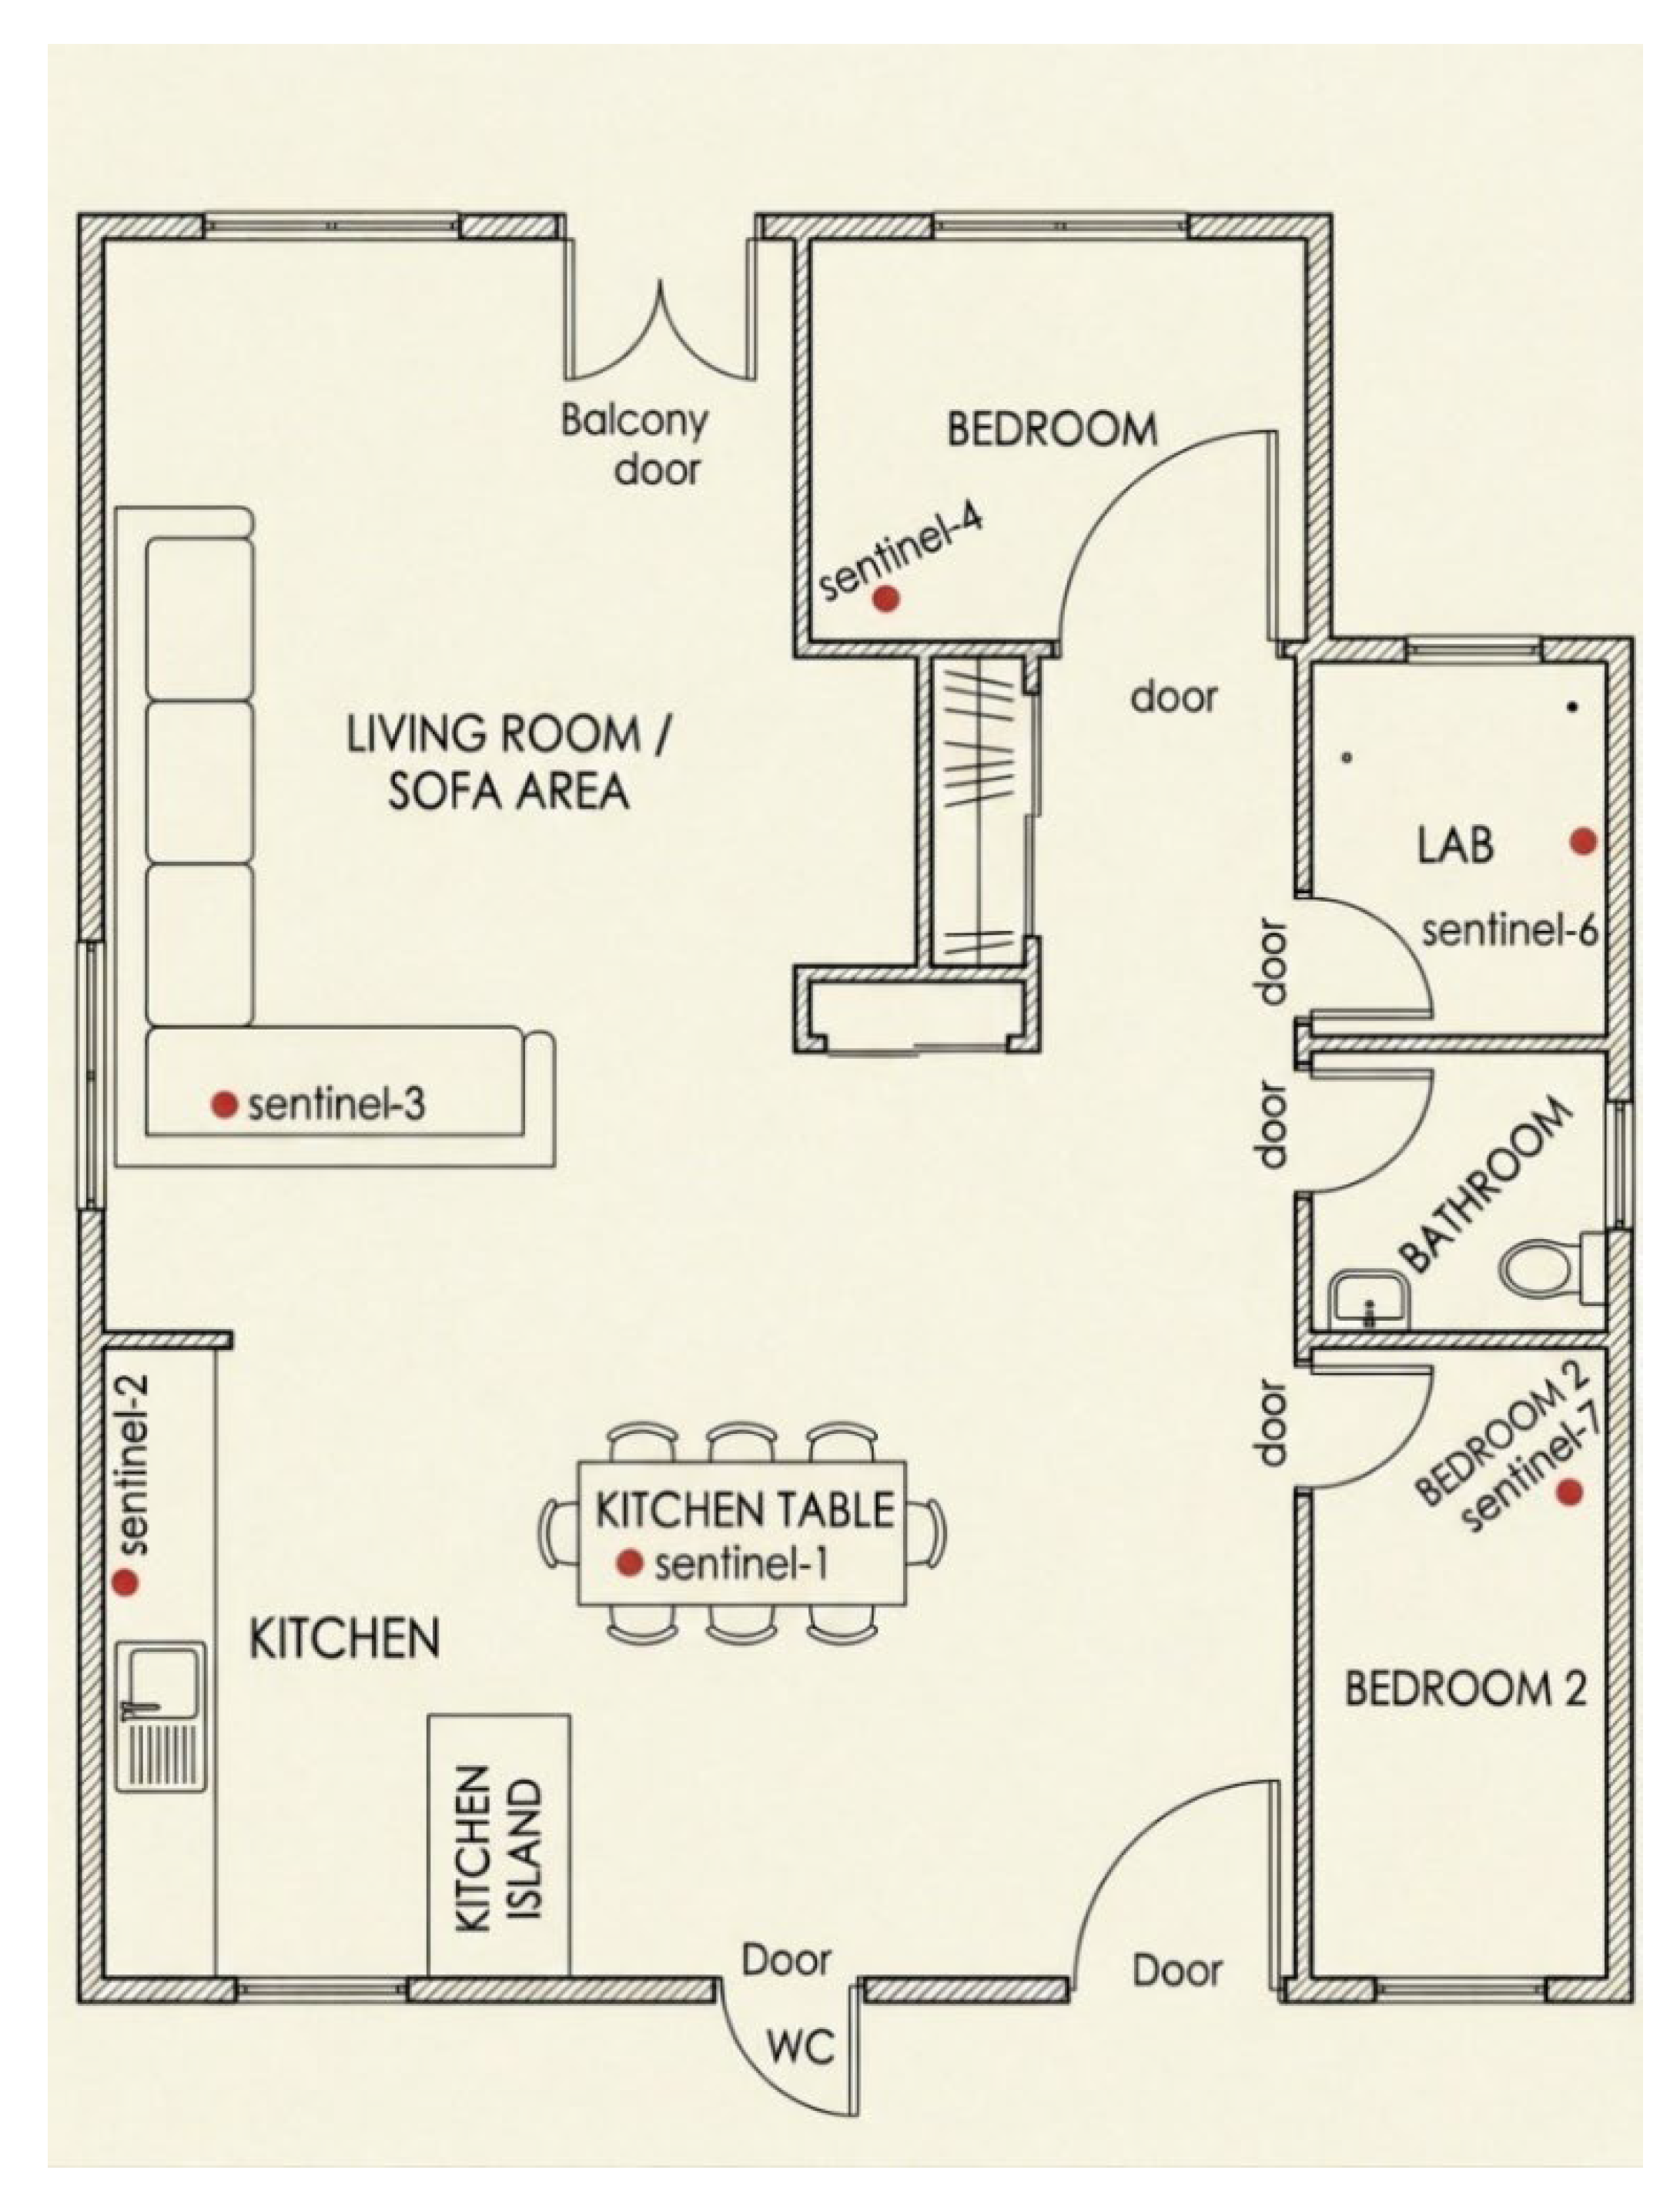
A.2
The codebase is available at https://github.com/potamitis123/homesense
The dialogues are in the same folder named ‘dialogues’.
References
- Dodge, R.; Daly, A. P.; Huyton, J.; Sanders, L. D. The challenge of defining wellbeing. Int. J. Wellbeing 2012, 2, 222–235. [Google Scholar] [CrossRef]
- Guerra, B. M. V.; et al. Ambient assisted living for frail people through human activity recognition: State-of-the-art, challenges and future directions. Front. Neurosci. 2023, 17, 1256682. [Google Scholar] [CrossRef] [PubMed]
- Elmer, T.; Lodder, G. Modeling social interaction dynamics measured with smartphone sensors: An ambulatory assessment study on social interactions and loneliness. J. Soc. Pers. Relat. 2023, 40, 654–669. [Google Scholar] [CrossRef] [PubMed]
- Casaccia, S.; Revel, G. M.; Cosoli, G.; Scalise, L. Assessment of domestic well-being: From perception to measurement. IEEE Instrum. Meas. Mag. 2021, 24, 58–67. [Google Scholar] [CrossRef]
- Petersen, J.; Austin, T.; Kaye, J. A.; Pavel, L.; Pavel, M. A smart-home system to unobtrusively and continuously assess loneliness in older adults. IEEE J. Biomed. Health Inform. 2016, 20, 1395–1400. [Google Scholar]
- VandeWeerd, C.; et al. HomeSense: Design of an ambient home health and wellness monitoring platform for older adults. Health Technol. 2020, 10, 1291–1309. [Google Scholar] [CrossRef]
- Bouchabou, D.; Nguyen, S. M.; Lohr, C.; LeDuc, B.; Kanellos, I. A survey of human activity recognition in smart homes based on IoT sensors algorithms: Taxonomies, challenges, and opportunities with deep learning. Sensors 2021, 21, 6037. [Google Scholar] [CrossRef] [PubMed]
- Rashidi, P.; Mihailidis, A. A survey on ambient-assisted living tools for older adults. IEEE J. Biomed. Health Inform. 2013, 17, 579–590. [Google Scholar] [CrossRef] [PubMed]
- Cook, D. J.; Crandall, A.; Singla, G.; Thomas, B. Detection of social interaction in smart spaces. Cybern. Syst. 2010, 41, 90–104. [Google Scholar] [CrossRef] [PubMed]
- Lee, H.; et al. FamilyScope: Visualizing affective aspects of family social interactions using passive sensor data. Proc. ACM Hum.-Comput. Interact. 2024, 8, 1–27. [Google Scholar] [CrossRef]
- Levin, H. I.; et al. Sensing everyday activity: Parent perceptions and feasibility. Infant Behav. Dev. 2021, 62, 101511. [Google Scholar] [CrossRef] [PubMed]
- Dhand, A.; et al. Validation of SocialBit as a smartwatch algorithm for social interaction detection in a clinical population. Sci. Rep. 2026, 16, 4529. [Google Scholar] [CrossRef] [PubMed]
- Schuller, B.; et al. The INTERSPEECH 2013 computational paralinguistics challenge: Social signals, conflict, emotion, autism. Proc. INTERSPEECH 2013, 2013; pp. 148–152. [Google Scholar]
- Schuller, B. W. Speech emotion recognition: Two decades in a nutshell, benchmarks, and ongoing trends. Commun. ACM 2018, 61, 90–99. [Google Scholar]
- Cummins, N.; et al. A review of depression and suicide risk assessment using speech analysis. Speech Commun. 2015, 71, 10–49. [Google Scholar] [CrossRef]
- Latif, S.; et al. Survey of deep representation learning for speech emotion recognition. IEEE Trans. Affect. Comput. 2023, 14, 1634–1654. [Google Scholar] [CrossRef]
- George, S. M.; Ilyas, P. M. A review on speech emotion recognition: A survey, recent advances, challenges, and the influence of noise. Neurocomputing 2024, 568, 127015. [Google Scholar] [CrossRef]
- Hashem, A.; Arif, M.; Alghamdi, M. Speech emotion recognition approaches: A systematic review. Speech Commun. 2023, 154, 102974. [Google Scholar] [CrossRef]
- Coiera, E.; et al. Family informatics. J. Am. Med. Inform. Assoc. 2022, 29, 1310–1315. [Google Scholar] [CrossRef] [PubMed]
- Pina, L. R.; et al. From personal informatics to family informatics: Understanding family practices around health monitoring. Proc. 2017 ACM Conference on Computer Supported Cooperative Work and Social Computing, 2017; pp. 2300–2315. [Google Scholar]
- Heshmat, Y.; Neustaedter, C.; Yang, L.; Schiphorst, T. Connecting family members across time through shared media. Proc. 2017 CHI Conference Extended Abstracts on Human Factors in Computing Systems, 2017; pp. 2630–2637. [Google Scholar]
- Beneteau, E.; et al. Parenting with Alexa: Exploring the introduction of smart speakers on family dynamics. Proc. 2020 CHI Conference on Human Factors in Computing Systems, 2020. [Google Scholar]
- Andries, V.; Robertson, J. Alexa doesn't have that many feelings: Children's understanding of AI through smart speakers. Proc. Interaction Design and Children (IDC), 2023. [Google Scholar]
- Kraemer, M. J.; Lyngs, U.; Webb, H.; Flechais, I. Further exploring communal technology use in smart homes: Social expectations. CHI 2020 Workshop, 2020. [Google Scholar]
- Amato, P. R. Research on divorce: Continuing trends and new developments. J. Marriage Fam. 2010, 72, 650–666. [Google Scholar] [CrossRef]
- Parodi, K. B.; et al. Trends in pediatric mental health emergency department visits and inpatient admissions. Pediatrics 2022, 150, e2021054269. [Google Scholar]
- National Safety Council. Preventable injury and death trends in homes and communities. Injury Facts. 2024. Available online: https://injuryfacts.nsc.org/.
- Clancy, B. Conflict in corpora: Investigating family conflict sequences using a corpus pragmatic approach. J. Lang. Aggress. Confl. 2018, 6, 241–266. [Google Scholar]
- Holleman, G. A.; et al. Gaze and speech behavior in parent–child interactions: The role of conflict and cooperation. Curr. Psychol. 2023, 42, 12129–12150. [Google Scholar] [CrossRef]
- Gottman, J. M. What Predicts Divorce? The Relationship Between Marital Processes and Marital Outcomes; Psychology Press, 1994. [Google Scholar]
- Gottman, J. M.; Levenson, R. W. Marital processes predicting later dissolution. J. Pers. Soc. Psychol. 2002. [Google Scholar]
- Gilkerson, J.; et al. Automated language environment analysis: A research synthesis. Am. J. Speech Lang. Pathol. 2017, 26, 1081–1094. [Google Scholar]
- Romeo, R. R.; et al. Beyond the 30-million-word gap: Children's conversational exposure is associated with language-related brain function. Psychol. Sci. 2018, 29, 700–710. [Google Scholar] [CrossRef] [PubMed]
- King, L. S.; Camacho, G. M.; Morales, M. E.; Williams, L. M.; Gotlib, I. H. Naturalistic language input is associated with resting-state functional connectivity in infancy. Dev. Sci. 2021, 24, e13076. [Google Scholar]
- Potamitis, I. The home as an active caregiving partner: Scaling zero-interface audiovisual connectivity for “aging in place” with dementia. Computers 2026, 15, 353. [Google Scholar] [CrossRef]
- Potamitis, I. Affordable audio hardware and artificial intelligence can transform the dementia care pipeline. Algorithms 2025, 18, 787. [Google Scholar] [CrossRef]
- Weng, Z.; Li, H.; Wang, X. E.; Huang, K.-H.; Zhao, J. What's missing in vision-language models? Probing their struggles with causal order reasoning. Proc. 19th Conf. Eur. Chapter Assoc. Comput. Linguist. 2026, Volume 1, 5689–5701. [Google Scholar] [CrossRef]
- Komanduri, A.; Bhaila, K.; Wu, X. CausalVLBench: Benchmarking visual causal reasoning in large vision-language models. Proc. 2025 Conference on Empirical Methods in Natural Language Processing, 2025; pp. 30648–30668. [Google Scholar]
- Cao, H.; Verma, R.; Nenkova, A. Speaker-sensitive emotion recognition via ranking: Studies on acted and spontaneous speech. Comput. Speech Lang. 2015, 29, 186–202. [Google Scholar] [CrossRef] [PubMed]
- Jones, V. K.; et al. Reducing loneliness and improving social support among older adults through different modalities of personal voice assistants. Geriatrics 2024, 9, 22. [Google Scholar] [CrossRef] [PubMed]
- Teo, J. Z. T.; Yoong, S. Q.; Chan, Y. X.; Jiang, Y. The effects of commercial conversational agents on older adults' mental health: A scoping review. J. Am. Med. Dir. Assoc. 2025, 26, 105523. [Google Scholar] [CrossRef] [PubMed]
- Palace, Z. J.; Sachemechian, J.; Shams, N. J. Leveraging an AI-driven voice companion to enhance mental health in older adults in post-acute and long-term care settings: A feasibility study. J. Am. Med. Dir. Assoc. 2026, 27, 106047. [Google Scholar] [CrossRef] [PubMed]
- Demir, E.; Köseoğlu, E.; Sokullu, R.; Şeker, B. Smart home assistant for ambient assisted living of elderly people with dementia. Procedia Comput. Sci. 2017, 113, 609–614. [Google Scholar] [CrossRef]
Figure 1.
Hardware infrastructure: edge-processing microcontrollers: (a) and (b) ESP32, (c) ESP32-S3, (d) and (e) ESP32-S3-BOX3, and (f) ESP32-S3-P4 touchscreen Wi-Fi 6 with OV5647 camera and loudspeaker, respectively.
Figure 1.
Hardware infrastructure: edge-processing microcontrollers: (a) and (b) ESP32, (c) ESP32-S3, (d) and (e) ESP32-S3-BOX3, and (f) ESP32-S3-P4 touchscreen Wi-Fi 6 with OV5647 camera and loudspeaker, respectively.
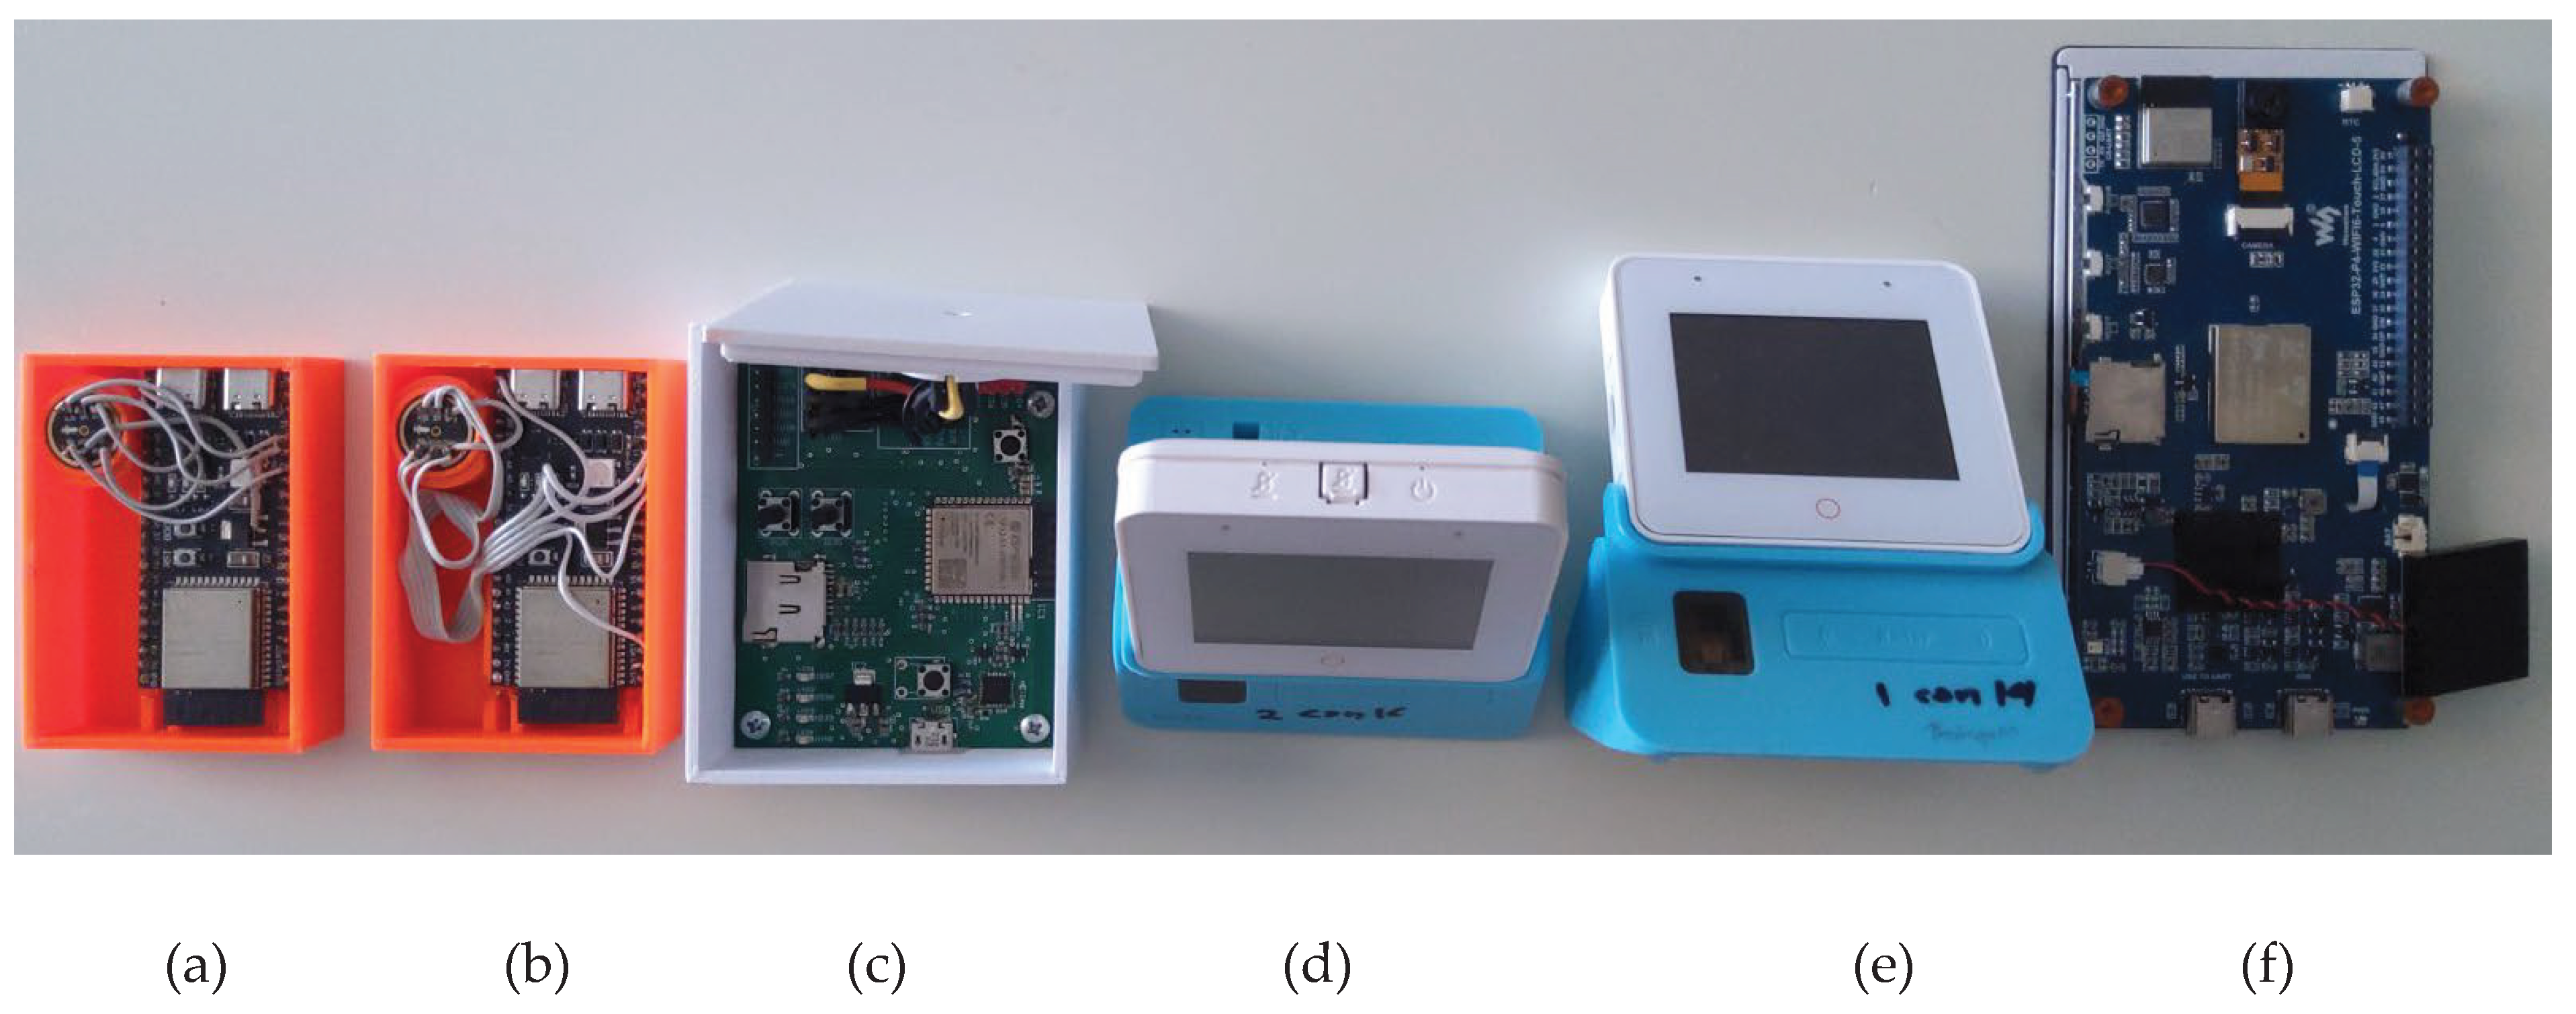
Figure 2.
Detail of the Dashboard on the home server. Timestamps of audio events, their location, their recognition, speech transcription, speaker and emotion recognition.
Figure 2.
Detail of the Dashboard on the home server. Timestamps of audio events, their location, their recognition, speech transcription, speaker and emotion recognition.
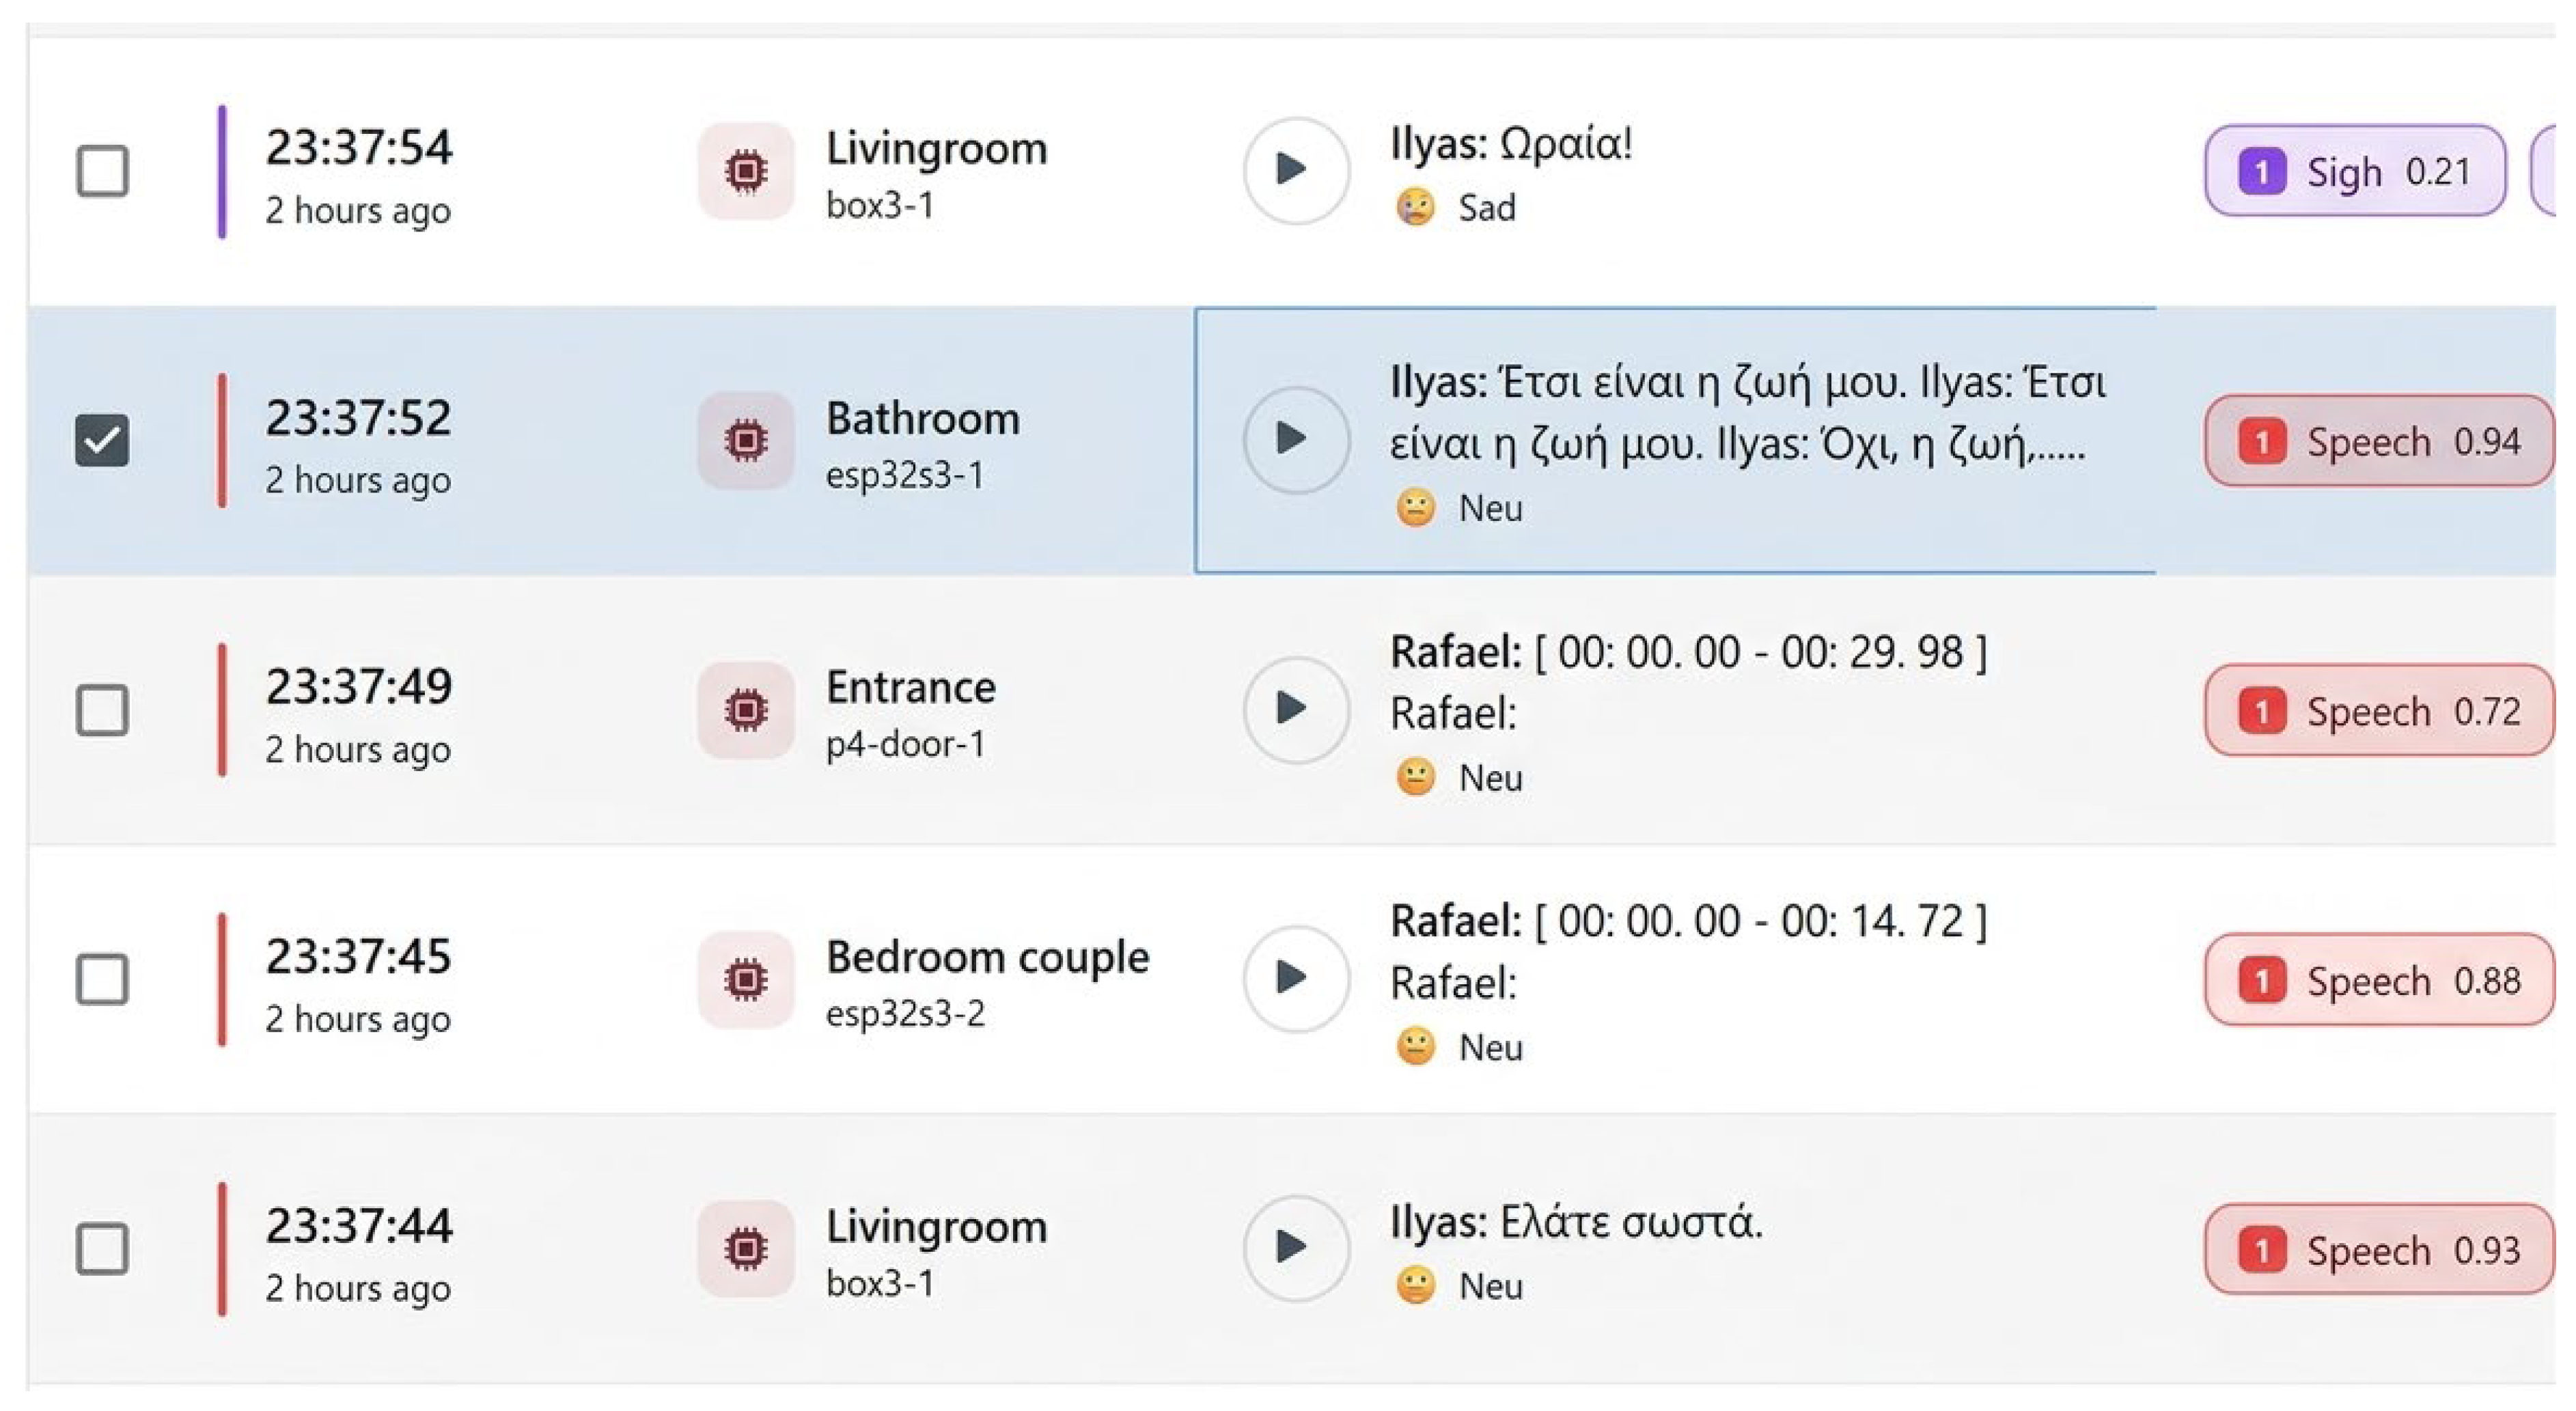
Figure 3.
The system employs a dual-loop architecture split between event-driven perception and live interaction. ESP32-BOX3 supports real-time, bidirectional audio and ESP32-P4 low-latency audiovisual streaming. Speech is transcribed and speaker, emotion, speaker turns are extracted. Non-speech audio is classified. Daily reports are subjected to a hierarchy of 4 stages extraction of progressive abstractions before feeding the last stage to an LLM.
Figure 3.
The system employs a dual-loop architecture split between event-driven perception and live interaction. ESP32-BOX3 supports real-time, bidirectional audio and ESP32-P4 low-latency audiovisual streaming. Speech is transcribed and speaker, emotion, speaker turns are extracted. Non-speech audio is classified. Daily reports are subjected to a hierarchy of 4 stages extraction of progressive abstractions before feeding the last stage to an LLM.
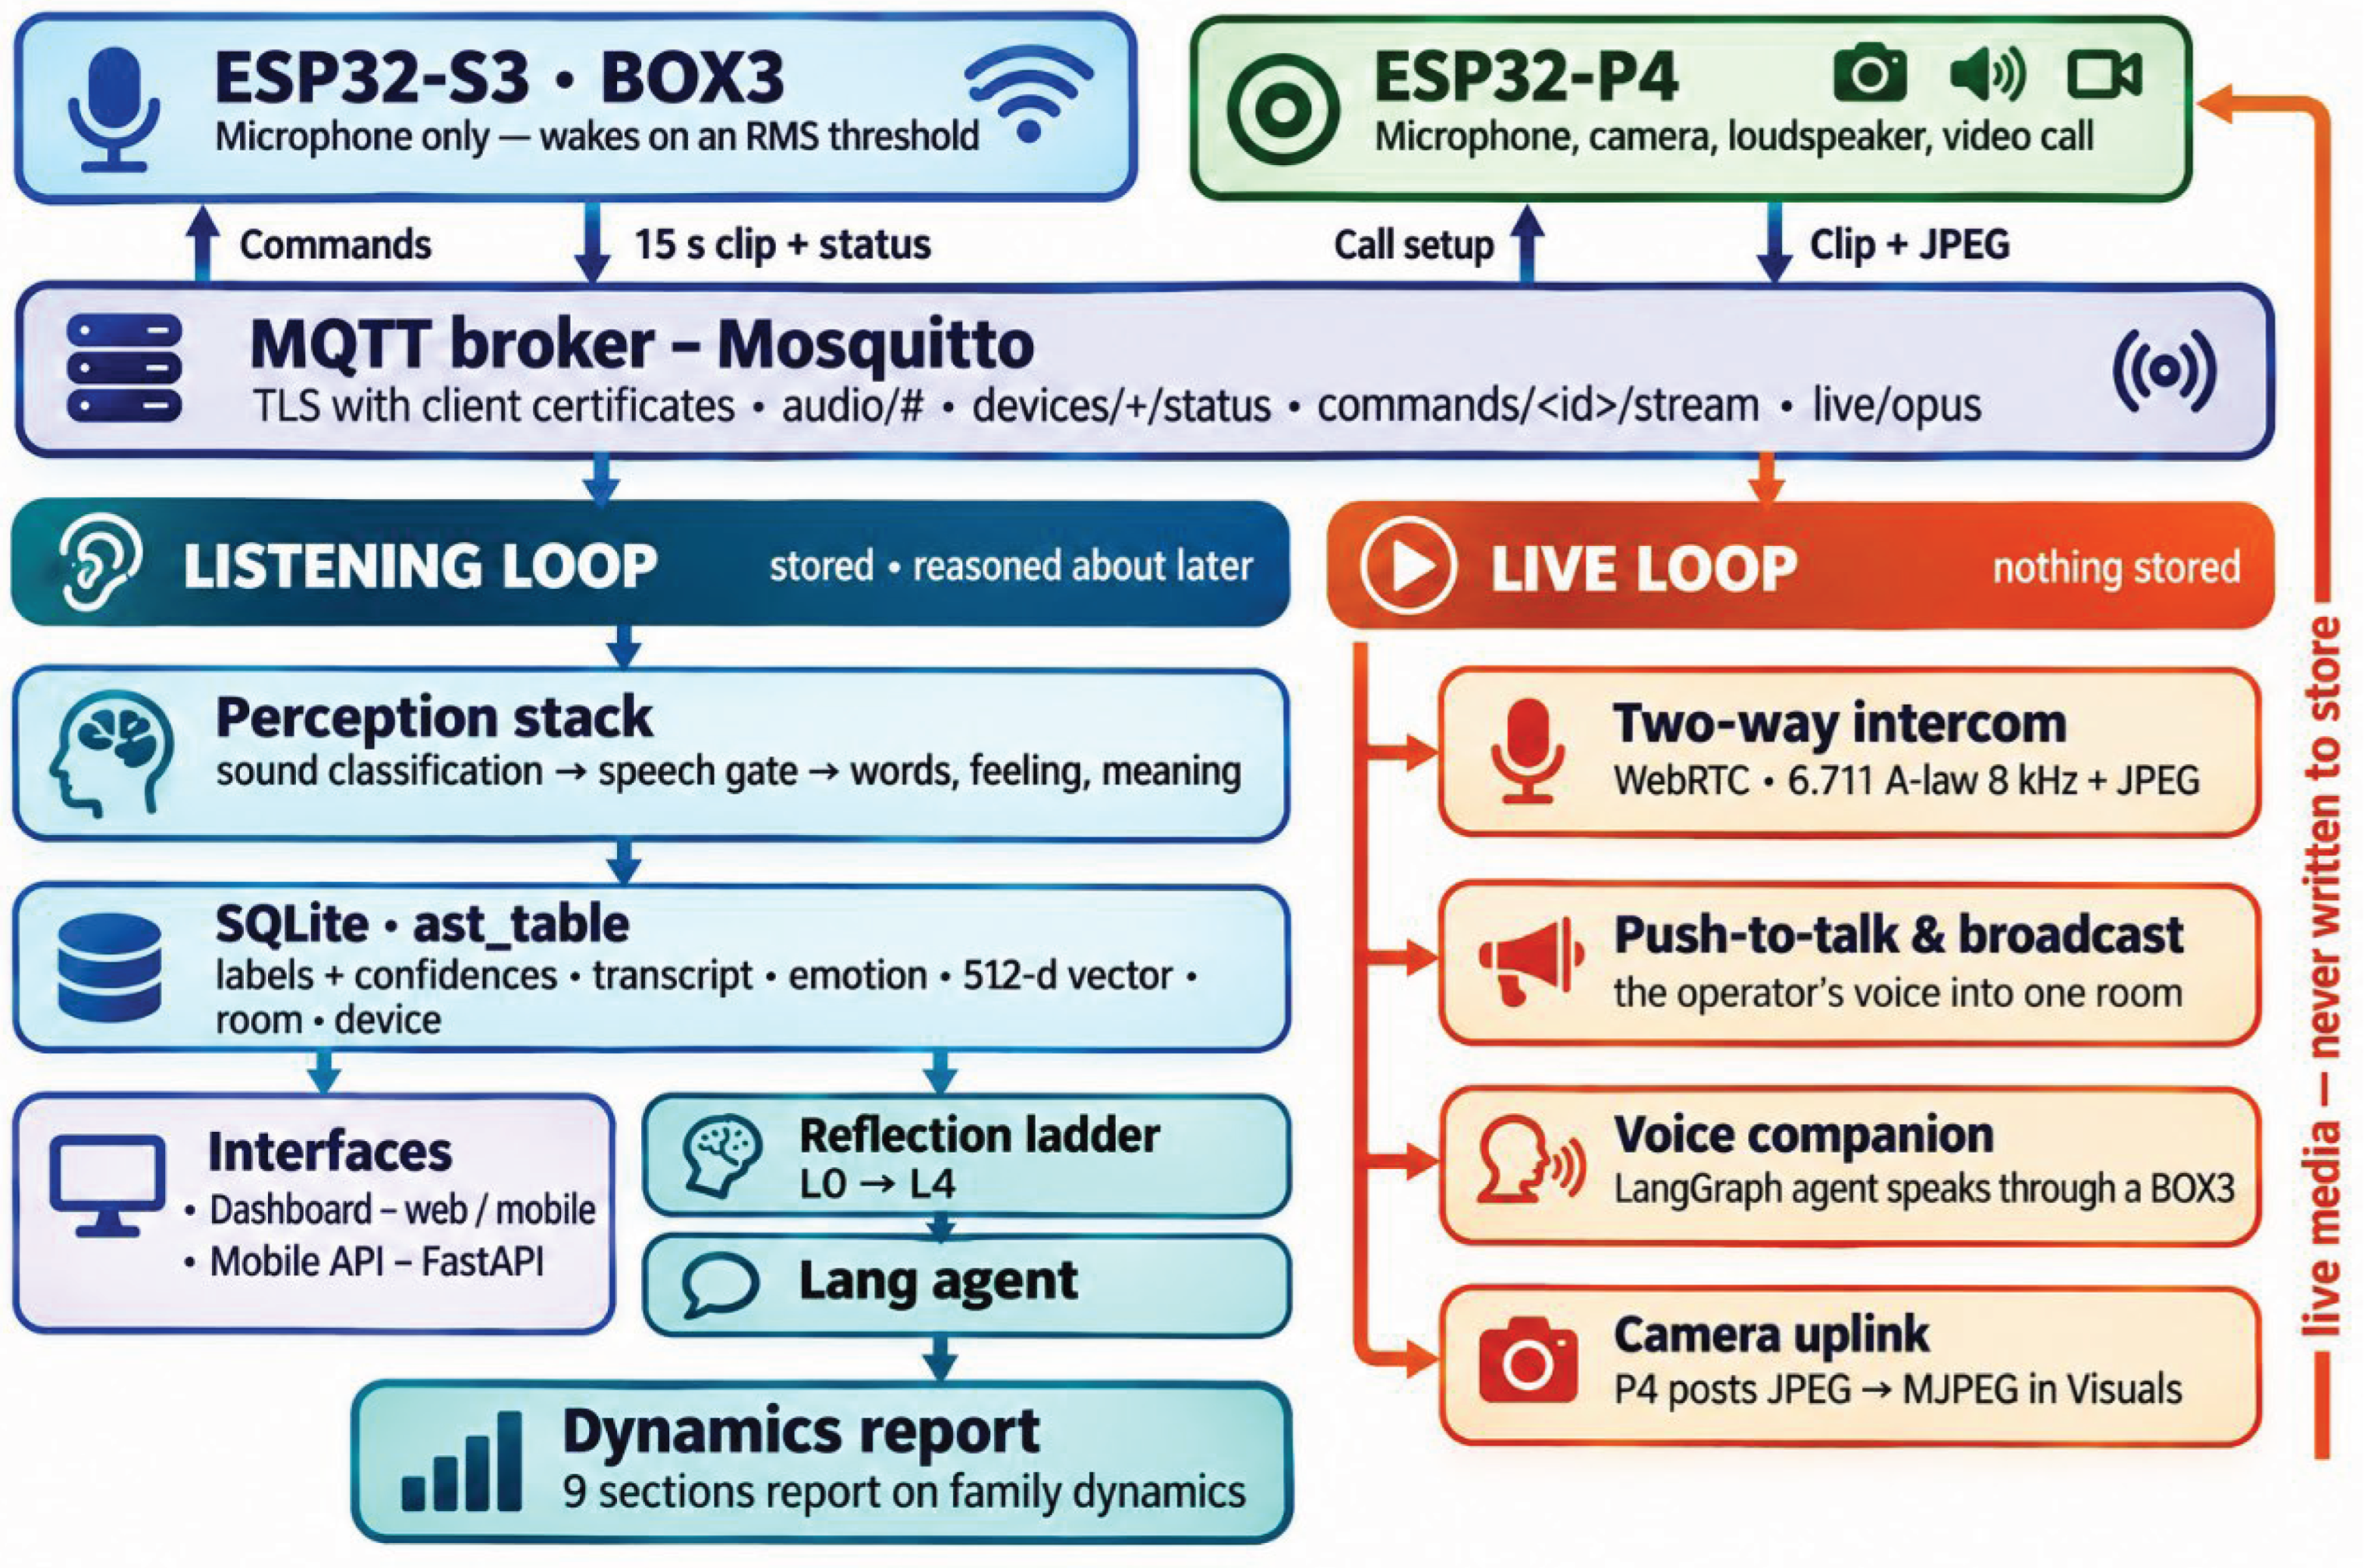
Figure 4.
The abstraction hierarchy that turns recorded events into relational evidence. Levels 0 to 4 form a deterministic chain in which each stage is a pure function of the stage below it. Level 1.5 is the single interpretive stage: it reads the speech turns directly from Level 0 rather than the semantic events above them, and rejoins the hierarchy at Level 3, where episodes are already organized around people. The worked example shows what it adds — the deterministic levels see a balanced two-speaker exchange in the kitchen, while only the interpretive stage records that one person's bid was answered and closed.
Figure 4.
The abstraction hierarchy that turns recorded events into relational evidence. Levels 0 to 4 form a deterministic chain in which each stage is a pure function of the stage below it. Level 1.5 is the single interpretive stage: it reads the speech turns directly from Level 0 rather than the semantic events above them, and rejoins the hierarchy at Level 3, where episodes are already organized around people. The worked example shows what it adds — the deterministic levels see a balanced two-speaker exchange in the kitchen, while only the interpretive stage records that one person's bid was answered and closed.
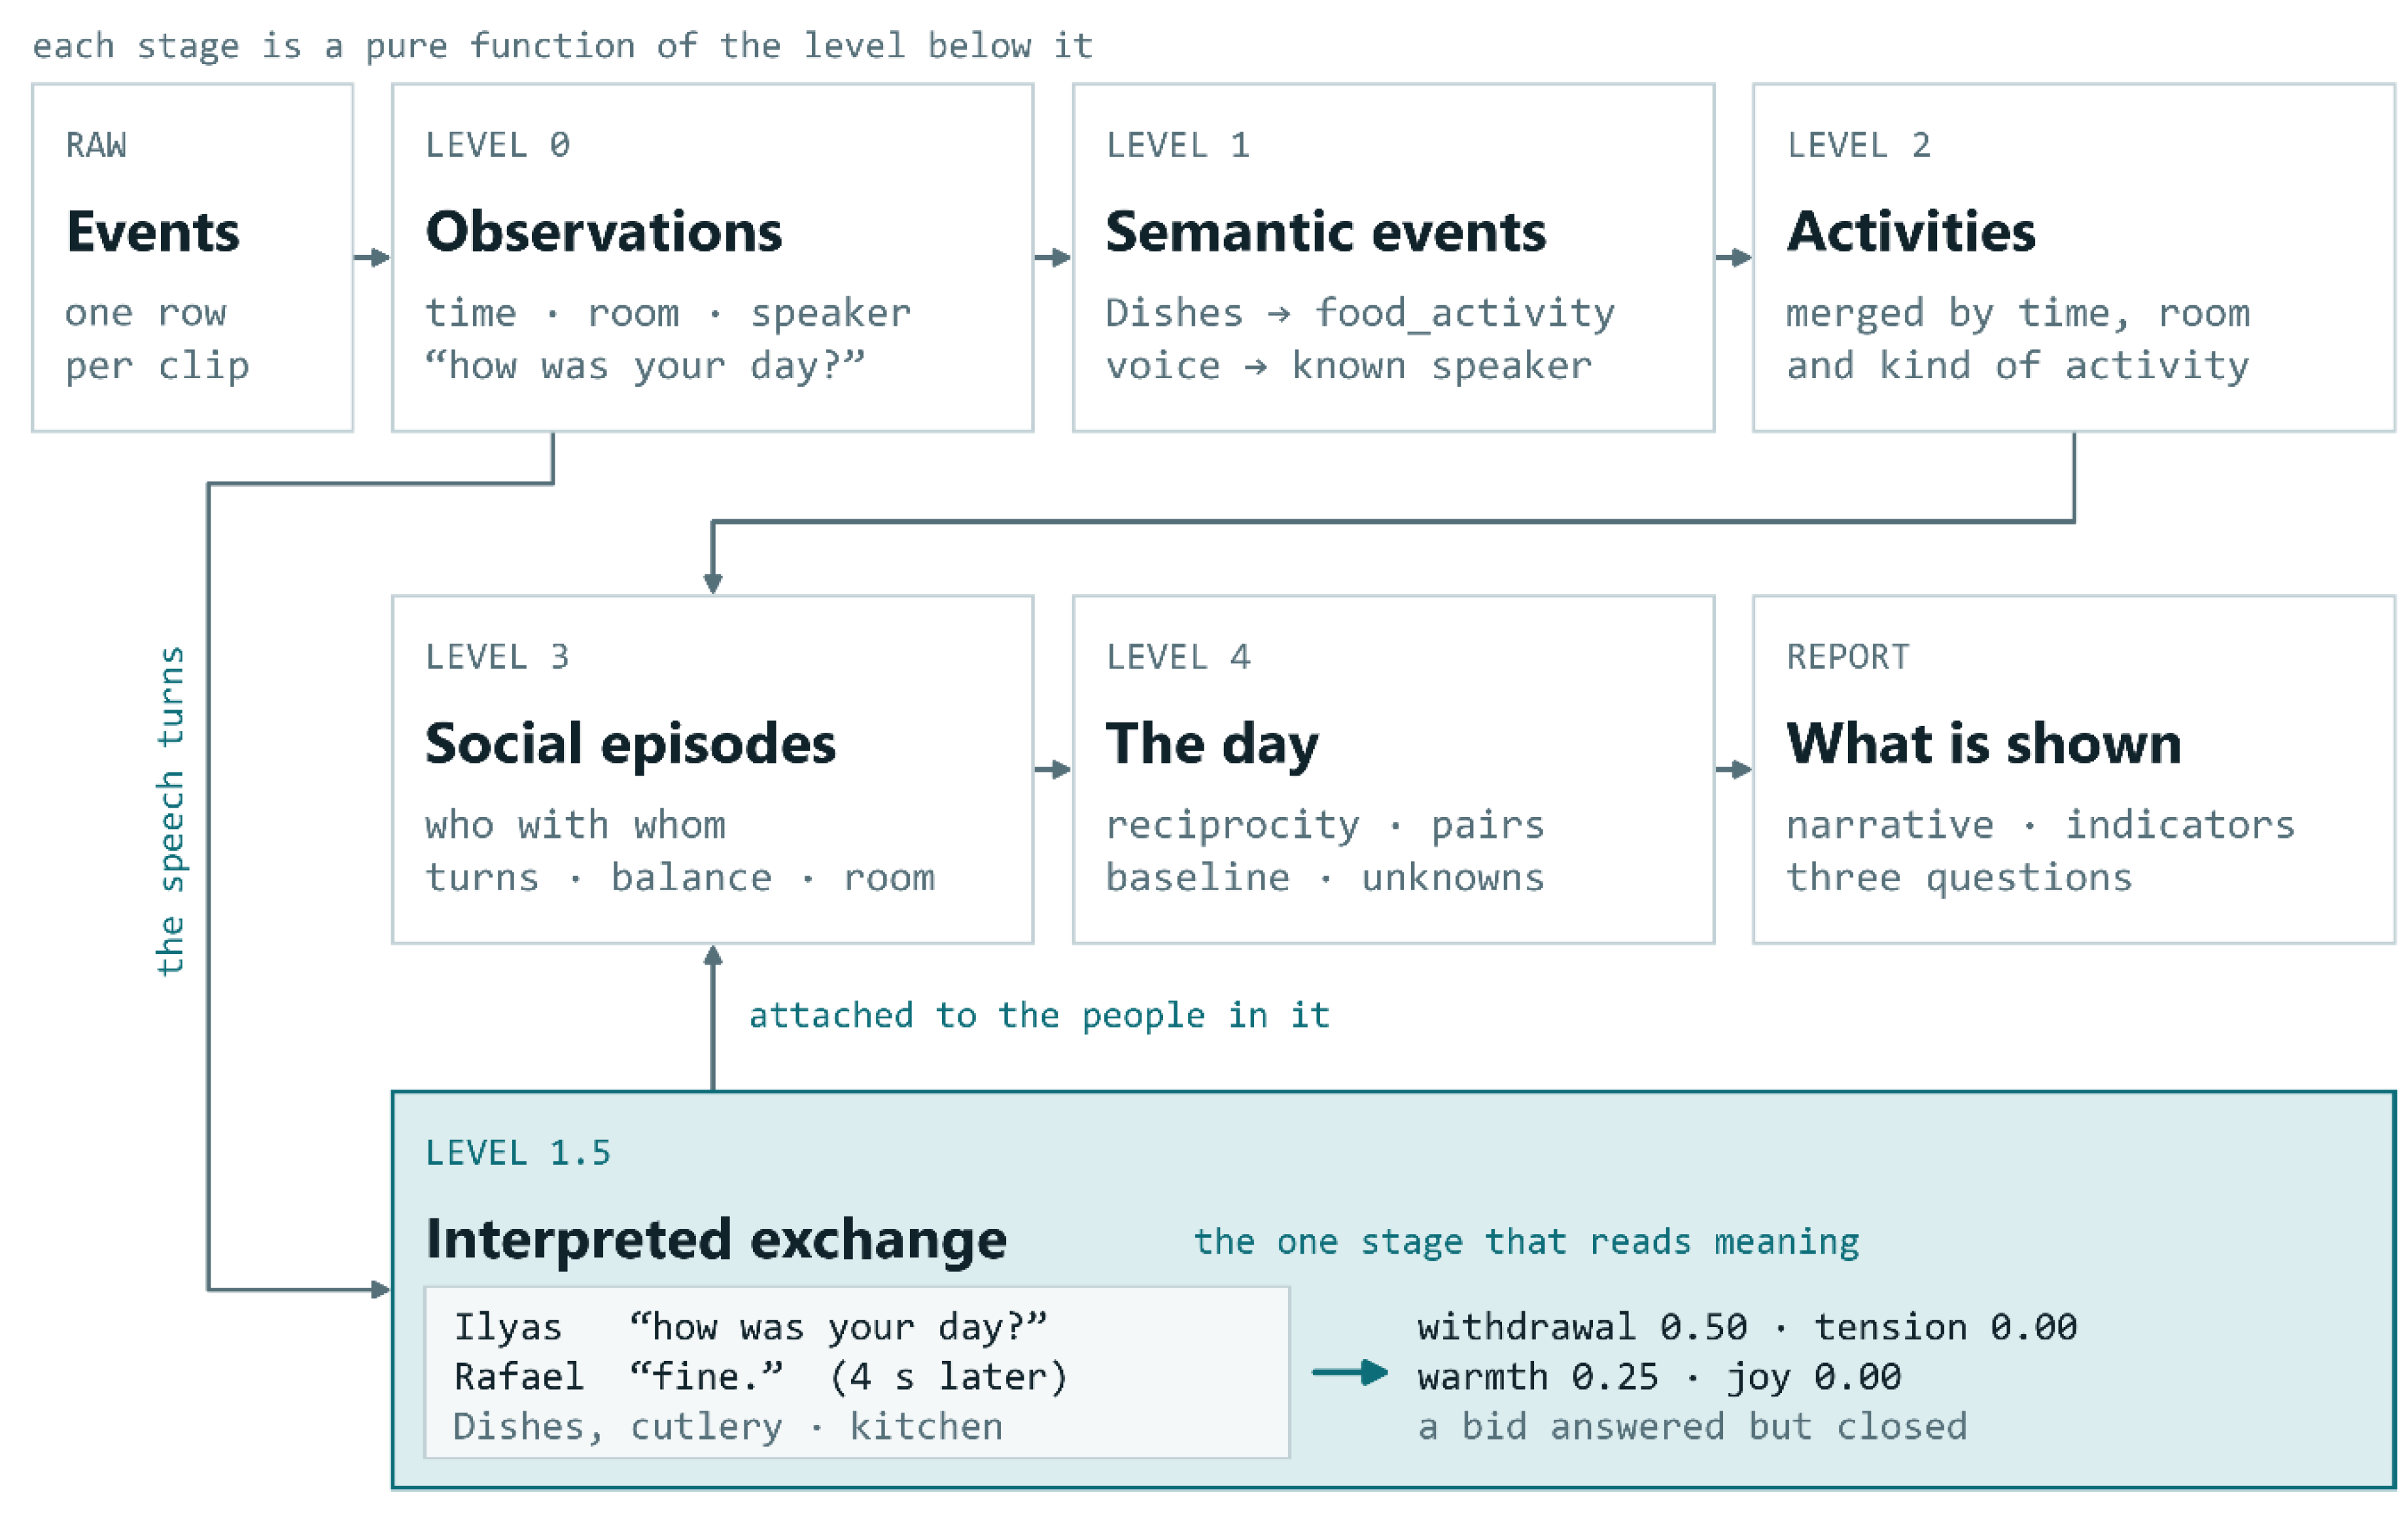
Figure 5.
(a) Family dynamics tracking at the short-time level. Speech activity and discussions activity is monitored. Transcribed text and speaker attribution are clustered in time, and for each cluster Warmth, Joy, Withdrawal and Tension are extracted, (b) Key moments extracted to support with evidence why the system has classified family dynamics like that.
Figure 5.
(a) Family dynamics tracking at the short-time level. Speech activity and discussions activity is monitored. Transcribed text and speaker attribution are clustered in time, and for each cluster Warmth, Joy, Withdrawal and Tension are extracted, (b) Key moments extracted to support with evidence why the system has classified family dynamics like that.
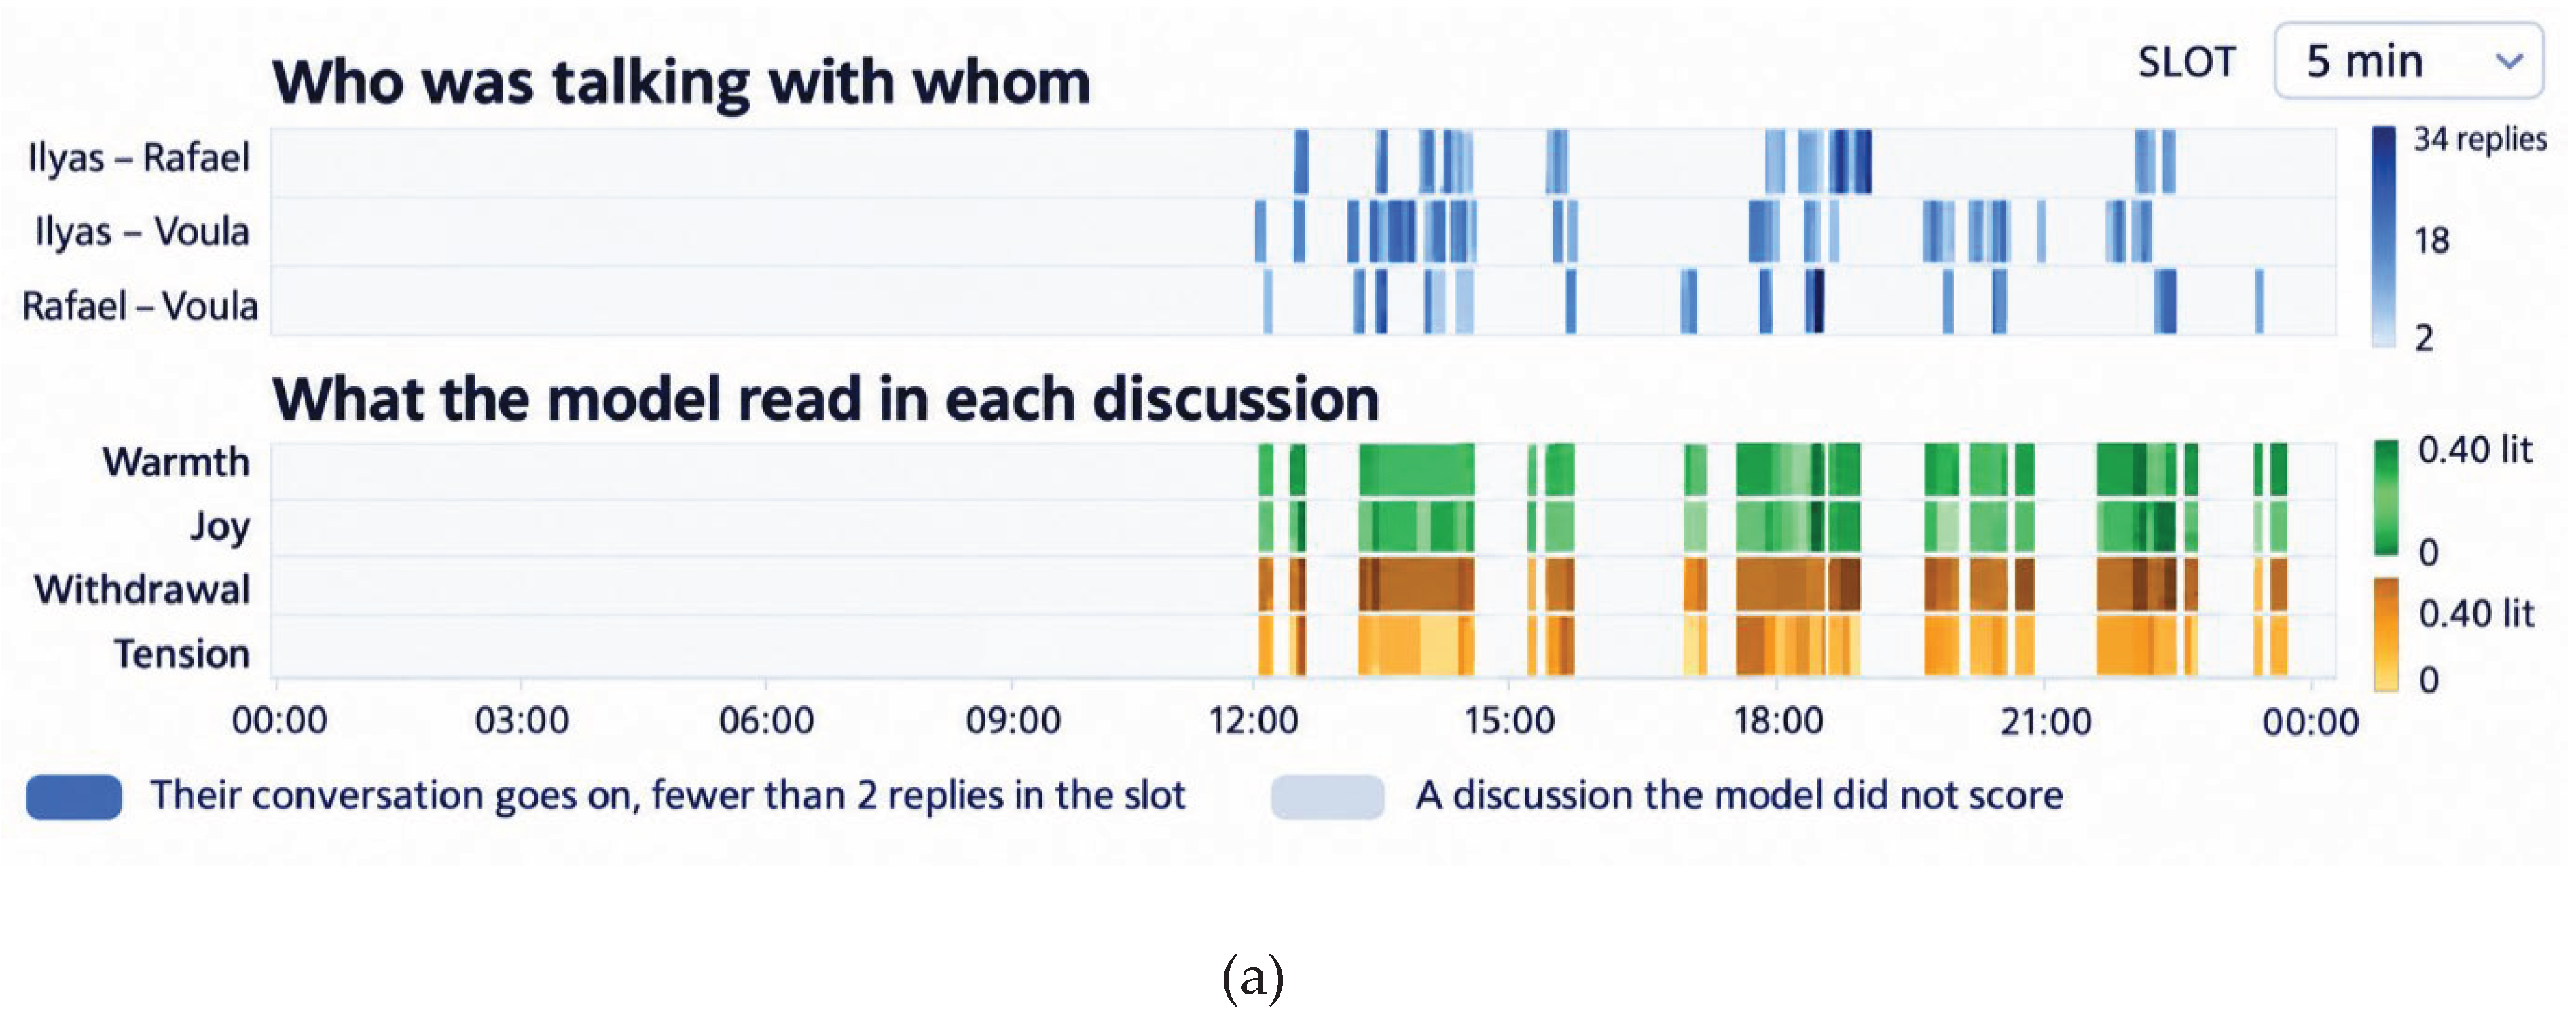
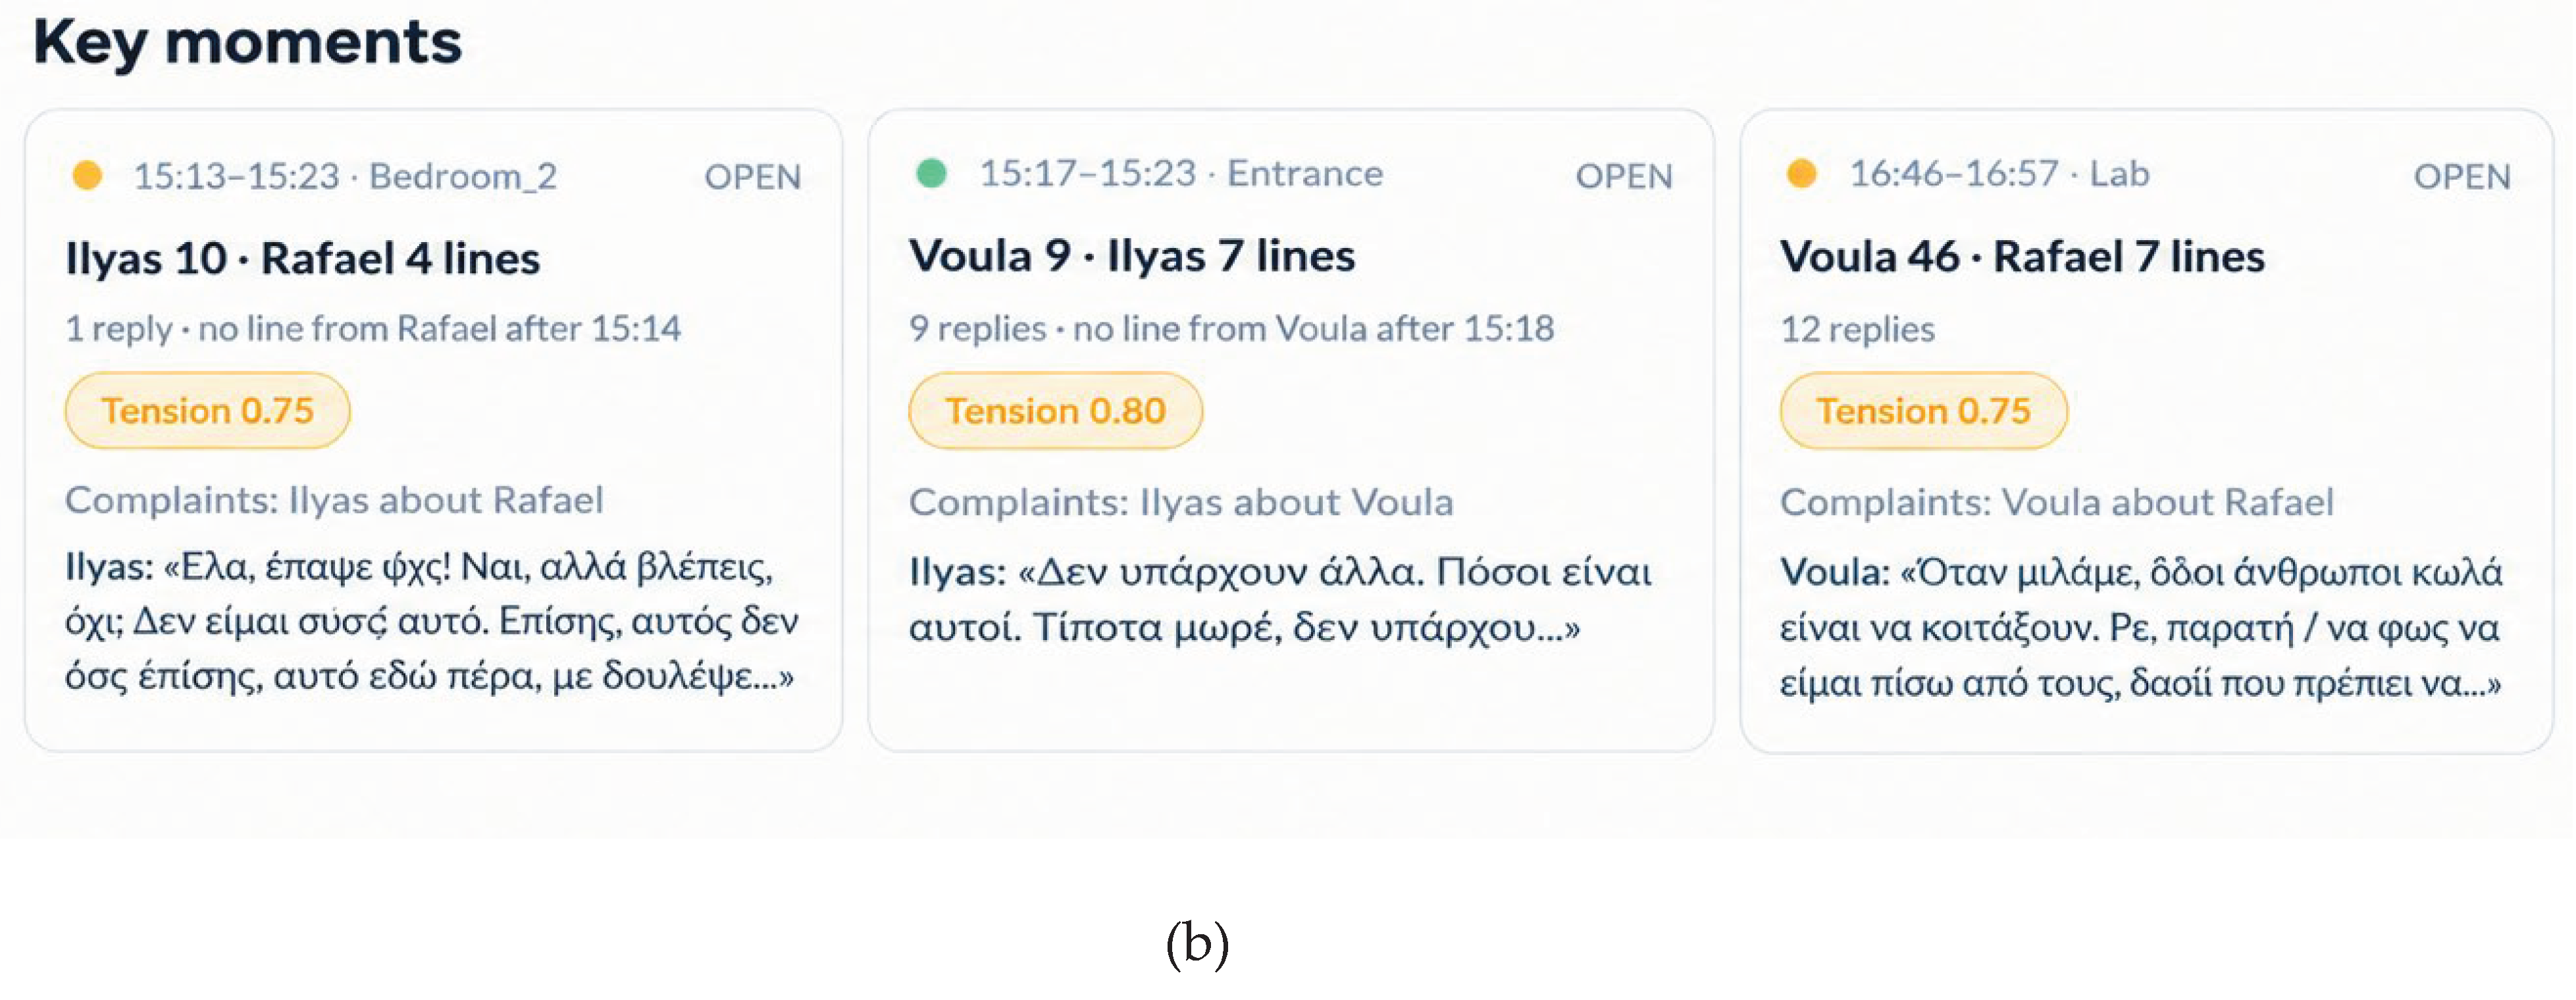
Figure 6.
Overview of the family dynamics evaluation interface. Qualitative household indicators (Warmth, Joy, Withdrawal, and Tension) are visually encoded using a three-tiered color state (amber, gray, green) grounded in empirical system observations. The interface computes an overall family connection index, highlights the top three observation-driven self-reflection prompts, and links to a comprehensive nine-point diagnostic report backed by domestic event data.
Figure 6.
Overview of the family dynamics evaluation interface. Qualitative household indicators (Warmth, Joy, Withdrawal, and Tension) are visually encoded using a three-tiered color state (amber, gray, green) grounded in empirical system observations. The interface computes an overall family connection index, highlights the top three observation-driven self-reflection prompts, and links to a comprehensive nine-point diagnostic report backed by domestic event data.
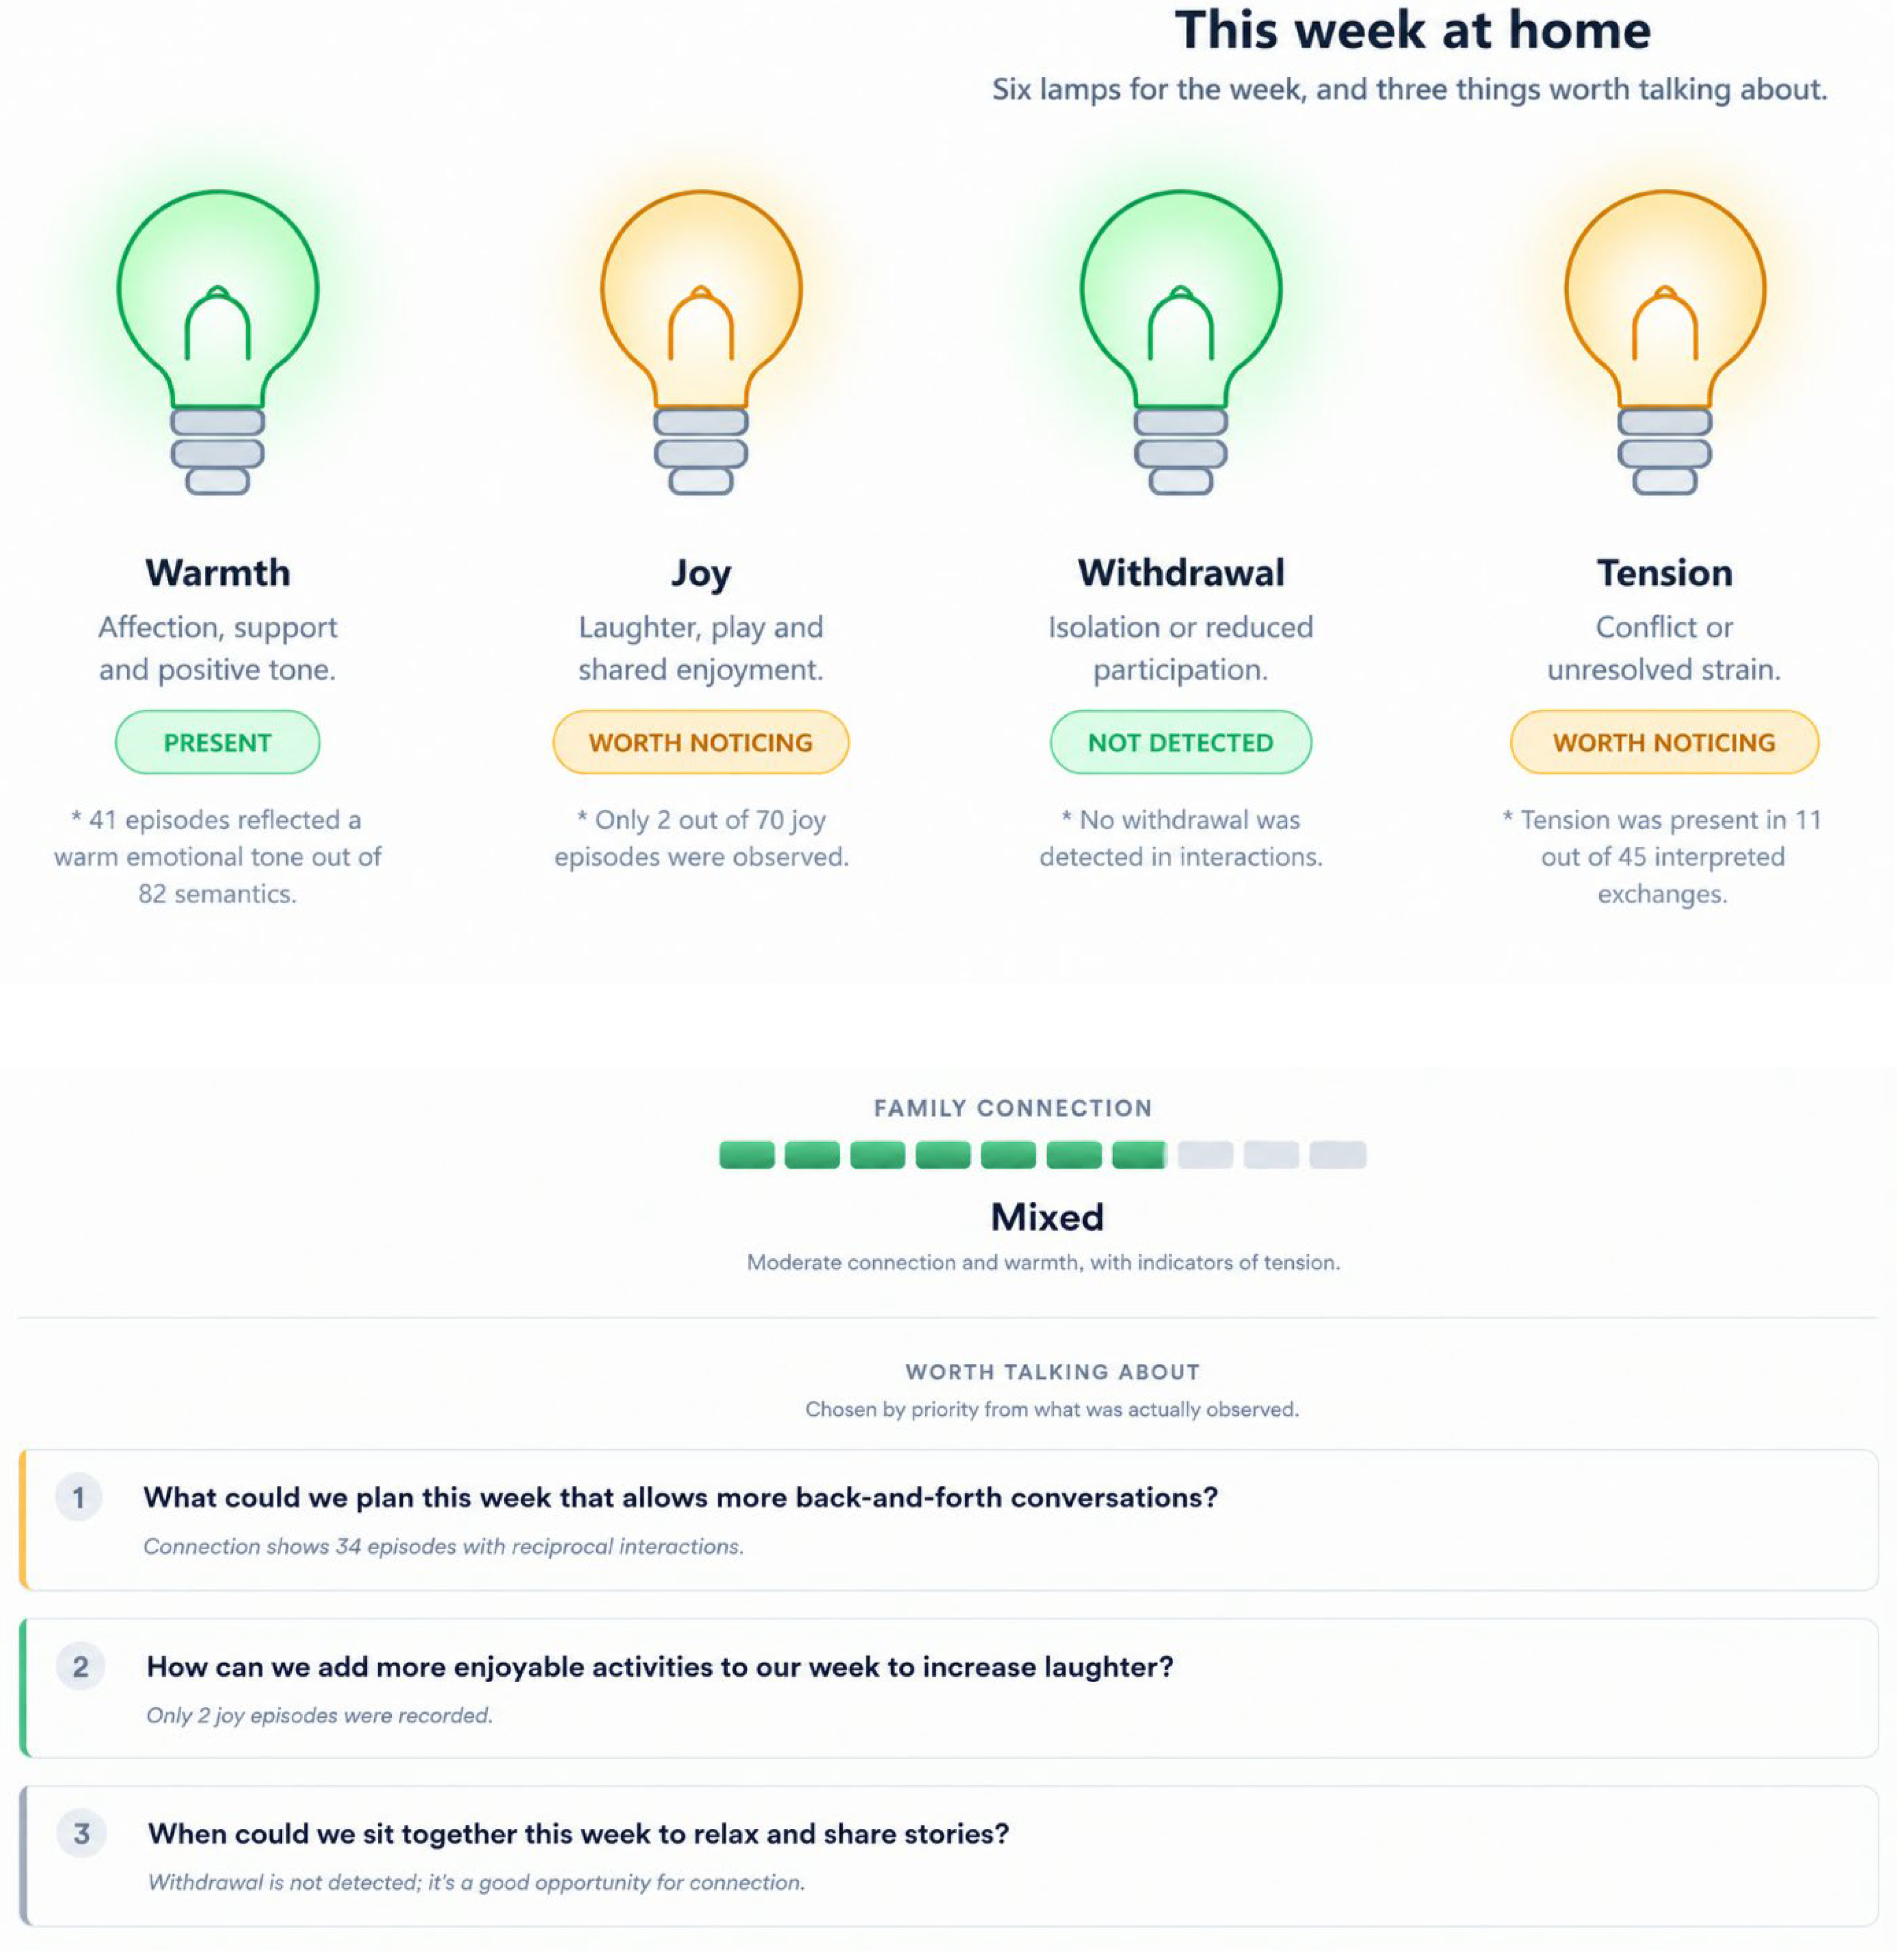
Figure 7.
Forty dialogues are clustered in eight family communication patterns (P1-P8). Scenarios column corresponds to the dialogue index 1-40. The index n stands for the number of dialogues in the corresponding category. The expected signature contains warmth, tension, joy, withdrawal categories with three intensity levels: low, medium, high.
Figure 7.
Forty dialogues are clustered in eight family communication patterns (P1-P8). Scenarios column corresponds to the dialogue index 1-40. The index n stands for the number of dialogues in the corresponding category. The expected signature contains warmth, tension, joy, withdrawal categories with three intensity levels: low, medium, high.
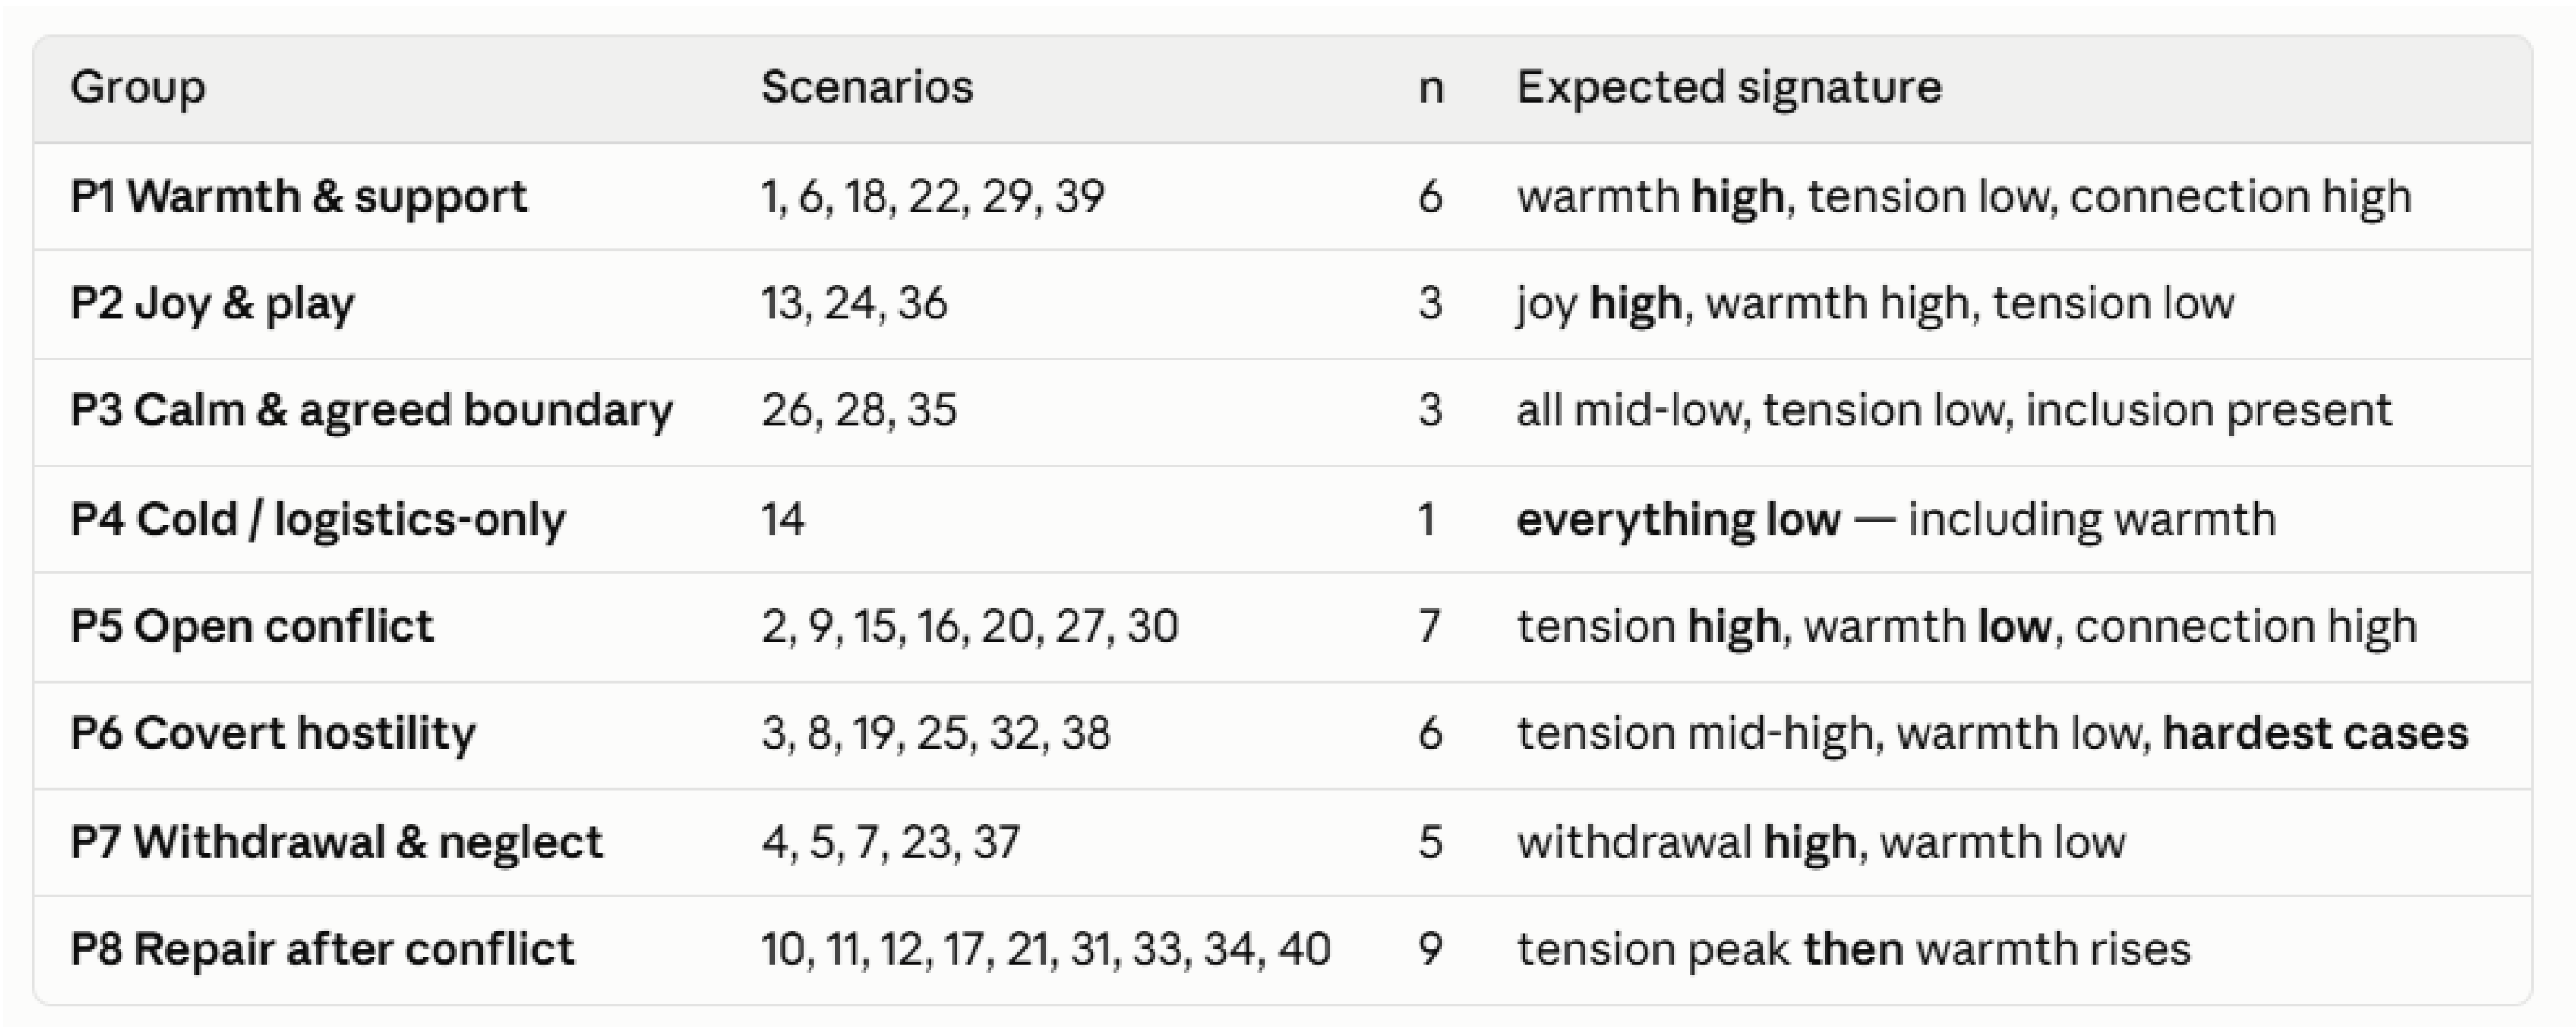
Figure 8.
The 219 scripted lines classified by the set of sentinels that, each scored on its own, delivered a recognisable copy of the line; each bar is divided by speaker. Lines delivered by exactly one sentinel dominate, as expected when the speakers move between rooms; the last bar holds the lines that no sentinel delivered on its own.
Figure 8.
The 219 scripted lines classified by the set of sentinels that, each scored on its own, delivered a recognisable copy of the line; each bar is divided by speaker. Lines delivered by exactly one sentinel dominate, as expected when the speakers move between rooms; the last bar holds the lines that no sentinel delivered on its own.
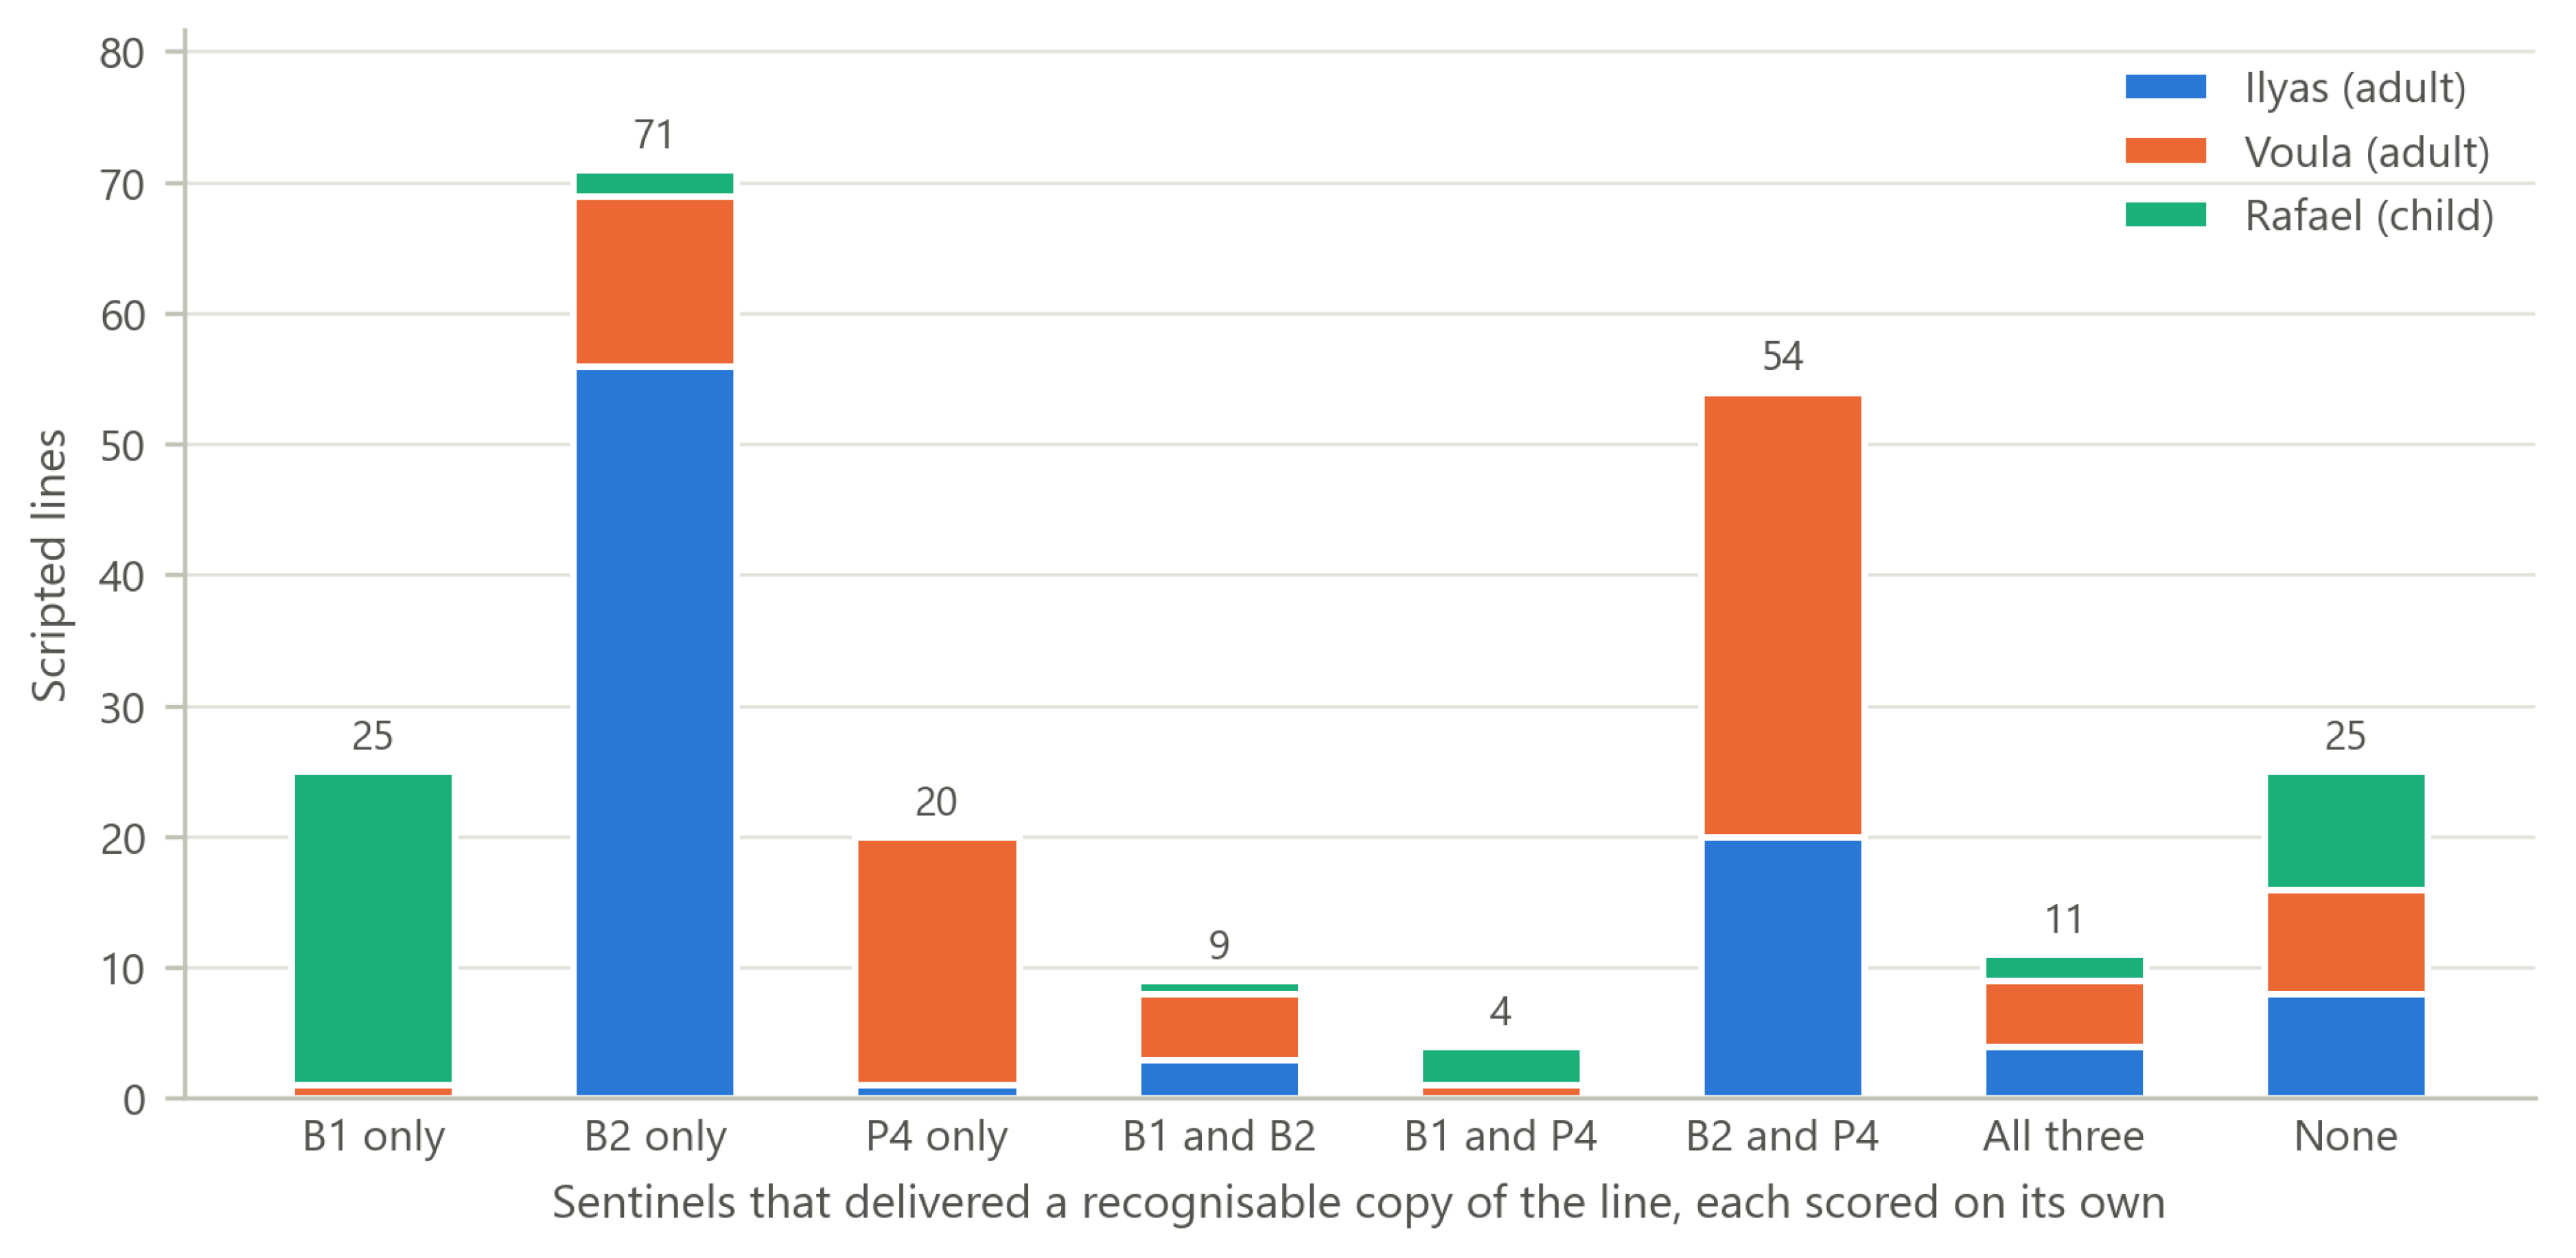
Figure 9.
Speaker identification on the recognized lines with the three sentinels together. Cell values are counts; shading gives the share of the row.
Figure 9.
Speaker identification on the recognized lines with the three sentinels together. Cell values are counts; shading gives the share of the row.
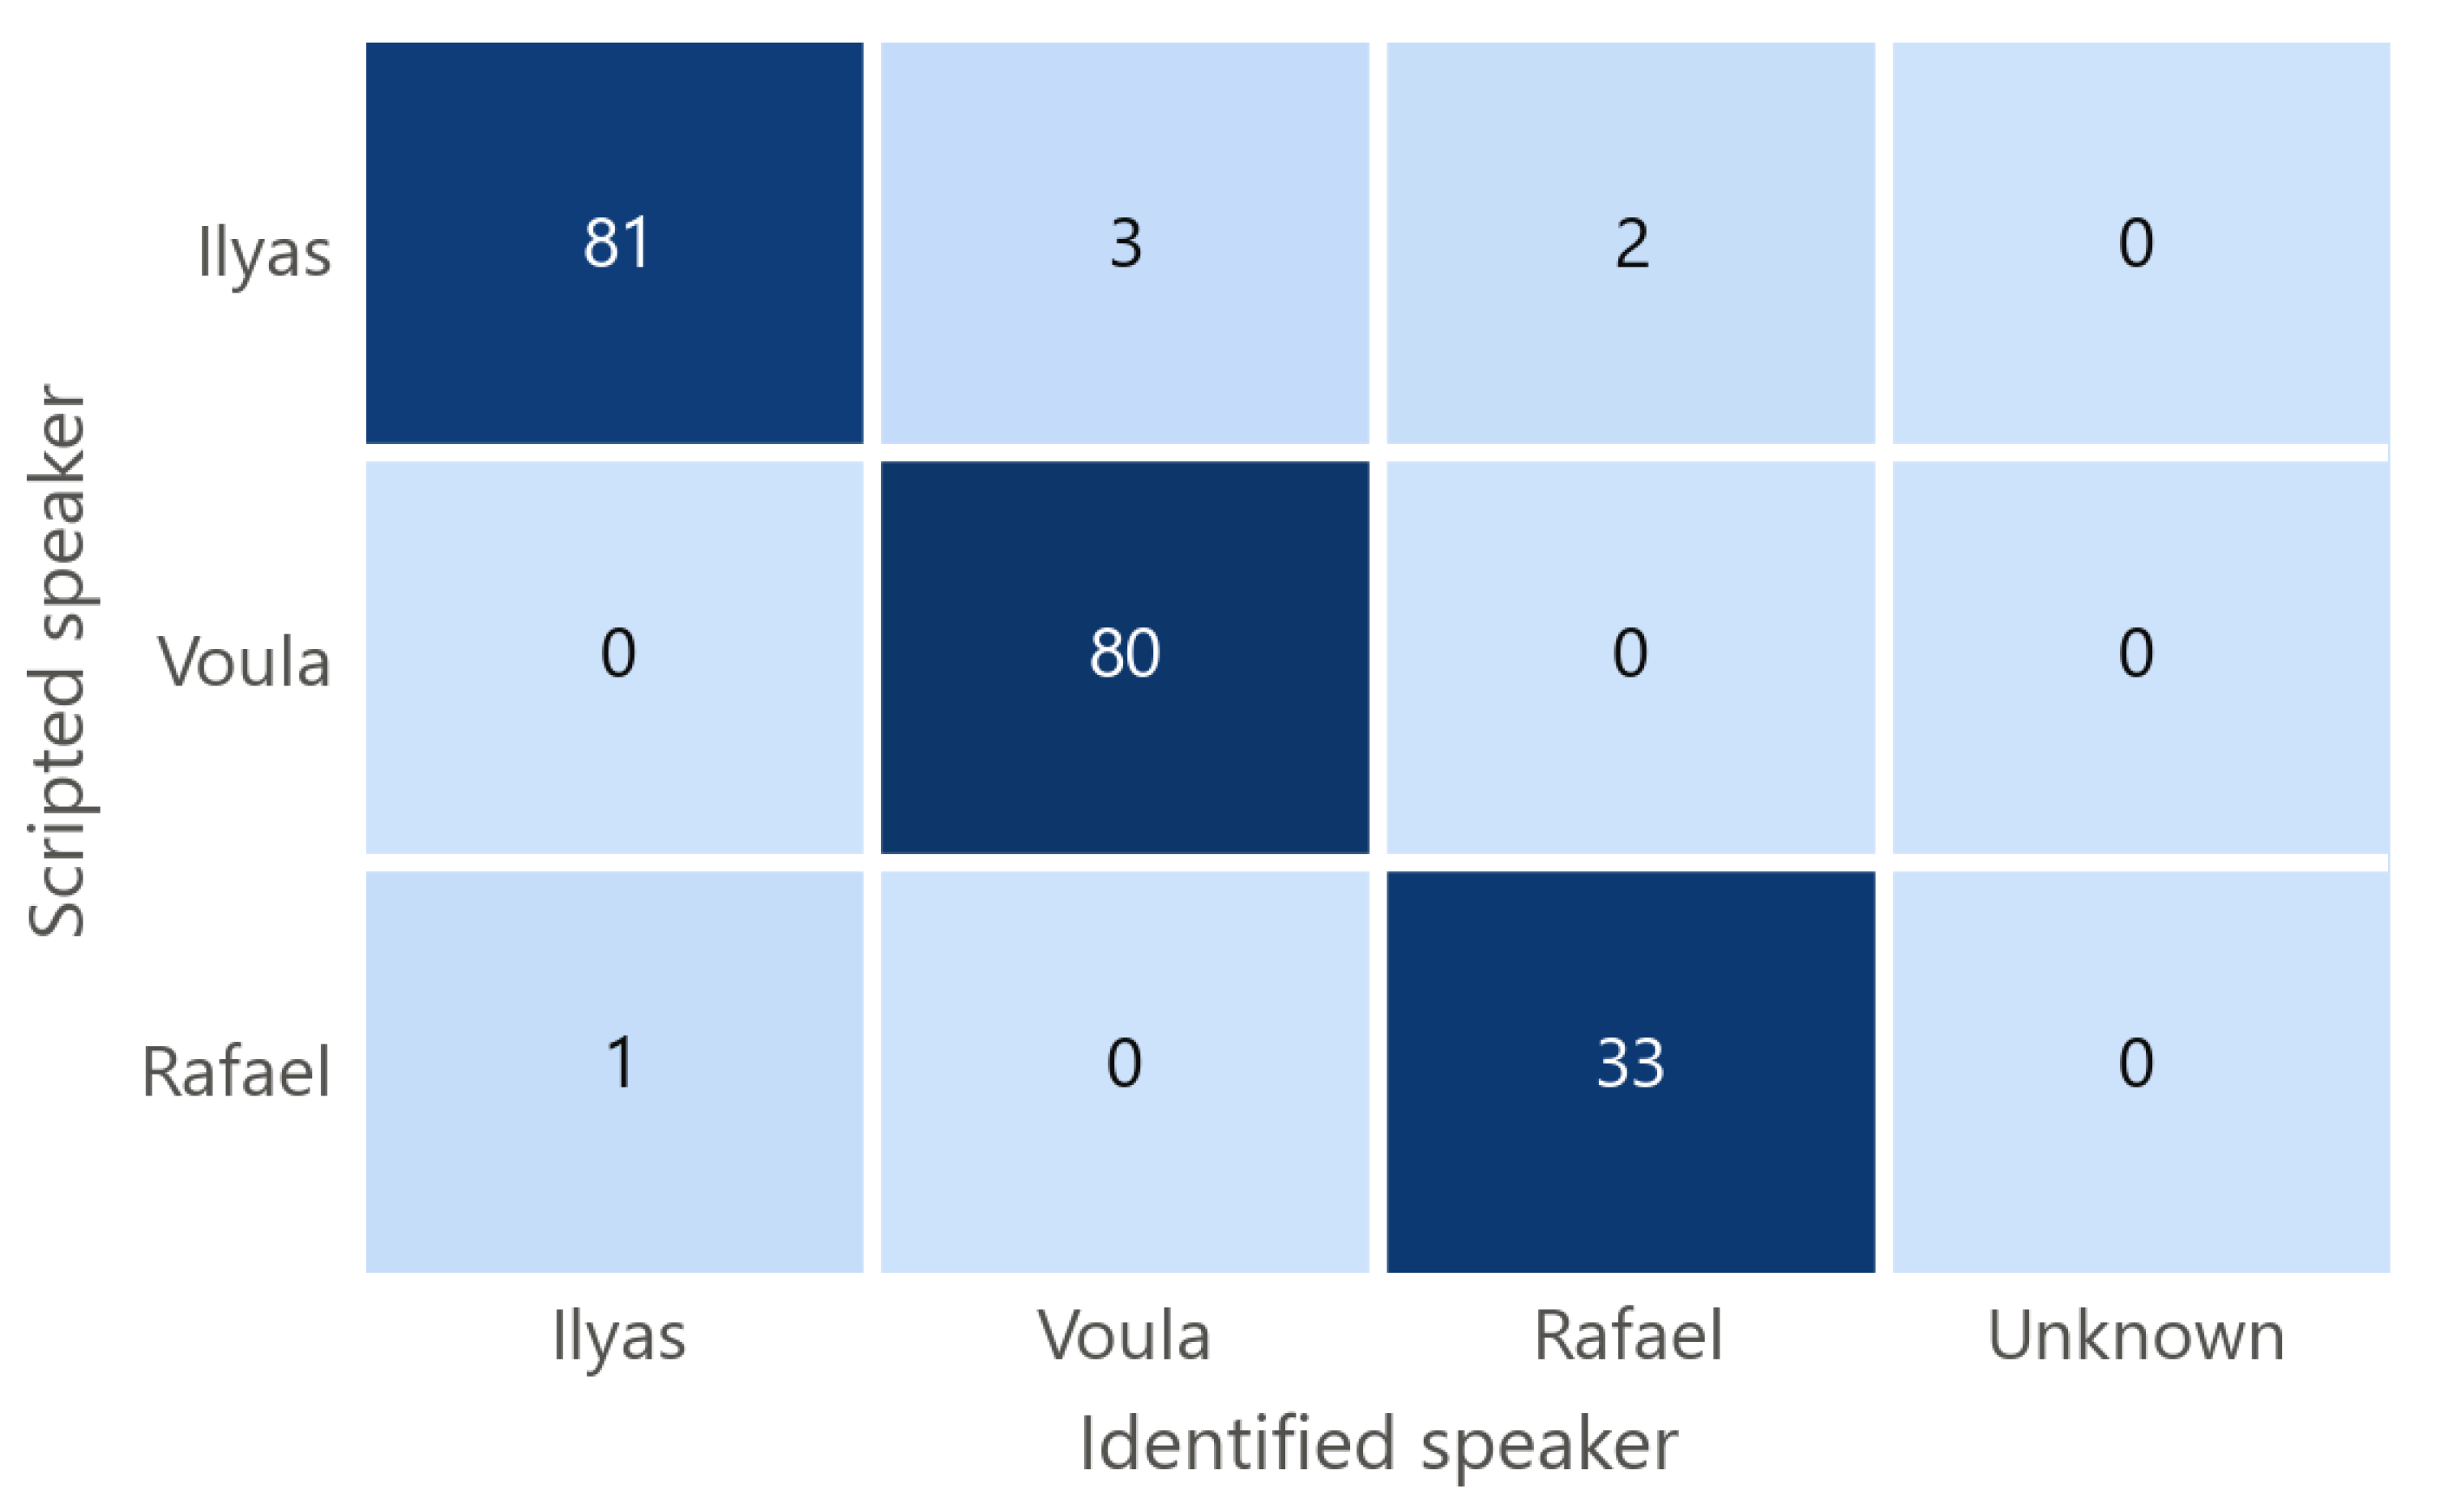
Figure 10.
Relational dimensions read from the recording against the same dimensions read from the original text, per take (means of three runs each). Marker area is proportional to the number of takes at a position; the diagonal marks identity and the shaded band a difference of at most 0.25.
Figure 10.
Relational dimensions read from the recording against the same dimensions read from the original text, per take (means of three runs each). Marker area is proportional to the number of takes at a position; the diagonal marks identity and the shaded band a difference of at most 0.25.
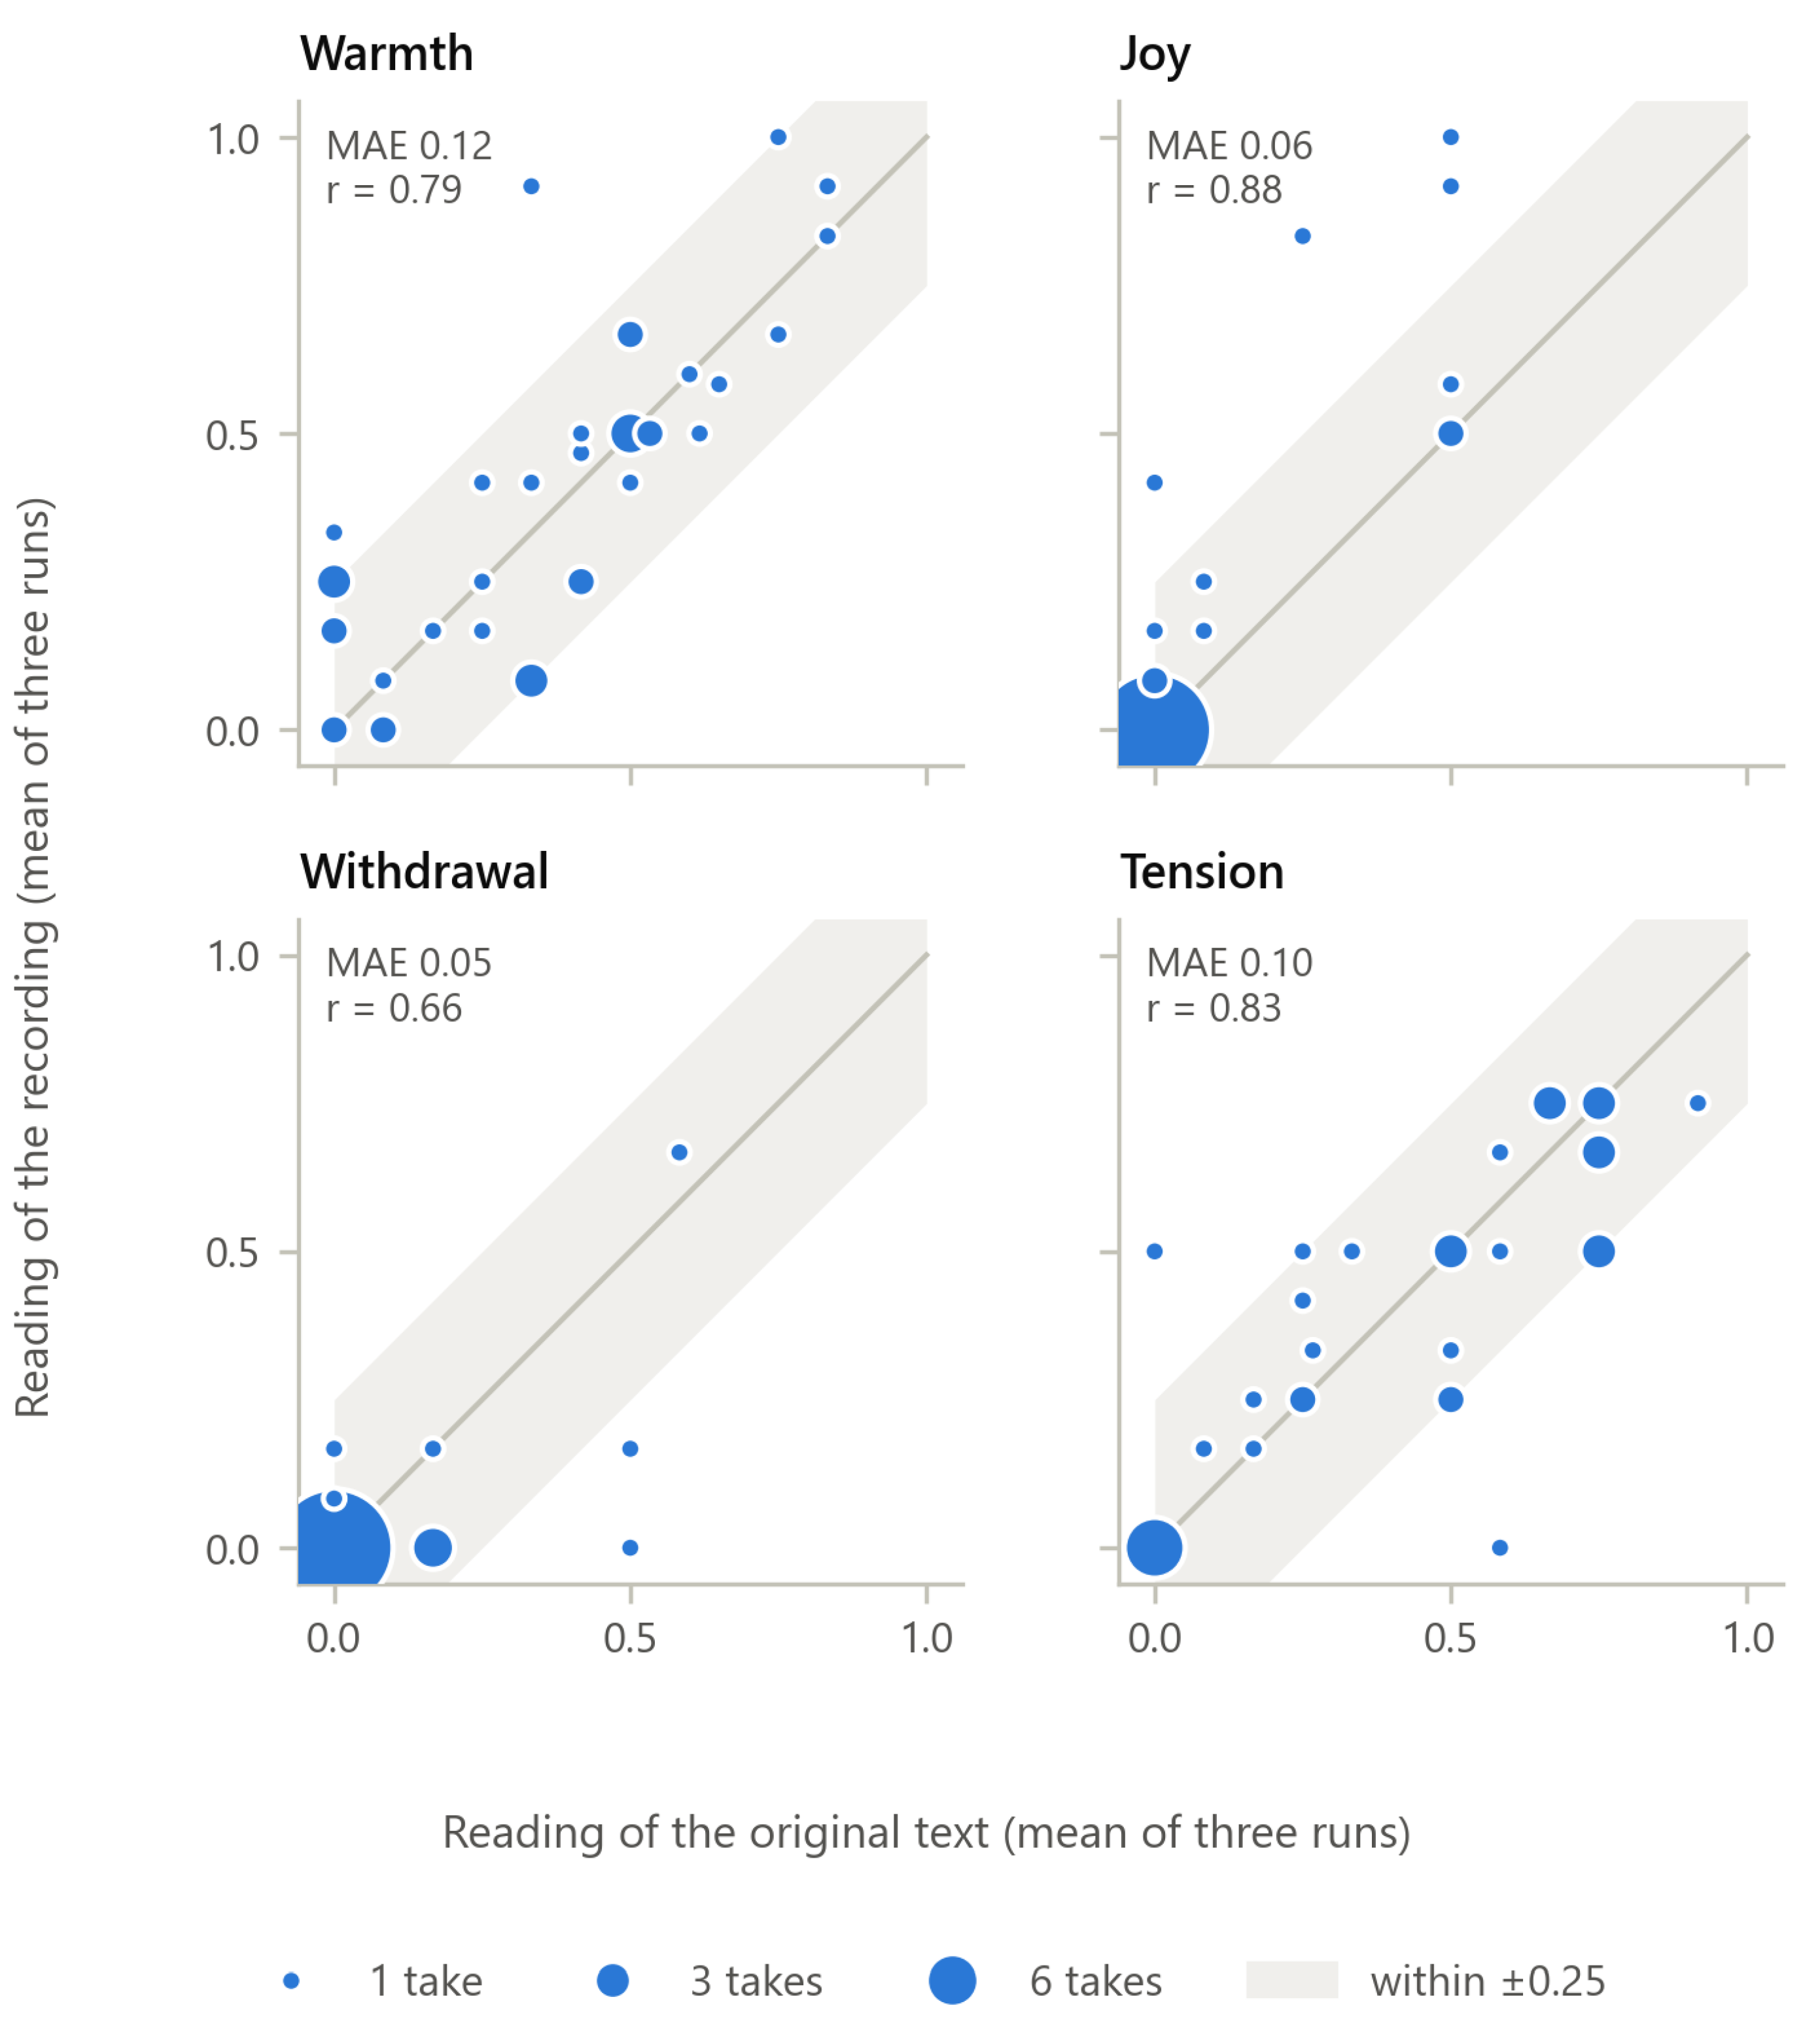
Figure 11.
Mean absolute difference between two readings of the same original text, between two readings of the same recording, and between a reading of the recording and a reading of the original text paired by run. The first two bars give the run-to-run variability of the interpretation layer, against which the third can be judged; the values are listed in Table 7 and Table 8.
Figure 11.
Mean absolute difference between two readings of the same original text, between two readings of the same recording, and between a reading of the recording and a reading of the original text paired by run. The first two bars give the run-to-run variability of the interpretation layer, against which the third can be judged; the values are listed in Table 7 and Table 8.
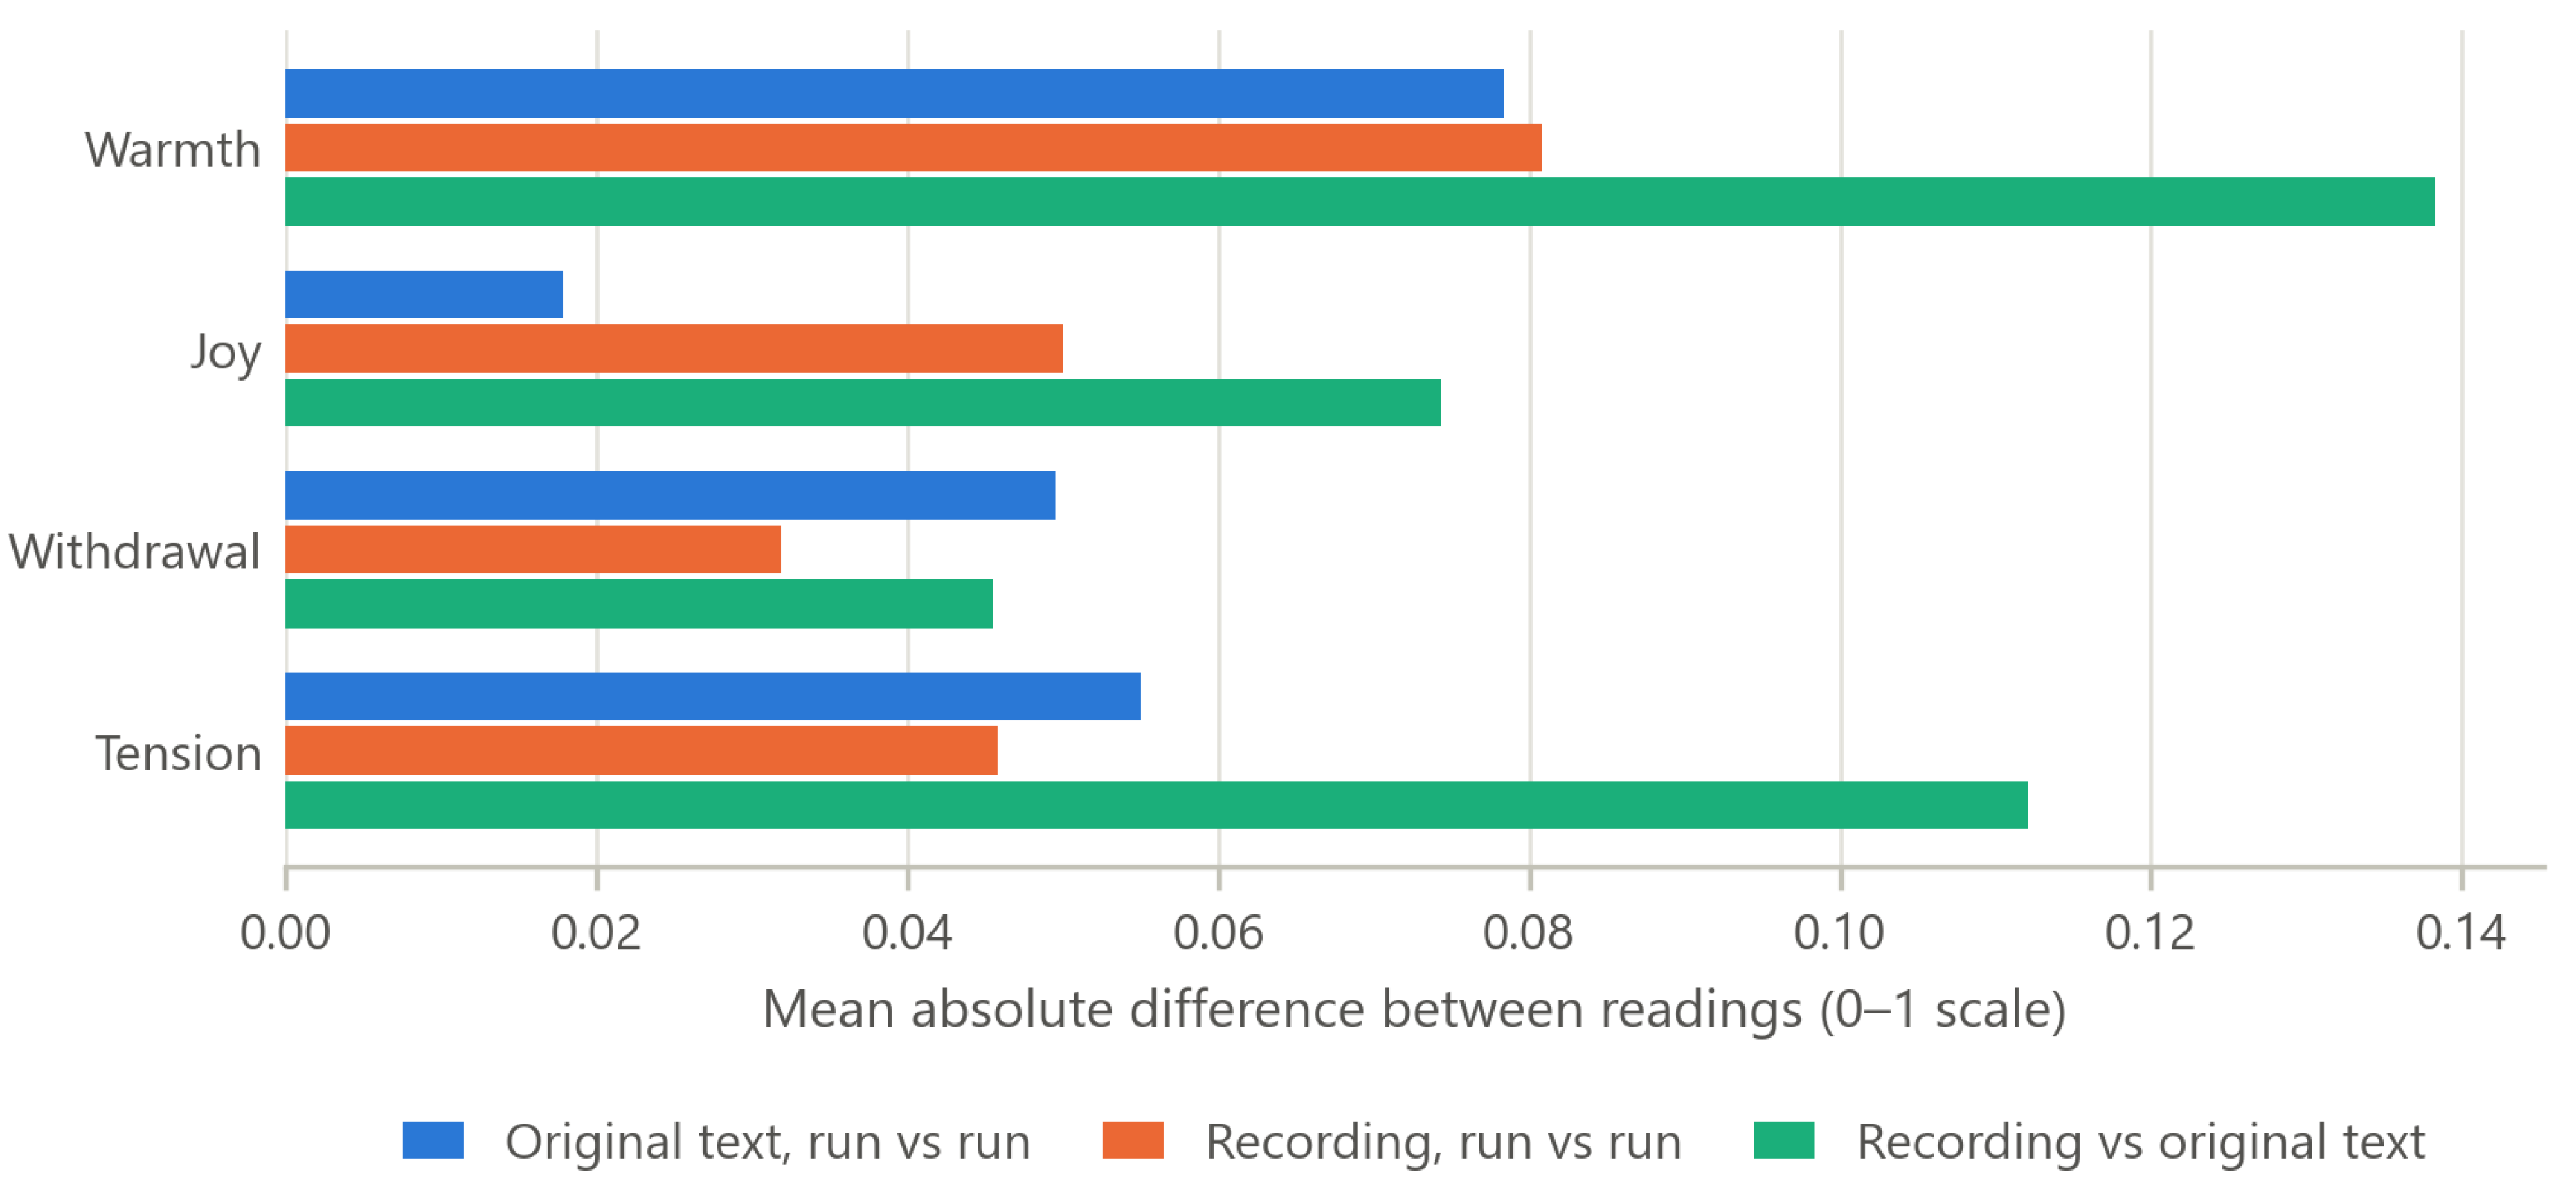
Figure 12.
Mean of each relational dimension in each design group, read (a) from the original text and (b) from the recordings (per-take means over three runs; n is the number of takes in the group).
Figure 12.
Mean of each relational dimension in each design group, read (a) from the original text and (b) from the recordings (per-take means over three runs; n is the number of takes in the group).
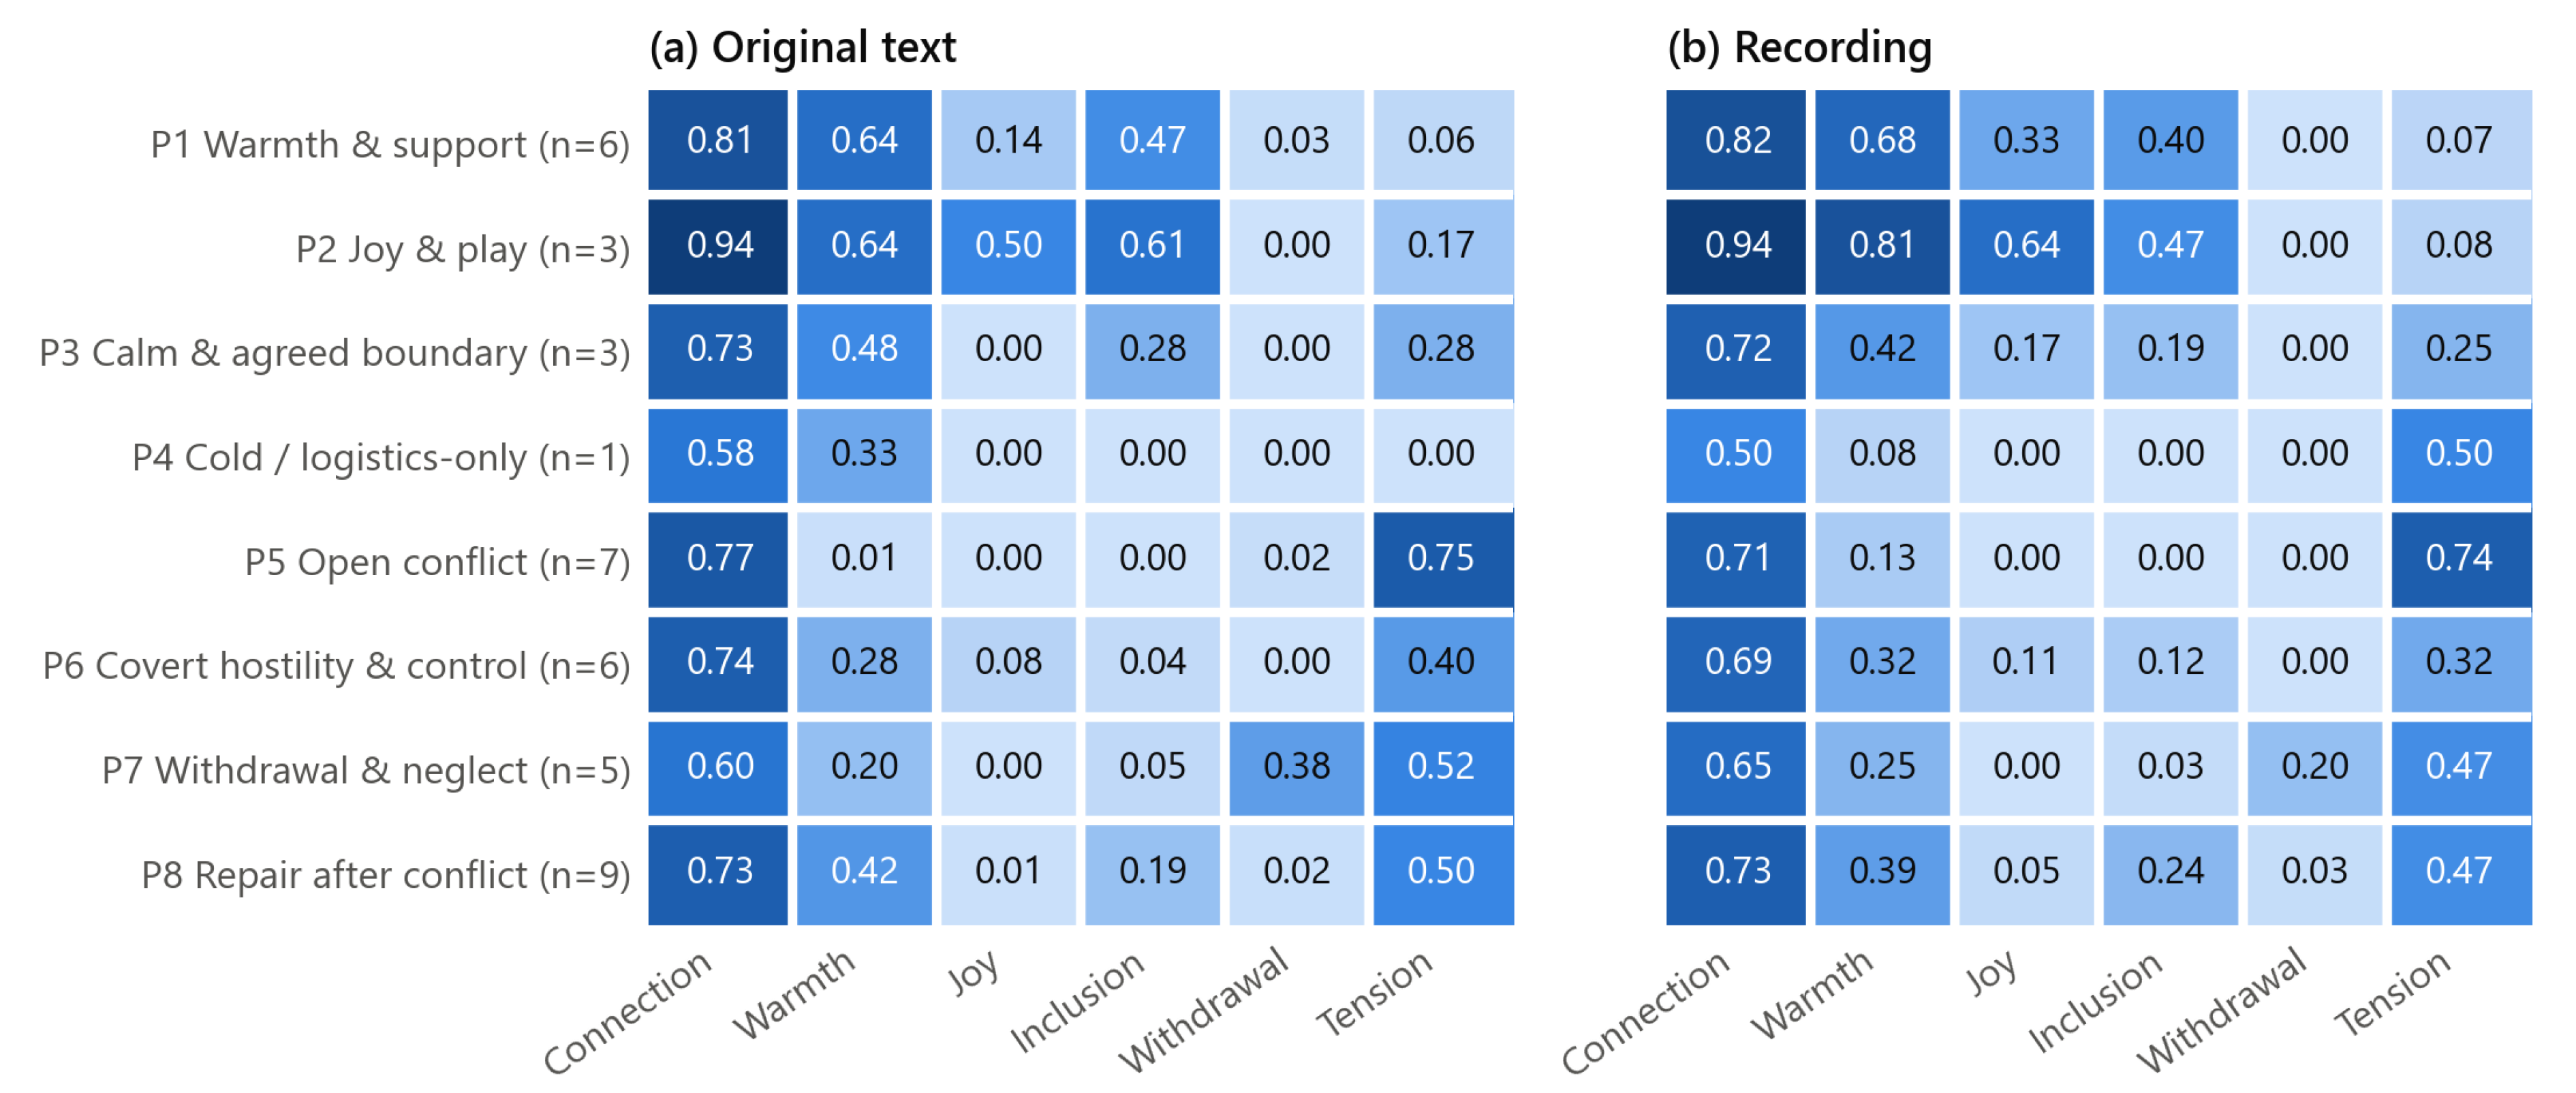
Figure 13.
The ten pre-specified orderings between design groups: difference between the group means with its 95% bootstrap interval, from the original text and from the recordings. Positive values lie in the expected direction.
Figure 13.
The ten pre-specified orderings between design groups: difference between the group means with its 95% bootstrap interval, from the original text and from the recordings. Positive values lie in the expected direction.
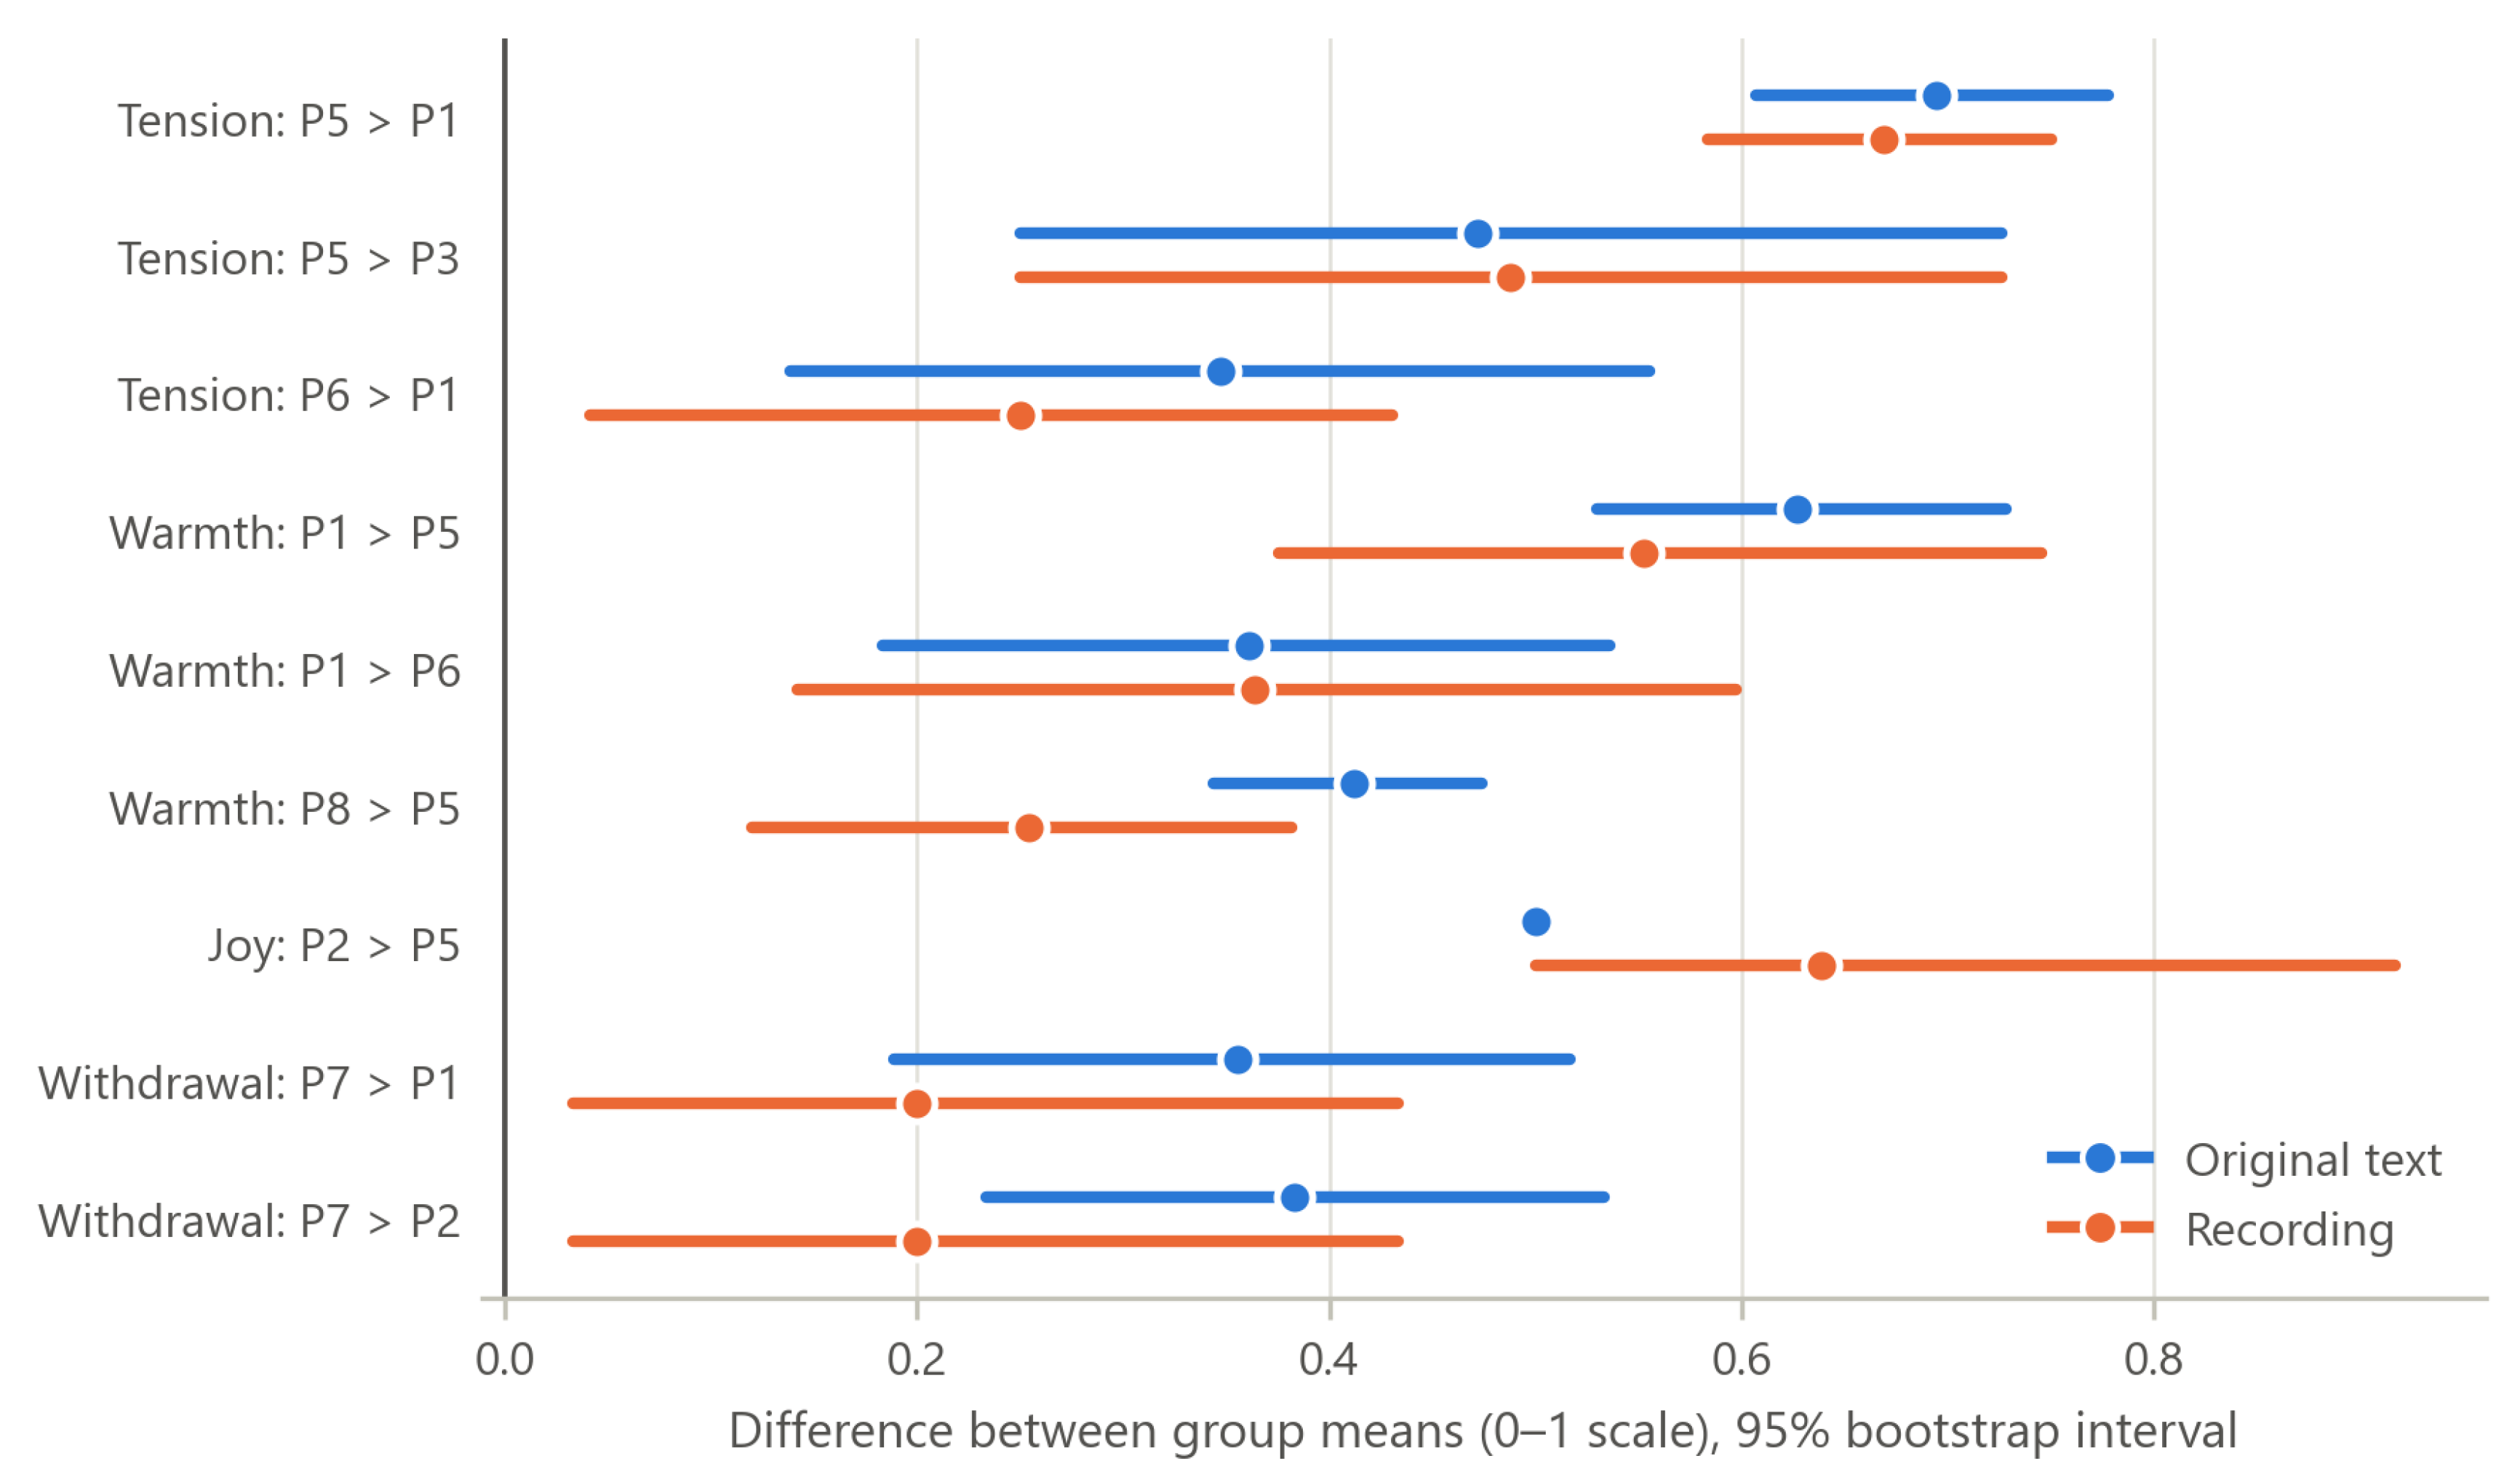
Figure 14.
Leave-one-out nearest-centroid assignment of each take to a design group, from (a) the original text and (b) the recordings. Rows are the design groups and columns the assigned groups; cell values are numbers of takes and shading gives the share of the row. The single P4 take cannot be assigned to its own group under leave-one-out.
Figure 14.
Leave-one-out nearest-centroid assignment of each take to a design group, from (a) the original text and (b) the recordings. Rows are the design groups and columns the assigned groups; cell values are numbers of takes and shading gives the share of the row. The single P4 take cannot be assigned to its own group under leave-one-out.
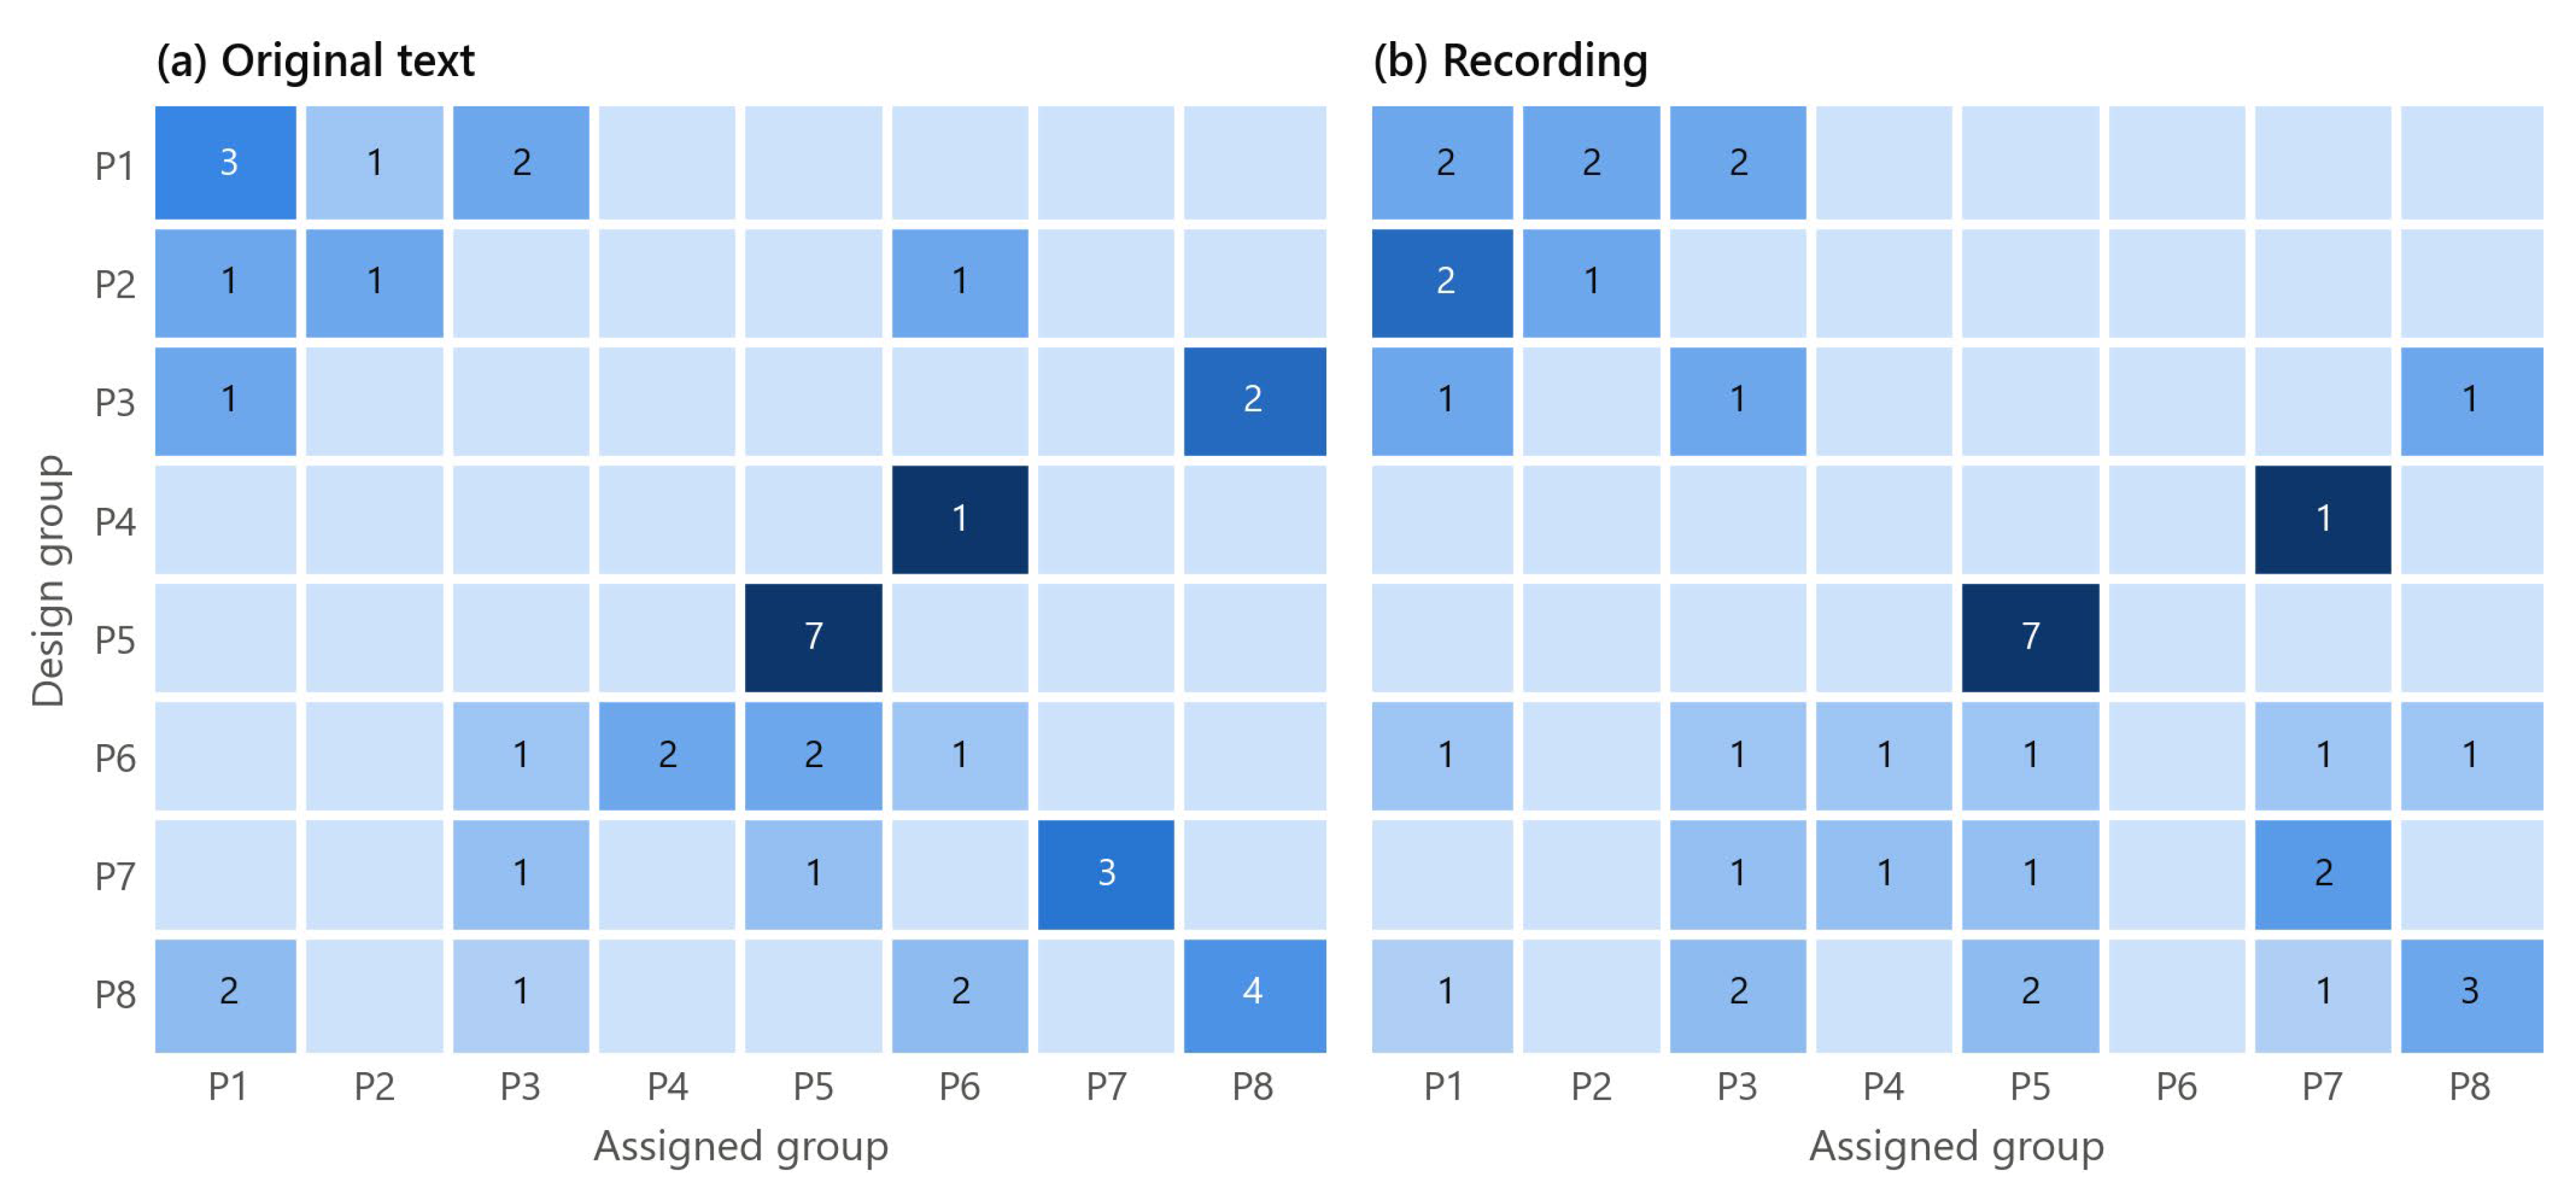
Figure 15.
Word error rate of each take against the mean absolute difference between the reading of its recording and the reading of its original text over the six relational dimensions. The three takes with the largest differences are labelled.
Figure 15.
Word error rate of each take against the mean absolute difference between the reading of its recording and the reading of its original text over the six relational dimensions. The three takes with the largest differences are labelled.
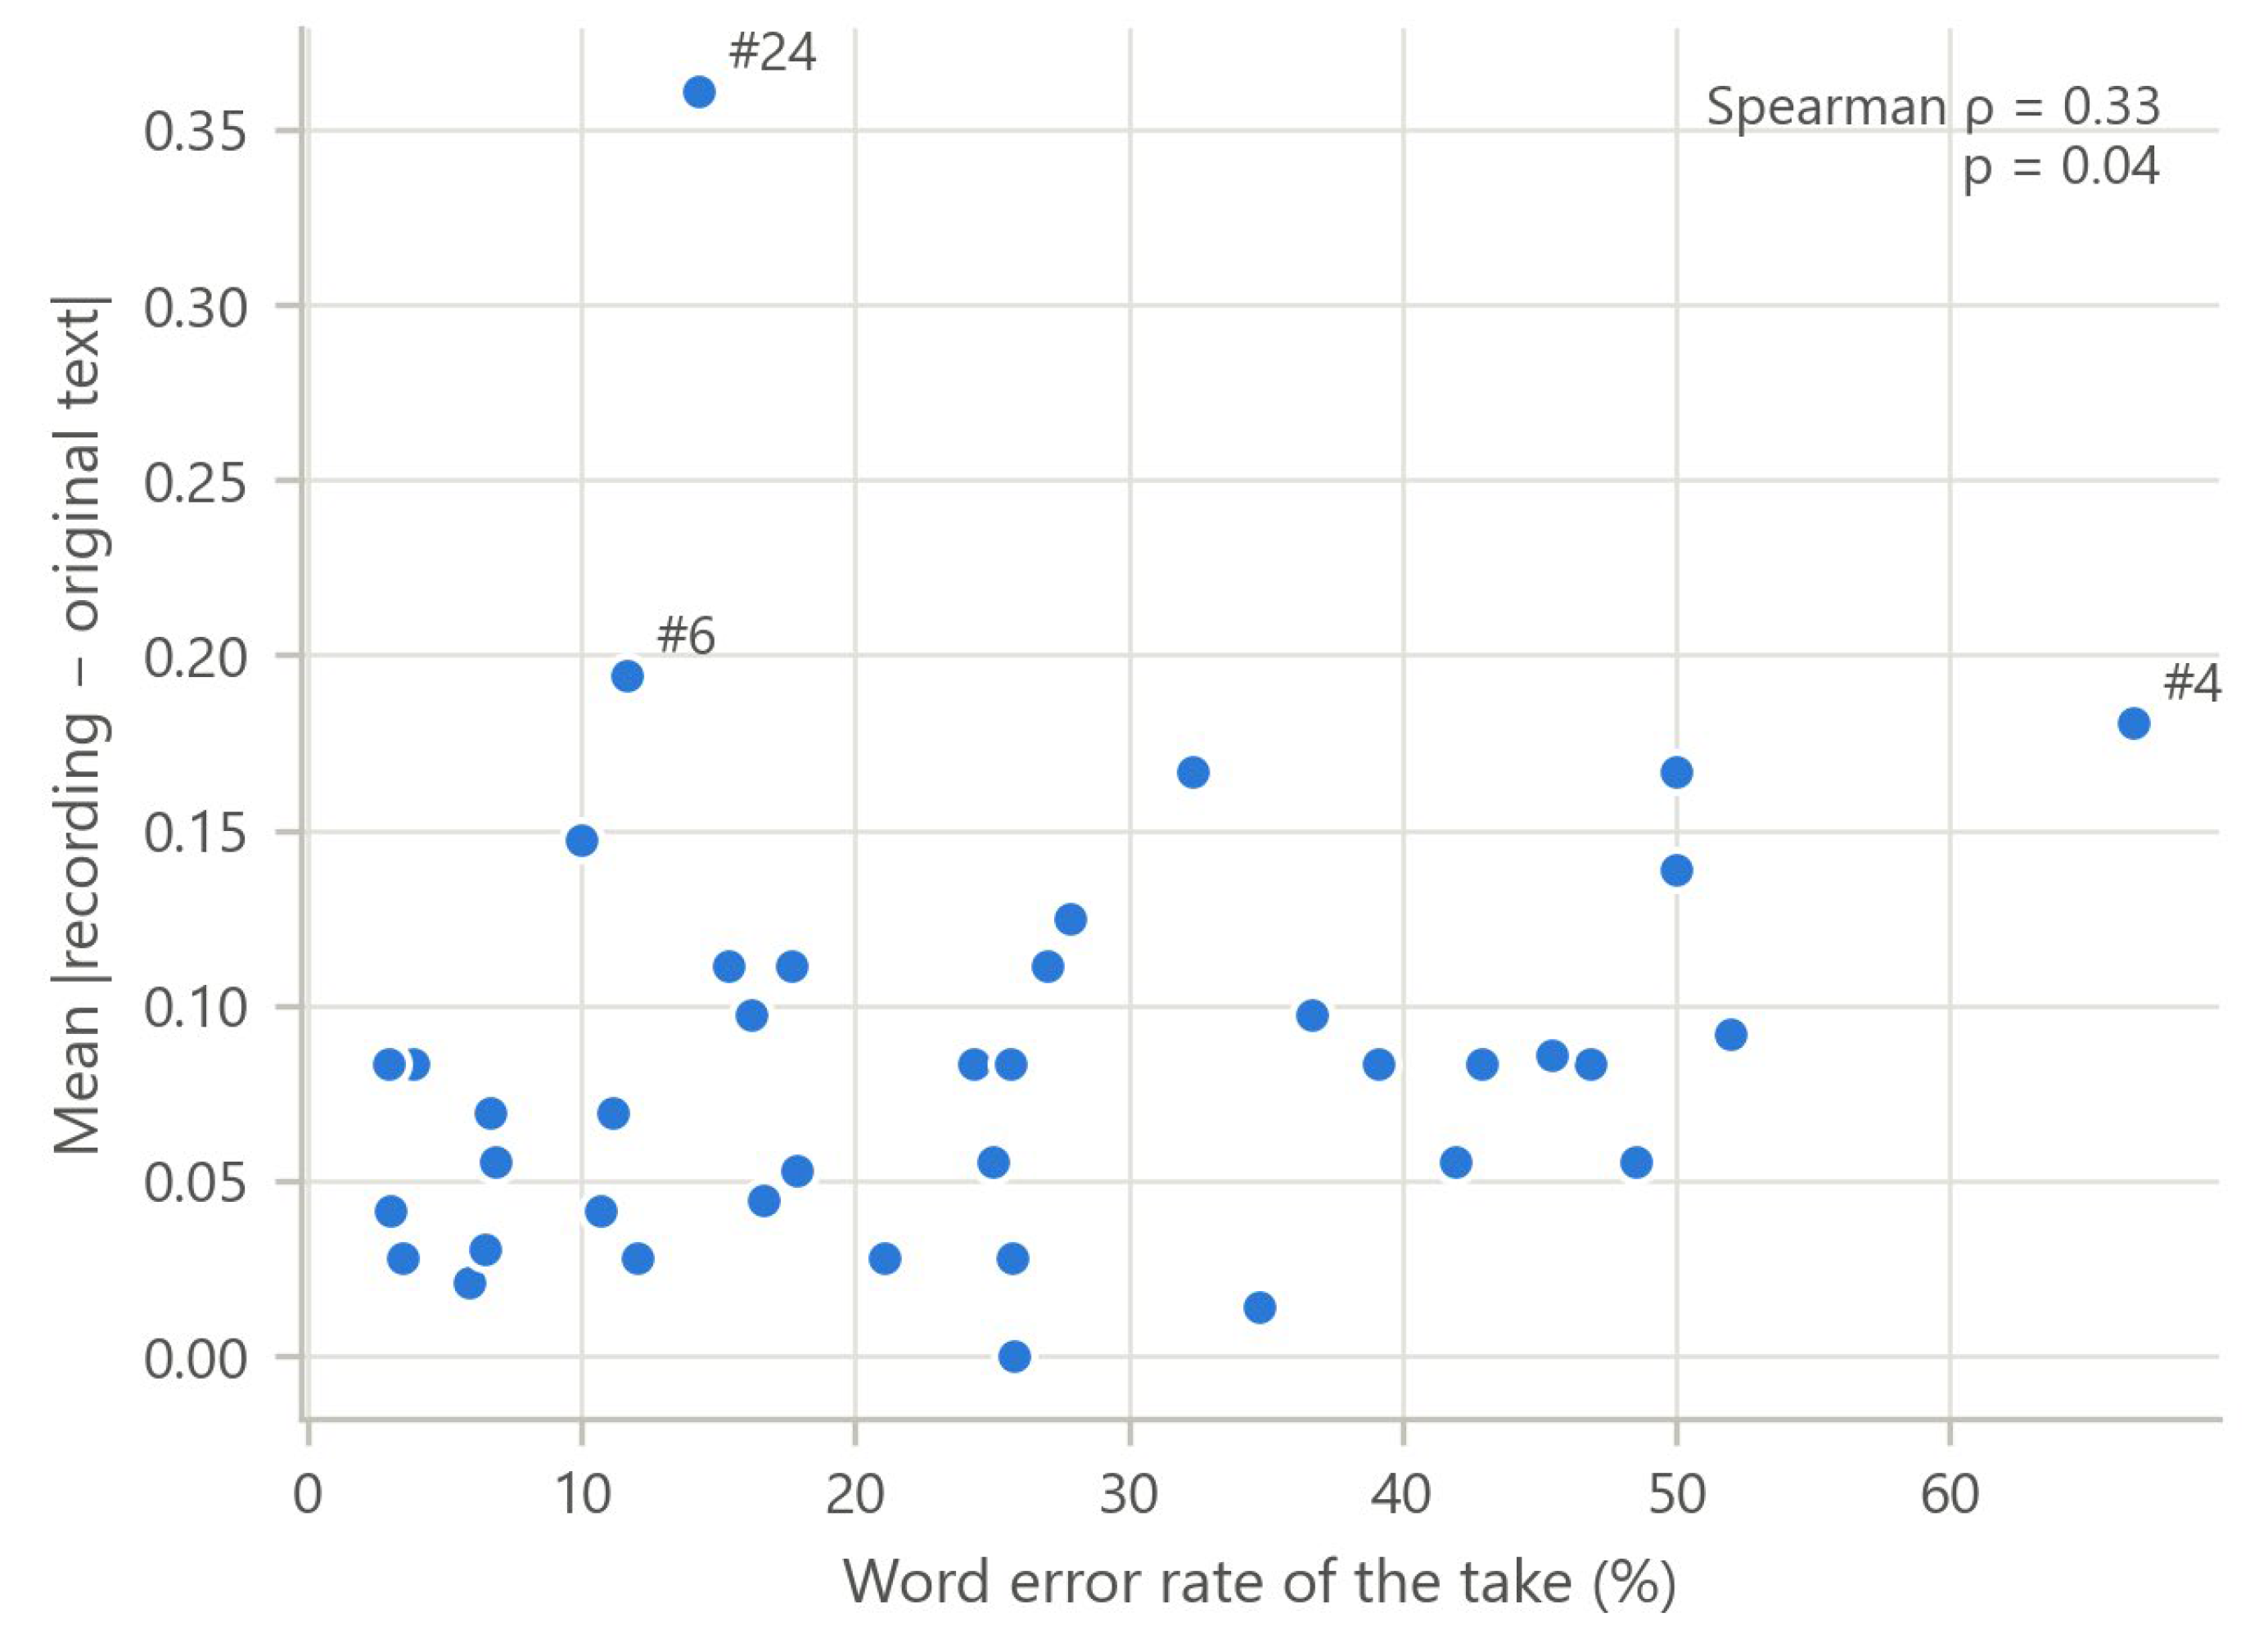
Figure 16.
Number of exchanges that the deployed report forms from one take, with every copy kept and with copies of one utterance merged.
Figure 16.
Number of exchanges that the deployed report forms from one take, with every copy kept and with copies of one utterance merged.
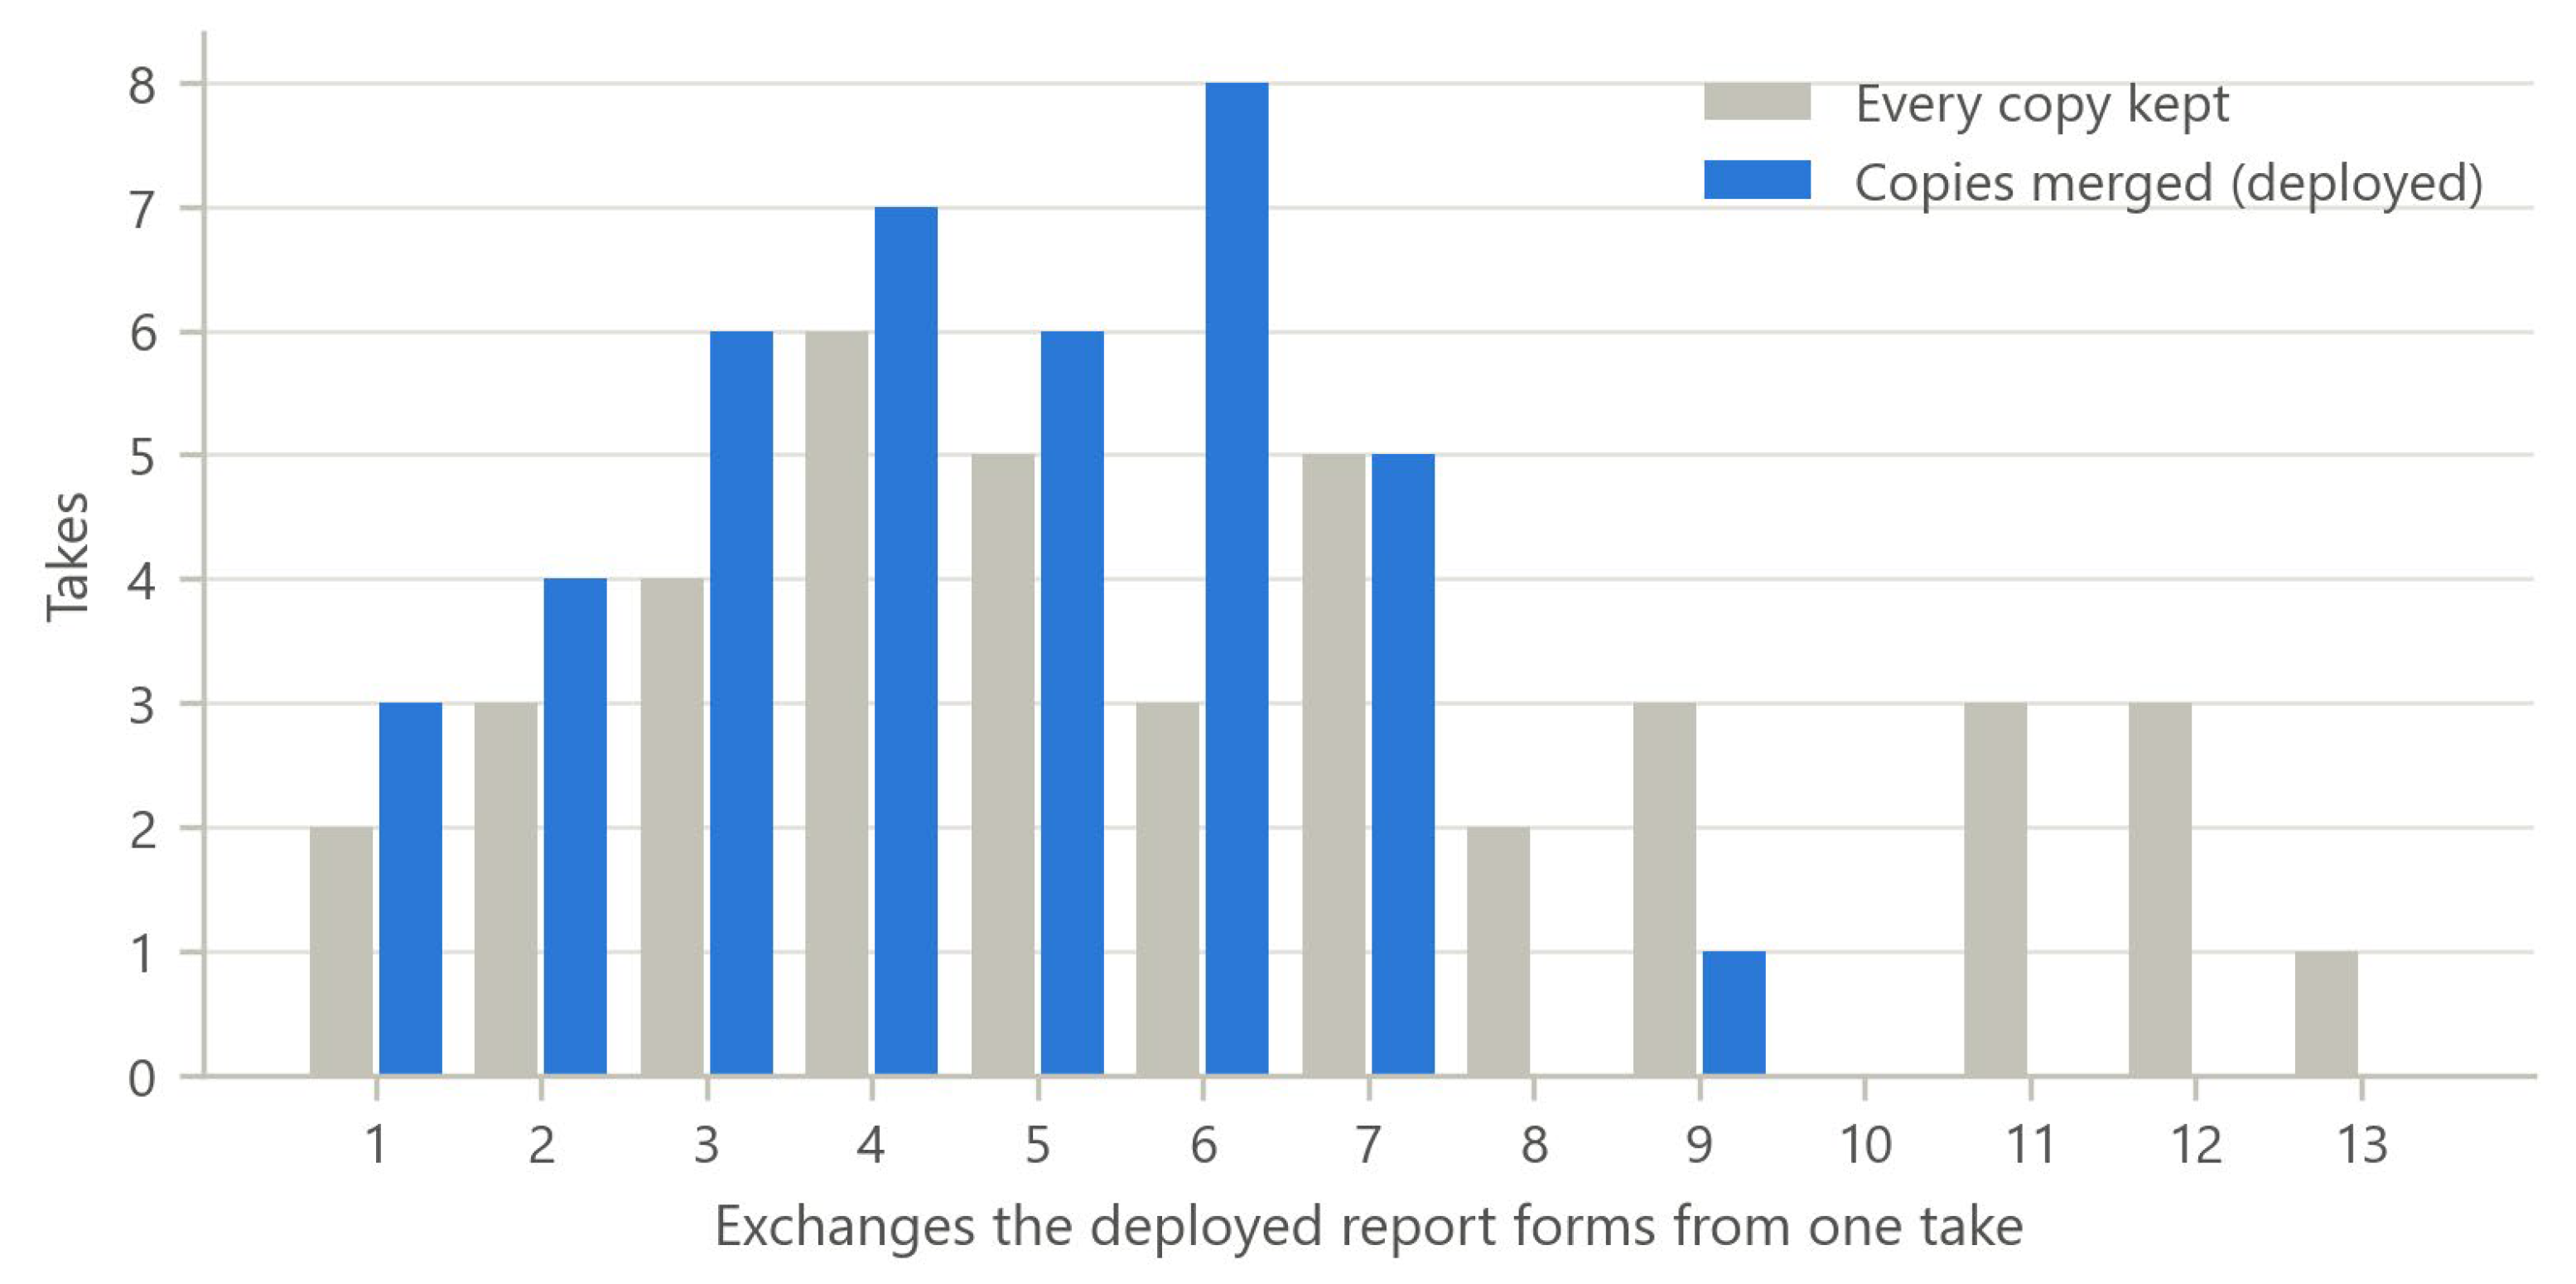
Figure 17.
The speech gate as a confusion matrix against the listener's verdict. Cells give clip counts with the row percentage beneath. The lower row is empty because clips the gate rejected retain no audio and cannot be annotated.
Figure 17.
The speech gate as a confusion matrix against the listener's verdict. Cells give clip counts with the row percentage beneath. The lower row is empty because clips the gate rejected retain no audio and cannot be annotated.
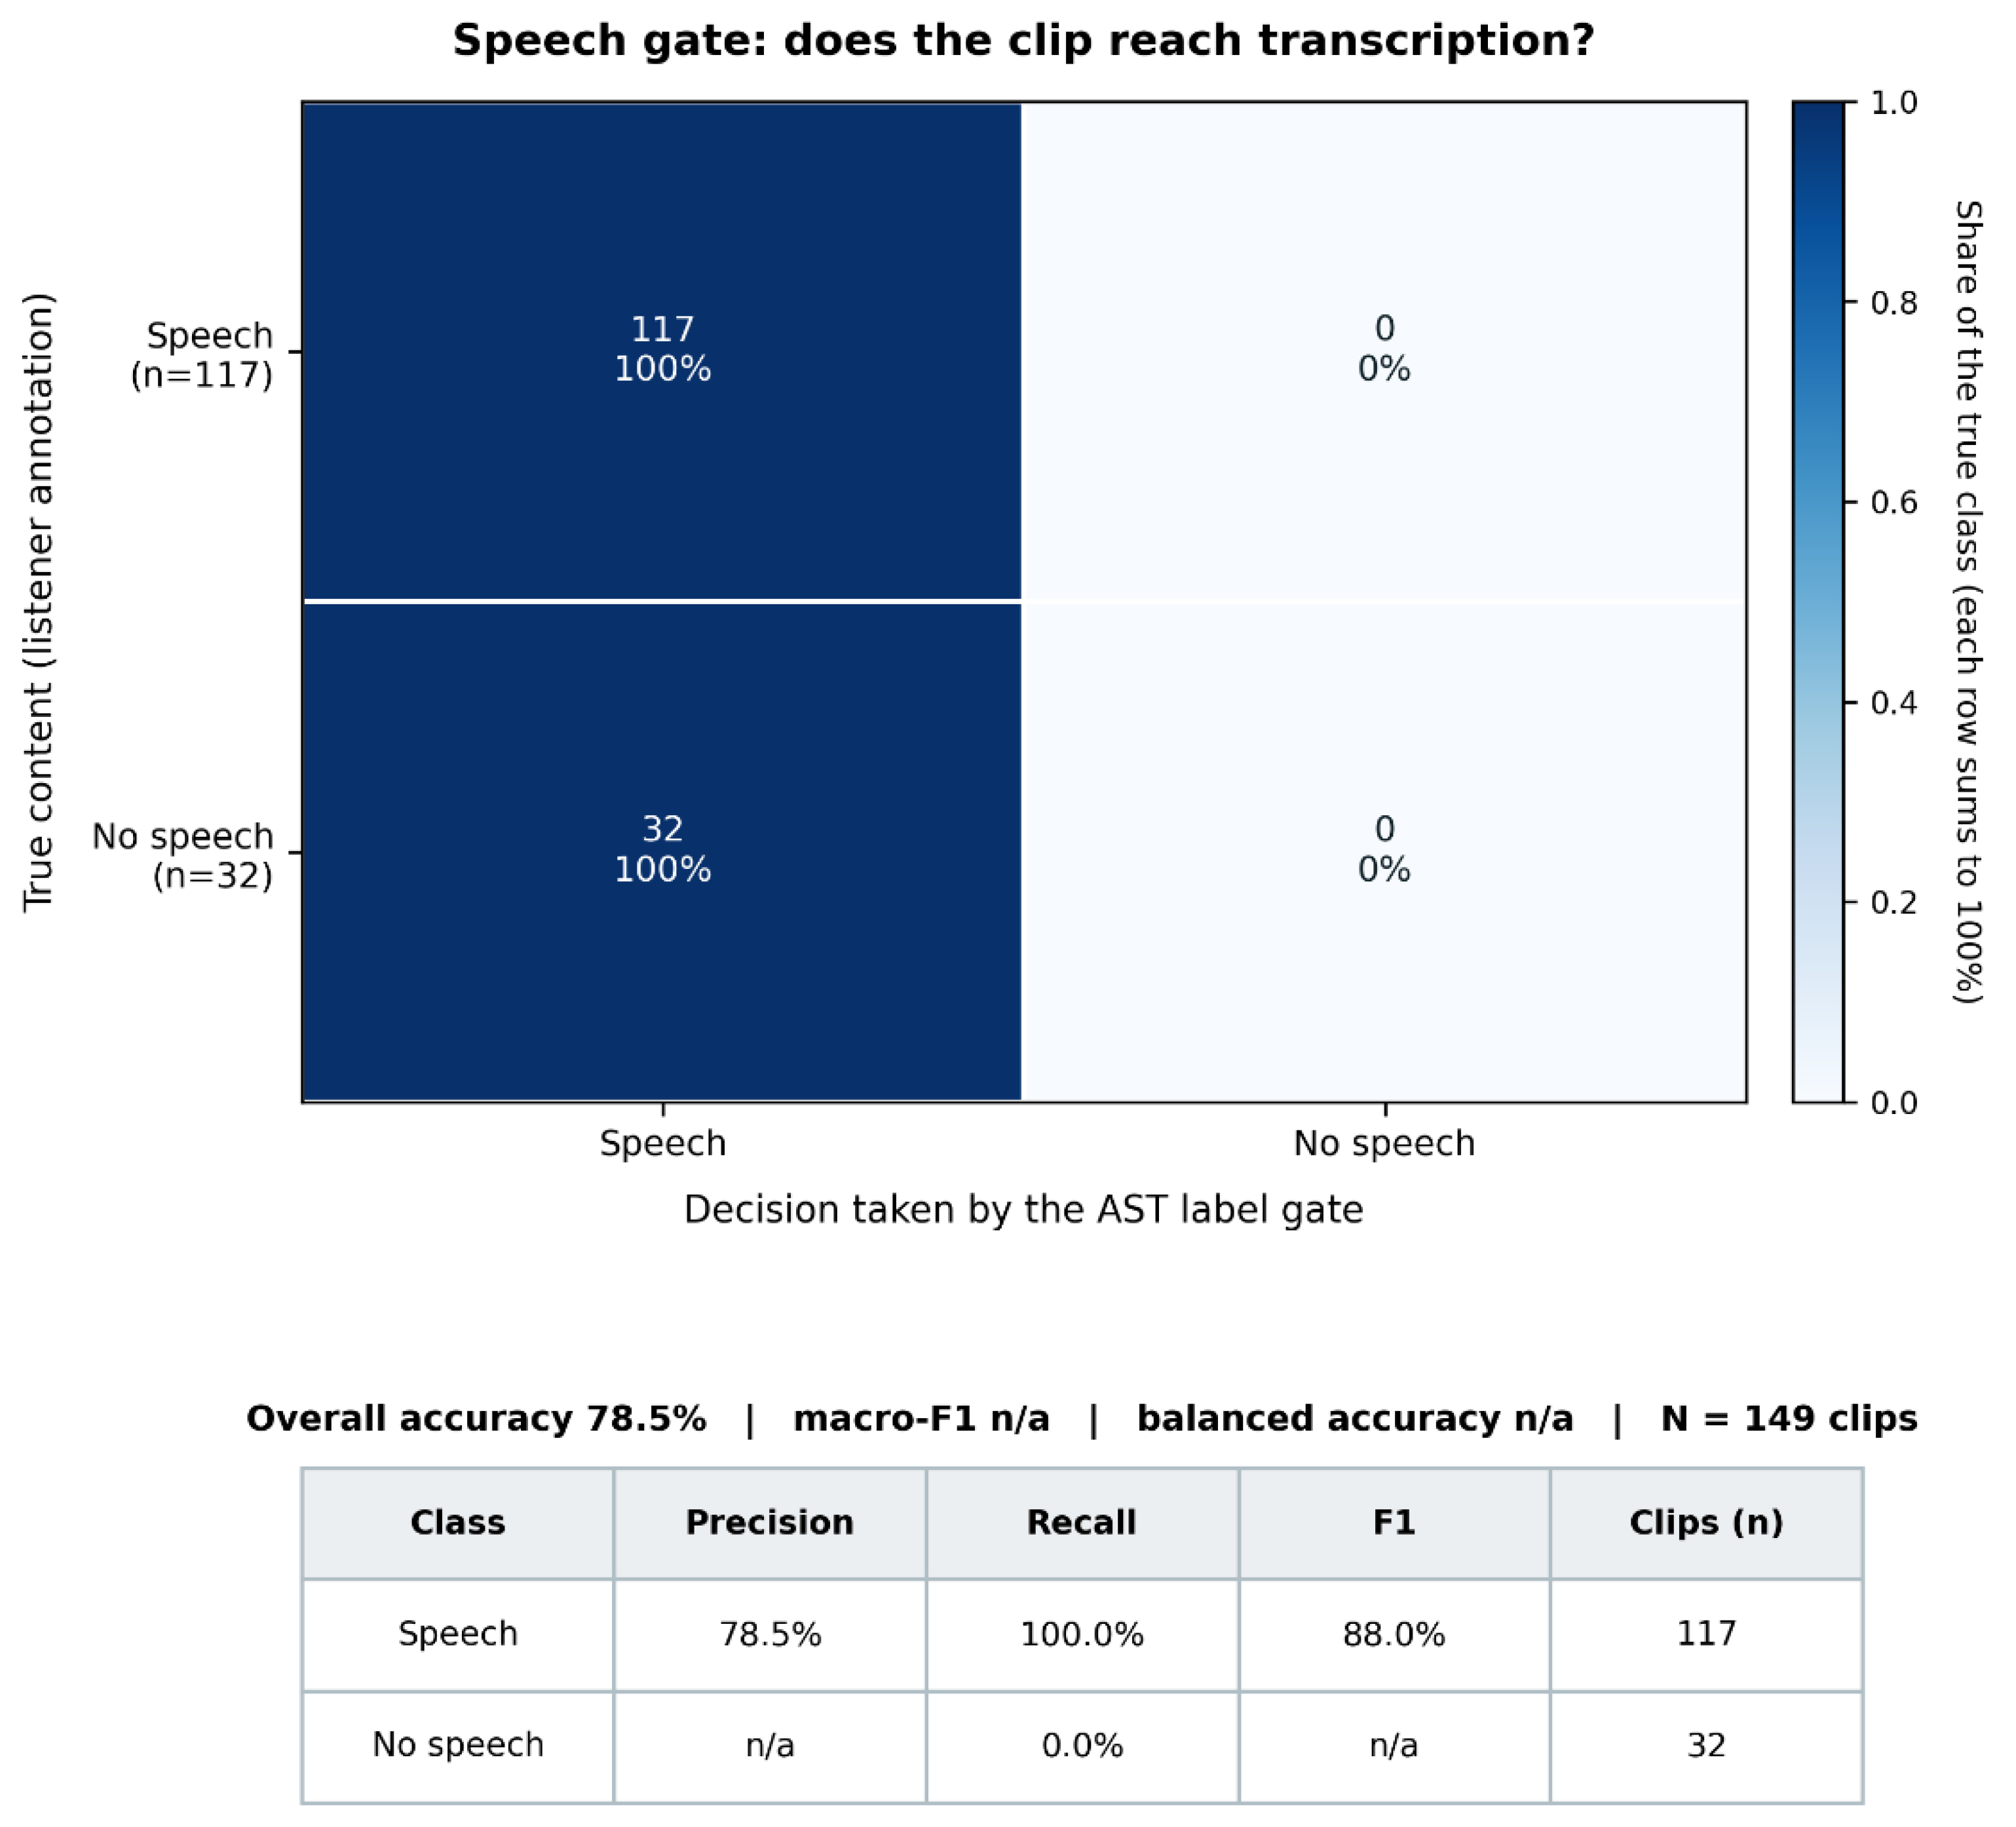
Figure 18.
Share of clips for which an acceptable AudioSet label appears within the top K of the three the model returns, under the strict and lenient criteria (n = 147 clips).
Figure 18.
Share of clips for which an acceptable AudioSet label appears within the top K of the three the model returns, under the strict and lenient criteria (n = 147 clips).
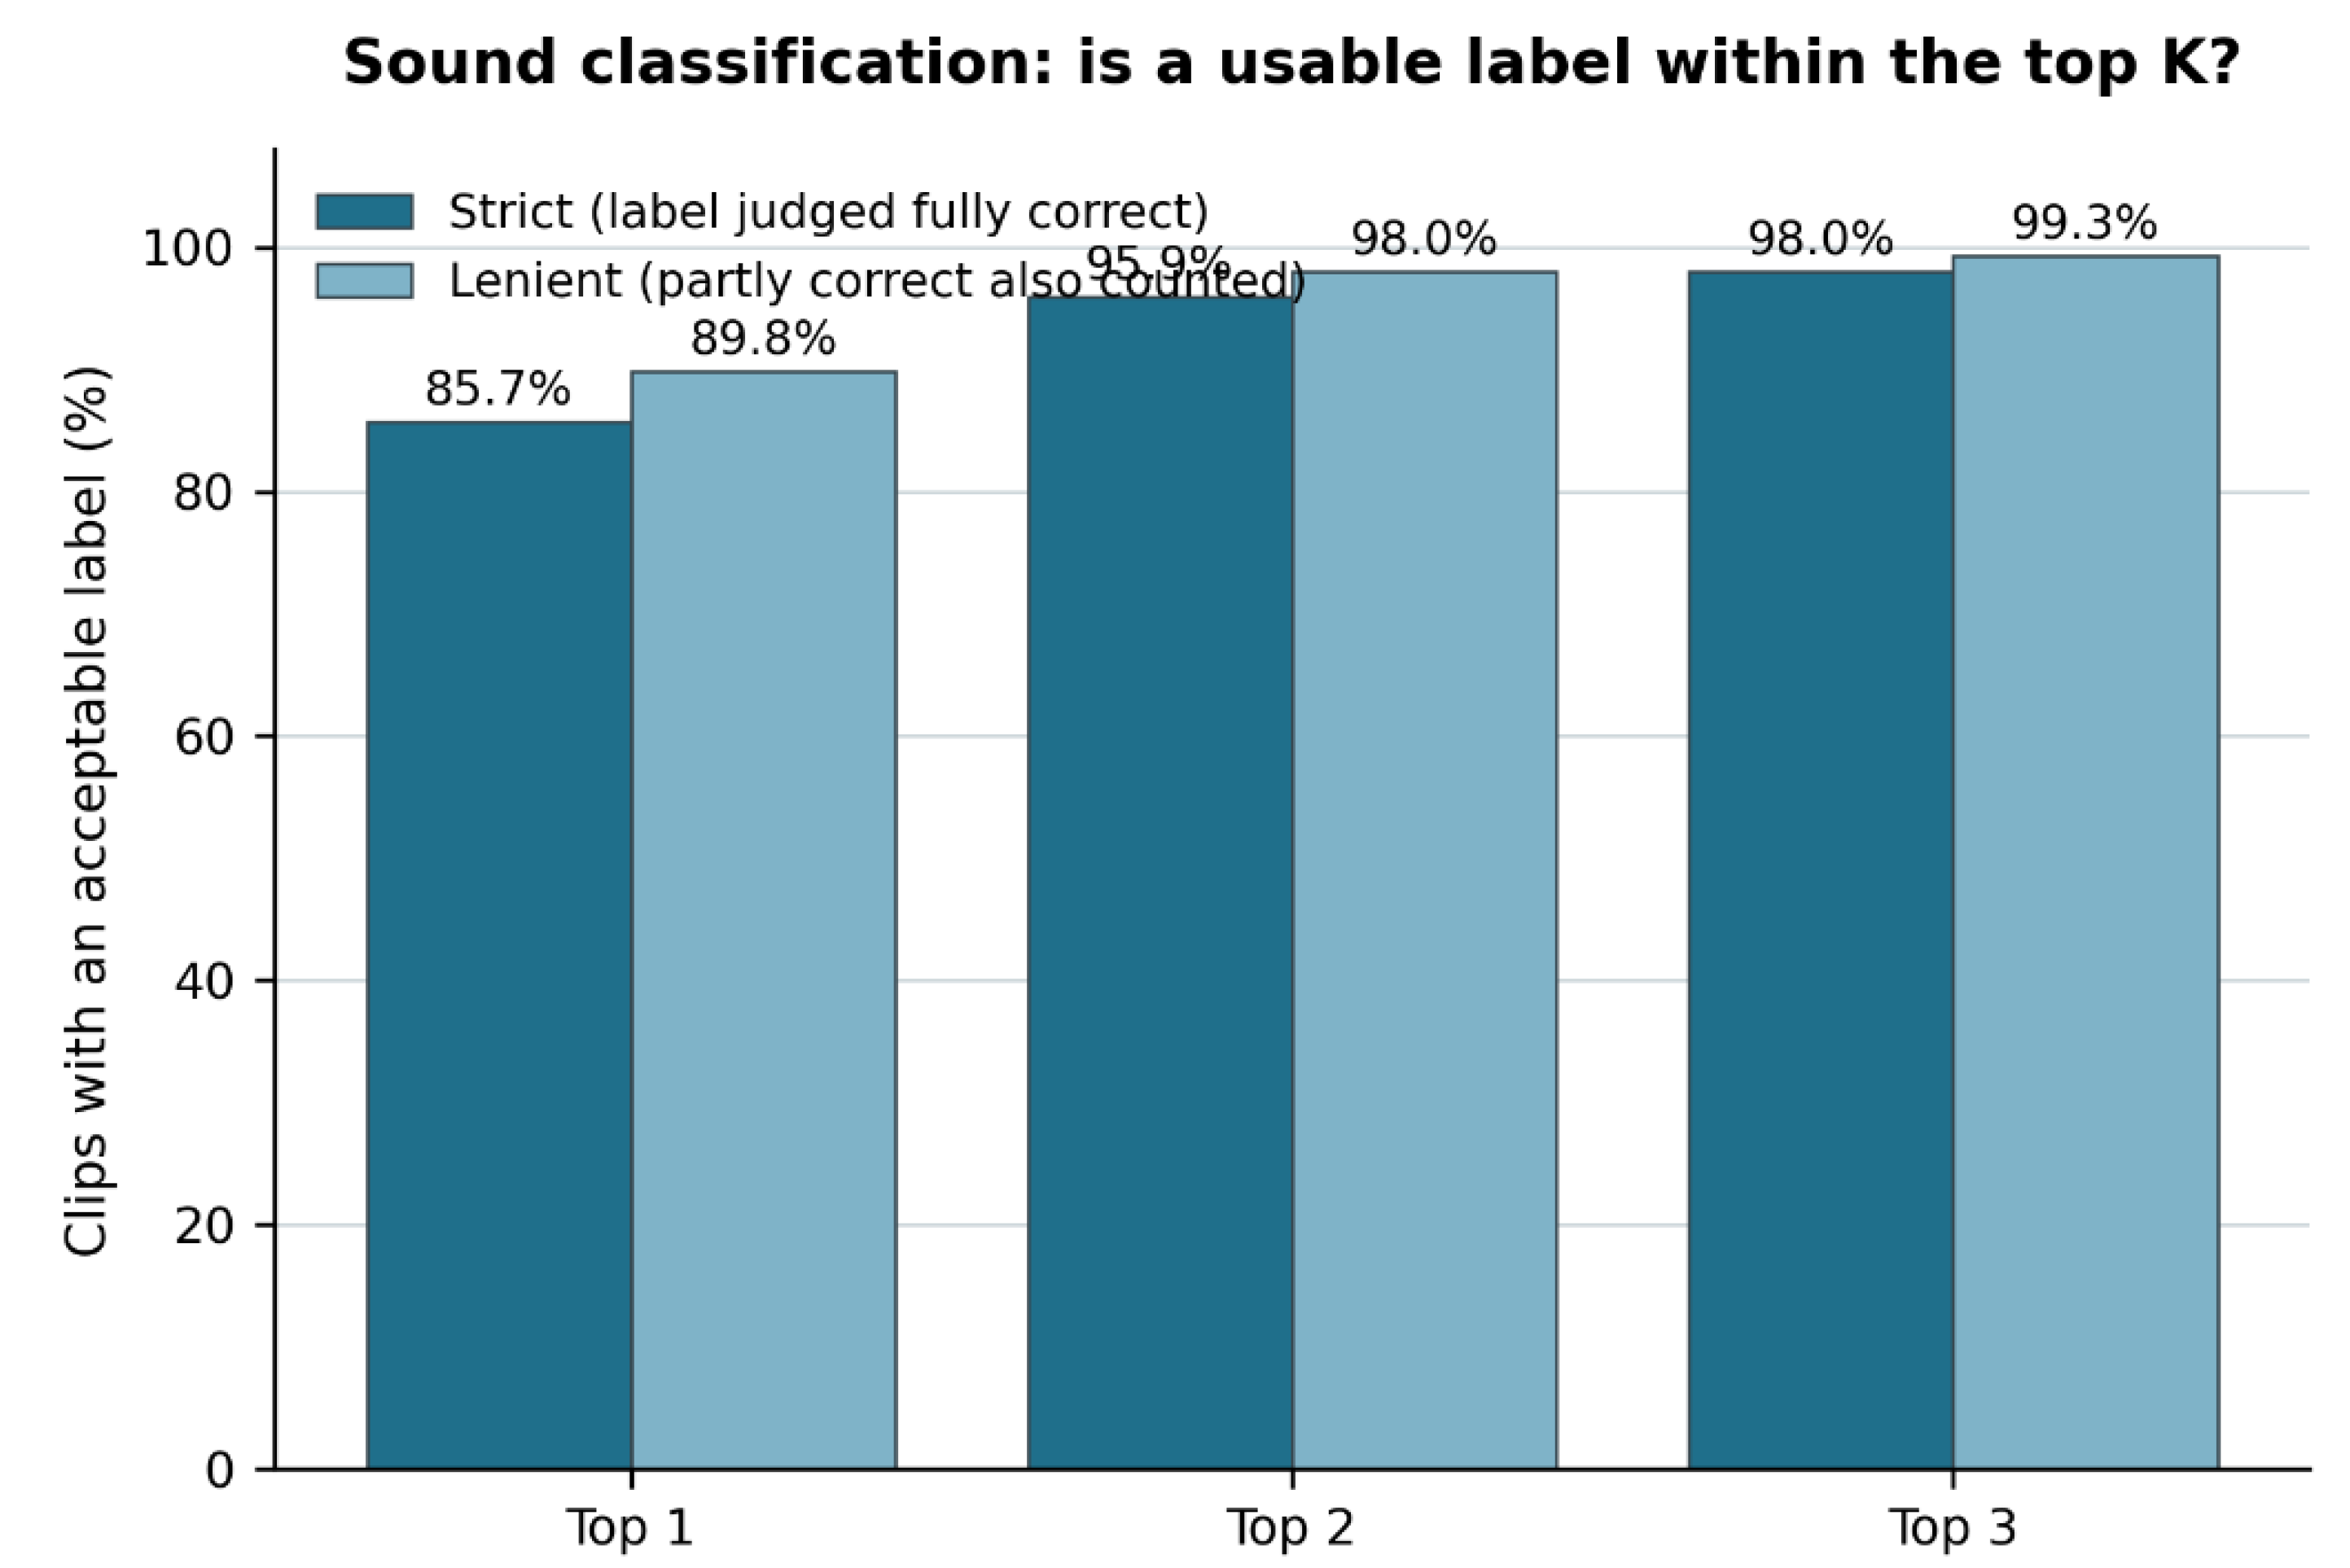
Figure 19.
Word and character error rates of Whisper large-v3 on the 95 clips with a reference transcript, before and after normalization, with the error composition beneath.
Figure 19.
Word and character error rates of Whisper large-v3 on the 95 clips with a reference transcript, before and after normalization, with the error composition beneath.
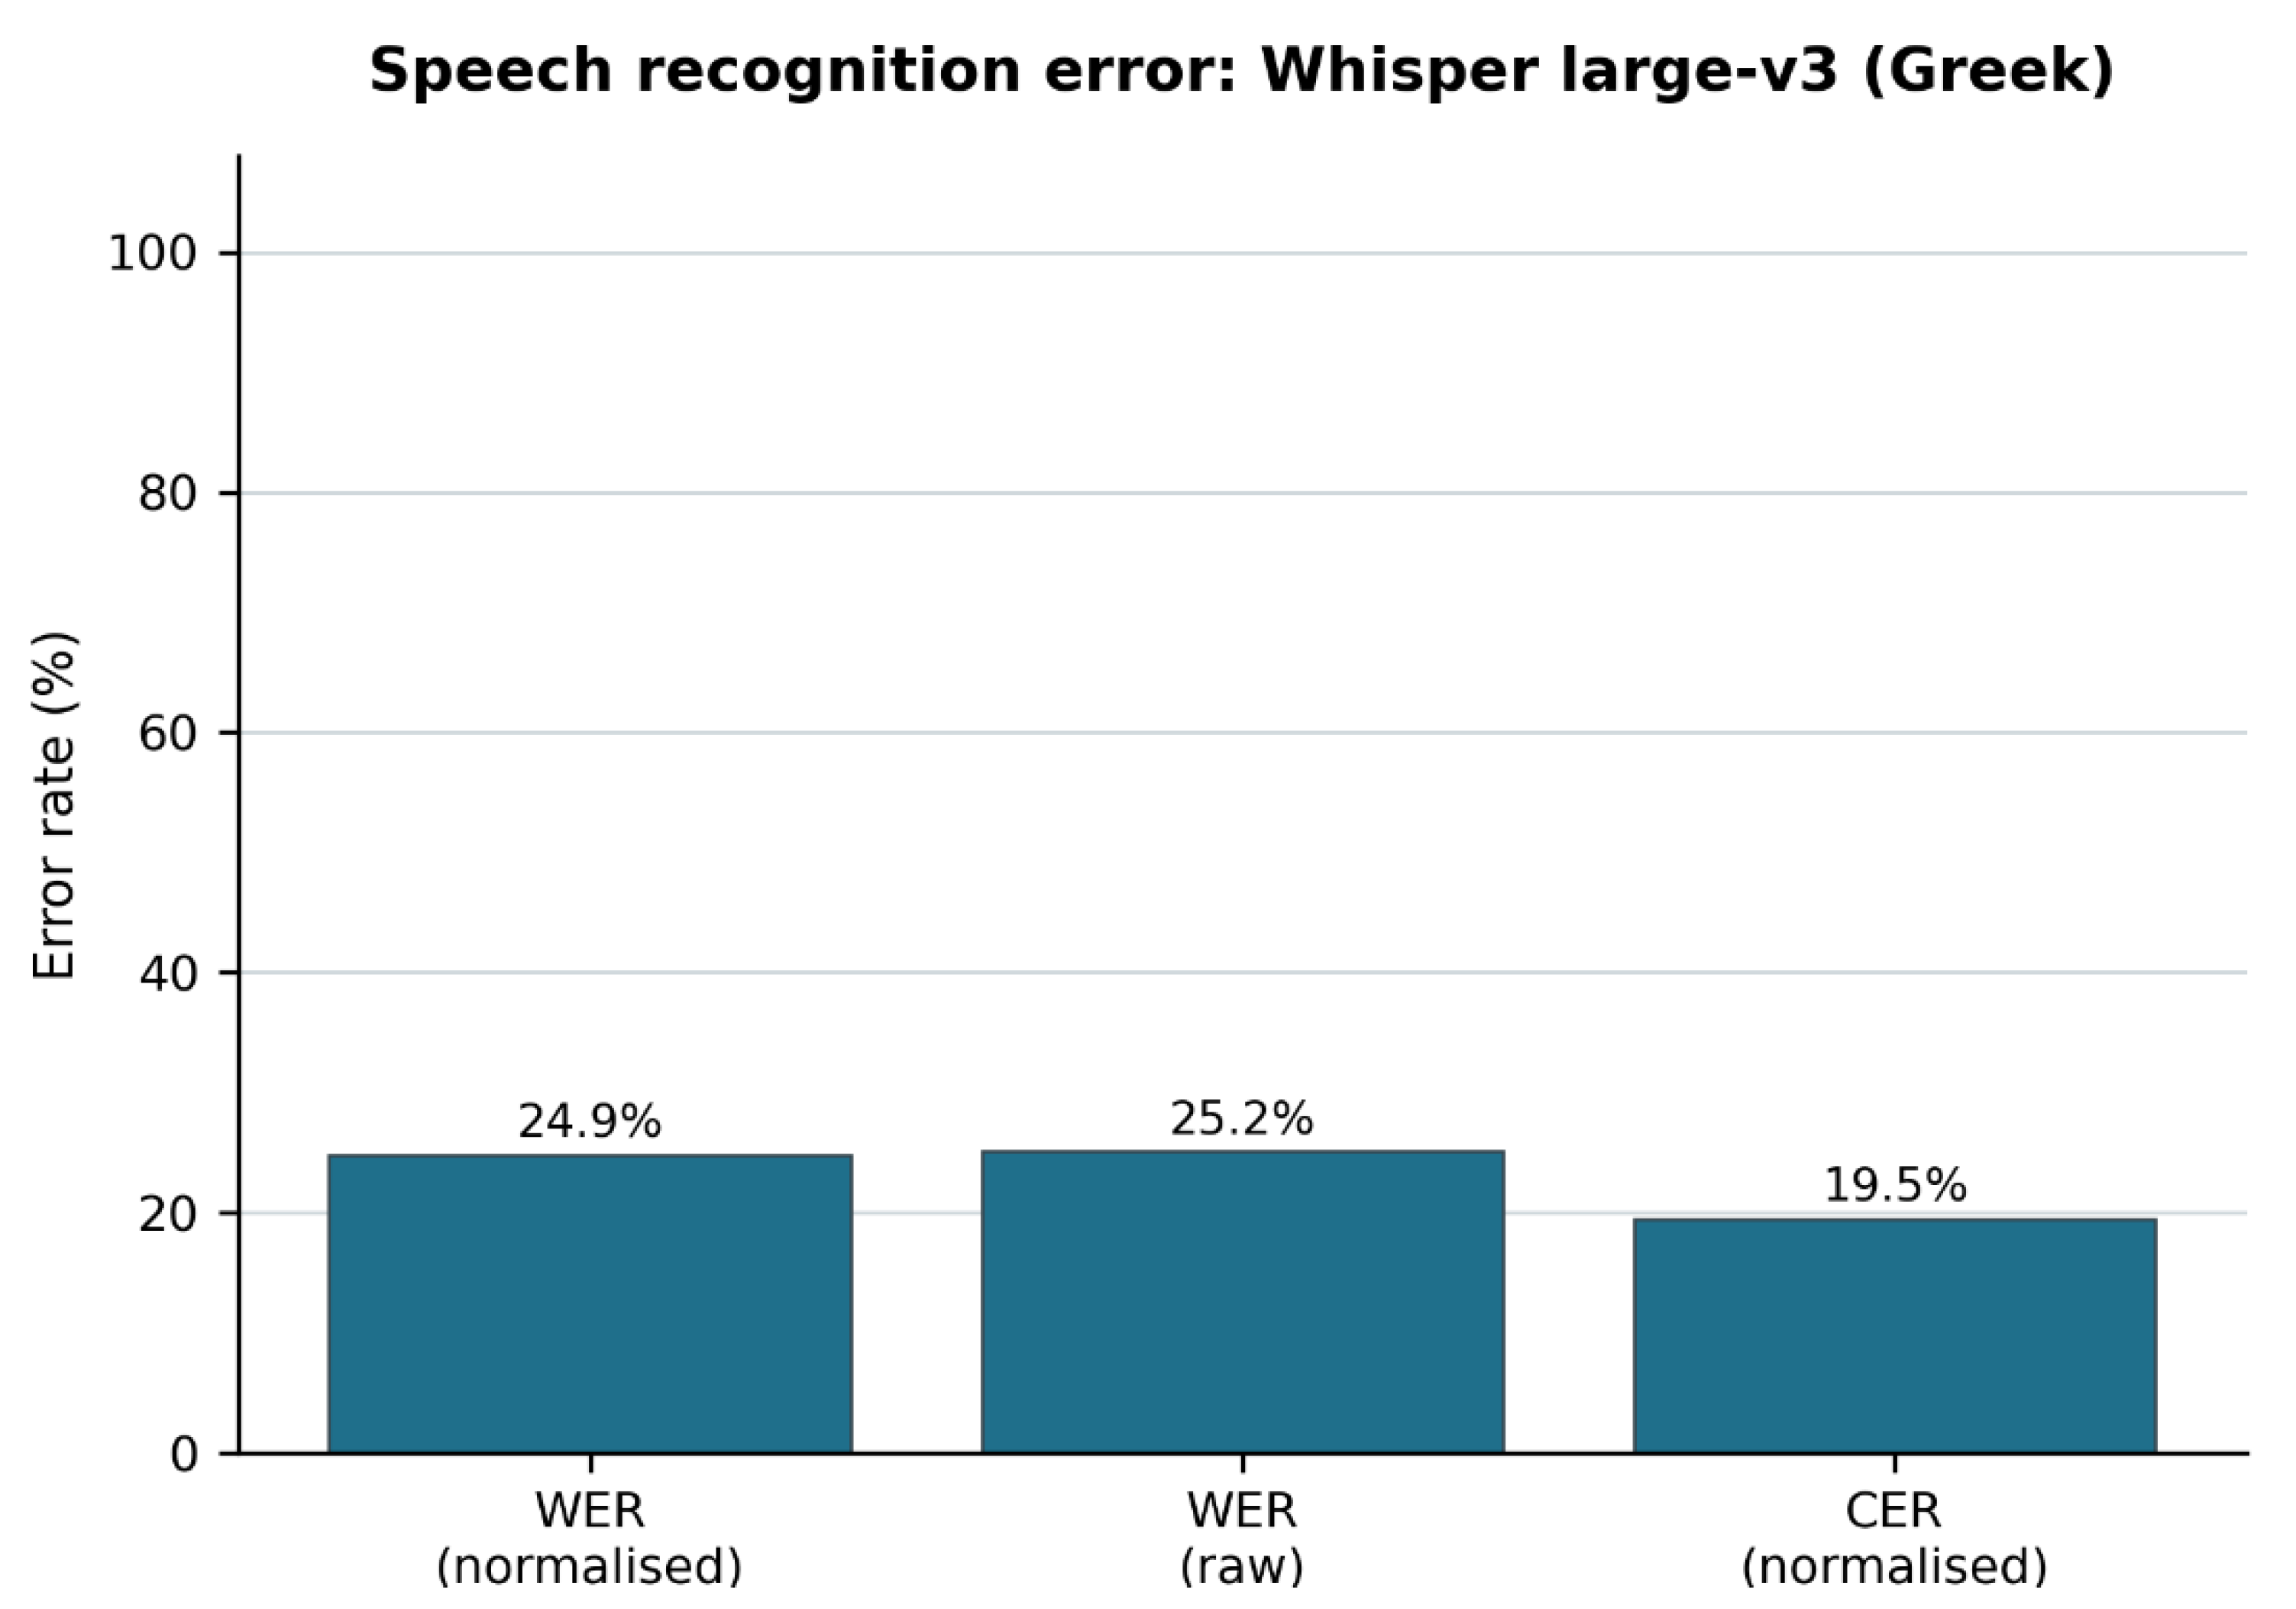
Figure 20.
Closed-set speaker identification against the listener's attribution, on clips with a single resident speaking. Cells give clip counts with the row percentage beneath; "Unknown" is the system declining to name anyone, which is a different outcome from naming the wrong person.
Figure 20.
Closed-set speaker identification against the listener's attribution, on clips with a single resident speaking. Cells give clip counts with the row percentage beneath; "Unknown" is the system declining to name anyone, which is a different outcome from naming the wrong person.
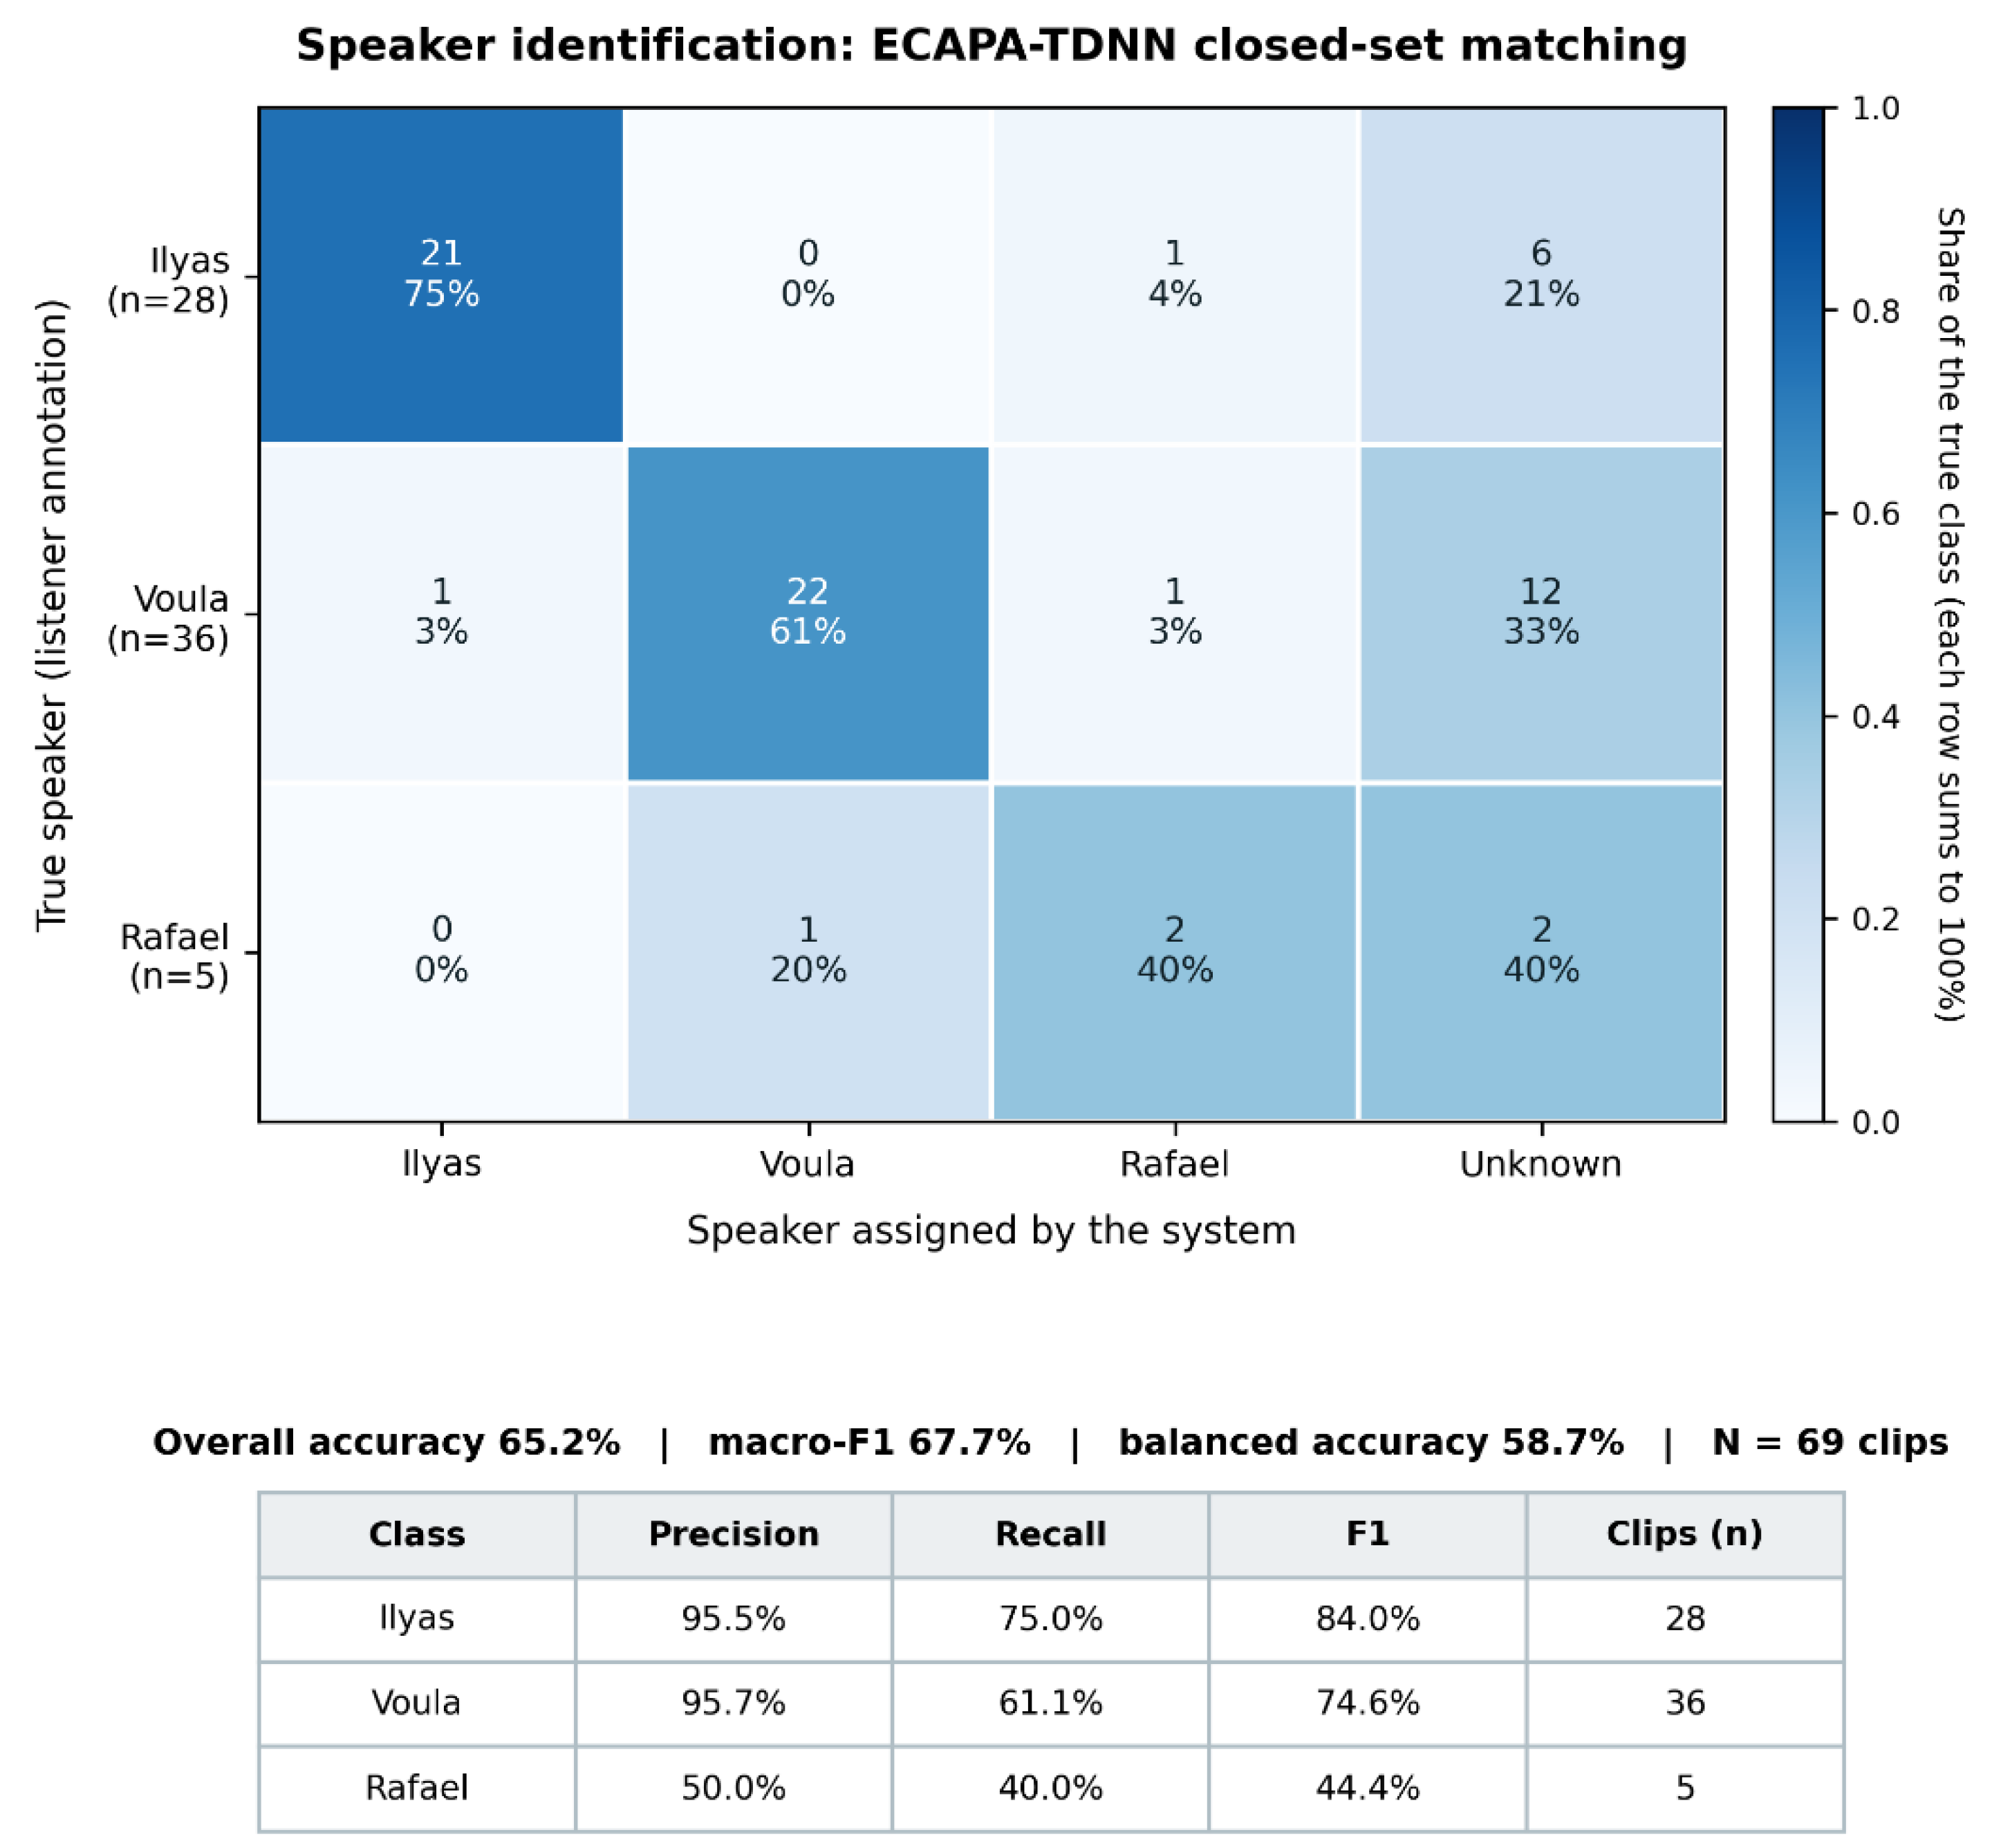
Figure 21.
The four-class affect label against the listener's impression. Cells give clip counts with the row percentage beneath; 16 clips carried no model output and are excluded.
Figure 21.
The four-class affect label against the listener's impression. Cells give clip counts with the row percentage beneath; 16 clips carried no model output and are excluded.
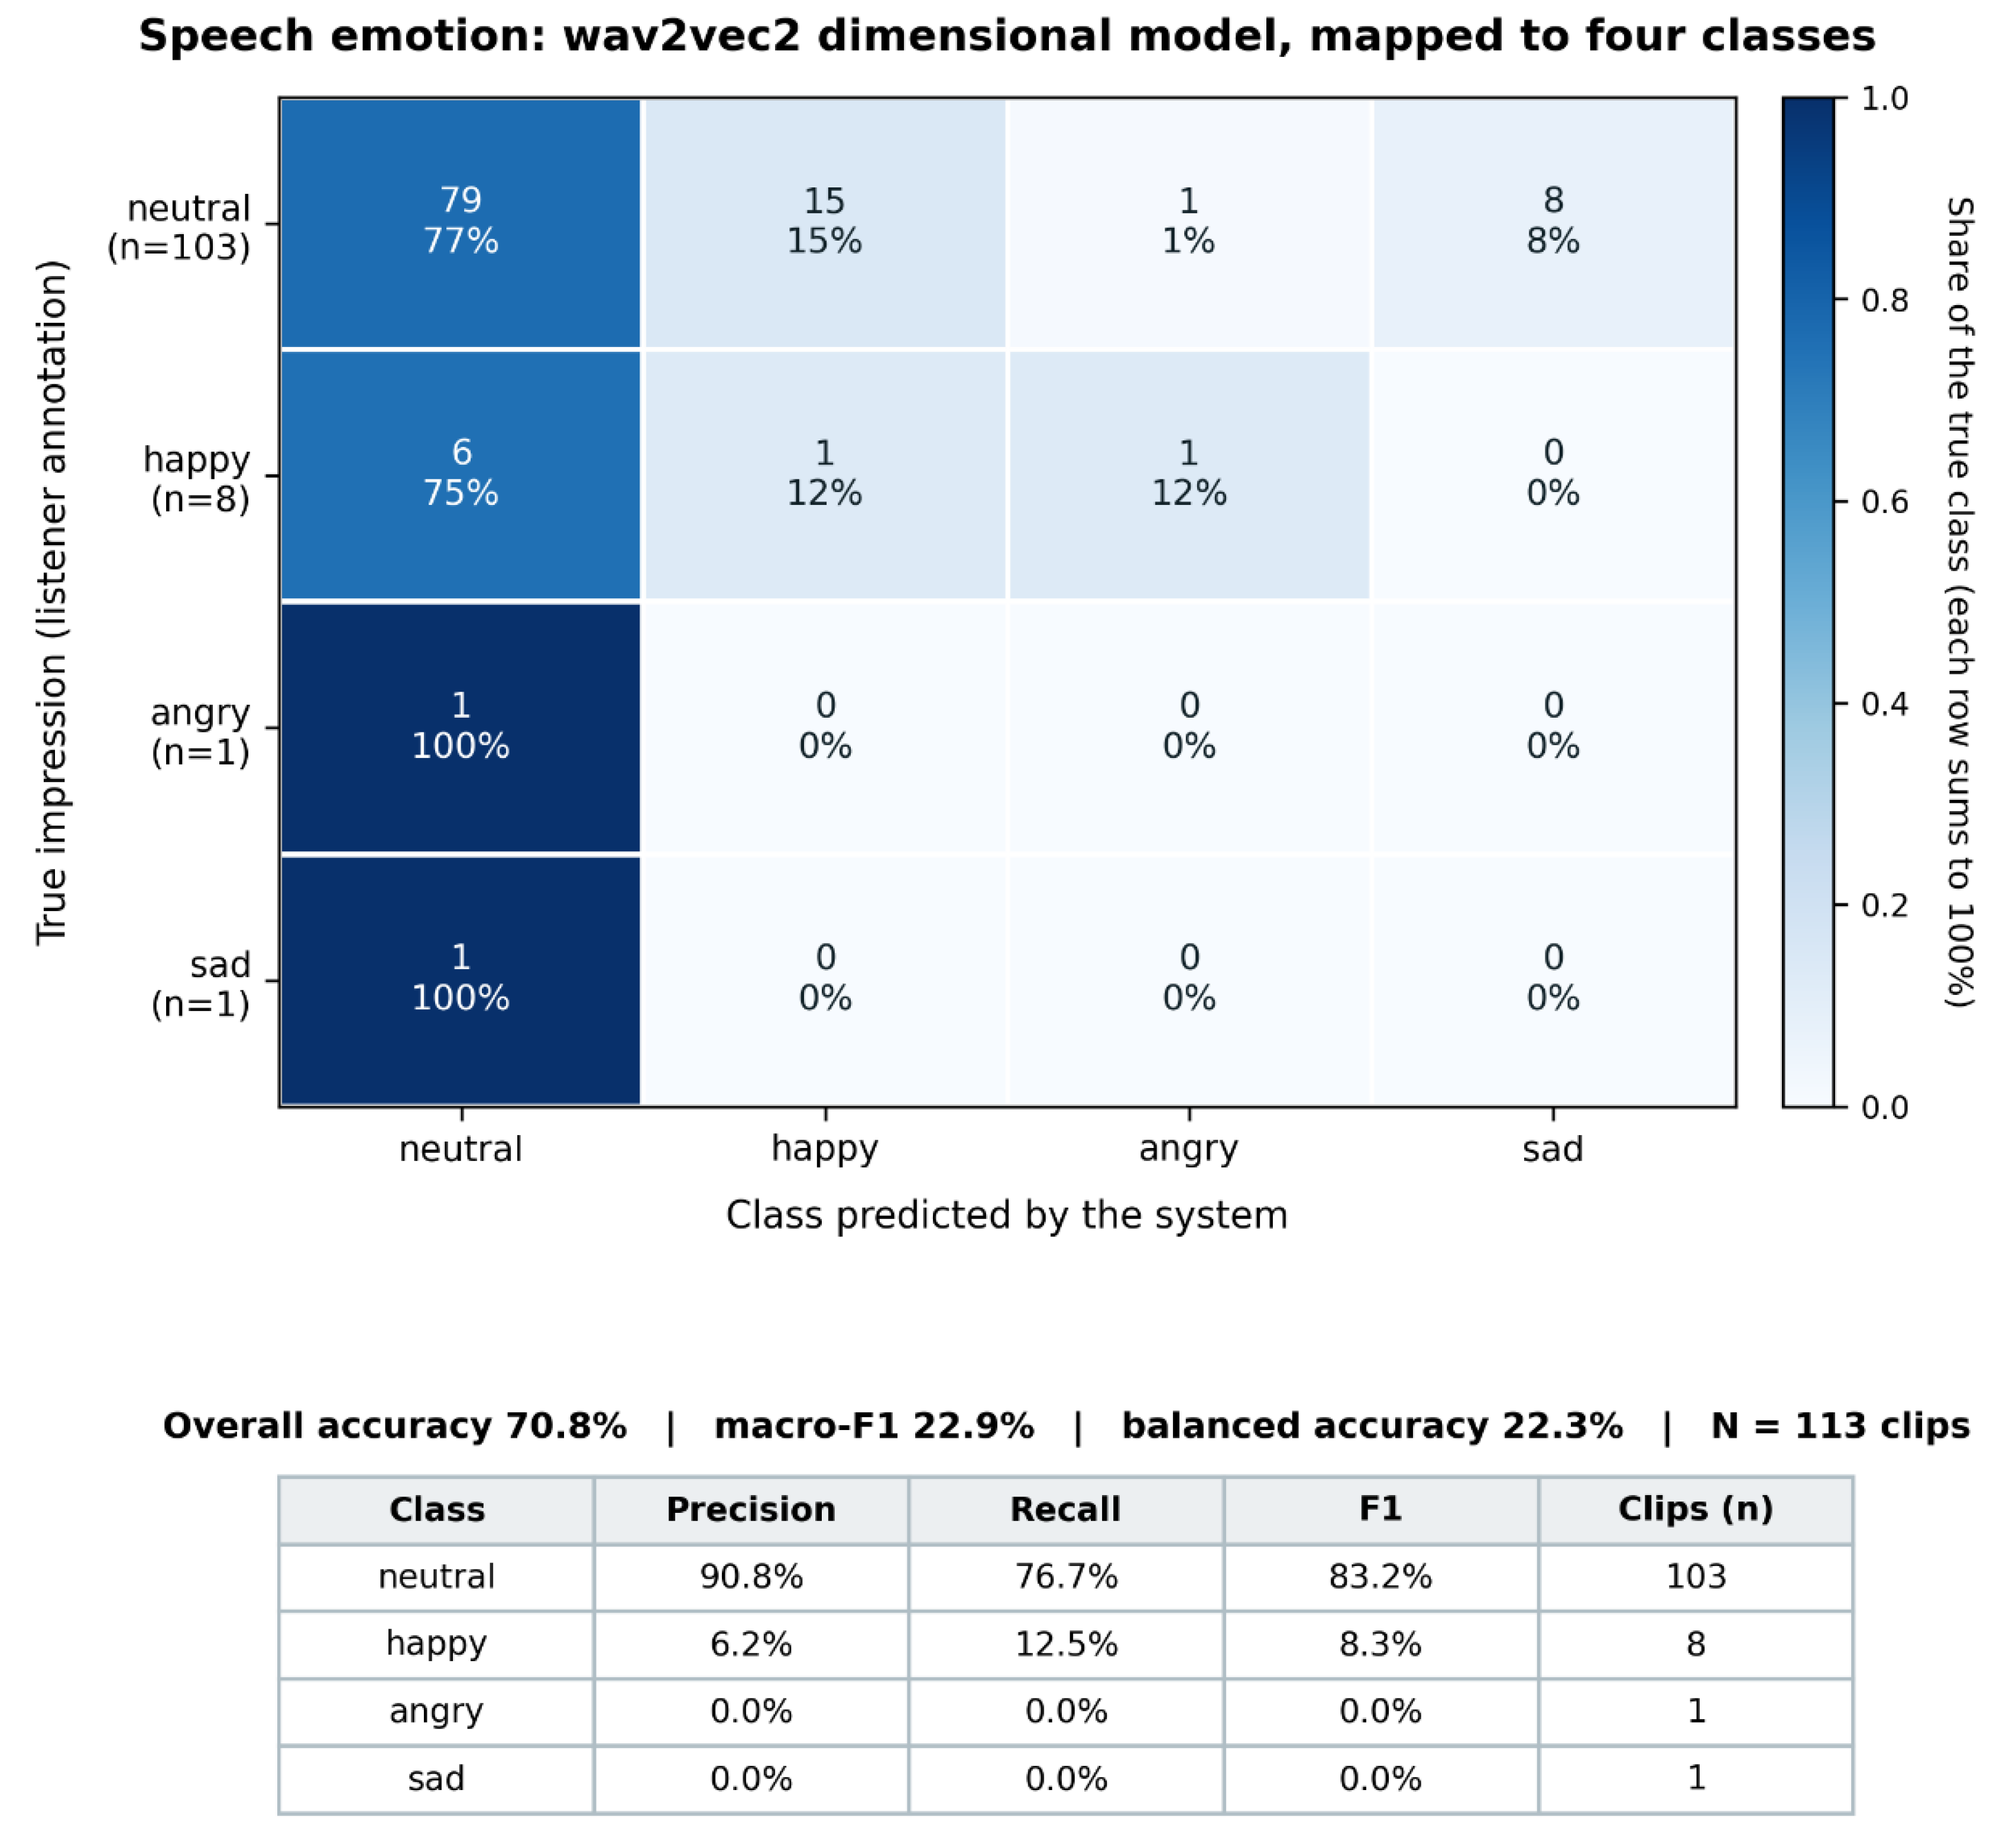
Figure 22.
Component summary as written by the scoring application, over the 149 annotated clips.
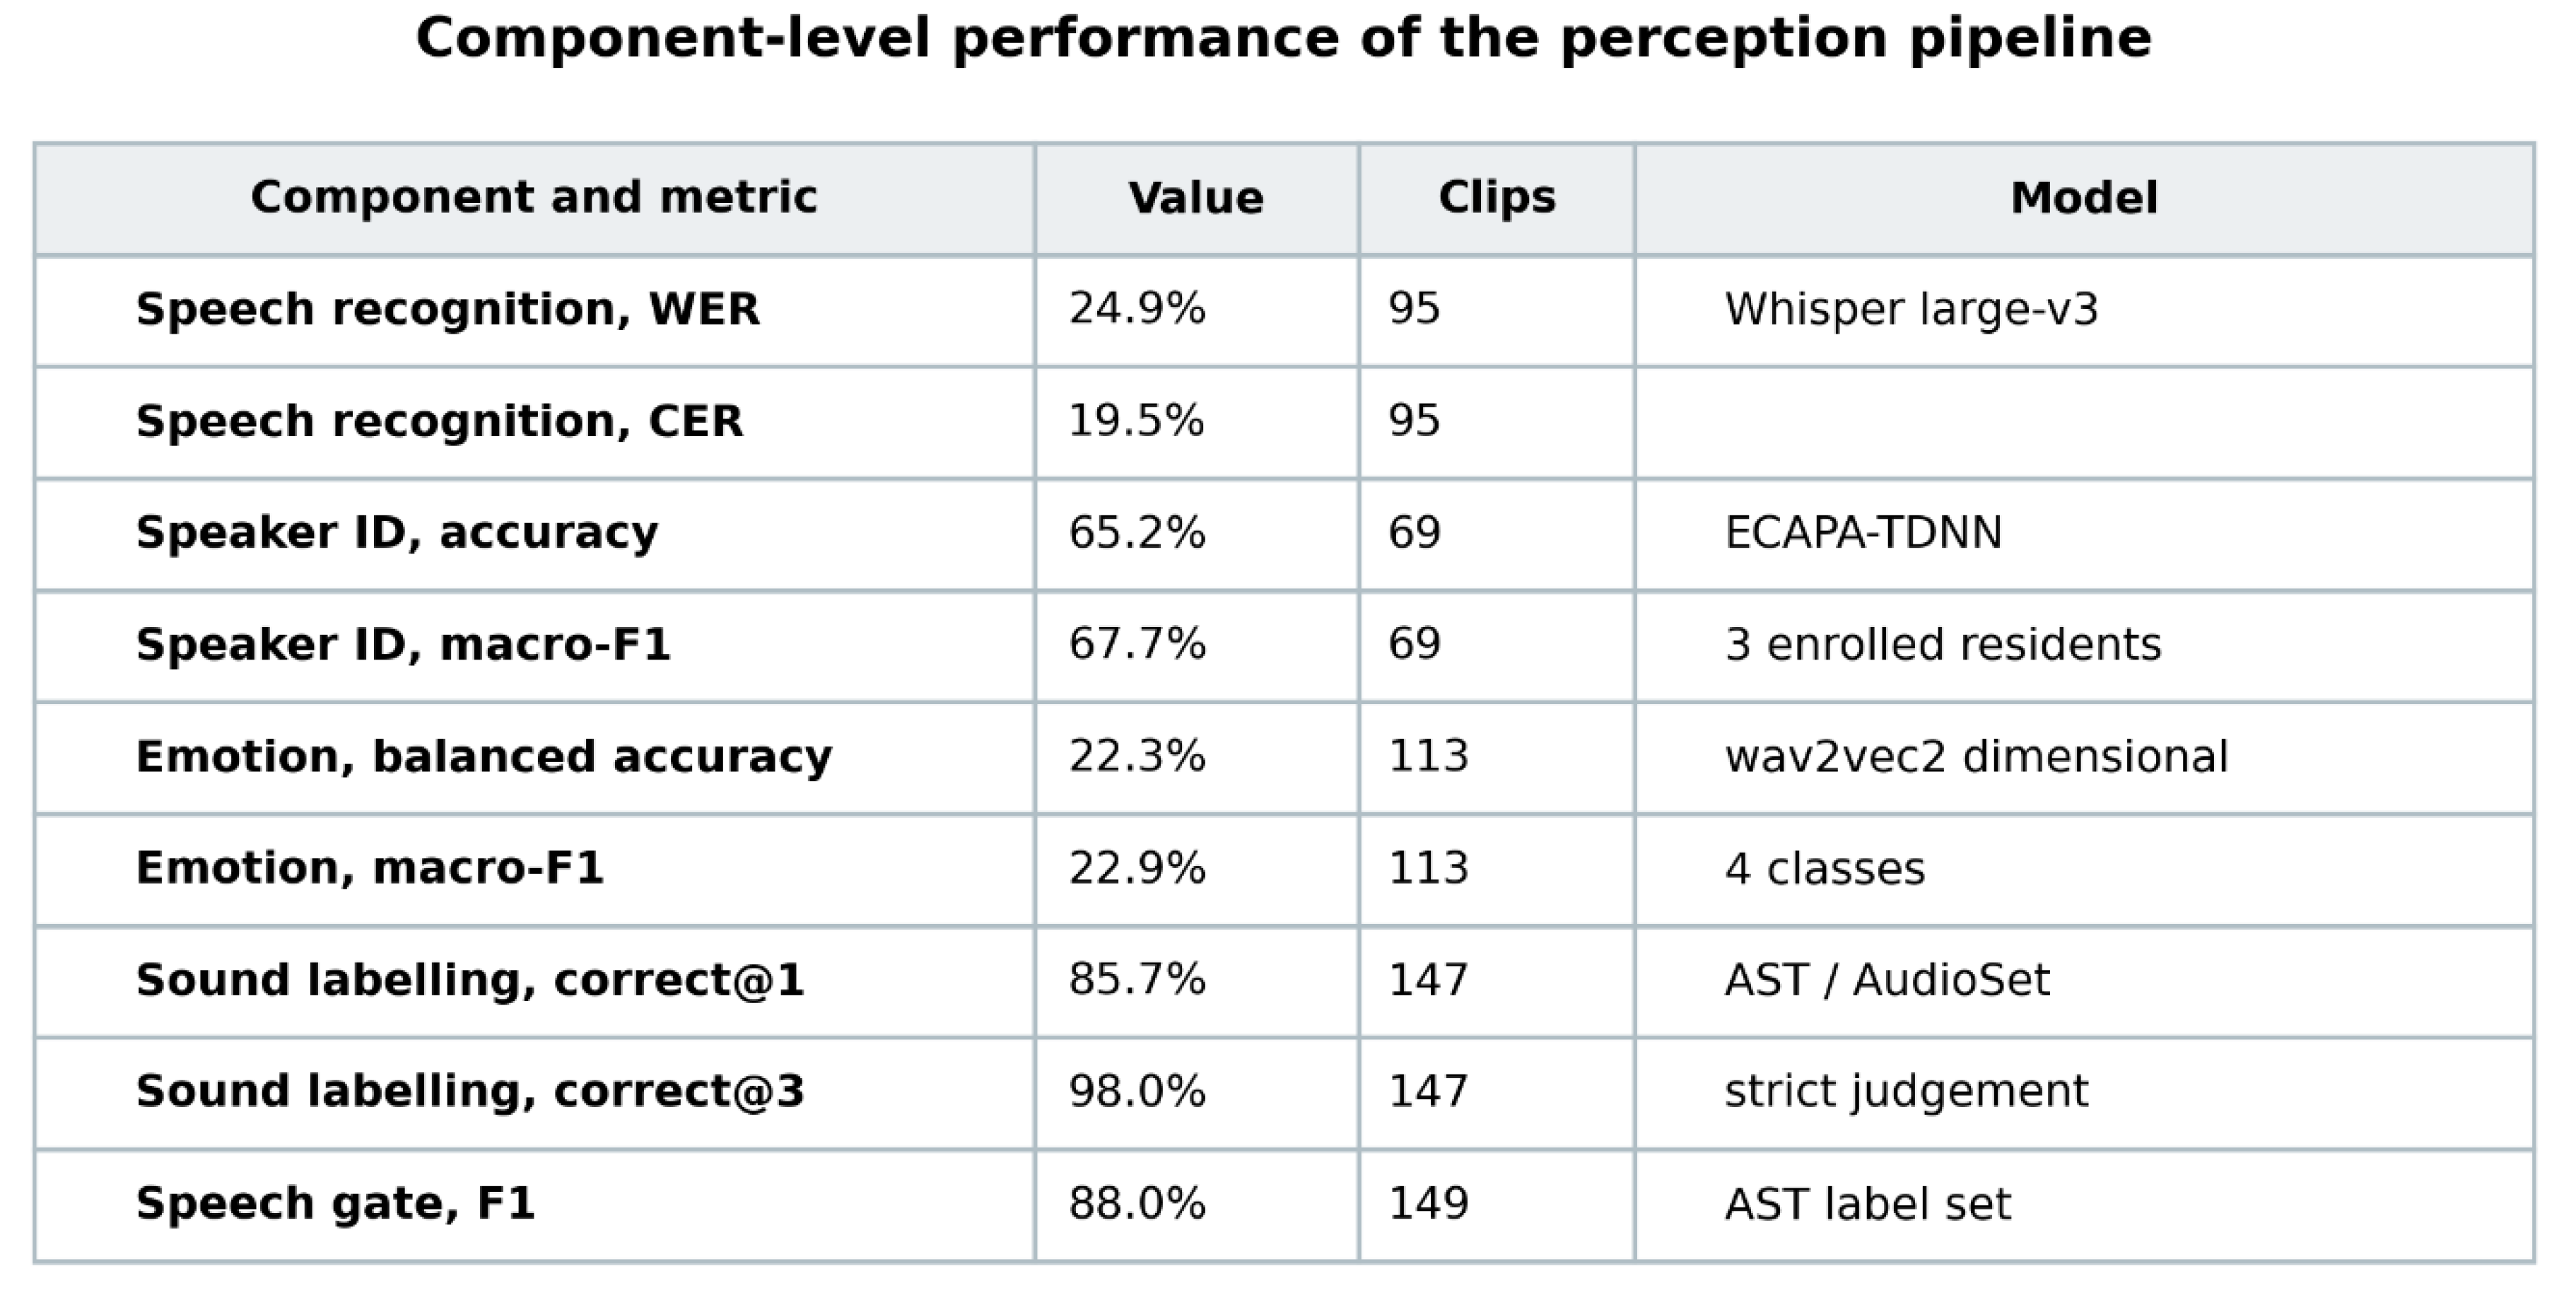
Figure 23.
Where listener and interpreter place each exchange, per dimension. Counts of exchanges at each pair of scores, 0 (absent) to 4 (dominates). The dashed diagonal is exact agreement; mass above it is the interpreter reading lower than the listener, below it reading higher. Warmth and joy sit above, tension below.
Figure 23.
Where listener and interpreter place each exchange, per dimension. Counts of exchanges at each pair of scores, 0 (absent) to 4 (dominates). The dashed diagonal is exact agreement; mass above it is the interpreter reading lower than the listener, below it reading higher. Warmth and joy sit above, tension below.
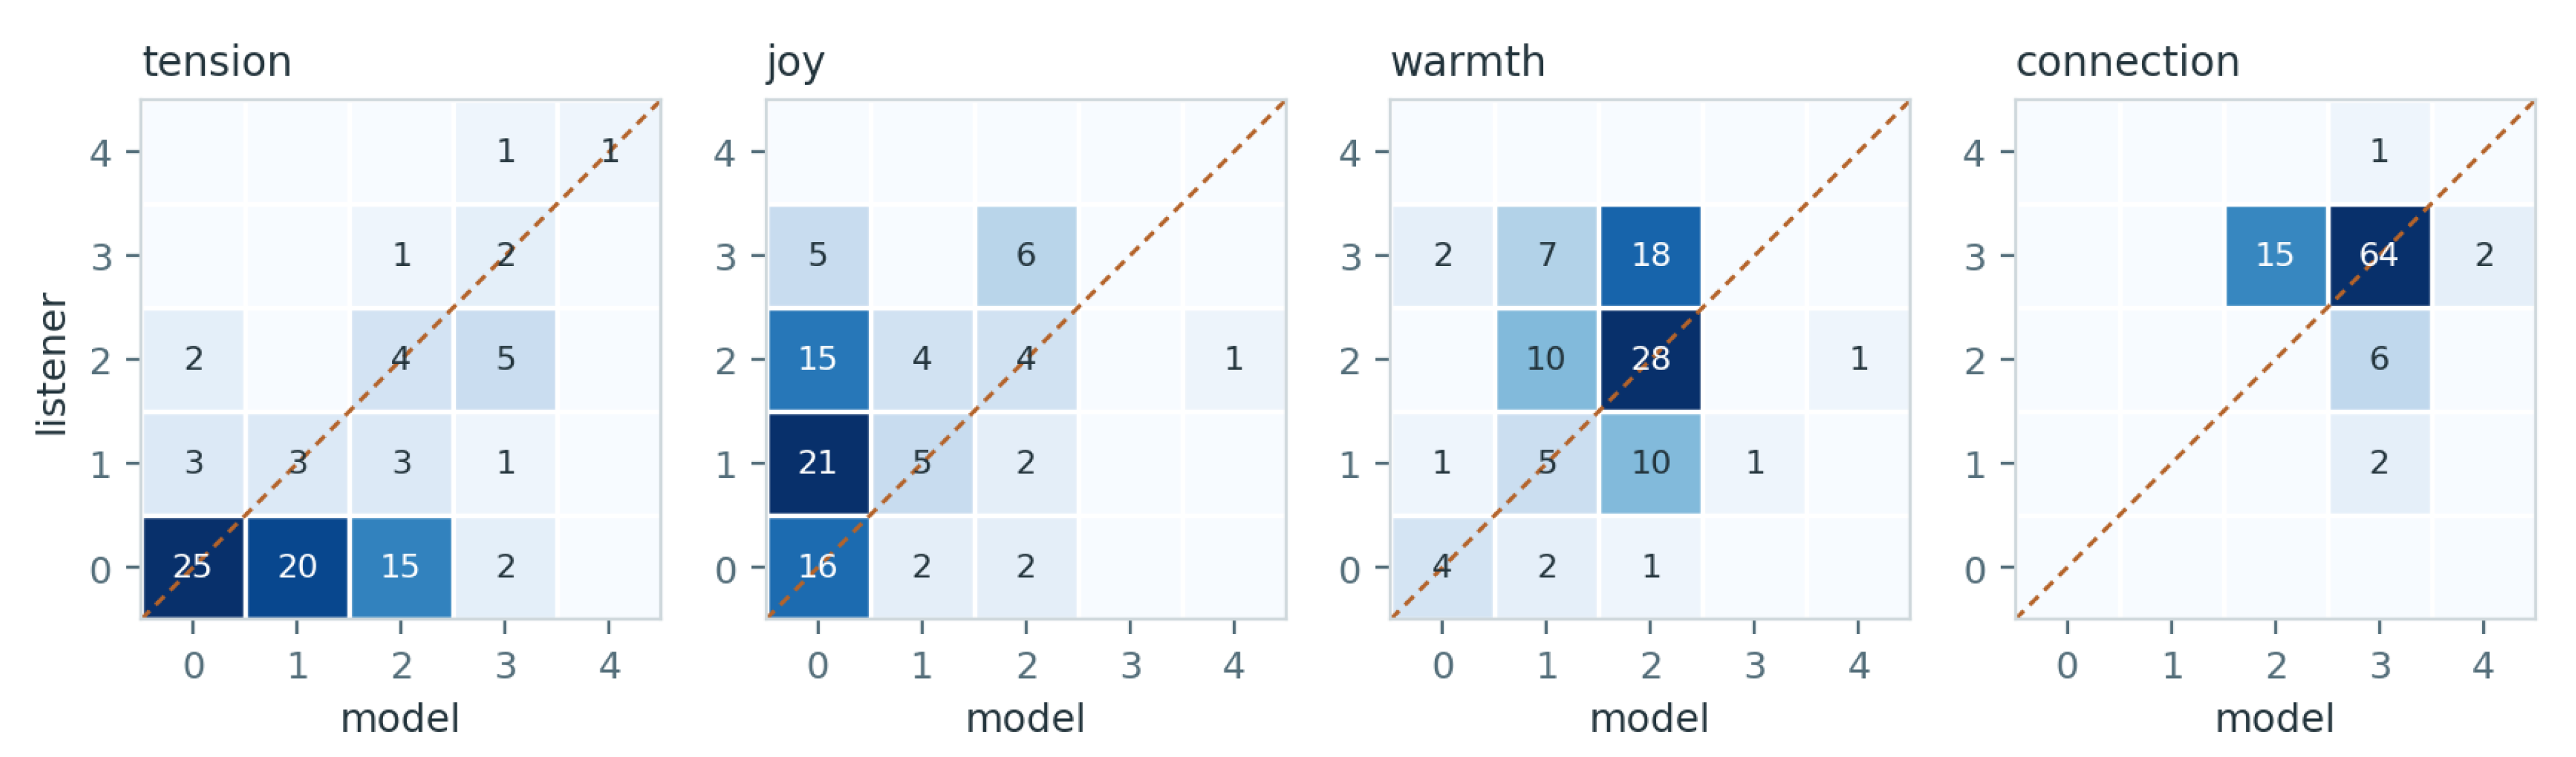
Figure 24.
Agreement against how much was said, nested cuts. Each point holds the exchanges of at least that many words, so the sample shrinks to the right; the shaded band is the 95% bootstrap interval for tension. Disjoint terciles are not used because at n≈28 per band the middle one swings (0.35, 0.04, 0.43).
Figure 24.
Agreement against how much was said, nested cuts. Each point holds the exchanges of at least that many words, so the sample shrinks to the right; the shaded band is the 95% bootstrap interval for tension. Disjoint terciles are not used because at n≈28 per band the middle one swings (0.35, 0.04, 0.43).
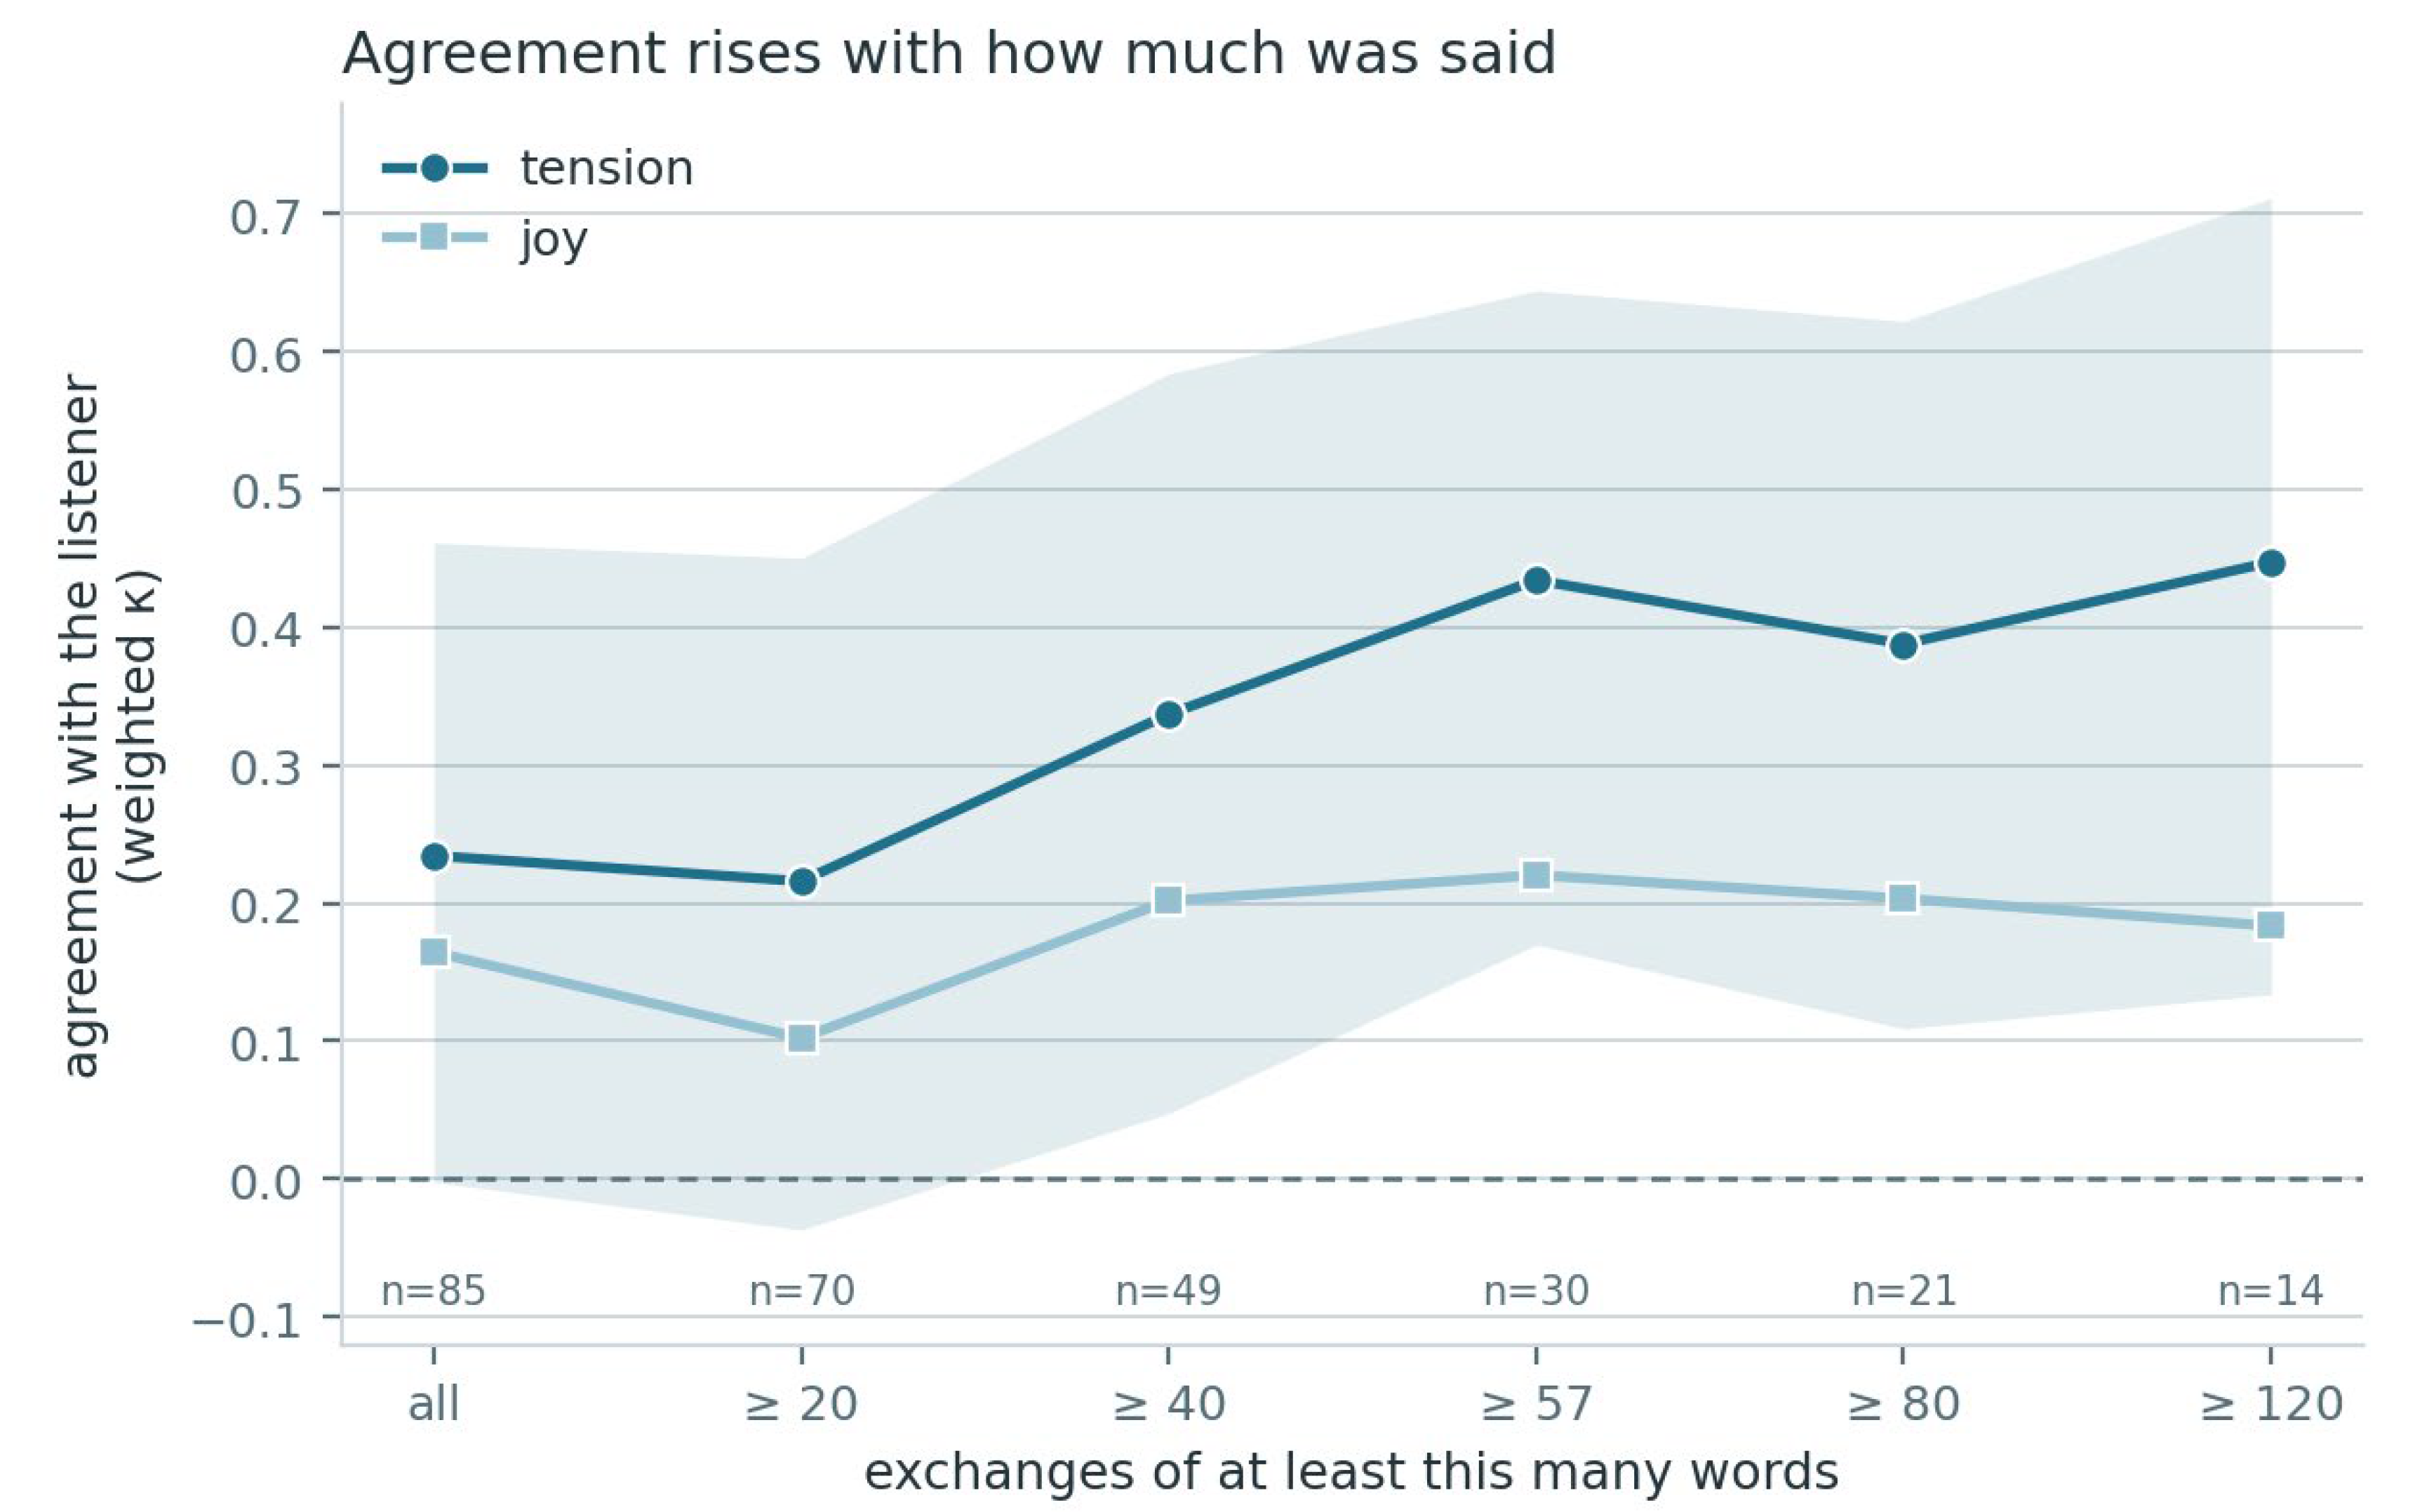
Figure 25.
Agreement after each correction, with the coder's ratings held fixed throughout. Only the pipeline changed between points. Withdrawal is omitted because coder and prompt defined it differently; the dashed line is chance agreement.
Figure 25.
Agreement after each correction, with the coder's ratings held fixed throughout. Only the pipeline changed between points. Withdrawal is omitted because coder and prompt defined it differently; the dashed line is chance agreement.
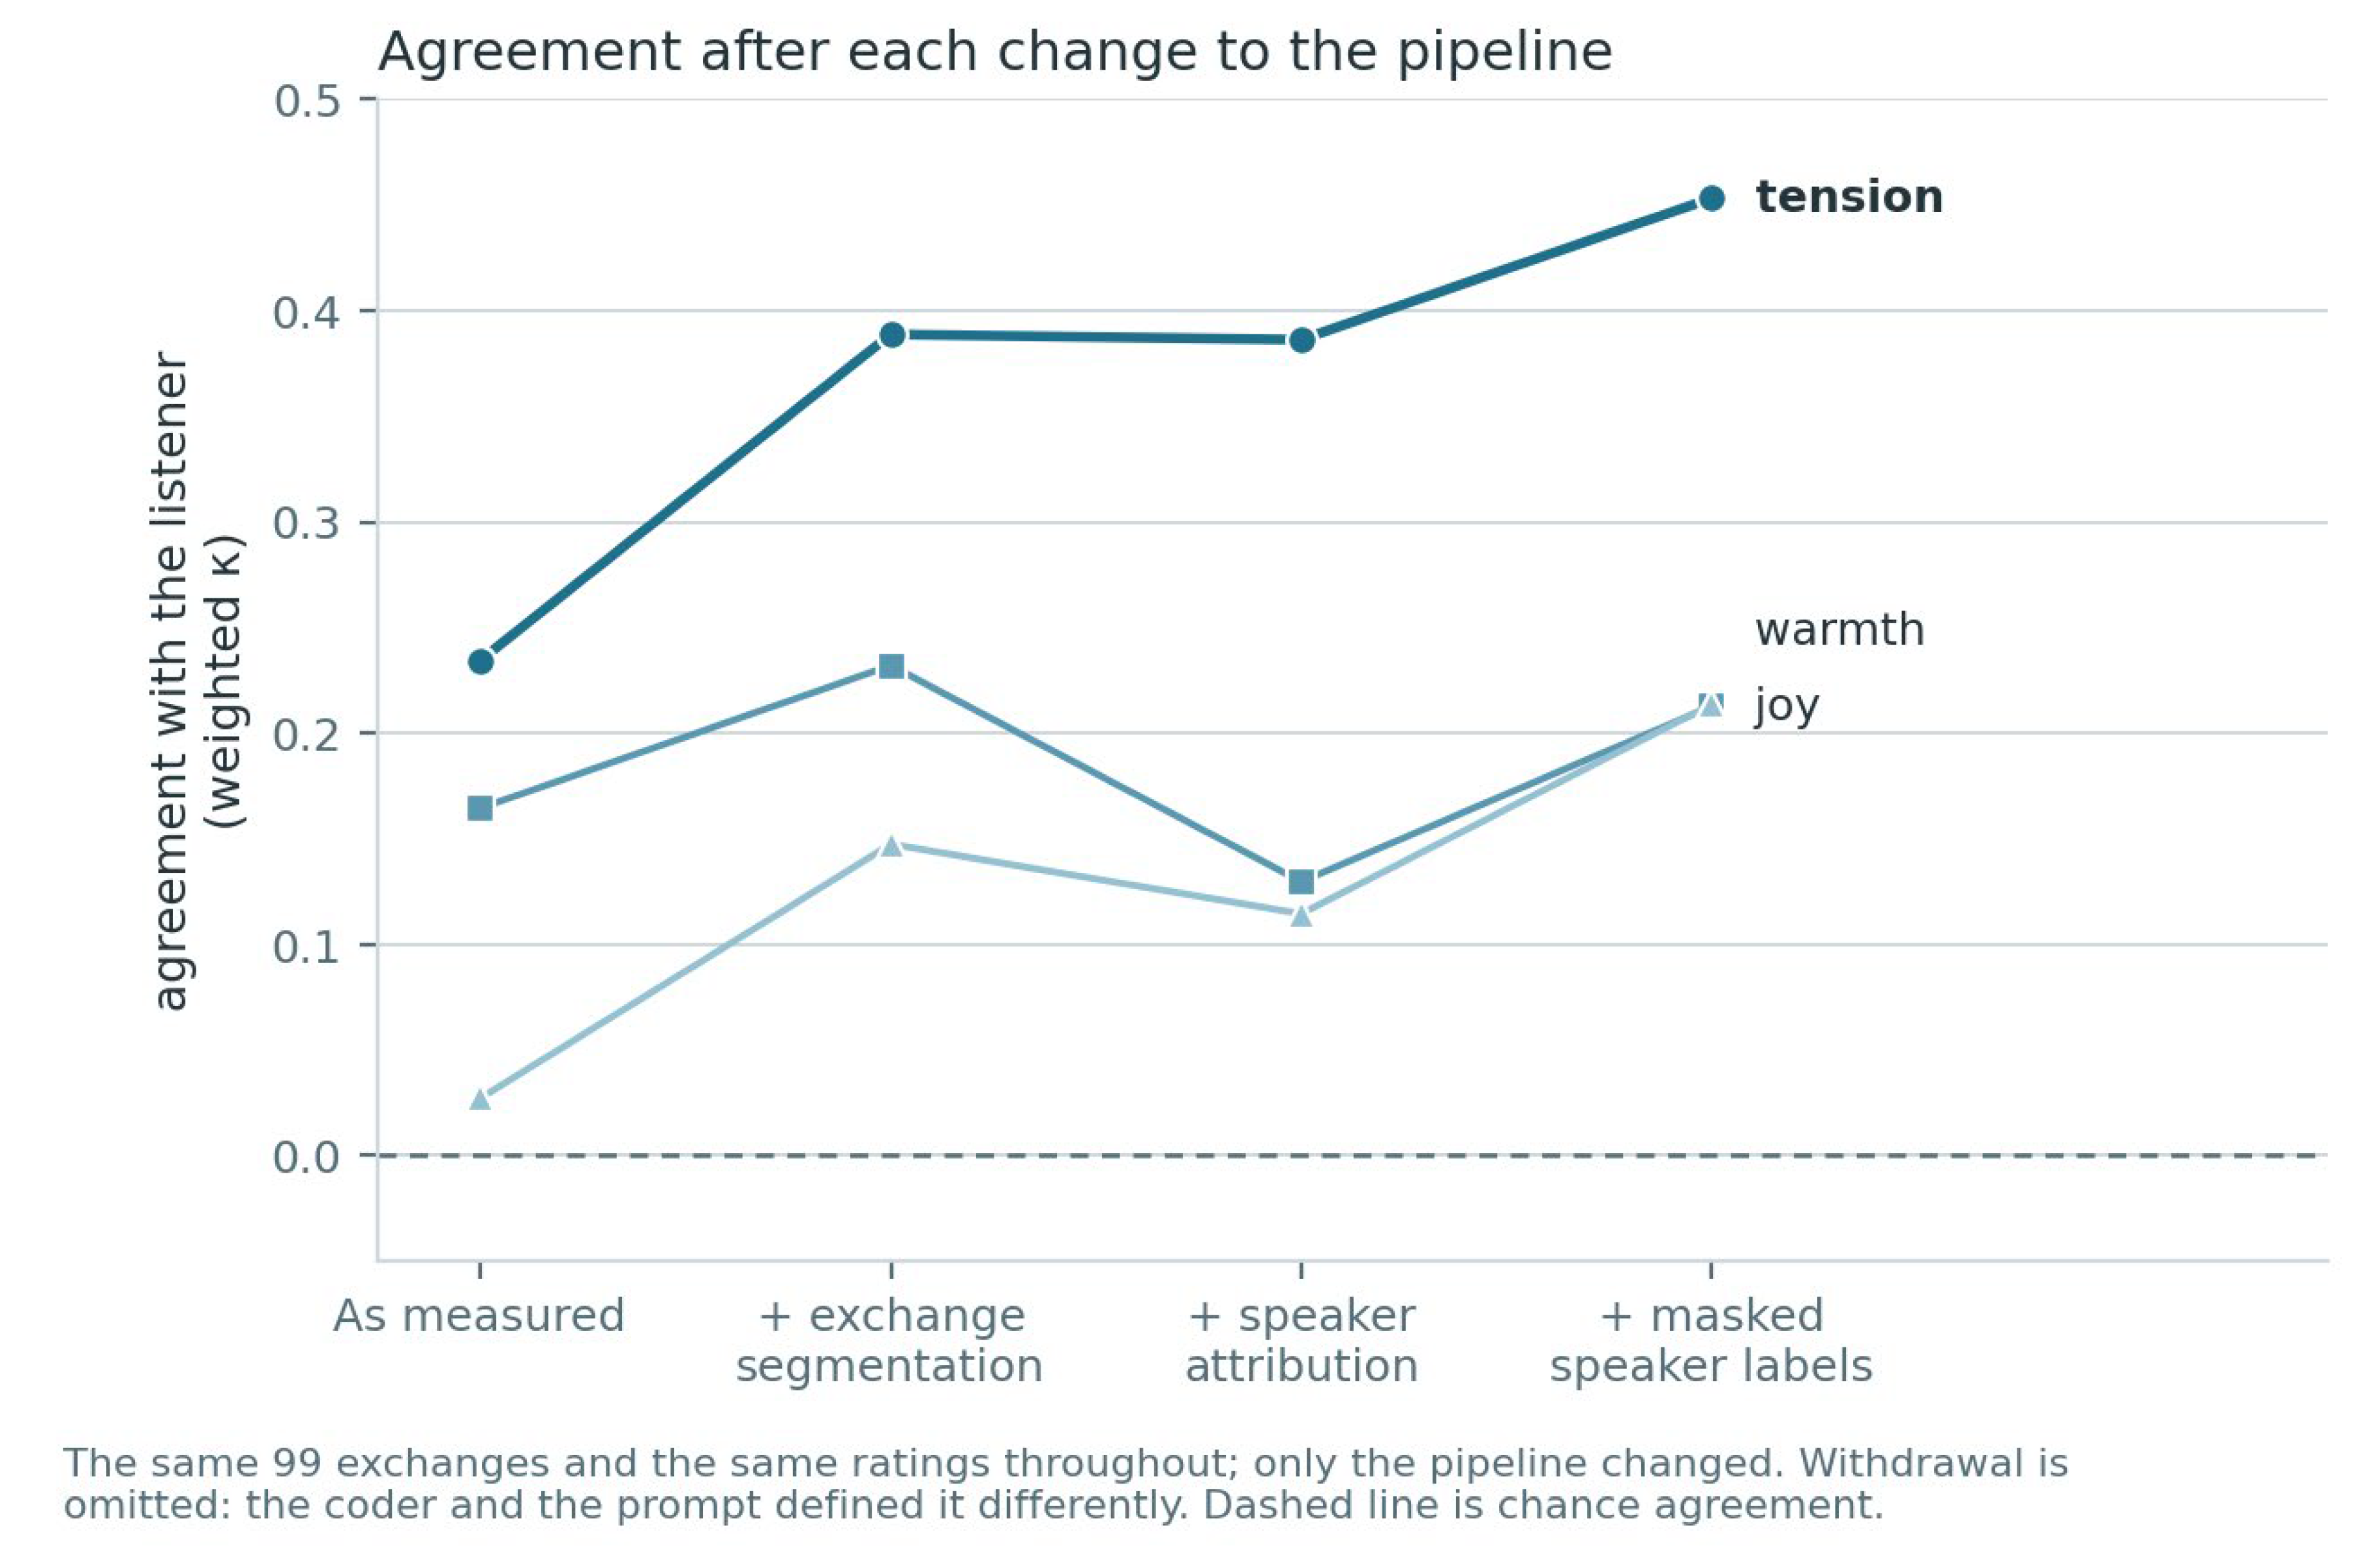
Figure 26.
Precision of resident attribution before and after the turn-share rule, against the residents the listener could hear. Grey: every resident diarisation named anywhere in the exchange. Blue: only those holding at least 15% of its turns.
Figure 26.
Precision of resident attribution before and after the turn-share rule, against the residents the listener could hear. Grey: every resident diarisation named anywhere in the exchange. Blue: only those holding at least 15% of its turns.
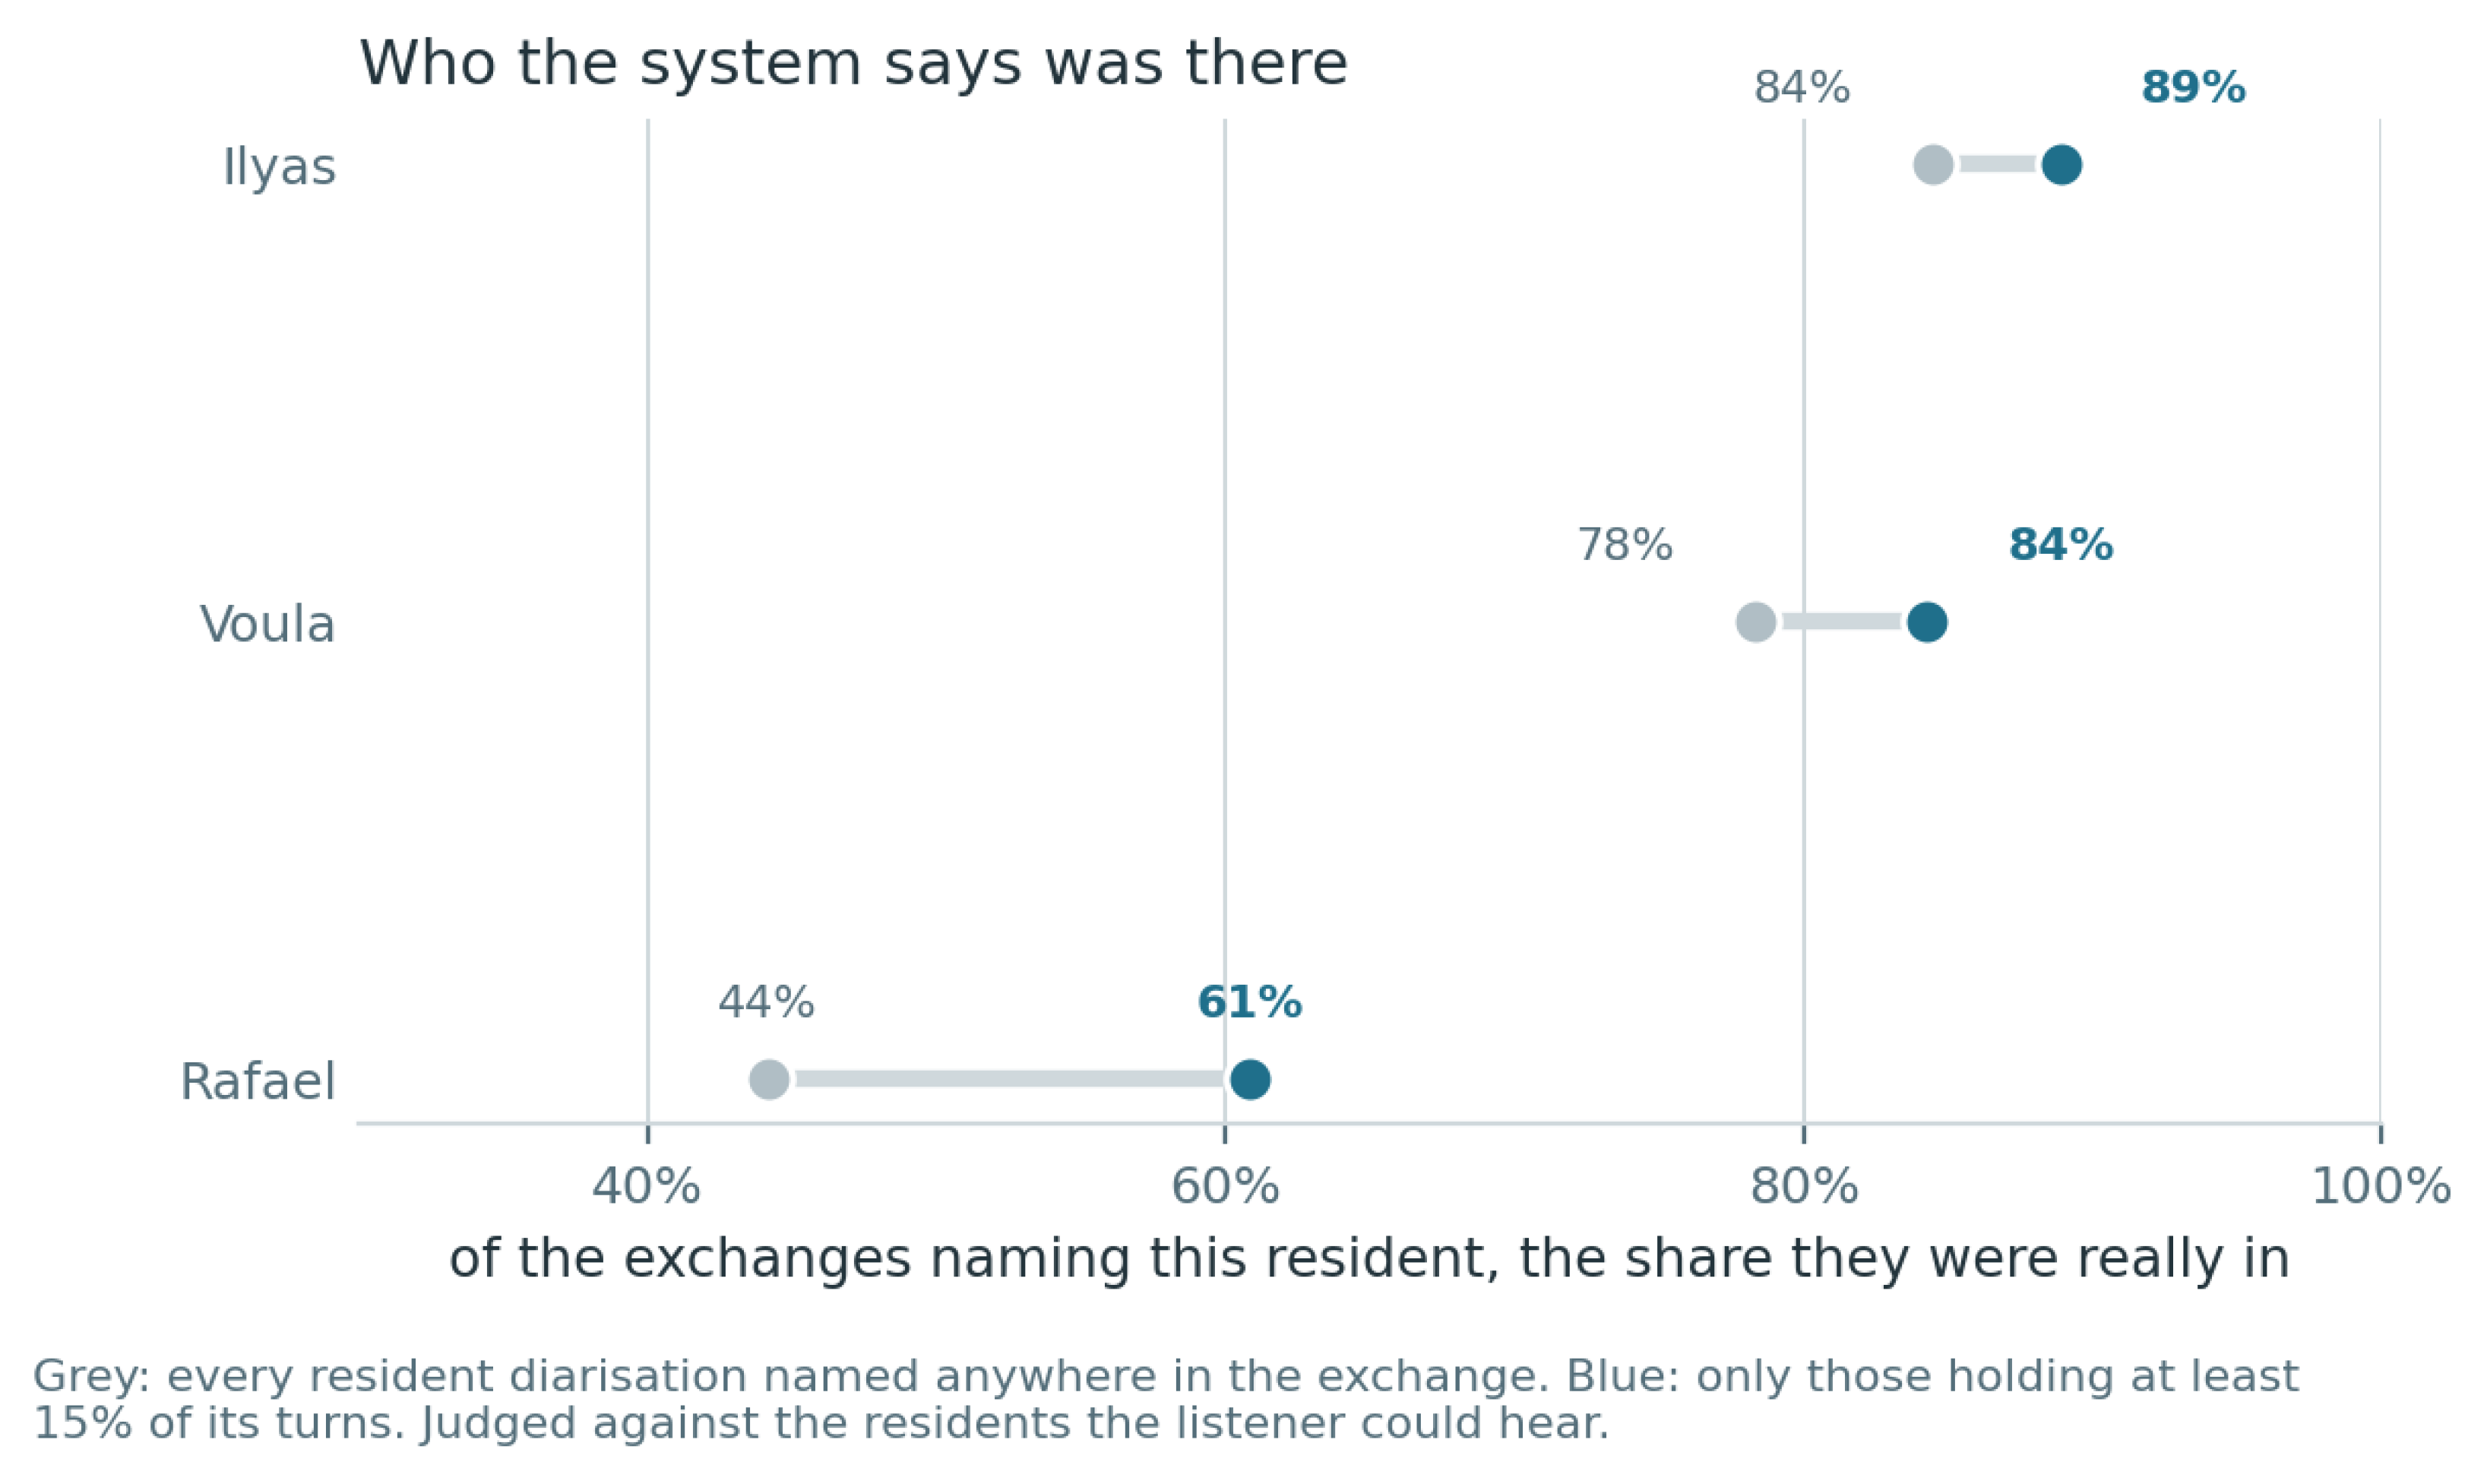
Figure 27.
Lamp operating characteristics, taking the listener's score of 2 or more as truth. The vertical line marks the threshold as shipped. Hollow markers are precisions computed over fewer than five lit exchanges, which are arithmetic rather than measurement.
Figure 27.
Lamp operating characteristics, taking the listener's score of 2 or more as truth. The vertical line marks the threshold as shipped. Hollow markers are precisions computed over fewer than five lit exchanges, which are arithmetic rather than measurement.
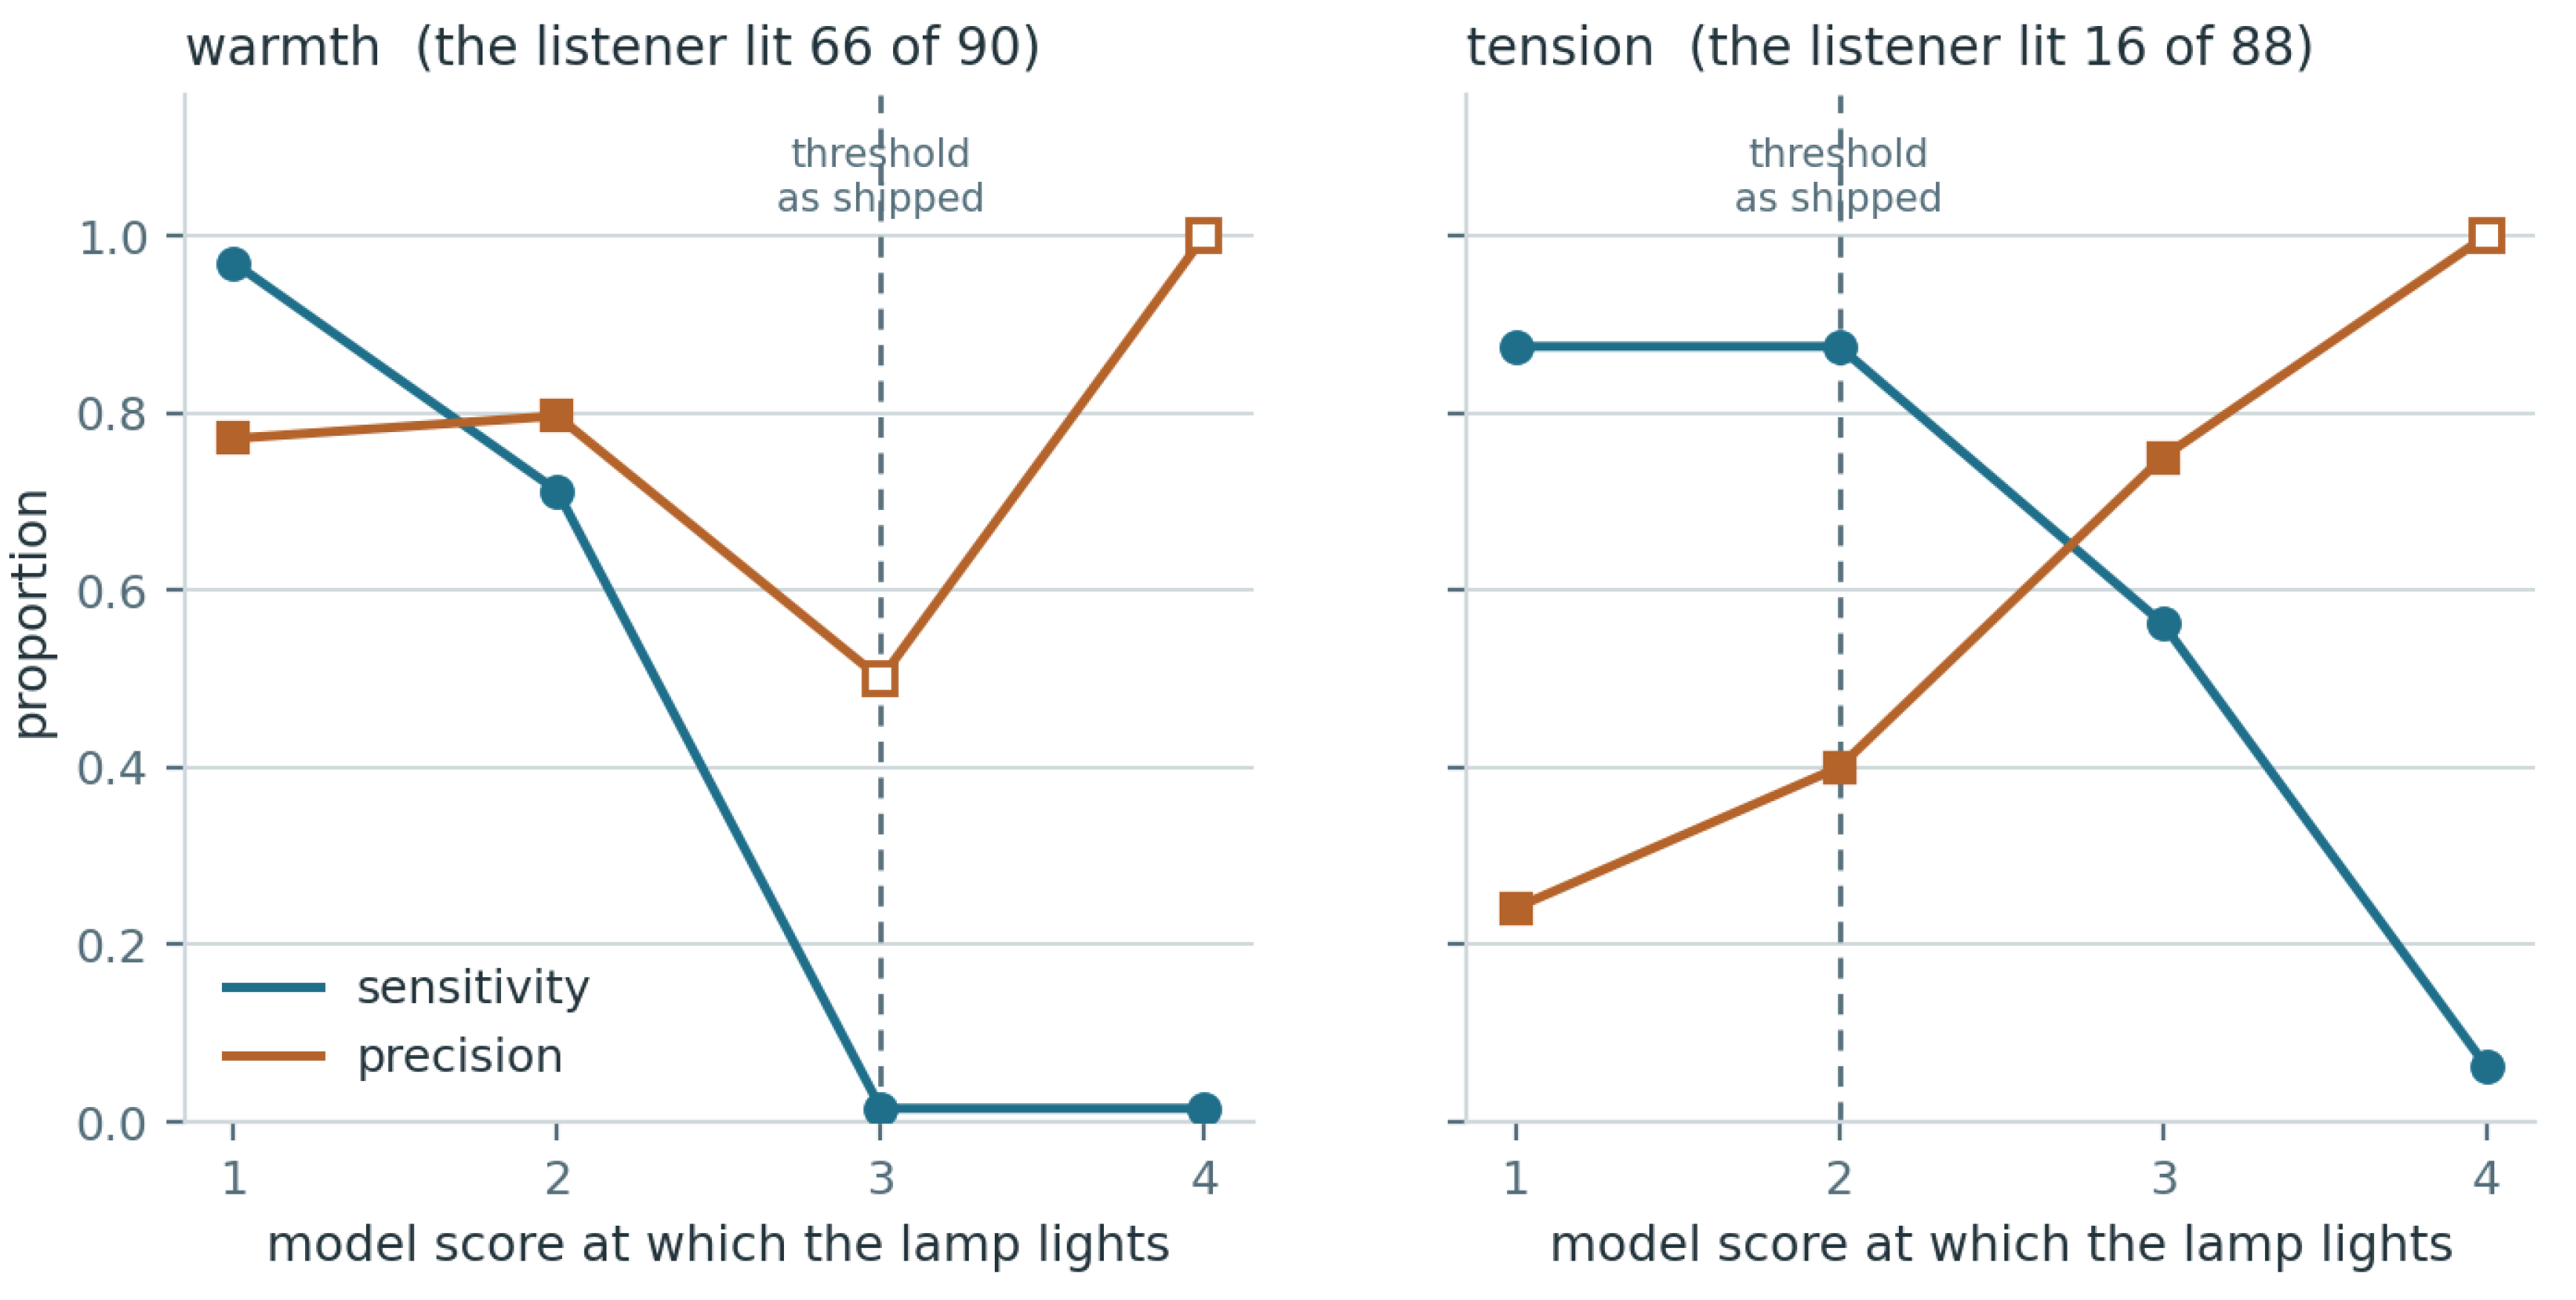
Figure 28.
Share of listed incidents that the residents confirmed, by kind, with 95% Wilson intervals. Quarrels are the kind most often listed by mistake.
Figure 28.
Share of listed incidents that the residents confirmed, by kind, with 95% Wilson intervals. Quarrels are the kind most often listed by mistake.
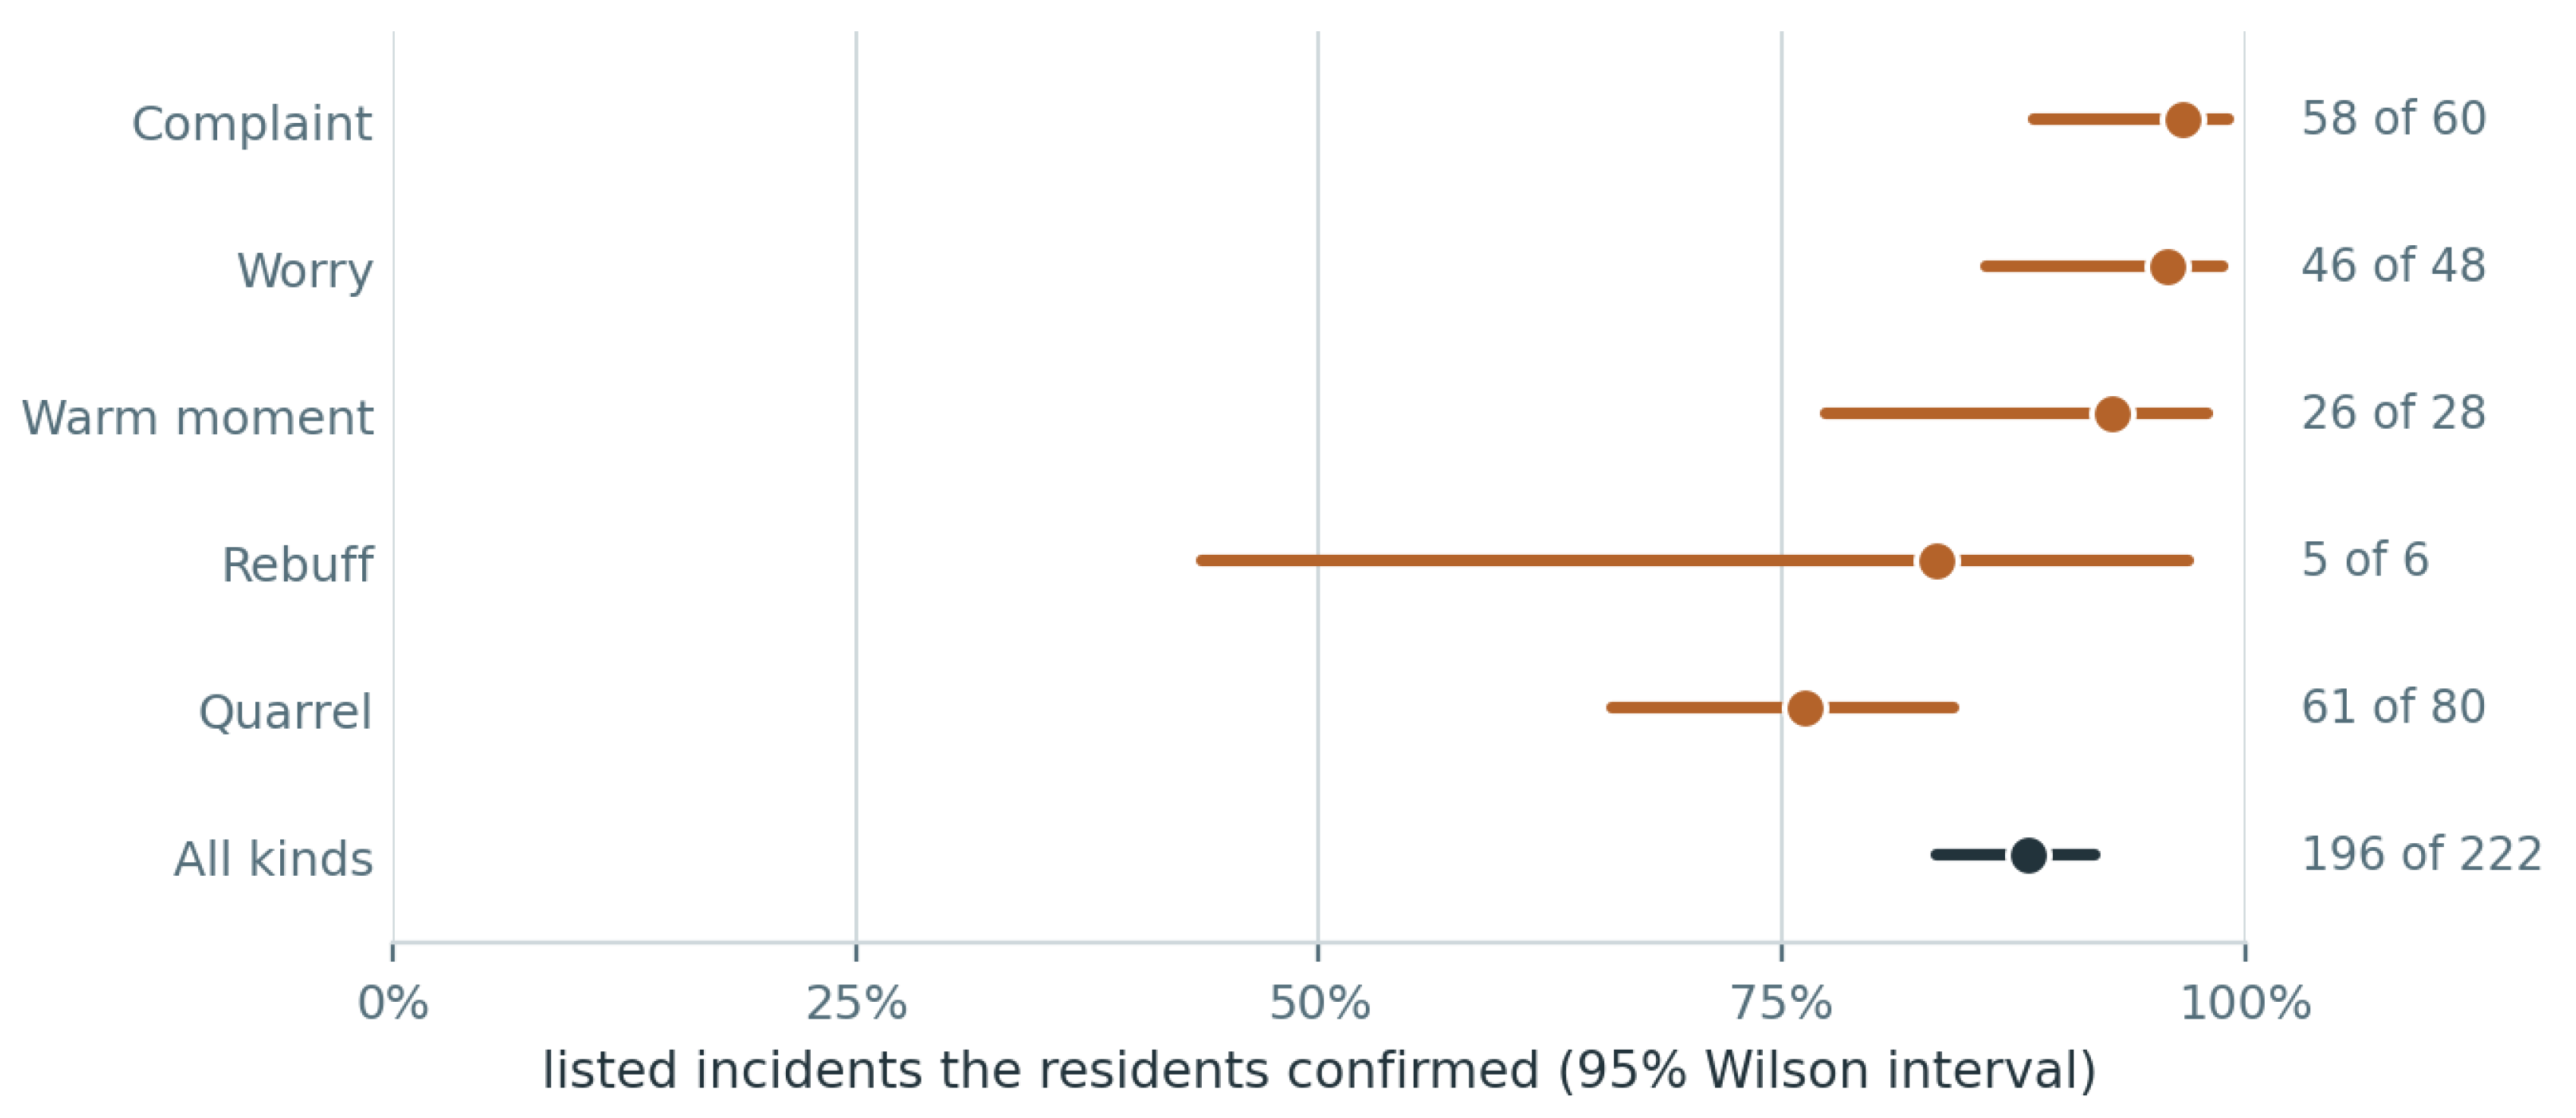
Figure 29.
Recall and precision of the incident list, from 211 five-minute windows labelled blind by a resident over 13 days. A sampled empty window stands for all the empty windows of its day; intervals come from resampling whole days.
Figure 29.
Recall and precision of the incident list, from 211 five-minute windows labelled blind by a resident over 13 days. A sampled empty window stands for all the empty windows of its day; intervals come from resampling whole days.
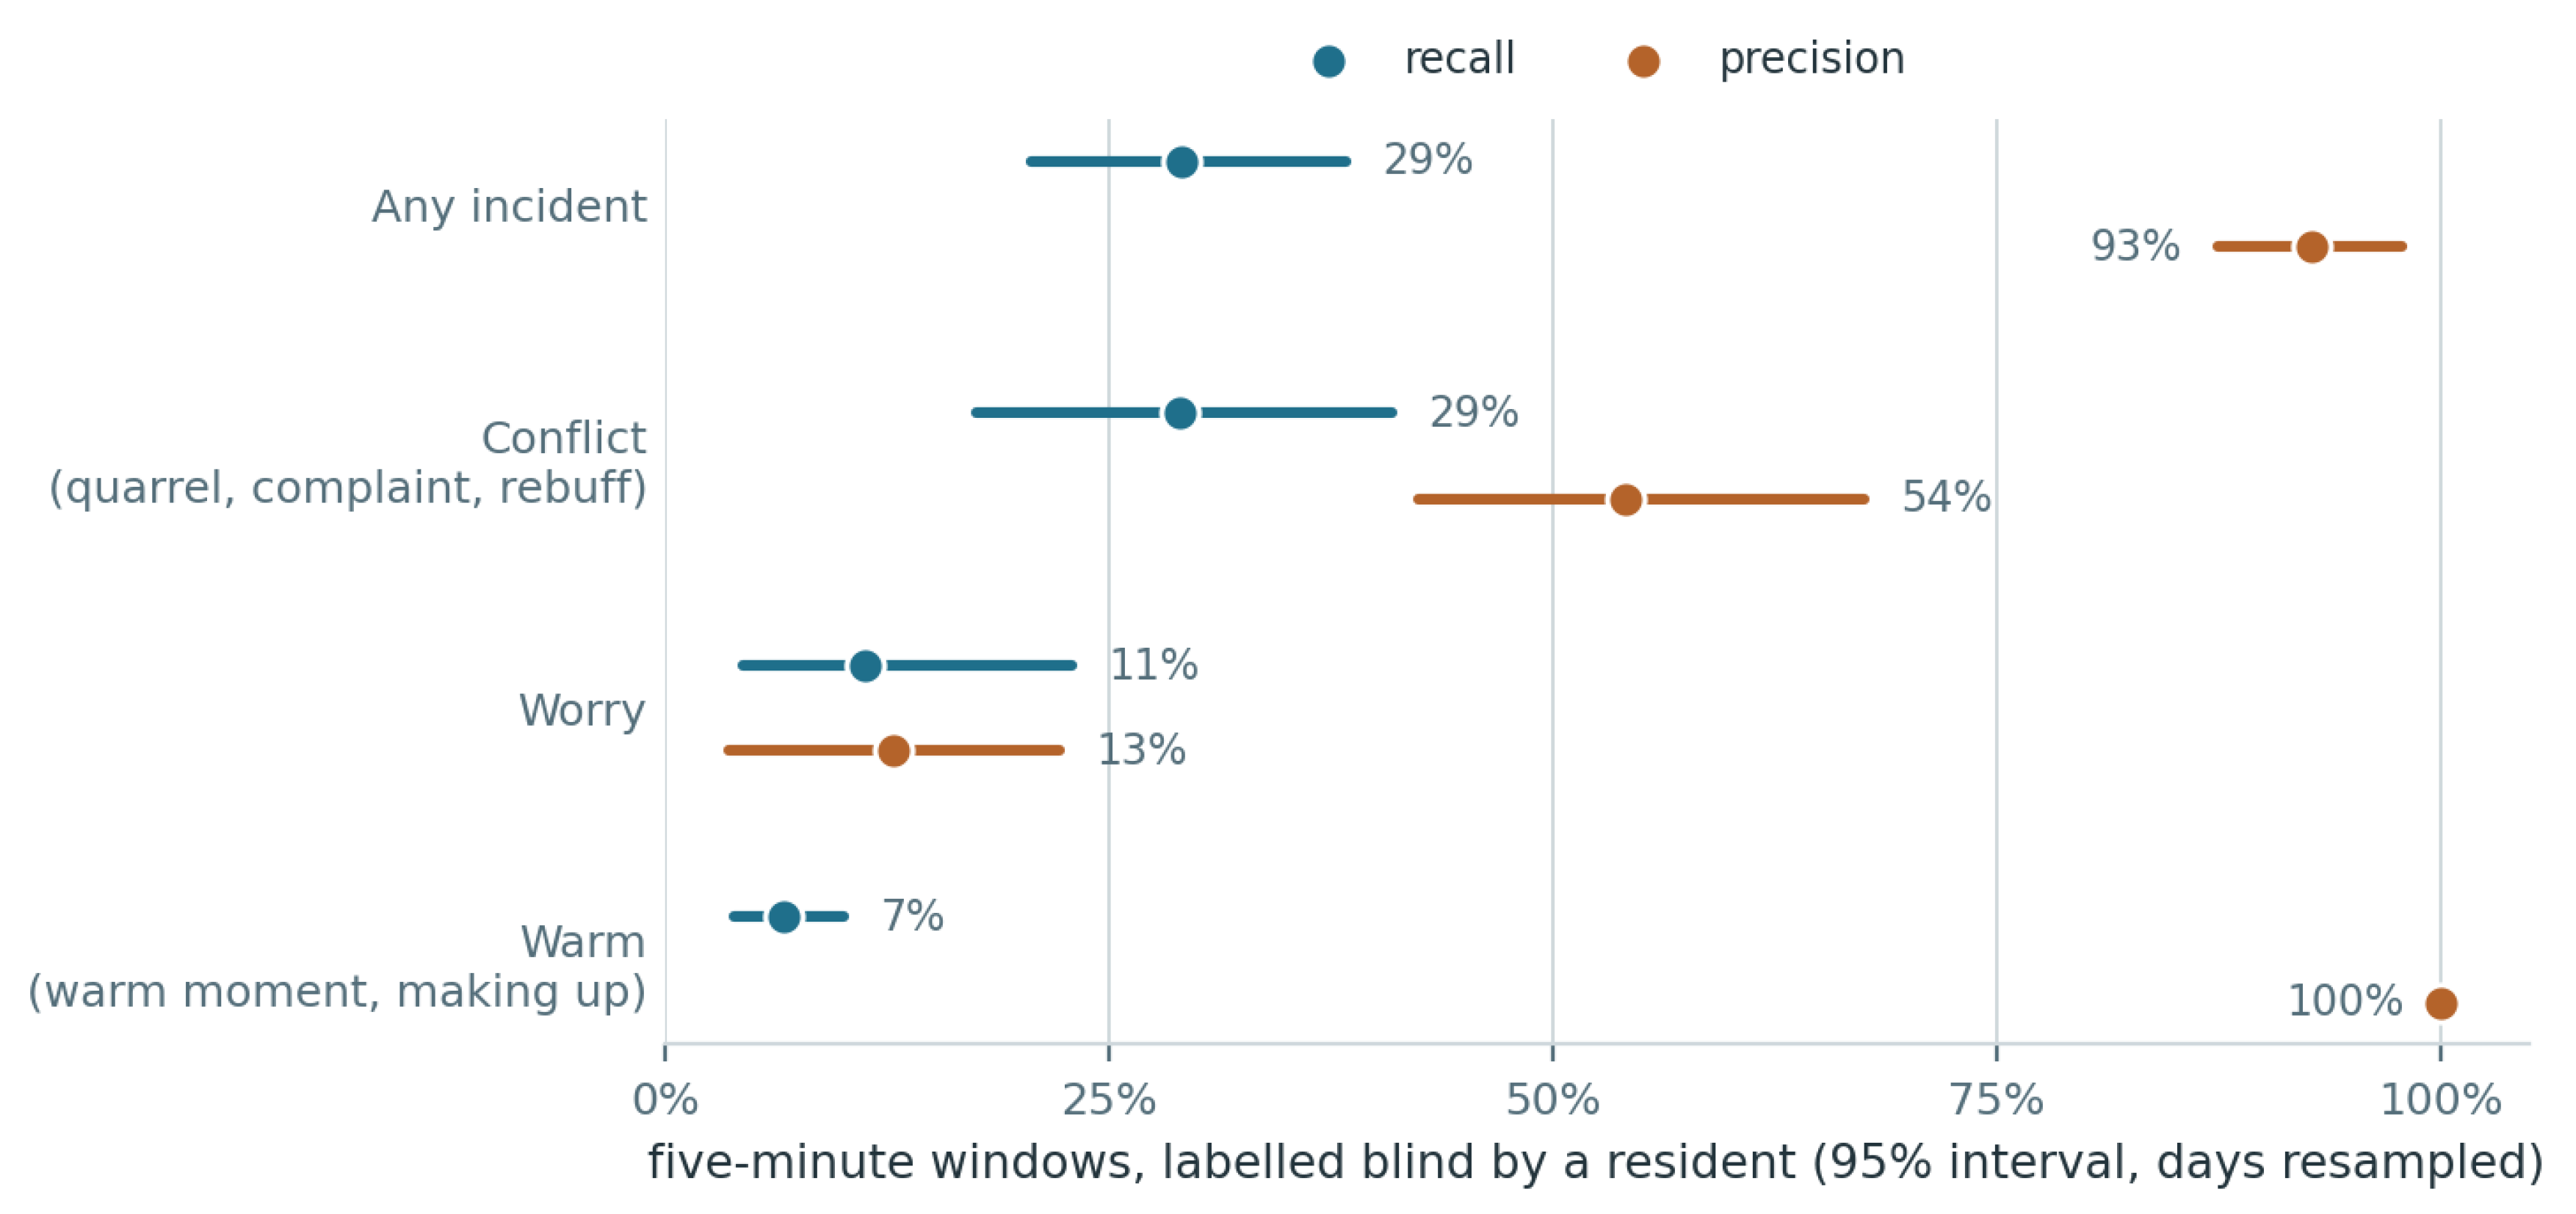

Table 1.
Evaluation corpus.
| Characteristic | Value |
| Scripted dialogues (takes) | 40 |
| Scripted lines | 219 |
| Reference words | 1356 |
| Lines per speaker | Ilyas 92, Voula 86, Rafael 41 |
| Design groups (takes) | P1 6, P2 3, P3 3, P4 1, P5 7, P6 6, P7 5, P8 9 |
| Sentinels | B1, B2 (ESP32-S3-BOX-3) and P4 (ESP32-P4), each in a different room |
| Clips delivered (B1 / B2 / P4) | 55 / 84 / 68 |
| Clips with transcribed speech (B1 / B2 / P4) | 41 / 83 / 65 |
Table 2.
Recognition of the scripted lines by the three sentinels together. CI: 95% Wilson interval for the share of lines, 95% bootstrap interval over takes for the word error rate (WER). CER: character error rate. The oracle keeps every copy and lets the alignment choose the best one for each line using the script.
Table 2.
Recognition of the scripted lines by the three sentinels together. CI: 95% Wilson interval for the share of lines, 95% bootstrap interval over takes for the word error rate (WER). CER: character error rate. The oracle keeps every copy and lets the alignment choose the best one for each line using the script.
| Condition | Lines recognised | 95% CI | WER | 95% CI | CER | Speaker correct |
| Deployed merge of the three sentinels | 200/219 (91.3%) | 86.8–94.4% | 23.5% | 19.2–28.1% | 16.9% | 194/200 (97.0%) |
| Oracle choice among the copies | 200/219 (91.3%) | 86.8–94.4% | 22.2% | 17.9–26.7% | 16.2% | 193/200 (96.5%) |
Table 3.
Recognition by speaker with the three sentinels together. The last two columns count the lines of which exactly one, or two or three, sentinels, each scored on its own, delivered a recognizable copy.
Table 3.
Recognition by speaker with the three sentinels together. The last two columns count the lines of which exactly one, or two or three, sentinels, each scored on its own, delivered a recognizable copy.
| Speaker | Lines | Recognised | WER | Lines delivered by one sentinel | Lines delivered by two or three |
| Ilyas (adult) | 92 | 86 (93.5%) | 28.0% | 57 | 27 |
| Voula (adult) | 86 | 80 (93.0%) | 16.5% | 33 | 45 |
| Rafael (child) | 41 | 34 (82.9%) | 28.6% | 26 | 6 |
Table 4.
Merging copies of one utterance heard by several sentinels. Lines lost: lines that some copy matched but that the rule removed. Residual cross-sentinel copies: surviving turns from another sentinel that best match a line already recognized.
Table 4.
Merging copies of one utterance heard by several sentinels. Lines lost: lines that some copy matched but that the rule removed. Residual cross-sentinel copies: surviving turns from another sentinel that best match a line already recognized.
| Merge rule | Turns passed on | Copies removed | Lines lost | Residual cross-sentinel copies | Lines recognised | WER |
| No merge | 347 | 0 | 0 | 92 | 200/219 | 22.2% |
| Containment only | 247 | 100 | 7 | 11 | 193/219 | 25.0% |
| Containment + same speaker | 265 | 82 | 0 | 19 | 200/219 | 23.5% |
Table 5.
Speaker identification on the recognized lines.
| Speaker | Precision | Recall | F1 | Support |
| Ilyas | 98.8% | 94.2% | 0.96 | 86 |
| Voula | 96.4% | 100.0% | 0.98 | 80 |
| Rafael | 94.3% | 97.1% | 0.96 | 34 |
| Macro average | 0.97 | accuracy 97.0%, κ = 0.95 |
κ: Cohen's kappa.
Table 6.
The relational reading from the original text and from the recordings. Three independent readings of each of the 40 takes per condition. Takes assigned: leave-one-out nearest-centroid classification into the eight design groups.
Table 6.
The relational reading from the original text and from the recordings. Three independent readings of each of the 40 takes per condition. Takes assigned: leave-one-out nearest-centroid classification into the eight design groups.
| Measure | Original text | Recordings |
| Readings with usable scores | 120/120 | 120/120 |
| Run-to-run stability, ICC(2,1), range over dimensions | 0.54–0.92 | 0.58–0.92 |
| Mean difference between runs, range over dimensions | 0.02–0.11 | 0.03–0.12 |
| Agreement with the reading of the original text, MAE (range over dimensions) | reference | 0.05–0.14 |
| Agreement with the reading of the original text, Pearson r (range over dimensions) | reference | 0.59–0.88 |
| Pre-specified orderings holding, 95% CI excluding zero | 10/10 | 10/10 |
| Orderings with one-sided Mann–Whitney p < 0.05 | 9/9 | 7/9 |
| Paired contrasts holding | 8/8 | 8/8 |
| Takes assigned to their design group (nearest centroid; chance 12.5%) | 19/40 (47.5%) | 16/40 (40.0%) |
| Open-conflict takes assigned correctly | 7/7 | 7/7 |
| Repair recognised in the repair takes (share of readings) | 63% | 48% |
| Repair asserted in the other takes (share of readings) | 5% | 2% |
Table 7.
Run-to-run stability of the relational reading (3 independent runs per take).
| Dimension | ICC(2,1), original text | ICC(2,1), recording | Mean |Δ| between runs, original text | Mean |Δ| between runs, recording |
| Warmth | 0.85 | 0.87 | 0.08 | 0.08 |
| Joy | 0.91 | 0.91 | 0.02 | 0.05 |
| Withdrawal | 0.62 | 0.65 | 0.05 | 0.03 |
| Tension | 0.92 | 0.92 | 0.06 | 0.05 |
ICC(2,1): two-way random effects, absolute agreement, single rating, over takes scored in every run.
Table 8.
Agreement between the reading of the recording and the reading of the original text. Per-take means over runs. Bias: mean of recording minus original text. p-values in parentheses. Takes: takes scored on that dimension in both conditions.
Table 8.
Agreement between the reading of the recording and the reading of the original text. Per-take means over runs. Bias: mean of recording minus original text. p-values in parentheses. Takes: takes scored on that dimension in both conditions.
| Dimension | Takes | MAE | Bias | Pearson r | Spearman ρ | Within ±0.25 |
| Warmth | 40 | 0.12 | +0.03 | 0.79 (< 0.001) | 0.80 (< 0.001) | 38 (95%) |
| Joy | 40 | 0.06 | +0.06 | 0.88 (< 0.001) | 0.84 (< 0.001) | 36 (90%) |
| Withdrawal | 40 | 0.05 | −0.03 | 0.66 (< 0.001) | 0.43 (0.005) | 38 (95%) |
| Tension | 40 | 0.10 | −0.02 | 0.83 (< 0.001) | 0.83 (< 0.001) | 38 (95%) |
Table 9.
Pre-specified orderings between design groups. Δ: difference between group means on the 0–1 scale; 95% bootstrap interval resampling takes within groups. p: one-sided Mann–Whitney U on the recordings; not computed where a group holds a single take. Groups: P1 Warmth & support; P2 Joy & play; P3 Calm & agreed boundary; P4 Cold / logistics-only; P5 Open conflict; P6 Covert hostility & control; P7 Withdrawal & neglect; P8 Repair after conflict.
Table 9.
Pre-specified orderings between design groups. Δ: difference between group means on the 0–1 scale; 95% bootstrap interval resampling takes within groups. p: one-sided Mann–Whitney U on the recordings; not computed where a group holds a single take. Groups: P1 Warmth & support; P2 Joy & play; P3 Calm & agreed boundary; P4 Cold / logistics-only; P5 Open conflict; P6 Covert hostility & control; P7 Withdrawal & neglect; P8 Repair after conflict.
| Ordering | Groups (n) | Original text: Δ [95% CI] | Recording: Δ [95% CI] | Recording: p |
| Tension: P5 > P1 | 7 vs 6 | +0.69 [+0.61, +0.78] | +0.67 [+0.58, +0.75] | < 0.001 |
| Tension: P5 > P3 | 7 vs 3 | +0.47 [+0.25, +0.73] | +0.49 [+0.25, +0.73] | 0.005 |
| Tension: P6 > P1 | 6 vs 6 | +0.35 [+0.14, +0.56] | +0.25 [+0.04, +0.43] | 0.051 |
| Warmth: P1 > P5 | 6 vs 7 | +0.63 [+0.53, +0.73] | +0.55 [+0.38, +0.75] | 0.002 |
| Warmth: P1 > P6 | 6 vs 6 | +0.36 [+0.18, +0.54] | +0.36 [+0.14, +0.60] | 0.015 |
| Warmth: P8 > P5 | 9 vs 7 | +0.41 [+0.34, +0.47] | +0.25 [+0.12, +0.38] | 0.005 |
| Joy: P2 > P5 | 3 vs 7 | +0.50 [+0.50, +0.50] | +0.64 [+0.50, +0.92] | 0.002 |
| Withdrawal: P7 > P1 | 5 vs 6 | +0.36 [+0.19, +0.52] | +0.20 [+0.03, +0.43] | 0.024 |
| Withdrawal: P7 > P2 | 5 vs 3 | +0.38 [+0.23, +0.53] | +0.20 [+0.03, +0.43] | 0.084 |
Table 10.
Paired contrasts between single takes. Values are per-take means over runs; each contrast compares two single takes.
Table 10.
Paired contrasts between single takes. Values are per-take means over runs; each contrast compares two single takes.
| Contrast | Original text | Recording | Holds (text / recording) |
| #16 vs #17: parent-child conflict → repair | warmth 0.08 < 0.50; tension 0.67 > 0.25 | warmth 0.00 < 0.50; tension 0.75 > 0.25 | yes / yes |
| #20 vs #21: resentment → repair | warmth 0.00 < 0.50; tension 0.75 ≥ 0.25 | warmth 0.25 < 0.50; tension 0.75 ≥ 0.25 | yes / yes |
| #30 vs #31: money conflict → repair | warmth 0.00 < 0.53; tension 0.75 ≥ 0.27 | warmth 0.17 < 0.50; tension 0.75 ≥ 0.33 | yes / yes |
| #2 vs #40: criticism → genuine repair | warmth 0.00 < 0.33; tension 0.75 ≥ 0.75 | warmth 0.17 < 0.42; tension 0.67 ≥ 0.67 | yes / yes |
| #14 vs #28: cold vs calm (same low activation) | warmth 0.33 < 0.62 | warmth 0.08 < 0.50 | yes / yes |
| #3 vs #1: sarcasm vs genuine warmth (both use kind words) | warmth 0.50 < 0.75 | warmth 0.67 < 1.00 | yes / yes |
| #16 vs #24: conflict vs play (both high arousal) | tension 0.67 > 0.50 | tension 0.75 > 0.25 | yes / yes |
| #37 vs #22: neglected bid vs comforted child | warmth 0.25 < 0.50; withdrawal 0.58 > 0.00 | warmth 0.17 < 0.50; withdrawal 0.67 > 0.00 | yes / yes |
Table 11.
Evaluation corpus.
| Characteristic | Value |
| Window | 2026-09-15 to 2026-09-19 (five consecutive days) |
| Clips delivered in the window | 17,429 |
| Clips passed by the speech gate | 7,053 |
| Clips rejected by the gate (no audio retained) | 10,376 |
| Clips sampled and frozen | 250 (random, seed 20260825) |
| Clips annotated completely | 149 |
| Clips skipped | 101 (40.4%) |
| Annotated clips by day (15–19 Sep) | 34 / 16 / 27 / 30 / 42 |
| Annotated clips by room | Bedroom_2 49, Entrance 36, Kitchen 31, Lab 18, Bedroom_1 13, WC 2 |
| Listener's verdict: speech present | 117 of 149 |
| Listener's verdict: no speech | 32 of 149 |
| Speech clips with one resident speaking | 69 (Ilyas 28, Voula 36, Rafael 5) |
| Speech clips with more than one speaker | 39 |
| Speech clips of a non-resident voice | 7 |
| Speech clips the listener could not attribute | 2 |
| Clips with a reference transcript | 95 |
| Speech clips the listener could not transcribe | 22 |
| Reference words | 1,613 |
Table 12.
Speaker identification on clips with a single resident speaking. Rafael's row rests on five clips and is not quotable. κ: Cohen's kappa over the three residents, computed on the clips where the system returned a name.
Table 12.
Speaker identification on clips with a single resident speaking. Rafael's row rests on five clips and is not quotable. κ: Cohen's kappa over the three residents, computed on the clips where the system returned a name.
| Speaker | Precision | Recall | F1 | Clips |
| Ilyas (adult) | 95.5% | 75.0% | 0.84 | 28 |
| Voula (adult) | 95.7% | 61.1% | 0.75 | 36 |
| Rafael (child) | 50.0% | 40.0% | 0.44 | 5 |
| Macro average | 0.68 | accuracy 65.2%, balanced accuracy 58.7% | ||
| Among clips where a name was returned | 45/49 (91.8%) | κ = 0.855 |
Table 13.
Affect label by class. Angry and sad rest on one clip each and are not quotable. Baseline: accuracy of answering "neutral" for every clip in the same sample.
Table 13.
Affect label by class. Angry and sad rest on one clip each and are not quotable. Baseline: accuracy of answering "neutral" for every clip in the same sample.
| Class | Precision | Recall | F1 | Clips |
| Neutral | 90.8% | 76.7% | 0.83 | 103 |
| Happy | 6.3% | 12.5% | 0.08 | 8 |
| Angry | 0.0% | 0.0% | 0.00 | 1 |
| Sad | 0.0% | 0.0% | 0.00 | 1 |
| Macro average | 0.23 | accuracy 70.8%, baseline 91.2%, κ = −0.02 |
Table 14.
Agreement with the listener, 83-90 exchanges per dimension.
| dimension | exact | within 1 | kappa | 95% CI | bias |
| tension | 39.8% | 77.3% | 0.45 | [0.25, 0.61] | +0.65 |
| warmth | 41.1% | 86.7% | 0.21 | [-0.02, 0.41] | -0.34 |
| joy | 30.1% | 72.3% | 0.21 | [0.05, 0.37] | -0.80 |
Bias is the interpreter minus the listener, in scale points. Withdrawal is excluded; see the text.
Table 15.
The five query types, plus recall, and how each was measured.
| Query type | Required evaluation | Measure | Section |
| Event retrieval | Did the system retrieve the relevant event? | Share of listed incidents the residents confirmed; accuracy of dated yes/no questions | 3.4.3, 3.4.5 |
| Temporal retrieval | Did it identify the correct day or time interval? | Day-level accuracy; clock times in answers checked against the record | 3.4.6 |
| Person attribution | Did it retrieve the correct resident's observations? | Accuracy of questions naming one resident; confirmation rate by resident | 3.4.5 |
| Relational retrieval | Did it retrieve evidence relevant to the dyadic interaction? | Accuracy of questions naming a pair; confirmation rate by pair | 3.4.5 |
| Negative query | Did it correctly state that the evidence is absent? | Answers on days when the thing asked about did not happen, or the day was not read | 3.4.5 |
| Recall | Did the list contain the incidents that happened? | Blind labelling of sampled five-minute windows | 3.4.4 |
Proportions are given with 95% intervals: Wilson intervals for simple counts, and intervals from resampling whole days for the recall estimates.
Table 16.
Listed incidents confirmed by the residents, by kind.
| Kind | Listed | Confirmed | Rejected | Precision | 95% interval |
| Complaint | 60 | 58 | 2 | 97% | 89% to 99% |
| Worry | 48 | 46 | 2 | 96% | 86% to 99% |
| Warm moment | 28 | 26 | 2 | 93% | 77% to 98% |
| Rebuff | 6 | 5 | 1 | 83% | 44% to 97% |
| Quarrel | 80 | 61 | 19 | 76% | 66% to 84% |
| All kinds | 222 | 196 | 26 | 88% | 83% to 92% |
27 days, 29 September to 26 October 2026; every listed incident judged. No reconciliation was listed.
Table 17.
Recall and precision from the blind labels, by group of kinds.
| Group | Recall | 95% interval | Precision | 95% interval |
| Any incident | 29% | 21% to 38% | 93% | 88% to 98% |
| Conflict (quarrel, complaint, rebuff) | 29% | 18% to 41% | 54% | 42% to 67% |
| Worry | 11% | 4% to 23% | 13% | 4% to 22% |
| Warm (warm moment, reconciliation) | 7% | 4% to 10% | 100% | - |
211 windows on 13 days. Recall and precision are weighted so that sampled empty windows count for all the empty windows of their day.
Table 18.
Dated questions put to the full system, scored against the residents' confirmations.
| Question | n | Planner correct | Answer correct | Positive answered yes | Negative answered no |
| Was there a <kind> on <date>? | 60 | 60 | 57 (95%, 86-98%) | 29 of 29 | 28 of 31 |
| Was <person> in a quarrel on <date>? | 30 | 30 | 24 (80%, 63-90%) | 15 of 15 | 9 of 15 |
| Did <A> and <B> quarrel on <date>? (first version) | 30 | 30 | 8 (27%, 14-44%) | 8 of 8 | 0 of 22 |
| Did <A> and <B> quarrel on <date>? (after the fix) | 30 | 30 | 27 (90%, 74-97%) | 8 of 8 | 19 of 22 |
| The same question on a day not read | 3 | 3 | 2 declined | - | - |
Table 19.
Errors by layer.
| Layer | What was measured | Result |
| Incident list (reader) | Listed incidents confirmed | 196 of 222 (88%); 19 of 26 errors are quarrels |
| Incident list (reader) | Recall of windows with an incident | 29% (21% to 38%) |
| Incident list (reader) | Kind agreement with the resident | kappa 0.10 to 0.25 |
| Planner | Correct operation, kind, day and people | 123 of 123 after the fix, 121 of 123 before |
| Retrieval (no model) | Verdict agrees with the list | 123 of 123 after the pair fix |
| Answer writer | Verdict agrees with the retrieval | 122 of 123 |
| Answer writer | Clock times found in the retrieved records | 199 of 199 |
Disclaimer/Publisher’s Note: The statements, opinions and data contained in all publications are solely those of the individual author(s) and contributor(s) and not of MDPI and/or the editor(s). MDPI and/or the editor(s) disclaim responsibility for any injury to people or property resulting from any ideas, methods, instructions or products referred to in the content. |
© 2026 by the authors. Licensee MDPI, Basel, Switzerland. This article is an open access article distributed under the terms and conditions of the Creative Commons Attribution (CC BY) license (http://creativecommons.org/licenses/by/4.0/).
Copyright: This open access article is published under a Creative Commons CC BY 4.0 license, which permit the free download, distribution, and reuse, provided that the author and preprint are cited in any reuse.