
Submitted:
06 November 2026
Posted:
09 November 2026
You are already at the latest version
Abstract
The safety of construction workers has been a major issue because of the substantial number of accidents and fatalities caused by ignoring hazards. Notwithstanding all these attempts, not all the approaches adopted by the industry have effectively achieved the required results. Some strategies could not make substantial progress or help tackle the unique issues of construction safety performance. This demonstrates the complexities of maintaining safety within construction sites and the need for more personalised and sturdy remedies that can successfully handle distinct threats. Further research is needed to incorporate teamwork between workers to bolster safety performance. In answer to this demand, the current research paper presents Teamwork based Construction Safety Performance Index Appraisal Kit (C-SPI-AK), which was created utilising the fuzzy synthetic evaluation method to evaluate the construction work practices in different construction working environments to ensure the well-being of workers and the efficacy of safety protocols. The tool will help evaluate six major components, safety culture indicators (Cat1), Safety rules and behaviour indicators (Cat2), Safety practices and engagement indicators (Cat3), Safety communication and inspection indicators (Cat4), Management commitment indicators (Cat5) and Safety meetings and maintenance indicators (Cat6). Furthermore, construction safety performance index appraisal kit will bridge the gap between the conceptual research analysis and the practical implementation resulting in enhanced safety standards.
Keywords:
safety performance
; construction
; fuzzy synthetic evaluation
; safety performance indicators
; teamwork
; safety performance index
1. Introduction
In 2022, 71% of worker fatalities occurred in 3 industries. Transport, postal and warehousing fatalities accounted for 34%(67 fatalities), followed by fatalities in the agriculture, forestry and fishing industries ( 27%; 44 fatalities) and construction industry 14%; 27 fatalities [1]. Statistics reveal that the yearly death toll from construction work-related activities all over the world has not declined considerably over the last five years [2]. In comparison with numerous other sectors, the construction industry has a high percentage of injuries, incidents, and fatalities at work, making it the most vindictive, risky, and hazardous industry [3,4,5].
The construction sector confronts many complicated challenges, necessitating coordination among many stakeholders. Whilst the construction sector continues to progress toward safety by employing rules, training, and technology, its high accident and fatality rates remain a concern. This enduring issue raises concerns regarding the construction sector's devotion to safeguarding workers and minimising risks [6]. Poor safety performance of construction workers is associated with fatal accidents, injuries, serious claims and work-related illnesses. Research scholars have explored a diverse range of safety performance appraisal methods. The research studies in construction safety performance have substantially emphasised technical and organisational factors, such as system dynamics to understand the cause of accidents on construction sites based on the safety attitude and behaviour [7,8,9,10,11,12]. However, no empirical evidence was provided to support this assumption. Wanjiku [13] It revealed that the lack of safety standards and rules among construction workers caused health hazards; however, this is not empirically significant. Choudhry [14] established and carried out a behaviour-based safety method for the Hong Kong construction sector, which can effectively prevent the risky behaviour of workers if implemented under dedicated management. Despite the evidence, the behaviour-based safety program did not end up reducing the risky behaviour of workers or improving the safety performance [15]. Gambatese, Behm [16] presented prevention through design methods to eliminate the risk of accidents through modified designs.
Whilst cutting-edge statistical approaches have been implemented in the construction sector, their implementation in the construction and workplace safety performance analysis is still unexplored. For example, Giri, Sainju [17] used ANOVA to evaluate safety practices in airport construction but did not use multivariate statistical tools like IBM SPSS and structural equation modelling to measure the safety performance, Sohail [18] identified the barriers hampering the adoption of safety technology on construction sites in Pakistan but failed to provide a framework based on advanced statistical methods to overcome these barriers. Teamwork is seldom mentioned in construction safety-related research studies; however, it is rarely empirically presented as a fundamental construct in modelling safety performance. Yin, Obonyo [19] highlights the dearth of integration of teamwork processes into the construction safety framework. Dwyer, Karanikas [20] further confirms in support that human behavioural related factors like teamwork, coordination and psychological safety receive little attention when it comes to the empirical research studies in the area of construction safety.
These research studies focus on the individual components of construction safety and lack the incorporation of human factors in the form of teamwork, therefore, the current study not only gives significant insights into technical and organisational safety factors but also empirically explores the impact of safety performance indicators combined with teamwork in the shape of construction safety performance index appraisal kit (C-SPI-AK) which can influence the safety of workers. However, no empirical research in the past has provided substantial evidence showing how safety performance evaluation tools based on teamwork can impact workers' safety performance.
Improving teamwork behaviour must be addressed as a vital component of safety performance in the Australian construction industry, where multicultural construction teams work under challenging conditions, with a focus on developing collaborative and coherent team cultures and the potential to significantly improve safety results. The negative consequences of poor safety performance resulted in the explosion of literature on the promotion of teamwork among individuals and organisational assistance for addressing the safety performance of construction workers in the Australian construction sector. Medicine, aviation, and business sectors all rely on teamwork to ensure safety and efficiency.
Despite the alarming data due to the poor safety performance of construction workers, there is a dearth of research on the impact of teamwork on the safety performance of construction workers in the Australian construction industry. Although teamwork has been extensively reviewed in the past in a variety of sectors, construction safety research still has a dearth of teamwork studies. Due to their financial backing and influence, several large construction companies have shown excellent results in safety performance among construction workers; however, they have not yet succeeded in comprehending the need for teamwork in safety.
The construction industry can overcome these obstacles and produce positive outcomes through promoting teamwork between individuals and organisations with common goals. Considering the intricate and unpredictable nature of construction works, a collaborative approach, i.e., teamwork, is critical for successfully dealing with safety hazards. To improve the construction safety performance of workers, a thorough teamwork framework for the construction safety performance index appraisal kit (C-SPI-AK) has been developed. This strategy would help construction organisations to manage both identified hazards and anticipated threats. Allowing a dynamic and resilient approach to respond to safety-related concerns.
This research is intended to fulfil this requirement using the platform of teamwork behaviour, which can help identify and evaluate safety performance indicators to create a safety performance index for appraisal of the safety performance of construction workplaces. Fostering collaboration between construction workers is critical for avoiding injuries and fatalities at work. To solve this, it is critical to determine certain norms and actions that can influence the chance of incidents within construction work teams, particularly in the Australian construction industry. Furthermore, identifying the degree to which these measures can reduce fatalities and injuries is critical. Consequently, given the Australian construction sector, it is imperative to investigate how safety performance indicators combined with teamwork impact workers' safety performance and determine the most influential safety indicators that can be measured to evaluate workers' safety performance within the Australian construction industry.
2. Review of Teamwork in Construction Safety Performance
The recurrence and the gravity of workplace-related injuries in the construction industry represent a major socioeconomic problem [21]. With this growth, the construction sector appears to perform a critical role, as so many construction works have been rolled out to match the current demands of the extensive sector. Nevertheless, the building industry has faced many problems, one being the constantly decreasing phenomenon of workplace accidents. The probability of fatal accidents in the construction sector is five times higher than in any other industry [22,23]. The complex, uncertain and sometimes aggressive tasks and conditions of construction coupled with high output demands generate a high potential for errors. Therefore, communication and interaction between the team members are essential from the efficiency and safety point of view for the construction team members [24]. Given the significance of construction work-related injuries, research on construction safety has paid attention to areas like the concept of designing for construction safety [25]; behaviour-based safety [26]; safety performance indicators [27,28,29,30] organisational factors like safety climate, [31]; concepts and theoretical models of safety culture,[32,33,34,35]; advanced statistical methods like Analysis of Variance (ANOVA) to measure safety performance in construction [17]: Machine Learning Models and Artificial intelligence to evaluate safety performance [36]; enhancing the project management skills through use of artificial intelligence while focusing on the safety performance of construction workers [37], use of Predictive statistics analysis to adopt safety technology [18], however, it has ignored the teamwork, and the series of actions teamwork can bring into, to achieve safety performance of construction workers. Another study by [38] examines the composition of team personalities, i.e. based on individual and collective level behaviours towards safety while creating a safety climate within teams. However, it fails to explain how teams collaborate, interact and focus as a functional dynamic rather than a composition of different personalities and their impact on safety climate. Further, it fails to explain how to improve safety on construction sites as presented in this research study, i.e. using the Construction Safety Performance Index Appraisal Kit (C-SPI-AK).
Effective teamwork counts because successful teamwork enables creativity, safety, fewer accidents, and lifesaving [39,40]. Teamwork has the potential to impact the safety of construction teams in distinct ways. Teamwork can avert and mitigate errors that threaten the safety of the construction crew members. Kozlowski and Ilgen [41] and Marks, Mathieu [42] posit that working teams are involved, evolving, and adaptive bodies that grow as members who communicate over time and respond to changing circumstantial demands. Mitropoulos and Memarian [21]Further back it by insinuating that team relations can impact an employee’s knowledge and conduct related to safety.
Teamwork has the potential to have a positive impact on the construction team members in specific ways; for instance, it can detect and handle flaws that could jeopardise the safety of the crew members. Team synergy can influence individual safety-related learning and interactions [21]. Hinze [43] and Hinze and Gordon [44] posit that effective working relationships with supervisors and other team members were closely correlated with fewer injuries on construction sites. Iverson and Erwin [45], opined that other research also suggests that social backup from top management and team members minimises the number of injuries.
Cupido [46] argues that the arduous task for scholars and construction professionals is to improve the working structures, i.e., output practices and teamwork, which could aid in attaining better productivity and safety performance by the team members simultaneously. Safety scholars have recognised the significance of team relationships in safety [47,48,49,50]. Cupido [46] implies that fervent caring improves safety observation and safety checks among the team members. It's further backed up by Roberts and Geller [50] 'actively caring’ applies to workers who are concerned about the well-being and safety of their team members recognise potential hazards and harmful working practices, and take effective remedial measures.
Although a large body of academic work exists on teamwork throughout different sectors, there is comparatively limited research that focuses on the impact of teamwork on the safety performance of construction workers. Numerous large organisations have enhanced their safety performance by leveraging their capital and expertise to establish efficient safety management systems. However, they have not largely recognized the need for teamwork in the area of safety performance [51].
Although many scholars like Mitropoulos and Memarian [21], Mitropoulos, Abdelhamid [52], Mohammadi, Tavakolan [53], Newaz, Davis [54], Chen, Li [55] and Choudhry and Zahoor [56] have examined multiple approaches for enhancing the safety performance of construction workers, ranging from accident causation models to safety behaviour and factors related to teamwork, but there still seems to be a gap in the empirical understanding regarding the significant influence of teamwork on the safety performance of construction workers.
Considering the increased focus on teamwork and its impact on safety performance in construction organisations, it is critical to build an empirically updated decision-making appraisal kit. This appraisal kit will assist experts in efficiently introducing safety measures into construction activities. Employing insights based on the data will help in determining critical elements that will improve teamwork, evaluate the impact of safety outcomes, and offer better strategies. The appraisal kit might also assist in identifying any possible safety concerns, provide tailored preparations for the project’s safety, and stimulate the use of safety technologies, resulting in a safer work environment.
This study adds a limited yet developing body of knowledge about the effects of teamwork on the safety performance of construction workers. It provides researchers and industry experts with critical measures that construction stakeholders must undertake to create outstanding safety results using strong teamwork. The focus is on the teamwork-based construction safety performance index appraisal kit (C-SPI-AK) to evaluate the safety performance among the work teams in construction organisations. The teamwork-based C-SPI-AK will give crucial insights into the dynamics of construction work teams and their working ethics, resulting in improved safety performance for team members.
3. Materials and Methods
3.1. Research Methodology
To attain the current research’s goals and targets, a mixed methodology method was adopted, including a literature review, questionnaire survey and face-to-face interview of the industry professionals. Numerous data analysis approaches were applied to obtain valuable details from each relevant dataset. Methods employed are mean score ranking of the constructs, factor analysis technique (FA), and fuzzy synthetic evaluation (FSE). to determine the weight and the membership functions of different categories of safety performance indicators. Other statistical methods such as Cronbach alpha and composite reliability have not been utilized because they are used for the reflective constructs to assess their internal consistency, and the C-SPI-AK model is not based on latent variables with correlated indicators rather it is based on fuzzy synthetic evaluation and factor analysis to calculate the weight and membership functions of different safety performance indicators’ categories. Likewise, convergent and discriminant validity tests are performed in structural equation modelling to assess the reflective items. However, for C-SPI-AK model, only Factor analysis and fuzzy synthetic evaluation were used to distinguish the commonalities and group the associated safety performance items into the relevant elements.
The research analyses' results were consolidated to create the team-based Construction Safety Performance Index Appraisal Kit (C-SPI-AK). A variety of research methodologies are envisioned to improve the integrity and reliability of research findings.
3.2. Respondents’ Selection
To summarize, the selection criteria for the recruitment of the participants in this research include:
3.2.1. Job Position:
Participants should be working within civil works, especially in the residential and commercial structures, when the research study is conducted. This implies that the focus is more on the individuals who are involved with civil works regarding residential and commercial buildings in Australia
3.2.2. Work Experience in Construction Safety:
The chosen organisations should have workers with a minimum of two years of work experience in construction safety. This requires the construction organisations to have some workers who have a certain degree of capability in safety performance management.
3.2.3. Respondents’ Recruitment:
Survey respondents should be drawn from various construction sites within the Australian construction industry. By selecting diverse construction sites, the viewpoints and experiences from a variety of construction projects will be captured, which will help make the research findings more generalizable.
3.2.4. Emphasis on Safety Roles:
Respondents were exclusively chosen based on the fact that safety was the consequential element of their role while working within construction organisations. This will ensure that participants who have a direct engagement in and responsibility for safety within their work profiles in the construction industry are explicitly selected.
3.2.5. Tier 1 and Tier 2 Organisations:
Participants were sourced from tier 1 and tier 2 construction organisations to improve the calibre and diversity of the responses. Tier 2 firms are considerably smaller, whereas tier 1 organisations are often bigger and can manage bigger tasks. Using this method will help get more insights from an array of construction companies that may have varied resources, safety measures, and stances on safety.
By embracing such an approach in this research study, it is more likely to get a diverse and erudite range of survey results from respondents involved in construction activities with safety as a significant part of their roles in the Australian construction industry.
3.3. Questionnaire Survey
The questionnaire followed a five-point Likert scale, where 1 shows less significance, 2 shows reasonably significant, 3 shows important, 4 shows quite essential, and 5 shows highly important. This rating scale was deemed sufficient and acceptable because it provides adequate consistency and meaningful responses to the questionnaire survey outcomes [57]. However, the five-point rating scale is widely used in construction management research studies by research scholars, for example [58,59,60,61,62]. A total of 120 responses were gathered from 400 online questionnaire surveys that were disseminated among the 70 construction organisations in Australia. Questionnaire surveys were sent to the intended respondents in two ways: via emails and through visiting them at the construction sites. Face-to-face interviews enabled direct participation, whilst email offered participants accessibility and adaptability. This mix of methodologies resulted in more thorough data collecting, increasing both the accuracy and broadness of responses. Online questionnaire survey responses were gathered through Qualtrics's platform. The 120 completed questionnaire surveys that were collected show an acceptable level of response rate, i.e., 30%. Comparatively, the response rate is much bigger than some of the past studies in the field of construction management. For example, the research conducted by YINGBIN [63] (47 responses), Trinh [64] (78 responses) and Jin [65] (44 responses). Nonetheless, given the limitations of the survey criteria, the sample size of the population under study is deemed adequate and appropriate for analysis.
A few invalid and unreliable questionnaires were identified and removed because the required questionnaires had identical responses (4 survey responses) and incomplete questionnaire responses (9 survey responses), which were detected through the Qualtrics survey software.
Following the removal of incomplete and invalid responses, data from the 120 respondents were entered into the database. Response rates in social science research can differ based on several aspects, including the population of interest, the data collection strategy, intricacy of the survey instrument and rewards offered to the respondents. On the other hand, given the nature and scope of social research, this response rate is appropriate [66]. When it comes to enhancing the validity and reliability of the results, researchers ought to strive for higher response rates. However, achieving the higher response rates can be a daunting task; therefore, recent research conducted by Manu [67], Trinh [64] and Tijani [68] suggest that the rate of response to the questionnaires tends to be acceptable.
3.4. Data Analysis Tools
In this research, data analysis tools have been used to create a strong decision-making appraisal kit, which includes IBM Statistical Package for Social Science (SPSS) version 27 to perform mean scoring ranking, factor analysis (FA) and fuzzy synthetic evaluation (FSE). These methodologies enabled a thorough examination and classification of obtained data, confirming that vital factors were recognised and suitably weighed. Factor analysis was used to simplify complicated data sets to essential components, while fuzzy synthetic evaluation reduced ambiguity by including fuzzy logic for more reliable conclusions. To improve the appraisal kit’s accuracy, the research technique leaned on prior research conducted by Osei-Kyei and Chan [69], Hu, Chan [70] and Mu, Cheng [71] suggest that the technique was founded on empirically verified methods. The integration of methodologies enabled the development of a very successful appraisal kit that can be applied in a variety of construction work sites to evaluate the safety performance of construction workers during construction activities in ongoing projects.
3.5. Mean Score Ranking
The mean score ranking approach is a widely used tool in construction management studies to evaluate and score aspects according to their degree of importance or relevance [62]. Mean score ranking entails gathering feedback from the participants who fill out the questionnaire survey based on a five-point Likert scale, where 1 indicates less important, 2 indicates reasonably important, 3 indicates important, 4 indicates quite important, and 5 indicates highly important.
3.6. Factor Analysis
Factor analysis is a form of statistical analysis used to analyse the fundamental characteristics of numerous variables, which helps to comprehend complicated occurrences. It improves the analysis of data by highlighting the connections between factors, allowing researchers to better understand the way the data is organised. The technique is particularly effective when many factors are interconnected, as it provides a clearer picture of the important aspects that influence the trend under the research analysis [72]. This method of factor analysis is used in construction management studies to classify factors into separate groups. Arranging similar factors helps evaluate and analyse complicated data to identify vital correlations and developments in the construction sector [73,74]. To perform factor analysis (FA), preliminary correlation tests between the variables were performed employing the Kaiser-Meyer-Olkin (KMO) index and Bartlett’s test of sphericity as indicators of sample efficiency. Bartlett’s test of sphericity requires a p-value of less than 0.05 to ensure that the factors are adequately linked. The KMO index falls between 0 to 1, with readings more than 0.5 considered acceptable for factor analysis (FA), implying the data set is appropriate for testing [75]. Categorisation of safety performance items by using factor analysis technique (FA) was conducted to regroup them into smaller numbers. Bartlett’s test of sphericity and the acquired Kaiser-Meyer-Olkin (KMO) index are used to measure the relationships between the variables. Varimax rotation and principal component analysis were adopted to understand the factor analysis’s findings, which generated principal components in this research study.
3.7. Sampling Method
Sampling is a method of choosing a sample from a larger group as a means of envisaging the occurrence of an unspecified element of knowledge, condition or consequence concerning the larger group [76]. Sampling aims to support the constructive means to allow the collection of data and process practical actions to achieve results through research instruments, which will be carried out to ensure that the sample represents a fair reflection of the population [77]. However, Kumar [76], posits that it is important to obtain data from the proportion of the participants who participate in the research study, and this proportion of the population is known as the sample.
The population of this research study is the construction workers working in construction organisations in Australia. Since it is difficult to find the correct population of construction workers in Australia due to the absence of a government register of construction organisations, therefore, judgmental or purposive sampling was adopted for this research study. Judgmental or purposive sampling considers the judgment that helps to select the population that can provide accurate data to achieve the results of the research study [76].
3.8. Fuzzy Synthetic Evaluation
Recently, scholars advocated the use of fuzzy synthetic evaluation (FSE) as a valuable statistical instrument for developing measurement techniques, such as multifaceted decision-making appraisal kits. Fuzzy synthetic evaluation FSE simplifies diverse data and improves the accuracy and reliability of models for decision-making by recognising the important elements influencing different parameters [69,70]. Fuzzy synthetic evaluation (FSE) is a reliable mathematical method applied in management and engineering research to assess multiple levels, assessments, and different characteristics [69,70]. Fuzzy synthetic evaluation is a wide array of criteria decision-making tools that allows for a thorough examination of an item in connection to a specified aim in a fuzzy decision-making context with numerous criteria. It enables a more thorough evaluation by taking into account the unpredictability and multifaceted nature of numerous aspects of the decision-making approach [78]. This approach has become extensively employed in numerous research disciplines to analyse complex decision-making, particularly in safety evaluations [79]. The capacity of this tool to manage complicated judgments comprising various elements renders it beneficial in analysing hazards whilst making sensible decisions in unpredictable circumstances. Normally, the fuzzy synthetic modelling approach consists of six key components [69,70]:
- Determine the basic set of team-based safety performance indicators. T= [t1, t2, t3,...tn], where t = identified team-based safety performance indicators.
n = the number of team-based safety performance indicators.
- Label the set of rating alternatives as L = [ L1, L2, L3,…Ln], where L = grading assessment level and n = number of sets in the grading level. This research study adopted a five-point Likert scale, [ L1, L2, L3, L4, L5], where L1 shows less significance, L2shows reasonably important, L3 shows important, L4 shows quite important, and L5 shows highly important.
- Determine the weighting for each team-based safety performance indicator through the equation mentioned below
0 ≤ Wi ≤ 1, = 1 ;
Where Wi = weighting, Mi = mean score of indicators and = summation of mean rating.
- Apply a fuzzy evaluation matrix (Ri) for each item of safety performance
Ri = (rij)m × n
Where rij = degree to which Lj satisfies the criterion fj and m = mean score.
- Evaluation of the weighting vector and fuzzy matrix using the following formula:
D = WioRi
Where D is final fuzzy synthetic evaluation matrix and O is the fuzzy structure operator
- Normalise the fuzzy synthetic evaluation (FSE) matrix to develop the team-based safety performance indicator index (SPI) through the following formula:
SPI = Where D is fuzzy synthetic evaluation matrix and L is the measurement scale for the categories used for the membership functions
4. Results
4.1. Categorisation of the Safety Performance Items
The categorisation of the safety performance items was done using factor analysis (FA). The 21 safety performance items were categorized which had an impact on the safety performance of construction workers into the principal scope. The current body of literature recommends assessing relationships, specifically correlations, by employing Bartlett’s test of sphericity and the acquired Kaiser-Meyer-Olkin (KMO) index, as suggested by Xu, Chan [80] , to ensure sampling suitability. To pass Bartlett’s test, it is necessary to have a p-value less than 0.05. The Kaiser-Meyer-Olkin (KMO) value, which can range from 0 to 1, is considered satisfactory when it is greater than 0.5[75]. The Bartlett’s test value of 676 displays, according to Pallant [81], that the correlation matrix is not an identity matrix and a Kaiser-Meyer-Olkin (KMO) value of 0.681 indicates acceptability since it surpassed the minimum threshold of 0.50 [82]. Therefore, the analysis uncovered statistically significant evidence of p-value = 0.001 of Kaiser-Meyer-Olkin (KMO) value, transcending the limit of KMO = 0.681.
Varimax rotation was chosen for its adeptness in streamlining the understanding of factor analysis’s findings by generating clear and uncorrelated factors. It is specifically useful when the aim is to identify a smaller number of important factors with straightforward relationships to the original variables [81]. As a result, employing principal component analysis and varimax rotation, six components with eigenvalues above 1 were extracted, followed by 14 iterations, which accounted for 55% of the variance in response. This implies that these six foundational components portray a considerable function in improving the interpretation of safety performance indicators to create a safety performance index for appraisal of the safety performance of construction workplaces. These six components represent 55% of the variance, exceeding the 50% of the variance level believed adequate for effectively indicating the data [83]. The six components were named safety culture and training-related indicators (category 1), workplace and hazard management-related indicators (category 2), safety practices and employee engagement related indicators (category3), safety communication and inspection practices related indicators (category 4), safety resources and support related indicators (category 5) and safety meetings and maintenance related indicators (category 6).
The six identified categories, henceforth termed indicators for evaluating the performance of construction work practices, cover various aspects associated with construction organisations. These classifications align with the insights from the earlier research on the effects of safety performance indicators. These indicators are viewed as organisational tools for evaluating and enhancing the functionality of a socio-technical system, which can be employed as part of the safety management mechanisms within an organisation [28,51].

Table 1.
Categorisation of the safety performance indicators.
| Code |
Safety performance indicators |
Factor Loadings | Eigenvalue | PVE | CPVE |
| Cat 1 Safety Culture and Training | |||||
| SP15 | Attitude towards safety | 0.911 | 4.133 | 19.679 | 19.679 |
| SP16 | Safety orientation and training | 0.858 | |||
| SP17 | Safety risk assessment | 0.819 | |||
| SP6 | Stop work authority | 0.495 | |||
| SP20 | Jobsite safety auditing | 0.506 | |||
| SP3 | Safety climate | 0.419 | |||
| Code |
Safety performance indicators |
Factor Loadings | Eigenvalue | PVE | CPVE |
| Cat 2 Workplace and Hazard Management | |||||
| SP5 | Safety rules and procedures | 0.751 | 1.905 | 9.072 | 28.751 |
| SP7 | Worker behaviour observation | 0.696 | |||
| SP21 | Jobsite hazards | 0.549 | |||
| Code |
Safety performance indicators |
Factor Loadings | Eigenvalue | PVE | CPVE |
| Cat 3 Safety Practices and Employee Engagement | |||||
| SP9 | Personal protective equipment | 0.545 | 1.648 | 7.848 | 36.599 |
| SP12 | Workers’ involvement | 0.459 | |||
| SP13 | Risk taking behaviour | 0.621 | |||
| Code |
Safety performance indicators |
Factor Loadings | Eigenvalue | PVE | CPVE |
| SP19 | Safety inspection of the jobsite | 0.589 | |||
| SP11 | Increase in rate of errors | 0.572 | |||
| Code |
Safety performance indicators |
Factor Loadings | Eigenvalue | PVE | CPVE |
| Cat 4 Safety Communication and Inspection Practices | |||||
| SP14 | Communication and consultation | 0.689 | 1.436 | 6.836 | 43.435 |
| SP18 | Safety walk throughs | 0.607 | |||
| Code |
Safety performance indicators |
Factor Loadings | Eigenvalue | PVE | CPVE |
| Cat 5 Safety Resources and Support | |||||
| SP 1 | Incentives | 0.582 | 1.280 | 6.096 | 49.531 |
| SP 2 | Management commitment to safety | 0.617 | |||
| SP 10 | Safety resources | 0.622 | |||
| Code |
Safety performance indicators |
Factor Loadings | Eigenvalue | PVE | CPVE |
| Cat 6 Safety Meetings and Maintenance | |||||
| SP 4 | Toolbox meetings | 0.796 | 1.214 | 5.782 | 55.313 |
| SP8 | Equipment maintenance | 0.579 | |||
4.2. Developing Weightings for the Indicators and Categories Through Fuzzy Synthetic Evaluation (FSE)
To develop the weighting for each indicator, the researcher utilised the methodology outlined in the third step of the fuzzy synthetic evaluation (FSE) to determine the weightings for each indicator. This method was used to measure the safety performance of the construction workplaces. To determine the weight of each indicator, it is necessary to compute the total mean value of each category initially.
The cumulative mean value is obtained by adding up all the mean scores of the indicators within a specific category. The weight assigned to each safety performance indicator is calculated by dividing a particular indicator's mean score by the category's total mean value. For example, the weight of the “Attitude towards safety” is derived by dividing its mean value, 3.95, by the sum of the mean ratings of the indicators in category (#1) 23.32. The result of this calculation is 0.169, which is as follows
WSPI 1= (1) = 0.169
To calculate the weight for each category, the total mean value of a specific category is divided by the sum of all the mean values, which is the sum of the six categories’ mean values. For example, the calculation of the weight for category#1 is demonstrated by the following equation.
WCSPI 1 = (2)
= = 0.315
The process was reiterated to determine the weights for each indicator and category. Table 2.0 outlines the mean values of the indicators, the weight of the indicators, the total mean values for each category, and their corresponding weights.
Cat 1: Safety Culture & Training
| Code | Safety Performance Indicators |
Mean | Weight | Total Mean | Category Weight |
| SP15 | Attitude towards safety | 3.95 | 0.169 | 23.32 | 0.315 |
| SP16 | Safety orientation & training | 4.02 | 0.172 | ||
| SP17 | Safety risk assessment | 4.07 | 0.174 | ||
| SP6 | Stop work authority | 3.71 | 0.159 | ||
| SP20 | Jobsite safety auditing | 3.72 | 0.160 | ||
| SP3 | Safety climate | 3.85 | 0.165 |
Cat 2: Workplace and Hazard Management
| Code |
Safety Performance Indicators |
Mean |
Weight |
Total Mean |
Category Weight |
| SP5 |
Safety rules & procedures |
3.27 |
0.327 |
9.98 |
0.135 |
| SP7 |
Worker behaviour observation |
3.35 |
0.335 |
||
| SP21 | Jobsite hazards | 2.91 | 0.018 |
Cat 3: Safety practices and Employee engagement
| Code |
Safety Performance Indicators | Mean |
Weight |
Total Mean |
Category Weight |
| SP9 |
Personal protective equipment | 3.23 |
0.191 |
16.88 |
0.228 |
| SP12 | Workers’ involvement | 3.79 | 0.224 | ||
| SP13 | Risk-taking behaviour | 3.19 | 0.188 | ||
| SP19 | Safety inspection of job site |
3.17 | 0.187 | ||
| SP11 | Increase in rate of errors | 3.50 | 0.207 |
Cat 4: Safety Communication and Inspection Practices
| Code |
Safety Performance Indicators | Mean |
Weight |
Total Mean |
Category Weight |
| SP14 |
Communication and consultation | 3.09 | 0.492 | 6.27 | 0.084 |
| SP18 | Safety walk-throughs | 3.18 | 0.507 | ||
Cat 5: Safety Resources and Support
| Code |
Safety Performance Indicators |
Mean |
Weight |
Total Mean |
Category Weight |
| SP1 | Incentives | 3.30 | 0.313 | 10.54 | 0.142 |
| SP10 | Safety resources | 3.73 | 0.353 | ||
| SP2 | Management commitment | 3.51 | 0.333 |
Cat 6: Safety Meetings and Maintenance
| Code |
Safety Performance Indicators |
Mean |
Weight |
Total Mean |
Category Weight |
| SP4 | Toolbox meetings | 3.63 | 0.521 | 6.96 | 0.094 |
| SP8 |
Equipment maintenance |
3.33 | 0.478 |
Total 73.95
4.3. Developing Membership Functions for the SPIs and Their Categories
In general, the fuzzy synthetic evaluation membership function is deduced through two or three levels, contingent on the study’s objectives [71]. A membership function is a numerical value falling within the range of 0 to 1, which implies the extent or degree to which element belongs to a fuzzy set [69]The levels refer to the requirement of determining a membership function for a subset before creating a membership function for the whole collection. In this research study, level 1 suggests membership functions for the safety performance indicators, whereas level 2 refers to the membership functions for the classes. The level 1 membership function is derived from the response obtained from the survey.
The membership function is distributed and based on ratings provided by the respondents, using the 5-point Likert scale survey. For example, 2% of the respondents rated ‘Safety orientation and training’ (SP16) as strongly disagree, while 47% rated it as strongly agree as shown in Table 3. The membership function for SP 16 will be shown as
MFI 16 = (3)
Where L = number values in the Likert scale (L1 Strongly Disagree; L2 = Disagree; L3 Neutral; L4 = Agree; and L5 = Strongly Agree).
The membership function for the SP 16 is stated as (0.02, 0.09,0.11, 0.51, and 0.47) as shown in Table 3. The equivalent procedure establishes the membership functions for the remaining 20 safety performance indicators.
SP1 Incentives 0.313 0.02 0.06 0.04 0.53 0.55 - - - - -
SP2 Management commitment 0.333 0.02 0.11 0.07 0.49 0.51 - - - - -
SP10 Safety Resources 0.353 0.03 0.06 0.05 0.56 0.50 - - - - -
| Code | Safety performance indicators | Membership functions for SPIs Level 1 |
Membership functions for GSPIs Level 2 |
|
| Cat 6: Safety meetings and maintenance indicators | 1 2 3 4 5 | 0.05 0.10 0.07 0.70 0.29 |
SP4 Toolbox meetings 0.521 0.02 0.03 0.04 0.86 0.25 - - - - -SP8 Equipment maintenance 0.478 0.09 0.18 0.10 050 0.33 - - - - -4.4. Developing the Assessment Level of Each GSPI (Category)
After establishing the membership function for level 1, equation 3 (D = Wi ° Ri) in the Fuzzy Synthetic Evaluation is subsequently applied to formulate the membership function for level 2. Wi represents the weightings of all the safety performance indicators within their respective categories, while Ri shows the fuzzy matrix. For example, the fuzzy matrix for the level 1, i.e., membership function for safety practices and employee engagement related indicators (category 3), is stated as follows
D = Wi ° Ri (4)
Ri = = (5)
Now applying equation 4, i.e. D = Wi ° Ri, to formulate membership function for CSPIs group, i.e., level 2.
D = (0.191, 0.224, 0.188, 0.187, 0.207) X = (0.191X0.06) + (0.224X 0.03) + (0.188X 0.07) +(0.187 X 0.01) + (0.207 X 0.08),
(0.191X0.12) + (0.224X 0.09) + (0.188X 0.31) +(0.187 X 0.08) + (0.207 X 0.18),
(0.191X0.05) + (0.224X 0.15) + (0.188X 0.13) +(0.187 X 0.05) + (0.207 X 0.07),
(0.191X0.66) + (0.224X 0.67) + (0.188X 0.39) +(0.187 X 0.42) + (0.207 X 0.52),
(0.191X0.31) + (0.224X 0.26) + (0.188X 0.30) +(0.187 X 0.64) + (0.207 X 0.35).
D = 0.05, 0.15, 0.09, 0.53, 0.37
The membership functions for all six categories were obtained using the uniform approach. Table 3 shows the Level 1 and Level 2 membership functions. The SPI for each of the six categories are calculated using the following equation
SPI = (6)
Where D is fuzzy synthetic evaluation matrix and L is the measurement scale for the six categories used for the membership functions. Therefore, SPI values for the six categories safety culture indicators (category 1), safety rules and behaviour indicators (category 2), safety practices and employee engagement (category3), safety communication and inspection practices (category 4), safety resources and support (category 5) and safety meetings and maintenance (category 6) are calculated as follows.
SPI cat1 = (0.04 0.08 0.08 0.52 0.48) X (1, 2, 3, 4, 5) = 4.92
SPI cat2 = (0.05 0.07 0.06 0.40 0.24) X (1, 2, 3, 4, 5) = 3.17
SPI cat3 = (0.05 0.15 0.09 0.53 0.37) X (1, 2, 3, 4, 5) = 4.59
SPI cat4 = (0.09 0.22 0.09 0.46 0.32) X (1, 2, 3, 4, 5) = 4.24
SPI cat5 = (0.02 0.07 0.05 0.53 0.52) X (1, 2, 3, 4, 5) = 5.03
SPI cat6 = (0.05 0.10 0.07 0.70 0.23) X (1, 2, 3, 4, 5) = 4.41
4.5. Developing a Construction Safety Performance Index Appraisal Kit for Construction Workers (C-SPI-AK)
The development of the construction safety performance index (C-SPI-AK) used a linear additive model. Similarly, in prior studies, an equivalent method was commissioned in founding a success index through a fuzzy synthetic evaluation approach [69]. Existent studies exercising similar methodology imply an acknowledgement of the necessity for adaptable and pliable evaluation frameworks Nnaji, Gambatese [84]; and Osei-Kyei and Chan [69], especially in contexts where traditional methods may fall short.
Developing a success index using Fuzzy Synthetic Evaluation (FSE) specifies a nuanced method to measure the association between the constructs and categories. In the process of formulating the safety performance index (C-SPI-AK), the SPIs of each category were normalised to ensure their collective total equaled unity. Hu, Chan [70] and Yeung, Chan [85] underscored the significance of linear equations, making it readily comprehensible for practitioners to employ. The C-SPI-AK categories are presented in the following Table 4
Note: Coefficient = .
The first stage in developing the SPI (index) involves the calculation of the coefficients of each category as presented in Table 4 through the estimated safety performance evaluation index. The calculation using the coefficients is shown below:
SPI (index) = (Category 1 coefficient x safety culture indicators) + (category 2 coefficient x safety rules and behaviour indicators) + (Category 3 coefficient x safety practices and engagement indicators) + (Category 4 coefficient x safety communication and inspection indicators) + (Category 5 coefficient x management indicators) + (Category 6 coefficient x safety meetings and maintenance indicators).
SPI (index) = (0.186 x safety culture indicators) + (0.120 x safety rules and behaviour indicators) + (0.174 x safety practices and engagement indicators) + (0.161 x safety communication and inspection indicators) + (0.191 x management indicators) + (0.167 x safety meetings and maintenance indicators).
The safety performance index is developed to evaluate the construction work practices in different construction working environments to ensure the well-being of workers and the efficacy of safety protocols. The construction organisations aimed the use of the intended C-SPI-AK (construction safety performance index appraisal kit) to indicate the levels of abidance to the constructs present within their working environment, on a scale of 1 to 5, where 1 is ‘strongly disagree’ and 5 is ‘strongly agree’. According to the research conducted by [84], selecting the highest achievable assigned score method was adopted to ascertain the performance standard for assessing construction work practices in a strategic approach. Each classification receives a maximum number of scores. Calculated as a combination of the number of safety performance indicators and the maximum achievable evaluation score. This technique guarantees that the assessment is appropriate and represents the value of each safety performance indicator in the overall assessment. For example, the maximum possible score for category 1, i.e., safety culture indicators, is 30 [number of indicators in category 1 has 6 indicators, therefore, 6 times the maximum score, i.e., 5].
The researchers handed out the highest achievable scoring method worksheet to the eight construction professionals as shown in Table 6: Site engineer, Project engineer, Project manager, a Senior safety coordinator, a construction project consultant, Builder, Traffic engineer and a Foreman ( civil construction). The experience of these professionals ranged from 7 to 10 years, which shows their ability to give credible scoring when evaluating the safety performance within their organisations. Researchers can obtain a more thorough comprehension of the factors that will impact the safety performance of construction workers. This data will help investigate the obtained scores, enabling deeper examination and better discernment of the correlation between demographic parameters and safety evaluations. Therefore, the highest achievable score method will assign the highest score to the categories of GSPI and the highest number of constructs in each category.
As shown in Table 5, Category 1 Safety culture indicators have six items therefore, eight construction professionals from different construction organisations in Australia filled out the highest scores to represent their level of agreement with the items in each category on a scale of 1 – 5 where 1 is strongly disagree and 5 is strongly agree. For example, SP 15 (5), SP 16 (4), SP 17 (4), SP6 (5), SP 20 (4) and SP 3 (4). To attain the average index, all scores are added and then divided by the number of indicators, i.e.
= 4.3 (7)
The same calculation is repeated for all the indicators’ categories. The highest achievable score is shown as SPI (maxindex); the average index obtained is multiplied by its corresponding coefficient to get the weighted score. The maximum obtainable score is depicted as follows:
| Code | Safety performance indicator | GroupScores | Average index | Total index | Max. Score |
| Cat 5 Management commitment indicators | |||||
| SP1 | Incentives | 4.5 | 4.6 | 13.8 | 15 |
| SP2 | Management commitment | 4.6 | |||
| SP10 | Safety resources | 4.7 | |||
| Code | Safety performance indicator | GroupScores | Average index | Total index | Max. Score |
| Cat 6 Safety meetings and maintenance indicators | |||||
| SP4 | Toolbox meetings | 4.7 | 4.6 | 9.3 | 10 |
| SP8 | Equipment maintenance | 4.6 | |||
SPI (maxindex) = (0.186 x 30) + (0.120 x 15) + (0.174 x 25) + (0.161 x 10) + (0.191 x 15) + (0.167 x 10)
= (5.58) + (1.8) + (4.35) + (1.61) +(2.865) + (2.505)
= 17.875
As shown in Table 5, to determine the adoption capability of construction safety performance index appraisal kit (C-SPI-AK), the indicators are subjected to highest achievable assigned score method (Table 5). The highest scoring method presents a systematic proposal to evaluate different attributes of C-SPI-AK, which will help verify its suitability and the chances of acceptance across the construction organisations. The results are compared with the highest-scoring safety performance index. As the ratio increases up to 100%, i.e., when the average score of SPI is divided by the maximum index i.e., 17.875, it is anticipated that the likelihood of successfully integrating construction safety performance index appraisal kit (C-SPI-AK) into construction organisations will also rise which will help prevent the unsafe and poor working conditions among the construction workers. A score of at least 65% proposes a strong capability to be successful if implemented [86]. A total score of 65% or above implies that C-SPI-AK is likely to be effective if implemented. This grade indicates that C-SPI-AK has an outstanding ability to meet the specified criteria and work well within the construction organisations. A score of 11.62 (0.65 x 17.875) or higher indicates the potential success of C-SPI-AK when properly accepted and utilised by construction organisations. This score shows that C-SPI-AK meets the requirements for positive safety performance by the construction workers.
According to the validation results, the category 1 safety culture indicators scored higher amongst the other categories, i.e., it obtained 86.6%, which suggests that safety culture indicators play a vital role in influencing the safety performance of construction workers. The score for the systematic proposal to evaluate different attributes of C-SPI-AK is 13.562. This score indicates 76% of the maximum obtainable score, surpassing the 65% threshold, suggesting that C-SPI-AK can be adopted by construction organisations to effectively influence the safety performance of construction workers.
4.6. Application of Construction Safety Performance Index Appraisal Kit (C-SPI-AK)
Nnaji, Gambatese [84] and Li, Chen [87] have employed scenario-based case studies centred on the construction industry professionals to elucidate the method of placing appraisal kits into operation for the assessment of the safety performance of the construction workers in industry. Eight construction professionals involved, a site engineer, Project engineer, Project manager, a Senior safety coordinator, a construction project consultant, Builder, Traffic engineer and a Foreman ( civil construction) were interviewed to gather credible data regarding the efficiency of the construction safety performance index appraisal kit (C-SPI-AK). The experience of these construction professionals ranged from 7 to 10 years, which, according to Yap, Abdul-Rahman [88] demonstrates their ability to give credible evidence for the validation of the evaluation instrument, i.e. construction safety performance index appraisal kit (C-SPI-AK).
Table 6.
Demographic information of the experts.
| ID | Position | Institution | Education | Years of Experience |
| EXP1 | Site Engineer | Construction organisation |
B.E. Civil | 9 years |
| EXP2 | Project Engineer | Transport for NSW | MEng.Sci | 8 years |
| EXP3 | Project Manager | Construction organisation |
B.E Civil | 10 years |
| EXP4 | Senior safety coordinator | Construction organisation |
Grad. Dip | 10 years |
| EXP5 | Construction Project Consultant |
Construction organisation |
MEng.Sci | 7 years |
| EXP6 | Builder | Owns business | Grad. Dip | 20 years |
| EXP7 | Traffic Engineer | Construction organisation |
B.E Civil | 10 years |
| EXP8 | Foreman (Construction) | Construction organisation |
Grad. Dip | 17 years |
The researchers handed out the developed construction safety performance index appraisal kit (C-SPI-AK) to the chosen construction professionals to evaluate the safety performance of construction workers during the construction activities in construction projects that are still in progress. The construction professionals were provided with guidance regarding the utilisation of the instrument. Eventually, each of them was requested to complete the construction safety performance index appraisal kit (C-SPI-AK) procedure shown in Table 6 according to their assessment of the construction work activities’ atmosphere.
Construction Safety Performance Appraisal Kit (C-SPI-AK) allows construction organisations to assess the safety performance of construction workers during construction activities. Please provide the information in the appraisal kit to determine the safety performance score.Please provide the evaluation score by supplying the information regarding the presence of safety performance indicators during the construction activities. Where 1 is Strongly disagree, 2 is Disagree, 3 is Agree, 4 is Neutral, and 5 is Strongly agree.
Table 7.
Construction Safety Performance Index Appraisal Kit (C-SPI-AK).
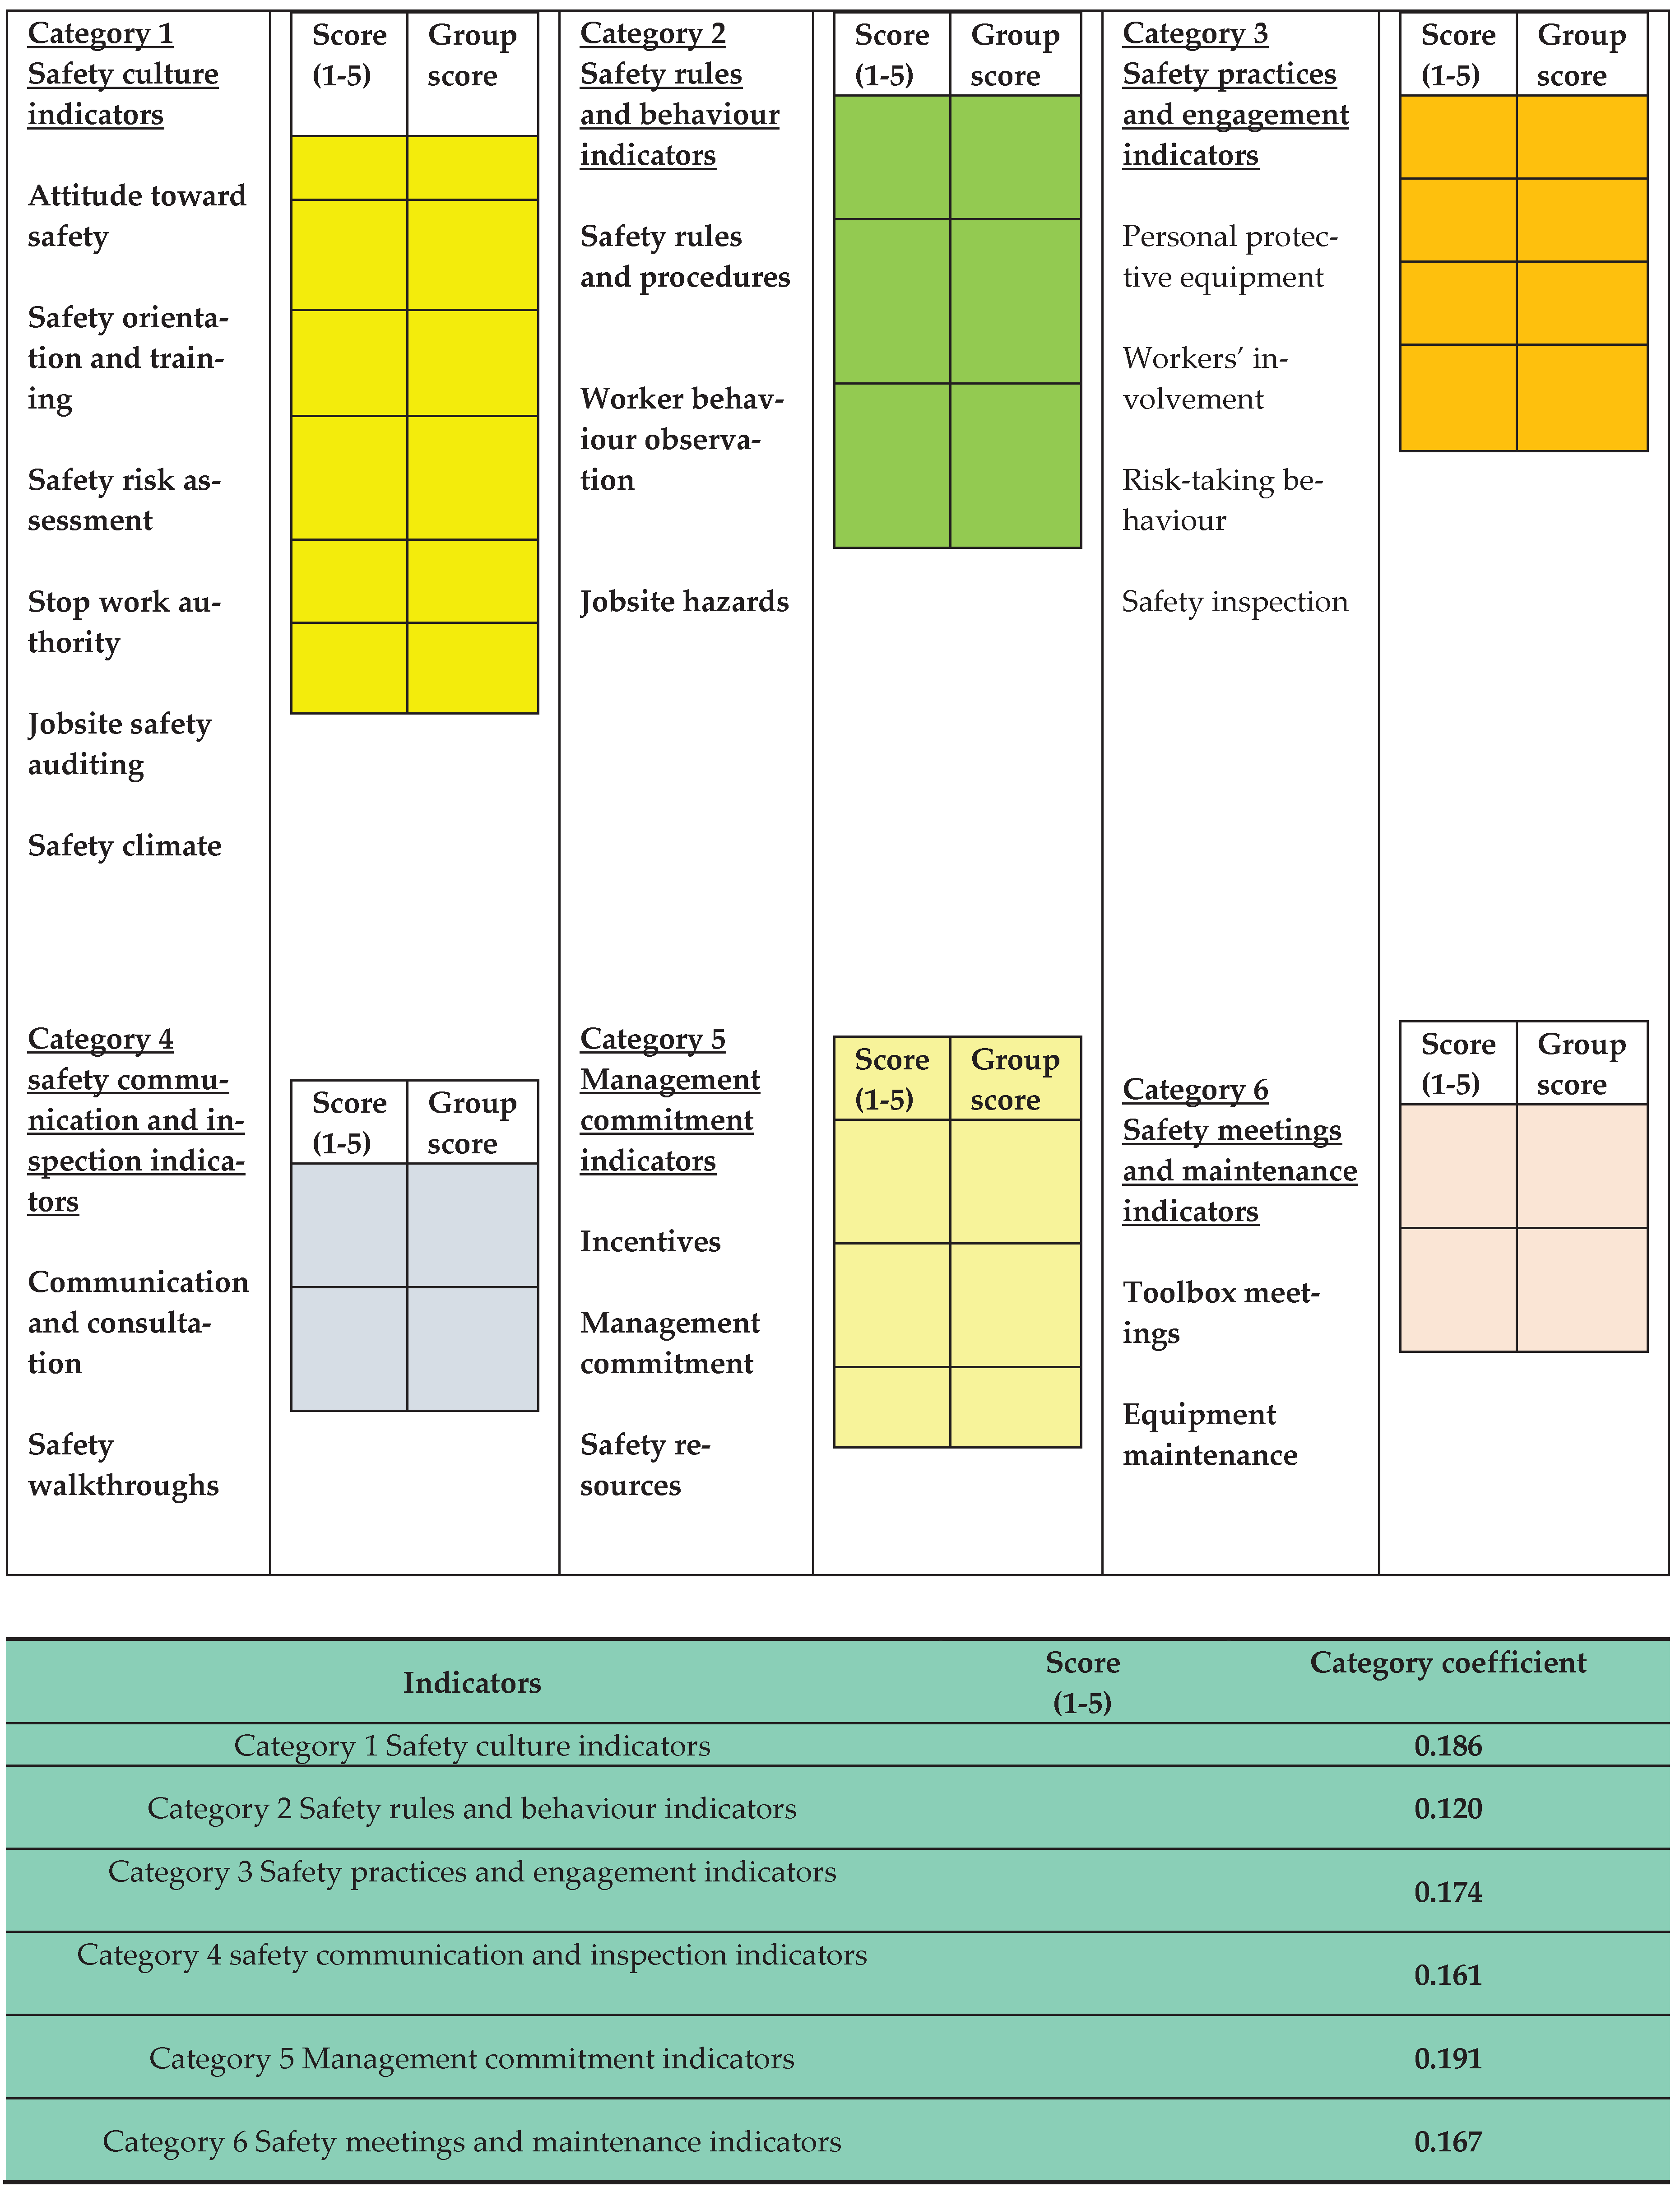 |
Maximum safety performance score
Furthermore, the construction professionals were asked to provide more details on the implementation and feasibility of the construction safety performance index appraisal kit (C-SPI-AK). The validation questions were emanated according to the studies by Fayek [89], Nnaji, Gambatese [84] and Tijani [68] based on the characteristics of a feasible approach, specifically, its simplicity of utilisation, adequate performance and usefulness of the recognised elements, the rationality of the suggested classifications, the extent of the ability of the suggested evaluation kit to encourage decision-making presses, and justification of the model outcomes. The validation questionnaire responses from the construction professionals were analysed, and the mean and median ratings of their assessments are presented in Table 8. This response provides a clear overview of the construction professionals ‘evaluations of various aspects of construction safety performance during the construction work activities. The examination of the responses from the construction professionals proves that the construction safety performance index appraisal kit (C-SPI-AK) for the safety of construction workers during the construction activities in construction projects is easy to use and helps in decision making vis-à-vis the safety of the construction workers. Regarding the toolkit’s rationality and the specified indicators’ adequacy, the construction professionals concurred that the construction safety performance index appraisal kit (C-SPI-AK) has enough indicators and is appropriate for evaluating the safety performance of construction workers during construction work activities. Furthermore, the construction professionals acknowledged that the appraisal kit offered valuable perspectives on the safety and well-being of the construction workers. Moreover, construction professionals suggested that implementing the construction safety performance index appraisal kit (C-SPI-AK) will help enhance the safety performance of construction workers.
5. Discussion
The highest coefficient was obtained using management indicators (0.191) in the model followed by safety culture indicators (0.186), safety practices and engagement indicators (0.1744), safety meetings and maintenance indicators (0.167), safety communication and inspection indicators (0.161) and safety rules and behaviour indicators (0.120). Since all the coefficients add up to one, it falls within the balance. Creating a safety performance index will be highly beneficial to construction professionals in assessing workers’ safety performance across a range of construction firms realistically and consistently. Additionally, the safety performance index model will allow practitioners to compare the degrees of success of construction projects based on workers' safety performance. It will improve safe work practices within the construction industry.
5.1. Management Commitment Indicators (Cat 5)
The management indicators (Cat 5) account for 6.096% of the overall variance in the factor analysis. It has a safety performance index (SPI) of 5.03 and a coefficient of 0.191 in the safety performance index model. Effectively, management commitment has been mentioned by previous studies as a critical criterion for construction workers to work with a willingness to enhance their safety performance [90,91]. This implies that management commitment will remain a critical safety performance indicator for construction organisations to achieve advantages to bolster the safety performance of workers [92]. This category of safety performance indicator consists of three subfactors; which include incentives, management commitment and safety resources.
Safety resources have the highest factor loadings i.e., 0.622 within this category. Understanding the major contributing causes to construction accidents is the first step towards early detection of such incidents [93]. A review of the literature on the construction safety performance of workers reveals that much research has been focused on investigating the technology-related causes of accidents on construction sites, including the allocation of safety resources. In this regard, construction workers with sufficient safety resources to perform construction work more safely will demonstrate the significant impact of safety resources on improving the safety performance [94]. Significantly, embracing high investment in safety resources allows for effective management of safety-related incidents in construction industries [95].
Management commitment to safety is the second subfactor of this group with 0.617% of the factor loading. Workers’ attitude is impacted by management’s level of commitment for example Michael, Evans [91] asserted that one of the key determinants of construction workers’ performance in terms of safety is management's commitment to safety. Given that management commitment is a crucial component of safety performance [92], organisations look up all the benefits to bolster the safety performance of construction workers [28]. Notwithstanding, there remains the fact that management needs to vigorously encourage the safety performance of the construction work teams at all levels; however, for this criterion to be achieved, as pointed out by Wentz [96] management has to strengthen and promote the safety performance of construction workers.
Incentives are the third subfactor of this group with a factor loading of 0.582%. An incentive/reward system acknowledges the involvement of workers and managers in the safety improvement process through anticipation, information and influence over unsafe conditions [97]. According to Goodrum and Gangwar [98], incentives effectively improve safety performance standards used in construction, nevertheless, disparities remain within the construction sector regarding the effectiveness of the incentives. To encourage a culture of safety and enhance the overall safety performance of construction workers, incentives can be a potent tool. This implies that incentives encourage and promote the safe behaviour of workers and eventually improve safety performance [99,100].
5.2. Safety Culture Indicators (Cat 1)
In the factor analysis safety culture indicators (Cat 1) account for 19.679% of the overall variance. It has a safety performance index SPI of 4.92 and a coefficient of 0.186 in the safety performance index model. This category of safety performance indicator consists of six subfactors; attitude towards safety, safety orientation and training, safety risk assessment, stop work authority, job site safety auditing, and safety climate.
Attitude towards safety has the highest loading factor of 0.911% within this group. Many efforts have been made in recent years to promote safety performance by reducing the number of accidents in the construction sector, nevertheless, these strategies have no reasonable effects due to the lack of safety attitude among construction workers [101]. Although expounding to the unsafe working conditions in the construction sector is critical to preventing accidents, it is vital to understand workers’ attitudes toward safety given the significant role that human behaviour plays in causing accidents [102,103]. Therefore, from a practical perspective, attitude toward safety highlights leveraging supportive construction safe work practices in construction organisations.
Safety orientation and training have the second-highest loading factor of 0.858% within this group. According to Kohn [104] safety training is recognized to be carried out to save lives and health. It is further backed up by Cooper [105] that in addition to preventing accidents, safety training helps manage risks. In this regard, the need to understand the impact of safety training and orientation comes to the fore. Studies have shown that worker’s training and orientation programs have been highly effective in improving their attitude toward safety and improving their safety performance [106]. Importantly, effective safety training may assist in reducing accident rates [107], it is such an important cornerstone of safety performance, that construction organisations would seek out all of the benefits to be gained from safety training and orientation to promote it within the construction sector.
Safety risk assessment has the third-highest loading factor of 0.819% within this category. It identifies components and conducts a thorough risk analysis of the activity to provide a unique risk assessment for a variety of organisational tasks [108]. While the impact of the physical working environment on risk-taking propensities may not be widespread, it remains a factor that contributes to safety practices and warrants attention [109,110]. In this regard, organisations have long suffered because of the absence of visionary and pre-emptive procedures, such as risk assessment and hazard identification, that participated to construction-related accidents [111]. Therefore, enabling organisations to determine whether they are adopting the proper initiatives and risk assessment efforts to avoid fatalities and injuries at the workplace is subject to how much knowledge can be solicited and how efficiently the knowledge can be absorbed.
Job site safety auditing has the fourth-highest loading factor of 0.506% within this category. Safety auditing is a coherent safety system that serves as the first line of defence in preventing injuries and fatalities [112,113]. To evaluate the efficacy and accuracy of safety inspections, construction organisations ought to do routine job site audits. To improve worker safety, safety managers should conduct weekly and monthly inspections, gather information, and put remedial measures into place it is crucial to present management with the data gathered through auditing for further action to address any high-risk conditions of the construction site [28]From this viewpoint, it reflects whether safety management has been implemented according to the organisation’s safety objectives and policies; if not, corrective actions will be taken to enhance the safety of the construction workers.
Stop work authority has this group's fifth-highest loading factor of 0.495%. Stop work authority confers liability and control over any worker to stop work if a harmful condition arises out of any activity [114]. Nonetheless, this strategy has been further investigated in other studies; Alsamadani, Hallowell [115], for instance, they looked at how safety personnel on the job site should reiterate and emphasise their support for the Stop Work Authority program. In this regard, workers not being authorised to stop work in the event of unsafe situations or behaviour at work demonstrate a weak safety culture.
Safety climate has the sixth highest factor loading of 0.419% within this category. The higher the workers’ involvement in safety activities, the more positive the safety climate [31]. The intricate nature of safety climate reflects the safety culture within any given organisation [116]. This implies that safety climate assists in anticipating safety performance and ensures safe behaviour among construction work teams [117]. Safety climate is probably the most hotly debated topic by both academics and practitioners in the safety field. This shows that a safe climate is considered very essential for achieving the safety performance of construction workers.
5.3. Safety Practices and Engagement Indicators (Cat3)
In the factor analysis, safety practices and engagement indicators account for 7.848% of the overall variance. It has a safety performance index (SPI) of 4.59 and a coefficient of 0.174 in the safety performance index model. This category of safety performance consists of five subfactors: personal protective equipment, workers’ involvement, risk-taking behaviour, safety inspection of the job site and increase in the rate of errors.
Risk-taking behaviour has the highest loading factor of 0.621 within safety practices and engagement indicators (Cat3). To increase workplace safety, behavioural approaches to safety management are used to encourage actions that are seen to be essential to risk reduction, health and safety of workers [118]. Mullen [119] highlighted that the work burden from top management causes construction workers to act in an unsafe manner due to the work pressure. There is substantial research documenting the efficacy of safety behaviour, Lingard and Rowlinson [120] posit that there is a connection between safety behaviour and most of the fatalities and injuries are caused by unsafe work practices by workers rather than unsafe conditions. Behaviour safety is, therefore, an upstream approach to safety in that it focuses on risk-taking behaviours of construction workers that may produce an incident. This, therefore, makes safety behaviour a critical criterion for achieving safety performance within the construction industry.
Safety inspection of the jobsite has second second-highest loading factor of 0.589 within safety practices and engagement indicators (Cat 3). Research has shown, to an extent, stark evidence of a reduction in injury rates of workers through safety inspection of the construction sites [121,122,123]. Previous studies by scholars Cohen and Cleveland [124], Cohen [125] and Smith, Cohen [126] have also encouraged these safety activities, such as safety inspection of the construction sites, in which the supervisors contribute their part. It is, therefore, not surprising that safety inspection of the jobsite is a crucial criterion that identifies safety violations to keep the workforce safe during the construction works [127].
Increase in rate of errors has the third highest loading factor of 0.572 within the safety practices and engagement indicators (Cat3). Increase in the rate of errors provides a warning indication that may help organisations to better understand and identify safety issues and avoid the drift to the danger zone [28]. The study conducted by Lingard et al. 2017) regarded the increase in the rate of errors as a leading indicator. Shaikh, Osei-Kyei [28] posited due to the increase in the rate of errors will cause the increase in the frequency of incidents and injuries; undoubtedly, rate of errors caused by workers has a connection with increased number of fatalities and injuries, therefore, the management and project supervisors look into the importance of observing site conditions and workers' involvement through their behaviours which are possibly causing workplace injuries and accidents.
Personal protective equipment has the fourth-highest loading factor of 0.545 within this category. According to Vitharana, De Silva [128], safety at construction work sites needs to be strongly regarded to minimise the likelihood of injuries and accidents at the workplace. Vitharana, De Silva [128] further contended that the dearth of awareness among the workers on construction sites and the reluctance to use personal protective equipment are the two main reasons for poor safety practices on construction sites. Therefore, safety managers and project leaders need to develop knowledge and awareness of the use of personal protective equipment and its benefits.
Workers’ involvement has the fifth-highest loading factor of 0.549 within this category. Determining the level of health and safety knowledge and compliance among construction workers is not enough on its own. Effective health and safety management in construction requires a comprehensive approach that goes beyond mere assessment. Mohamed [31] postulated that the higher the workers’ involvement in safety activities, the better safety climate at the workplace. [28] pointed out that worker involvement attitude will have some impact, and it will be followed by the outcome or the results; therefore, there will be some consequences arising from safety culture and workers' involvement, and these effects of the actions will determine the organisation's potential for safety. This underscores the fact that safe working practices can guarantee compliance only if other factors aid in it, for example, workers’ involvement.
5.4. Safety Meetings and Maintenance Indicators (Cat 6)
In the factor analysis, safety meetings and maintenance indicators account for 5.782% of the overall variance. It has a safety performance index (SPI) of 4.41 and a coefficient of 0.167 in the safety performance index model. This category of safety performance consists of two subfactors, toolbox meetings and equipment maintenance.
The toolbox meeting has the highest loading factor of 5.796 within this category. Studies have indicated that most work-related injuries and fatalities are caused by workers’ unsafe working practices rather than unsafe working conditions [119,129]. For example, some construction workers don’t consider toolbox meetings necessary. Toolbox meetings facilitate learning about working practices, including organisational procedures, sharing incident and accident reports, discussing risks associated with specific tasks, and addressing any concerns from construction workers [130]. By making toolbox meetings more regular, construction organisations can significantly enhance safe working conditions and reduce accidents at the workplace.
Equipment maintenance has a loading factor of 0.579 within its category. Having operationally safe construction equipment and making it financially viable to operate them on sites is primarily due to equipment maintenance programs [131].
5.5. Safety Communication and Inspection Indicators (Cat 4)
In the factor analysis, safety communication and inspection indicators account for 6.86% of the overall variance. It has a safety performance index (SPI) of 4.24 and a coefficient of 0.161in the safety performance index model. This category of safety performance consists of two subfactors: communication and consultation, and safety walkthroughs.
Communication and consultation have a loading factor of 0.689 within its category. According to Lin, Lee [132] and Wang, Goodrum [133] Communication and consultation between workers is crucial for the safety of workers. Despite that an increasing number of work-related health and safety regulations have been implemented, the accident frequency is still high. It is essential to maintain consistent and effective safety-related communication and consultation with workforce to maintain vigour and focus of attention on safety-related issues [28].
Safety walkthroughs has the second highest loading factor of 0.607 within this group. According to the study conducted by Lingard, Wakefield [134], project managers believed that recurrence and the efficiency of safety walks were motivated because activities performed on sites were measured, and their performance was observed and reported. Therefore, Toole [135] suggested that "Observation" is the only key to preventing all these causes of construction accidents. This shows that safety managers should observe their workers, their approach towards safety while working on-site, their behaviour and the worksite conditions through safety walkthroughs [28].
5.6. Safety Rules and Behaviour Indicators (Cat 2)
In the factor analysis, safety rules and behaviour indicators account for 9.072% of the overall variance. It has safety performance index (SPI) of 3.17 and a coefficient of 0.120 in the safety performance index model. This category of safety performance consists of three subfactors: safety rules and procedures, worker behaviour observation and jobsite hazards.
Safety rules and procedures has the highest loading factor of 0.751 within this group. Safety rules and procedures provide a list presenting the number of activities that are carried out; otherwise, avoid completing a job efficiently and safely [136]. Biggs, Dingsdag [137] proposed that accidents take place due to multiple factors, and one of those is safety rules and regulations. Consequently, it would be of value to assess which capabilities and competencies construction managers and workers need to develop to enhance the safety performance [28].
Worker behaviour observation has the second highest loading factor of 0.696 within this category. Workers' behaviour is one of the leading causes of injuries and accidents that take place on construction sites. It is because of these unsafe acts and behaviours by the construction workers, which end up in accidents and injuries [138,139,140]. To curb this, a behaviour-based approach should be utilised by the construction supervisors on-site, through which they can observe, analyse and adapt their behaviour [28]. A checklist can be developed for safety-related behaviour, observing workers, improving behaviours through feedback and enhancing safety through the observed data.
Jobsite hazard has the third highest loading factor of 0.549 within this group. The construction industry endures from a feeble safety performance, for example, a high rate of injuries and accidents and a significant number of deaths on construction sites [141]. Construction organisations perform safety checks on worksites to identify any hazards through the method called job hazard analysis. Therefore, adequate barriers could be set out against the hazards which have been identified by the organisation and develop policies, practices and procedures based on the hazards identified and risk assessment reports by the organisation [28].
6. Implications for the Practice and Contribution to the Body of Knowledge
This research study presents the empirical evidence that adds to the body of knowledge and procedures involving the safety performance of construction workers in construction organisations within Australian construction industry. Nonetheless, it has certain limitations, which are as follows;
The research study started by identifying and validating the many elements that have an impact on the adoption of construction safety performance index appraisal kit (C-SPI-AK) in the construction sector. These elements are critical in deciding whether C-SPI-AK will be a smart choice for any construction organisation to enhance the safety performance of construction workers. It is through analysing these safety performance indicators, the research study provides useful information about the circumstances in which safety performance of workers is likely to improve. It will help construction organisations to make sensible decisions, especially with the adoption and implementation of construction safety performance index appraisal kit (C-SPI-AK), as the indicators can serve as benchmark to assess how effectively the C-SPI-AK will fit into the environment of construction organisations and suit distinct safety requirements. By doing so, construction organisations can tailor their safety strategies to align with their operational situations, leading to better safety performance and compliance with the safety standards. This malleability allows construction organisations to adjust their safety standards according to the data-driven conclusions, warranting that C-SPI-AK is not only effectively deployed but also attends to the distinct safety performance-related challenges of different construction working environments in organisations. It will promote the safety culture of construction organisations.
The classification of safety performance constructs into six vital categories provides an organised, data-driven method of evaluating the safety performance of construction workers working on construction sites. This systematic approach to safety management through the classification allows construction stakeholders to bring their focus on areas related to safety that require attention and improvement, resulting in more effective safety measures.
This research study provides a ranking strategy for the prevention of safety-related incidents and accidents by assigning coefficients for each indicator through the fuzzy synthetic evaluation (FSE). These coefficients will allow us to determine the valuation of multiple safety performance indicators. For example, the Cat 5 management commitment has the highest coefficient, i.e. (0.191), therefore, the construction organisations should prioritise the management’s role towards strengthening the safety measures within the organisation.
This research study introduces a versatile decision-making appraisal kit that encourages teamwork and open interaction between the construction stakeholders for the enhancement of the safety performance of construction workers. The expert validation of C-SPI-AK assures that it's facile to use and unswerving, which makes it a useful tool for construction organisations that constantly evaluate the safety performance of workers.
For scholars, this work introduces a novel way of calculating weightings for the indicators and categories through fuzzy synthetic evaluation (FSE) that can be used to build a linear evaluation model. Researchers can utilise this approach to create index equations for risk analysis, resulting in a more comprehensive and extensive assessment of construction workers’ safety performance in the industry. This approach will provide a solid platform for improving safety evaluation and the performance of construction workers.
7. Limitations and Future Research Directions
This research study was conducted on construction workers within construction organisations in Australia. As a result, the applicability of these results to any other sector is limited. However, construction organisations across the world have equivalent operational features, implying that the data gathered from a given environment, such as the construction organisations in Australia, may have widespread applications. Since construction organisations use theories, tools, collaboration with different stakeholders and project-based safety management practices, therefore, the research findings from one country can be extended or applied to other construction organisations in different regions.
The appraisal kit was validated by expert opinion to establish the convenience of evaluating the construction work practices in different construction working environments to ensure the well-being of workers and the efficacy of safety protocols. The construction organisations aimed the use intended C-SPI-AK (construction safety performance index appraisal kit) to indicate the levels of abidance with the constructs present within their working environment, but the practicability of the kit was limited as it has not been practically tested and hence only developed based on the subjective opinions of the experts who validated the model.
The research offers a useful vision of the safety performance indicators, although it comes with numerous limitations. Whilst it uses quantitative methodology like advanced statistical methods, which includes factor analysis and fuzzy logic, the absence of panel data, i.e. longitudinal data which could be used to track changes over time, makes it difficult to evaluate the long-term impact on the viability of safety. Furthermore, it does not adequately account for the outside forces like the impact of economic conditions, diversity of workers in a team and the impact of modifications if brought in by the regulatory bodies. Though the research includes qualitative elements, it does not completely employ a comprehensive qualitative approach like discussions in the shape of focus groups, interviews or case studies, which might present an expanded understanding of team-based safety performance indicators, i.e. why one indicator can be more impactful than others if employed in the construction organisations. This will require a combination of mixed methodologies to enrich this research by mixing the results from the advanced statistical methods with the actual world viewpoint based on construction experts' experience
Another significant limitation is the absence of a systematic theoretical framework that can show the behaviour of indicators and their influence on the other indicators, resulting in a more effective impact on the safety performance of construction workers. The use of structural equation modelling can provide insight into the complicated correlations among the safety performance indicators by identifying the different impacts, i.e. the direct and indirect or the mediating effects of key indicators. Furthermore, the study has ignored the new safety technology trends in the field of construction. For example, Artificial Intelligence-powered hazard detection technologies, real-time site monitoring, wearable sensors, etc. which have become crucial in the present construction safety management systems.
There are several pathways through which the C-SPI-AK framework could be refined and extended in future research, for example, the pilot tests on different construction sites could be conducted to reinforce the validation of its applicability. Furthermore, the study 'A Blockchain Information Management Framework for Construction Safety' puts forward the idea of using blockchain to improve construction safety by making information open and easy to track. If combined with the C-SPI-AK tool, blockchain could help reduce the subjectivity that often comes with safety evaluations by keeping safety records secure, unchangeable, and available in real time
Machine learning techniques and Structural equation modelling can help contribute towards validating the relation between the team-based safety performance indicators and teamwork, providing a more robust and empirical approach. In the future, researchers could take a longer-term approach by using the Construction Safety Performance Appraisal Kit regularly on real-world construction projects. This would help track how safety performance develops over time and give clearer insights into how teamwork improvements lead to better safety results in the long run.
8. Conclusions
The categorisation of the safety performance items was done using factor analysis (FA). The 21 safety performance items were categorized and grouped into six components as safety culture indicators (Cat1), Safety rules and behaviours indicators (Cat2), Safety practices and engagement indicators (Cat3), Safety communication and inspection indicators (Cat4), Management commitment indicators (Cat5) and Safety meetings and maintenance indicators (Cat6) which had an impact on the safety performance of construction workers. Applying principal component analysis (PCA) and Varimax rotation, these six components with eigenvalues exceeding 1 were uncovered. After 14 iterations, these components accounted for 55% of the variance in the response.
Fuzzy Synthetic Evaluation was applied to the safety performance indicators to identify their weight coefficients and assess for developing a safety performance index for the performance appraisal of construction work practices. Total mean values for each category were computed to determine the weight of each indicator by using the Fuzzy Synthetic Evaluation (FSE). Developing an index using Fuzzy Synthetic Evaluation (FSE) provides a sophisticated approach to assessing the relationship between the constructs and categories. In the process of formulating a safety performance index (C-SPI), the SPIs of each category underwent normalisation. Furthermore, the construction safety performance index appraisal kit (C-SPI-AK) was developed to ascertain the level of safety performance of construction workers during construction work activities. The experts validated the evaluation kit to ensure its usefulness, functionality, making decisions and adequacy for the construction workers’ safe work practices.
The research findings show the C-SPIs categories with their coefficients as Safety culture indicators (Cat1) with SPI index of 4.92 along with a coefficient of 0.186, Safety rules and behaviour indicators (Cat2) with an SPI index of 3.17 along with a coefficient of 0.120, Safety practices and engagement indicators (Cat3) with SPI index of 4.59 along with a coefficient of 0.174, Safety communication and inspection indicators (Cat4) with SPI index of 4.24 along with the coefficient of 0.161, Management commitment indicators (Cat5) with SPI index of 5.03 along with the coefficient of 0.191 and Safety meetings and maintenance indicators (Cat6) with the SPI index of 4.41 along with the coefficient of 0.167 which had an impact on the safety performance of construction workers. The research output provides an opportunity for academics and professionals in the field of construction work to determine the successful behaviours for improved safety performance of construction workers comprehensively and objectively in the construction sector in Australia. Furthermore, this research presents a roadmap for the future by evaluating construction workers' safety performance by utilising the C-SPI-AK. The future research could also aim at the large-scale validation of C-SPI-AK across different territories and different types of construction projects to validate its generalisability. The toolkit could be improved through longitudinal data, which could be used to track changes over time and the feedback from the construction professionals. This will make the C-SPI-AK more efficient and consistent for the actual construction projects.
Author Contributions
Conceptualization, Aziz Yousif Shaikh; Methodology, Aziz Yousif Shaikh; Software, Aziz Yousif Shaikh; Resources, Aziz Yousif Shaikh; Writing – original draft, Aziz Yousif Shaikh; Writing – review & editing, Aziz Yousif Shaikh, Mary P. Hardie, Robert Osei Kyei and Matt Stevens; Supervision, Mary P. Hardie, Robert Osei Kyei and Matt Stevens.
Funding
This research received no funding.
Institutional Review Board Statement
The study was conducted in accordance with the Declaration of Helsinki, and approved by Human Research Ethics Committee of Western Sydney University (protocol code: H14526 and approval date: 7 September 2021).
Informed Consent Statement
Informed consent was obtained from all subjects involved in the study.
Data availability: The paper includes the study’s distinctive insights. For any queries, please contact the corresponding author.
Conflicts of Interest
No conflicts of interest have been declared by the authors.
References
- SafeWorkAustralia. Annual Report . 2023-2024 [. Available online: https://www.safeworkaustralia.gov.au/media-centre/news/safe-work-australia-annual-report-2023-24.
- Fang, D.; et al. LCB approach for construction safety . Saf. Sci. 2020, 128, 104761. [Google Scholar] [CrossRef]
- Mills, A. A systematic approach to risk management for construction . Struct. Surv. 2001, 19(5), 245–252. [Google Scholar] [CrossRef]
- Brunette, M.J. Construction safety research in the United States: targeting the Hispanic workforce . Inj. Prev. 2004, 10(4), 244–248. [Google Scholar] [CrossRef] [PubMed]
- Bansal, V.K. Application of geographic information systems in construction safety planning . Int. J. Proj. Manag. 2011, 29(1), 66–77. [Google Scholar] [CrossRef]
- Edwards, D.; Nicholas, J. The state of health and safety in the UK construction industry with a focus on plant operators . Struct. Surv. 2002, 20(2), 78–87. [Google Scholar] [CrossRef]
- Cooke, D.L. A system dynamics analysis of the Westray mine disaster . Syst. Dyn. Rev. J. Syst. Dyn. Soc. 2003, 19(2), 139–166. [Google Scholar] [CrossRef]
- Goh, Y.M.; et al. Dynamics of safety performance and culture: A group model building approach . Accid. Anal. Prev. 2012, 48, 118–125. [Google Scholar] [CrossRef] [PubMed]
- Goh, Y.M.; Brown, H.; Spickett, J. Applying systems thinking concepts in the analysis of major incidents and safety culture . Saf. Sci. 2010, 48(3), 302–309. [Google Scholar] [CrossRef]
- Goh, Y.M.; Love, P.E. Methodological application of system dynamics for evaluating traffic safety policy . Saf. Sci. 2012, 50(7), 1594–1605. [Google Scholar] [CrossRef]
- Goh, Y.M.; et al. Organizational accidents: A systemic model of production versus protection . J. Manag. Stud. 2012, 49(1), 52–76. [Google Scholar] [CrossRef]
- Shin, M.; et al. A system dynamics approach for modeling construction workers’ safety attitudes and behaviors . In Accident Analysis & Prevention; 2014; Volume 68, pp. 95–105. [Google Scholar]
- Wanjiku, J. Assesment of Effectiveness of Health and Safety Systems in Construction Industry. A case Study of LEE Construction LTD. 2015. [CrossRef]
- Choudhry, R.M. Behavior-based safety on construction sites: A case study . Accid. Anal. Prev. 2014, 70, 14–23. [Google Scholar] [CrossRef] [PubMed]
- Guo, B.H.; Goh, Y.M.; Wong, K.L.X. A system dynamics view of a behavior-based safety program in the construction industry . Saf. Sci. 2018, 104, 202–215. [Google Scholar] [CrossRef]
- Gambatese, J.A.; Behm, M.; Hinze, J.W. Viability of designing for construction worker safety . J. Constr. Eng. Manag. 2005, 131(9), 1029–1036. [Google Scholar] [CrossRef]
- Giri, O.P.; Sainju, P.R.; Htet, A. Evaluating occupational health and safety practices in an airport construction project in Nepal . Built Environ. Proj. Asset Manag. 2025, 15(1), 149–164. [Google Scholar] [CrossRef]
- Sohail, A. Determining the Barriers to the Integration of Advanced Safety Technologies in the Construction Industry of Pakistan 2024. [CrossRef] [PubMed]
- Yin, Q.; Obonyo, E.; Asadi, S. Towards a multilevel framework of teamwork processes affecting construction safety outcomes . Buildings 2023, 13(7), 1728. [Google Scholar] [CrossRef]
- Dwyer, J.; Karanikas, N.; Sav, A. Scoping review of peer-reviewed empirical studies on implementing high reliability organisation theory . Saf. Sci. 2023, 164, 106178. [Google Scholar] [CrossRef]
- Mitropoulos, P.; Memarian, B. Team processes and safety of workers: Cognitive, affective, and behavioral processes of construction crews . J. Constr. Eng. Manag. 2012, 138(10), 1181–1191. [Google Scholar] [CrossRef]
- Sorock, G.S.; Smith, E.; Goldoft, M. Fatal occupational injuries in the New Jersey construction industry, 1983 to 1989 . J. Occup. Med. Off. Publ. Ind. Med. Assoc. 1993, 35(9), 916–921. [Google Scholar] [CrossRef] [PubMed]
- Sawacha, E.; Naoum, S.; Fong, D. Factors affecting safety performance on construction sites . Int. J. Proj. Manag. 1999, 17(5), 309–315. [Google Scholar] [CrossRef]
- Mitropoulos, P.; Cupido, G. Safety as an emergent property: investigation into the work practices of high-reliability framing crews . J. Constr. Eng. Manag. 2009, 135(5), 407–415. [Google Scholar] [CrossRef]
- Gambatese, J.A.; Hinze, J.; Behm, M. Investigation of the Viability of Designing for Safety; The Center to Protect Workers’ Rights (CPWR): Silver Spring, 2005. [Google Scholar]
- Fang, D.; Wu, C.; Wu, H. Impact of the supervisor on worker safety behavior in construction projects . J. Manag. Eng. 2015, 31(6), 04015001. [Google Scholar] [CrossRef]
- Reiman, T.; Pietikäinen, E. Leading indicators of system safety–monitoring and driving the organizational safety potential . Saf. Sci. 2012, 50(10), 1993–2000. [Google Scholar] [CrossRef]
- Shaikh, A.Y.; Osei-Kyei, R.; Hardie, M. A critical analysis of safety performance indicators in construction . Int. J. Build. Pathol. Adapt. 2021, 39(3), 547–580. [Google Scholar] [CrossRef]
- Toellner, J. Improving safety & health performance: identifying & measuring leading indicators . Prof. Saf. 2001, 46(9), 42. [Google Scholar]
- Wreathall, J. Leading? Lagging? Whatever! . Saf. Sci. 2009, 4(47), 493–494. [Google Scholar] [CrossRef]
- Mohamed, S. Safety climate in construction site environments . J. Constr. Eng. Manag. 2002, 128(5), 375–384. [Google Scholar] [CrossRef]
- Choudhry, R.M.; Fang, D.; Mohamed, S. The nature of safety culture: A survey of the state-of-the-art . Saf. Sci. 2007, 45(10), 993–1012. [Google Scholar] [CrossRef]
- Cooper, Towards a model of safety culture. Saf. Sci. 2000, 36(2), 111–136. [CrossRef]
- Fang, D.; Wu, H. Development of a Safety Culture Interaction (SCI) model for construction projects . Saf. Sci. 2013, 57, 138–149. [Google Scholar] [CrossRef]
- Geller, E.S. Ten principles for achieving a total safety culture . Prof. Saf. 1994, 39(9), 18. [Google Scholar]
- Alnaqbi, A.; Zeiada, W.; Al-Khateeb, G.G. Machine learning modeling of pavement performance and IRI prediction in flexible pavement . Innov. Infrastruct. Solut. 2024, 9(10), 385. [Google Scholar] [CrossRef]
- Umar, I.; Iyendo, T.O.; Adejumo, A. Assessing The Use of AI for Improving Safety and Performance for Building Construction Workers 2024. [CrossRef]
- Xu, X.; et al. Team Conscientiousness, Team Safety Climate, and Individual Safety Performance: a Cross-Level Mediation Model . J. Bus. Psychol. 2020, 35(4), 503–517. [Google Scholar] [CrossRef]
- Hughes, A.M.; et al. Saving lives: A meta-analysis of team training in healthcare . J. Appl. Psychol. 2016, 101(9), 1266. [Google Scholar] [CrossRef] [PubMed]
- Hülsheger, U.R.; Anderson, N.; Salgado, J.F. Team-level predictors of innovation at work: a comprehensive meta-analysis spanning three decades of research . J. Appl. Psychol. 2009, 94(5), 1128. [Google Scholar] [CrossRef] [PubMed]
- Kozlowski, S.W.; Ilgen, D.R. Enhancing the effectiveness of work groups and teams . Psychol. Sci. Public Interest 2006, 7(3), 77–124. [Google Scholar] [CrossRef] [PubMed]
- Marks, M.A.; Mathieu, J.E.; Zaccaro, S.J. A temporally based framework and taxonomy of team processes . Acad. Manag. Rev. 2001, 26(3), 356–376. [Google Scholar] [CrossRef] [PubMed]
- Hinze, J. Human aspects of construction safety . J. Constr. Div. 1981, 107(1), 61–72. [Google Scholar] [CrossRef]
- Hinze, J.; Gordon, F. Supervisor-worker relationship affects injury rate . J. Constr. Div. 1979, 105(3), 253–262. [Google Scholar] [CrossRef]
- Iverson, R.D.; Erwin, P.J. Predicting occupational injury: The role of affectivity . J. Occup. Organ. Psychol. 1997, 70(2), 113–128. [Google Scholar] [CrossRef]
- Cupido, G. The role of production and teamwork practices in construction safety: A cognitive model and an empirical case study . J. Saf. Res. 2009, 40(4), 265–275. [Google Scholar] [CrossRef] [PubMed]
- Burt, C.D.; Gladstone, K.L.; Grieve, K.R. Development of the considerate and responsible employee (CARE) scale . Work Stress 1998, 12(4), 362–369. [Google Scholar] [CrossRef]
- Geller, E.S. A total safety culture: From a corporate achievement to a global vision . Behav. Soc. Issues 2001, 11(1), 18. [Google Scholar]
- Geller, E.S.; Roberts, D.S.; Gilmore, M.R. Predicting propensity to actively care for occupational safety . J. Saf. Res. 1996, 27(1), 1–8. [Google Scholar] [CrossRef]
- Roberts, D.S.; Geller, E.S. An “actively caring” model for occupational safety: A field test . Appl. Prev. Psychol. 1995, 4(1), 53–59. [Google Scholar] [CrossRef]
- Shaikh, A.Y.; et al. Review of drivers of teamwork for construction health and safety . Int. J. Build. Pathol. Adapt. 2023. [Google Scholar] [CrossRef]
- Mitropoulos, P.; Abdelhamid, T.S.; Howell, G.A. Systems model of construction accident causation . J. Constr. Eng. Manag. 2005, 131(7), 816–825. [Google Scholar] [CrossRef]
- Mohammadi, A.; Tavakolan, M.; Khosravi, Y. Factors influencing safety performance on construction projects: A review . Saf. Sci. 2018, 109, 382–397. [Google Scholar] [CrossRef]
- Newaz, M.T.; et al. Developing a safety climate factor model in construction research and practice . In Engineering, construction and architectural management; 2018. [Google Scholar]
- Chen, H.; Li, H.; Goh, Y.M. A review of construction safety climate: Definitions, factors, relationship with safety behavior and research agenda . Saf. Sci. 2021, 142, 105391. [Google Scholar] [CrossRef]
- Choudhry, R.M.; Zahoor, H. Strengths and weaknesses of safety practices to improve safety performance in construction projects in Pakistan . J. Prof. Issues Eng. Educ. Pract. 2016, 142(4), 04016011. [Google Scholar] [CrossRef]
- Garland, R. The mid-point on a rating scale: Is it desirable . Mark. Bull. 1991, 2(1), 66–70. [Google Scholar]
- Zhang, X.; et al. A comparative study of critical success factors for public private partnerships (PPP) between Mainland China and the Hong Kong Special Administrative Region . Facilities 2012. [Google Scholar] [CrossRef]
- Ke, Y.; et al. Preferred risk allocation in China’s public–private partnership (PPP) projects . Int. J. Proj. Manag. 2010, 28(5), 482–492. [Google Scholar] [CrossRef]
- Robert, O.K.; Dansoh, A.; Ofori–Kuragu, J.K. Reasons for adopting public–private partnership (PPP) for construction projects in Ghana . Int. J. Constr. Manag. 2014, 14(4), 227–238. [Google Scholar] [CrossRef]
- Chan, A.P.; et al. Drivers for adopting public private partnerships—Empirical comparison between China and Hong Kong special administrative region . J. Constr. Eng. Manag. 2009, 135(11), 1115–1124. [Google Scholar] [CrossRef]
- Trinh Minh, T. Dev. Resilient Saf. Cult. Constr. Proj. Vietnam. 2018. [CrossRef]
- YINGBIN, F. Optim. Saf. Invest. Build. Proj. Singap. 2011. [CrossRef]
- Trinh, M.T. Developing resilient safety culture for construction projects in Vietnam; Western Sydney University (Australia), 2018. [Google Scholar]
- Jin, X. A Framework for Efficient Risk Allocation in Public-private Partnership Projects Using Neuro-fuzzy Techniques; University of Melbourne, Faculty of Architecture: Building and Planning, 2008. [Google Scholar]
- De Vaus, D. Research design in social research . In Research design in social research; 2001; pp. 1–296. [Google Scholar]
- Manu, P.A. An. Investig. Into Accid. Causal Influ. Constr. Proj. Featur. 2012. [CrossRef]
- Tijani, B. Developing a framework for mental health management of project management practitioners in architecture, engineering and construction project organizations 2022. [CrossRef]
- Osei-Kyei, R.; Chan, A.P. Developing a project success index for public–private partnership projects in developing countries . J. Infrastruct. Syst. 2017, 23(4), 04017028. [Google Scholar] [CrossRef]
- Hu, Y.; et al. Developing a program organization performance index for delivering construction megaprojects in China: Fuzzy synthetic evaluation analysis . J. Manag. Eng. 2016, 32(4), 05016007. [Google Scholar] [CrossRef]
- Mu, S.; et al. Assessing risk management capability of contractors in subway projects in mainland China . Int. J. Proj. Manag. 2014, 32(3), 452–460. [Google Scholar] [CrossRef]
- Brown, T.A. Confirmatory factor analysis for applied research; Guilford publications, 2015. [Google Scholar]
- Chan, A.P.; Owusu, E.K. Corruption forms in the construction industry: Literature review . J. Constr. Eng. Manag. 2017, 143(8), 04017057. [Google Scholar] [CrossRef]
- Owusu, E.K.; et al. Towards corruption-free cities: Measuring the effectiveness of anti-corruption measures in infrastructure project procurement and management in Hong Kong . Cities 2020, 96, 102435. [Google Scholar] [CrossRef]
- Norusis, M. SPSS 16.0 statistical procedures companion; Prentice Hall Press, 2008. [Google Scholar]
- Kumar, R. Research methodology: A step-by-step guide for beginners; Sage, 2018. [Google Scholar]
- Richard, F.; Anita, L. Research methods for construction; Blackwell Publishing Ltd: United Kingdom, 2008. [Google Scholar]
- Khatri, K.B.; Vairavamoorthy, K.; Akinyemi, E. Framework for computing a performance index for urban infrastructure systems using a fuzzy set approach . J. Infrastruct. Syst. 2011, 17(4), 163–175. [Google Scholar] [CrossRef]
- Sadiq, R.; Rodriguez, M.J. Fuzzy synthetic evaluation of disinfection by-products—a risk-based indexing system . J. Environ. Manag. 2004, 73(1), 1–13. [Google Scholar] [CrossRef] [PubMed]
- Xu, Y.; Chan, A.P.; Yeung, J.F. Developing a fuzzy risk allocation model for PPP projects in China . J. Constr. Eng. Manag. 2010, 136(8), 894–903. [Google Scholar] [CrossRef]
- Pallant, J. SPSS survival manual: A step by step guide to data analysis using IBM SPSS; McGraw-hill education (UK), 2020. [Google Scholar]
- Hair, J.; et al. Multivariate data analysis . In Cengage Learning; Hampshire, United Kingdom, 2019. [Google Scholar]
- Field, A. Discovering statistics using IBM SPSS statistics:(and sex and drugs and rock'n'roll): Andy Field; Sage, 2013. [Google Scholar]
- Nnaji, C.; et al. Development and application of safety technology adoption decision-making tool . J. Constr. Eng. Manag. 2020, 146(4), 04020028. [Google Scholar] [CrossRef]
- Yeung, J.F.; Chan, A.P.; Chan, D.W. Developing a performance index for relationship-based construction projects in Australia: Delphi study . J. Manag. Eng. 2009, 25(2), 59–68. [Google Scholar] [CrossRef]
- Goodrum, P.M.; et al. Model to predict the impact of a technology on construction productivity . J. Constr. Eng. Manag. 2011, 137(9), 678–688. [Google Scholar] [CrossRef]
- Li, G.; et al. Bid or no-bid decision model for international construction projects: Evidential reasoning approach . J. Constr. Eng. Manag. 2021, 147(2), 04020161. [Google Scholar] [CrossRef]
- Yap, J.B.H.; et al. Exploring the underlying factors inducing design changes during building production . Prod. Plan. Control 2018, 29(7), 586–601. [Google Scholar] [CrossRef]
- Fayek, A.R. Fuzzy logic and fuzzy hybrid techniques for construction engineering and management . J. Constr. Eng. Manag. 2020, 146(7), 04020064. [Google Scholar] [CrossRef]
- Langford, D.; Rowlinson, S.; Sawacha, E. Safety behaviour and safety management: its influence on the attitudes of workers in the UK construction industry . Eng. Constr. Archit. Manag. 2000, 7(2), 133–140. [Google Scholar] [CrossRef]
- Michael, J.H.; et al. Management commitment to safety as organizational support: Relationships with non-safety outcomes in wood manufacturing employees . J. Saf. Res. 2005, 36(2), 171–179. [Google Scholar] [CrossRef] [PubMed]
- Zohar, D. Safety climate in industrial organizations: theoretical and applied implications . J. Appl. Psychol. 1980, 65(1), 96. [Google Scholar] [CrossRef]
- Hinze, J.; Pedersen, C.; Fredley, J. Identifying root causes of construction injuries . J. Constr. Eng. Manag. 1998, 124(1), 67–71. [Google Scholar] [CrossRef]
- Chinda, T.; Mohamed, S. Structural equation model of construction safety culture . In Engineering, Construction and Architectural Management; 2008. [Google Scholar]
- Shohet, I.M.; Luzi, M.; Tarshish, M. Optimal allocation of resources in construction safety: Analytical-empirical model . Saf. Sci. 2018, 104, 231–238. [Google Scholar] [CrossRef]
- Wentz, C.A. Safety, health, and environmental protection; McGraw-Hill Companies, 1998. [Google Scholar]
- Lipscomb, H.J.; et al. Safety, incentives, and the reporting of work-related injuries among union carpenters:“You're pretty much screwed if you get hurt at work” . Am. J. Ind. Med. 2013, 56(4), 389–399. [Google Scholar] [CrossRef] [PubMed]
- Goodrum, P.M.; Gangwar, M. Safety incentives . Prof. Saf. 2004, 49(7), 24–34. [Google Scholar]
- Geller, E.S. The truth about safety incentives . Prof. Saf. 1996, 41(10), 34. [Google Scholar]
- Sims, B., Jr. Successful safety incentive programs . Prof. Saf. 1999, 44(4), 37. [Google Scholar]
- Gharibi, V.; et al. The relationship between workers’ attitude towards safety and occupational accidents experience . Int. J. Occup. Hyg. 2016, 8(3), 145–150. [Google Scholar]
- Chen, C.-F. Personality, safety attitudes and risky driving behaviors—Evidence from young Taiwanese motorcyclists . Accid. Anal. Prev. 2009, 41(5), 963–968. [Google Scholar] [CrossRef] [PubMed]
- Cox, S.J.; Cheyne, A.J. Assessing safety culture in offshore environments . Saf. Sci. 2000, 34(1-3), 111–129. [Google Scholar] [CrossRef]
- Kohn, J.P. Behavioral Engineering Through Safety Training: The BEST Approach; Charles C. Thomas Publisher, 1988. [Google Scholar]
- Cooper, M. Current issues in health and safety training in the UK . J. Eur. Ind. Train. 1998. [Google Scholar] [CrossRef]
- Burke, C.S.; et al. Understanding team adaptation: A conceptual analysis and model . J. Appl. Psychol. 2006, 91(6), 1189. [Google Scholar] [CrossRef] [PubMed]
- Demirkesen, S.; Arditi, D. Construction safety personnel's perceptions of safety training practices . Int. J. Proj. Manag. 2015, 33(5), 1160–1169. [Google Scholar] [CrossRef]
- Jannadi, O.A.; Almishari, S. Risk assessment in construction . J. Constr. Eng. Manag. 2003, 129(5), 492–500. [Google Scholar] [CrossRef]
- Fung, I.W.; et al. Psychological climate in occupational safety and health: the safety awareness of construction workers in South China . Int. J. Constr. Manag. 2016, 16(4), 315–325. [Google Scholar] [CrossRef]
- Hallowell, M.R.; Bhandari, S.; Alruqi, W. Methods of safety prediction: analysis and integration of risk assessment, leading indicators, precursor analysis, and safety climate . Constr. Manag. Econ. 2020, 38(4), 308–321. [Google Scholar] [CrossRef]
- Park, C.-S.; Kim, H.-J. A framework for construction safety management and visualization system . Autom. Constr. 2013, 33, 95–103. [Google Scholar] [CrossRef]
- Griffiths, D. Safety attitudes of management . Ergonomics 1985, 28(1), 61–67. [Google Scholar] [CrossRef] [PubMed]
- Mearns, K.; Whitaker, S.M.; Flin, R. Safety climate, safety management practice and safety performance in offshore environments . Saf. Sci. 2003, 41(8), 641–680. [Google Scholar] [CrossRef]
- Guo, B.H.; Yiu, T.W. Developing leading indicators to monitor the safety conditions of construction projects . J. Manag. Eng. 2016, 32(1), 04015016. [Google Scholar] [CrossRef]
- Alsamadani, R.; Hallowell, M.; Javernick-Will, A.N. Measuring and modelling safety communication in small work crews in the US using social network analysis . Constr. Manag. Econ. 2013, 31(6), 568–579. [Google Scholar] [CrossRef]
- Patel, D.A.; Jha, K.N. Neural network approach for safety climate prediction . J. Manag. Eng. 2015, 31(6). [Google Scholar] [CrossRef]
- Urban, J.M.; et al. Effects of workload and structure on team processes and performance: Implications for complex team decision making . Hum. Factors 1996, 38(2), 300–310. [Google Scholar] [CrossRef]
- Cooper, M.L. Motivations for alcohol use among adolescents: Development and validation of a four-factor model . Psychol. Assess. 1994, 6(2), 117. [Google Scholar] [CrossRef]
- Mullen, J. Investigating factors that influence individual safety behavior at work . J. Saf. Res. 2004, 35(3), 275–285. [Google Scholar] [CrossRef] [PubMed]
- Lingard, H.; Rowlinson, S. Behavior-based safety management in Hong Kong's construction industry . J. Saf. Res. 1997, 28(4), 243–256. [Google Scholar] [CrossRef]
- Hinze, J.; Gambatese, J. Factors that influence safety performance of specialty contractors . J. Constr. Eng. Manag. 2003, 129(2), 159–164. [Google Scholar] [CrossRef]
- Hinze, J.; Raboud, P. Safety on large building construction projects . J. Constr. Eng. Manag. 1988, 114(2), 286–293. [Google Scholar] [CrossRef]
- Jaselskis, E.J.; Anderson, S.D.; Russell, J.S. Strategies for achieving excellence in construction safety performance . J. Constr. Eng. Manag. 1996, 122(1), 61–70. [Google Scholar] [CrossRef]
- Cohen, H.H.; Cleveland, R.J. Safety program practices in record-holding plants . Prof. Saf. 1983, 28(3), 26–33. [Google Scholar]
- Cohen, A. Safety Program Practices in High Versus Low Accident Rate Companies: An Interim Report-Questionnaire Phase 1975. [CrossRef]
- Smith, M.J.; et al. Characteristics of successful safety programs . J. Saf. Res. 1978. [Google Scholar]
- Alruqi, W.M.; Hallowell, M.R. Critical success factors for construction safety: review and meta-analysis of safety leading indicators . J. Constr. Eng. Manag. 2019, 145(3), 04019005. [Google Scholar] [CrossRef]
- Vitharana, V.; De Silva, G.; De Silva, S. Health hazards, risk and safety practices in construction sites–a review study . Eng. J. Inst. Eng. Sri Lanka 2015, 48(3). [Google Scholar] [CrossRef]
- Garavan, T.N.; O'Brien, F. An investigation into the relationship between safety climate and safety behaviours in Irish organisations . Ir. J. Manag. 2001, 22(1), 141. [Google Scholar]
- Panuwatwanich, K.; Al-Haadir, S.; Stewart, R.A. Influence of safety motivation and climate on safety behaviour and outcomes: evidence from the Saudi Arabian construction industry . Int. J. Occup. Saf. Ergon. 2017, 23(1), 60–75. [Google Scholar] [CrossRef] [PubMed]
- Rapp, R.; George, B. Maintenance management concepts in construction equipment curricula . J. Constr. Educ. 1998, 2(2), 155–69. [Google Scholar]
- Lin, K.-Y.; et al. Training of low-literacy and low-English-proficiency Hispanic workers on construction fall fatality . J. Manag. Eng. 2018, 34(2), 05017009. [Google Scholar] [CrossRef]
- Wang, Y.; et al. Craft training issues in American industrial and commercial construction . J. Constr. Eng. Manag. 2008, 134(10), 795–803. [Google Scholar] [CrossRef]
- Lingard, H.; Wakefield, R.; Cashin, P. The development and testing of a hierarchical measure of project OHS performance . Eng. Constr. Archit. Manag. 2011, 18(1), 30–49. [Google Scholar] [CrossRef]
- Toole, T.M. Construction site safety roles . J. Constr. Eng. Manag. 2002, 128(3), 203–210. [Google Scholar] [CrossRef]
- Minchin, R.E., Jr.; et al. Case for drug testing of construction workers . J. Manag. Eng. 2006, 22(1), 43–50. [Google Scholar] [CrossRef]
- Biggs, H.; et al. Utilising a safety culture management approach in the Australian construction industry . In in QUT Research Week 2005: Conference Proceedings; Queensland University of Technology, 2005. [Google Scholar]
- Heinrich, H.; Petersen, D.; Roos, N. Industrial Accident Prevention . In McGraw Hill-New York; 1980. [Google Scholar]
- Lingard, H.; Rowlinson, S.M. Occupational health and safety in construction project management; Taylor & Francis, 2005. [Google Scholar]
- Salminen, S.; Tallberg, T. Human errors in fatal and serious occupational accidents in Finland . Ergonomics 1996, 39(7), 980–988. [Google Scholar] [CrossRef] [PubMed]
- Mohamed, S. Empirical investigation of construction safety management activities and performance in Australia . Saf. Sci. 1999, 33(3), 129–142. [Google Scholar] [CrossRef]
Table 2.
Mean ratings and weights of construction workers’ safety performance indicators and categories.
Table 2.
Mean ratings and weights of construction workers’ safety performance indicators and categories.
| Code | Safety Performance Indicators |
Mean | Weight | Total Mean | Category Weight |
| SP15 | Attitude towards safety | 3.95 | 0.169 | 23.32 | 0.315 |
| SP16 | Safety orientation & training | 4.02 | 0.172 | ||
| SP17 | Safety risk assessment | 4.07 | 0.174 | ||
| SP6 | Stop work authority | 3.71 | 0.159 | ||
| SP20 | Jobsite safety auditing | 3.72 | 0.160 | ||
| SP3 | Safety climate | 3.85 | 0.165 |
Table 3.
Membership functions for SPIs and GSPIs (Level 1 and Level 2).
| Code | Safety performance indicators |
Membership functions for SPIs Level 1 |
Membership functions for GSPIs Level 2 |
||||||
| Cat 1: Safety culture indicators | 1 2 3 4 5 | 0.04 0.08 0.08 0.52 0.48 | |||||||
| SP15 | Attitude toward safety | 0.169 | 0.02 0.09 0.10 0.52 0.47 | - - - - - | |||||
| SP16 | Safety orientation and training | 0.172 | 0.02 0.09 0.11 0.51 0.47 | - - - - - | |||||
| SP17 | Safety risk assessment | 0.174 | 0.07 0.04 0.05 0.43 0.61 | - - - - - | |||||
| SP6 | Stop work authority | 0.159 | 0.04 0.11 0.03 0.55 0.47 | - - - - - | |||||
| SP20 | Jobsite safety auditing | 0.160 | 0.04 0.07 0.14 0.61 0.34 | - - - - - | |||||
| SP3 | Safety climate | 0.165 | 0.04 0.08 0.05 0.54 0.49 | - - - - - |
|||||
| Code | Safety performance indicators |
Membership functions for SPIs Level 1 |
Membership functions for GSPIs Level 2 |
||||||
|
Cat 2: Safety rules and behaviour indicators |
1 2 3 4 5 | 0.05 0.07 0.06 0.40 0.24 | |||||||
| SP 5 | Safety rules and procedures | 0.327 | 0.08 0.10 0.07 0.57 0.38 | - - - - - | |||||
| SP7 | Worker behaviour observation | 0.335 | 0.06 0.09 0.10 0.60 0.35 | - - - - - | |||||
| SP21 | Jobsite hazards | 0.018 | 0.10 0.35 0.15 0.41 0.19 | - - - - - | |||||
| Code | Safety performance indicators |
Membership functions for SPIs Level 1 |
Membership functions for GSPIs Level 2 |
||||||
|
Cat 3: Safety practices and engagement indicators |
1 2 3 4 5 | 0.05 0.07 0.06 0.40 0.24 | |||||||
| SP 9 | Personal protective equipment | 0.191 | 0.06 0.12 0.05 0.66 0.31 | - - - - - | |||||
| SP12 | Workers’ involvement | 0.224 | 0.03 0.09 0.15 0.67 0.26 | - - - - - | |||||
| SP13 SP19 SP11 |
Risk-taking behaviour Safety inspection of Jobsite Increase in the rate of errors |
0.188 0.187 0.207 |
0.07 0.31 0.13 0.39 0.30 0.01 0.08 0.05 0.42 0.64 0.08 0.18 0.07 0.52 0.35 |
- - - - - - - - - - - - - - - |
|||||
| Code | Safety performance indicators |
Membership functions for SPIs Level 1 |
Membership functions for GSPIs Level 2 |
||||||
|
SP14 SP18 |
Cat 4: Safety communication and inspection indicators Communication and consultation Safety Walkthroughs |
0.492 0.507 |
1 2 3 4 5 0.10 0.27 0.09 0.43 0.31 0.09 0.18 0.10 0.50 0.33 |
0.09 0.22 0.09 0.46 0.32 - - - - - - - - - - |
|||||
| Code |
Safety performance indicators |
Membership functions for SPIs Level 1 |
Membership functions for GSPIs Level 2 |
||||||
| Cat 5: Management indicators | 1 2 3 4 5 | 0.02 0.07 0.05 0.53 0.52 | |||||||
Table 4.
Safety performance index (SPI) and coefficient for each category.
| Code | Categories | SPI | Coefficients |
| Cat 1 | Safety culture indicators | 4.92 | 0.186 |
| Cat 2 | Safety rules and behaviour indicators | 3.17 | 0.120 |
| Cat 3 | Safety practices and engagement indicators | 4.59 | 0.174 |
| Cat 4 | Safety communication and inspection indicators | 4.24 | 0.161 |
| Cat 5 | Management indicators | 5.03 | 0.191 |
| Cat 6 | Safety meetings and maintenance indicators | 4.41 | 0.167 |
| Total | 26.36 | 1.00 |
Table 5.
Average SPI of each category.
| Code | Safety performance indicator | GroupScores | Average index | Total index | Max. Score |
| Cat 1 Safety culture indicators | |||||
| SP 15 | Attitude toward safety | 4.6 | 4.7 | 28 | 30 |
| SP 16 | Safety orientation and training | 4.7 | |||
| SP17 | Safety risk assessment | 4.8 | |||
| SP6 | Stop work authority | 4.4 | |||
| SP20 | Jobsite safety auditing | 4.8 | |||
| SP3 | Safety climate | 4.8 | |||
| Code | Safety performance indicator | GroupScores | Average index | Total index | Max. Score |
| Cat 2 Safety rules and behaviour indicators | |||||
| SP5 | Safety rules and procedures | 4.7 | 4.7 | 14 | 15 |
| SP7 | Worker behaviour observation | 4.6 | |||
| SP21 | Jobsite hazards | 4.8 | |||
| Code | Safety performance indicator | GroupScores | Average index | Total index | Max. Score |
| Cat 3 Safety practices and engagement indicators | |||||
| SP9 | Personal protective equipment | 4.7 | 4.7 | 23 | 25 |
| SP12 | Workers’ involvement | 4.8 | |||
| SP13 | Risk-taking behaviour | 4.6 | |||
| SP19 | Safety inspection of the job site | 4.8 | |||
| SP11 | Increase in rate of errors | 4.7 | |||
| Code | Safety performance indicator | GroupScores | Average index | Total index | Max. Score |
| Cat 4 Safety communication and inspection indicators | |||||
| SP14 | Communication and consultation | 4.6 | 4.6 | 9.3 | 10 |
| SP18 | Safety walkthroughs | 4.7 | |||
Table 8.
Appraisal kit (C-SPI-AK) feedback from construction professionals.
| Validation aspects/questions | Mean rating (1-7) | Median rating |
| 1. Is the evaluation kit (C-SPI-AK) easy to use | 6.0 | 6.0 |
| 2. Are the suggested groupings for indicators appropriate? | 6.3 | 6.2 |
| 3. Is the appraisal kit (C-SPI-AK) able to help you make a decision? | 6.2 | 6.5 |
| 4. Is the suggested appraisal kit practicable during the construction work activities? | 6.0 | 6.0 |
| 5. Are the recognized indicators shown in the appraisal kit adequate and useful for evaluating the safety performance of construction workers? | 6.4 | 6.3 |
Disclaimer/Publisher’s Note: The statements, opinions and data contained in all publications are solely those of the individual author(s) and contributor(s) and not of MDPI and/or the editor(s). MDPI and/or the editor(s) disclaim responsibility for any injury to people or property resulting from any ideas, methods, instructions or products referred to in the content. |
© 2026 by the authors. Licensee MDPI, Basel, Switzerland. This article is an open access article distributed under the terms and conditions of the Creative Commons Attribution (CC BY) license (http://creativecommons.org/licenses/by/4.0/).
Copyright: This open access article is published under a Creative Commons CC BY 4.0 license, which permit the free download, distribution, and reuse, provided that the author and preprint are cited in any reuse.