
Submitted:
07 November 2026
Posted:
09 November 2026
You are already at the latest version
Abstract
The flexural capacity of composite cold-formed steel (CFS) beams is often limited by premature instability of the thin-walled section, so that the compressive capacity of the slab is not fully used. This paper examines which measures remove that limit and when a higher concrete grade becomes worthwhile. A nonlinear finite element model, validated against three full-scale tests, was used in a parametric study of thirty beams. The variables were the slab cross-section, the CFS profile, the concrete grade, the type and spacing of plate shear connectors, and stiffening by web stiffeners and a lower-flange plate. Four failure modes were identified, and the toughness followed their hierarchy rather than the ranking of peak loads. At equal self-weight a hollow slab raised the peak load by 37%, and inverting the lips of the channel raised it by 78% while making the connector spacing almost irrelevant. Web stiffeners raised the toughness by up to 124%, against 27% for a lower-flange plate that gave the higher strength. Raising the grade from C30 to C60 was worth 6.6% in peak load while the section buckled locally but 12.9% once stiffened: high-performance concrete pays only after the instability of the steel section is suppressed.
Keywords:
cold-formed steel
; composite beam
; hollow slab
; web stiffener
; failure mode
; toughness
1. Introduction
Cold-formed steel (CFS) members are attractive for floors and roofs because they combine a high strength-to-weight ratio with dry, fast and largely prefabricated construction, and back-to-back built-up channels are increasingly used as beams over spans that a single section cannot cover [1,2,3]. The same thinness that makes them economical brings the section close to three instabilities at once: local buckling of the compression flange and web, distortional buckling of the flange-lip assembly, and lateral-torsional buckling of the member. Design rules therefore reduce the capacity of a CFS beam through effective-width or direct-strength procedures, and in bending the compression elements usually buckle long before the steel has yielded over the section [4,5,6,7]. Casting a concrete slab on the top flange and connecting the two changes this picture. The slab restrains the compression flange, raises the neutral axis and adds a stiff compression chord, so that a composite cold-formed steel beam (CCFSB) is considerably stronger and stiffer than the bare section [8,9,10,11]. Its capacity is then limited by whichever of three components fails first: the thin-walled steel section, the shear connection or the slab. When the steel section governs, the compressive capacity of the slab is not fully mobilized; therefore, measures that enhance the concrete, such as using a higher concrete grade or high-performance concrete with strength and toughness far exceeding those of ordinary concrete [12,13,14,15], provide little benefit. The present paper is concerned with this hierarchy and with the means of changing it: the shape of the CFS profile, the geometry of the slab, the shear connection, the external stiffening of the section and the concrete grade.
The flexural behaviour of bare CFS beams has been studied extensively. Roy et al. [1] tested and modelled back-to-back built-up channel beams, Hussein and Papp [2] reviewed how the positioning of screws and bolts prevents premature failure of built-up sections, and Ren et al. [16] and Lee et al. [17] examined channels in pure bending and in combined bending and web crippling. Laím et al. [18] quantified the influence of thickness, depth and length, and later showed for sigma sections at ambient and elevated temperature that web stiffeners may change the structural response depending on the section form [19]. Several studies have sought to raise the buckling resistance by modifying the section: Ajay et al. [20] added diagonal stiffeners to raise the elastic buckling stress in shear, Wang and Young [21] showed that intermediate web stiffeners in built-up sections delay local and distortional buckling, Ye et al. [22] optimized the shape of channel sections in bending, El-Taly and El-shami [23] used 24 validated models to assess web and flange stiffeners across failure modes, Ma et al. [24] reported the interaction between sectional and global buckling in closed built-up double-sigma and triple-channel beams, and Elbacklesh et al. [25] strengthened the hollow web of built-up I-beams and attributed the gain to a more uniform redistribution of load. Hussein and Papp [3] and Hussein [26] showed for built-up I-shaped sections that edge stiffeners and batten reinforcement recover most of the flexural and web-crippling capacity lost to web perforations. The common thread is that the capacity of a bare CFS beam is set by the instability of its most slender plate element, and that folds, lips and stiffeners raise it by shortening the buckling half-wavelength or by restraining a free edge. The same principle holds for slender steel plate girders, where longitudinal web stiffeners change the governing failure mode rather than merely delaying it [27,28,29].
The composite system has been studied mainly through its shear connection. Lakkavalli and Liu [30] compared bent-up tabs, pre-drilled holes and self-drilling screws as shear-transfer enhancements, and Irwan et al. [31,32] tested bent-up triangular tabs; both found the enhanced specimens stronger than those relying on bond alone. Hsu et al. [9,33] and Majdi et al. [34] developed a furring-channel connector and showed that bond-slip reduces the strength and initial stiffness relative to full interaction. Bamaga et al. [8,35] proposed bracket connectors, showed in push-out tests that their strength depends on the connector deformation and on the concrete strength, and tested full-scale composite beams that were markedly stronger and stiffer than a non-composite companion. In push-out tests on composite columns of four CFS sigma sections with concrete infill, screw connectors failed mainly by crushing of the surrounding concrete rather than by shearing of the screws [36]. Other systems include U-shaped sections with ferro-cement slabs [37], boxed sections with rebar connectors in self-compacting concrete [38], sections whose upper part or reformed flange is embedded in the slab [39], epoxy, screw and Z-tab connections [40], thin-walled channel connectors in trussed floors [41], and the LWT-Floor system with welded corrugated-web beams [42,43], as well as CFS floors with oriented strand board concrete slabs [11] and precast high-performance concrete slabs on steel beams with grouted shear keys [44]. Shi et al. [40] found that shear buckling of the joist web was the primary failure mechanism, and Ataei et al. [45,46] showed for demountable bolted connections that thin CFS members fail by distortional buckling before the connector does, so that an adequate section thickness is required for the connection to govern. For conventional composite beams, Victoire et al. [47] showed that the layout and degree of the shear connection govern the flexural response, which is the variable examined here through the connector spacing. For headed studs, machine-learning models trained on 1,121 push-out results identified the stud diameter and the elastic modulus of the concrete among the parameters that govern the shear capacity [48], and a metaheuristic-tuned model with SHAP explainability was developed for the same connector [49]. For perfobond (PBL) connectors in ultra-high-performance concrete, push-out tests and numerical simulation were combined to derive an analytical load–slip relation for the elastic stage [50]. Tests on steel–concrete composite beams with circular web openings showed that the position of the openings affects the ultimate load more than their number [51]. Rajić et al. [52] and Karimipanah et al. [53] identified the section thickness and type, the connection and the slab strength and thickness as the principal variables, while Lee et al. [54], Rahnavard et al. [55] and Ha et al. [56] extended the system to shear, elevated temperature and prestressing. The authors have examined this system in two earlier numerical studies: engineered cementitious composite slabs combined with different stiffener arrangements as a means of raising the toughness of CCFSBs [57], and channel and sigma sections with web stiffeners of varying spacing, type and thickness under positive and negative moment, including ultra-high-performance concrete slabs [10]. Both kept a solid slab and a conventional lipped profile, and neither examined the connector spacing or classified the failure modes. A third study used a validated numerical model of the same system for evolutionary optimization of its response [58]. A related study of corroded steel-concrete bridge beams, whose steel loses strength and ductility with the extent and morphology of the corrosion [59,60], showed that replacing the slab by ultra-high-performance concrete and adding a tension-flange plate act synergistically, the combination restoring more capacity than the sum of the two measures [61]. For a steel–concrete beam strengthened with a composite plate, the concrete–steel connection mode governed the interface slip, which was smallest with adhesive bonding and largest with shear studs alone [62].
From the previous studies, three conclusions can be drawn with confidence. Composite action through a suitable connector raises the strength and stiffness of a CFS beam well above those of the bare section [8,9,40]. The failure of a CCFSB is frequently governed by instability of the thin-walled steel section, whether local or distortional buckling of the flange or shear buckling of the web, rather than by crushing of the slab or failure of the connector, especially when the section is thin [8,40,45]. And modifications of the section shape and intermediate stiffeners raise the buckling resistance of bare CFS sections [21,22,23,25], and web stiffeners applied to a composite CFS beam raise its toughness [10,57].
The previous studies also have clear limitations with respect to the problem examined here. The section-shape and stiffener studies [3,19,20,21,22,23,24,25,26] concern bare beams, so it is not known whether their benefits survive once the top flange is restrained by a slab, or whether they change the failure mode of the composite beam. The composite studies [8,9,30,31,32,33,34,35,37,38,39,40,41,42,43,45,46,52,53,54,55] vary the connector and the slab around a conventional lipped channel, so the dependence of the connector demand on the stiffness of the steel profile has not been quantified. The slabs examined are solid or cast on profiled decking, and a hollow slab that raises the flexural rigidity for the same self-weight has not been considered. The concrete strength has been identified as influential [10,35,53], but no study has asked whether a higher grade can be exploited at all while the steel section is the weak link, so the value of high-performance concrete in these beams is unknown. Finally, most studies report the peak load, while the energy absorbed up to failure, which governs robustness, is rarely examined together with the failure mechanism, although the two need not be improved by the same measures. The design specifications for cold-formed members [5,6] treat the steel section alone and give no rules for this composite system or for crediting external stiffeners.
The motivation of the present study is therefore to establish, for composite CFS beams whose capacity is limited by instability of the steel section, which measures change the governing failure mode, by how much they raise the strength and the toughness, and under what conditions a higher concrete grade becomes worthwhile. To that end, a geometrically and materially nonlinear finite element (FE) model is validated against three full-scale beams tested by Bamaga et al. [8]; a parametric study of thirty beams of 3000 mm span is performed in three groups, covering the slab cross-section, the CFS profile (double-channel and double-sigma sections, with and without inverted lips) and the concrete grade, the type and spacing of the shear connectors, and external stiffening by angle and trapezoidal web stiffeners and a lower-flange plate, applied individually and in combination; the failure of each beam is classified into one of four modes from the deformed shape and the von Mises stress field at failure; and the peak load and the toughness of each beam are interpreted through its failure mode, which is shown to be the variable that decides both the toughness and the benefit of a higher concrete grade.
2. Finite Element Model and Validation
2.1. Reference Tests
The model was validated against three full-scale beams tested by Bamaga et al. [8] (Figure 1). Each beam was 4360 mm long with a 4000 mm span and consisted of two back-to-back lipped C-channels, 250 mm deep and 2 mm thick, acting with a 1000 mm wide and 110 mm thick concrete slab cast over a metal deck and reinforced with a 6 mm mesh. Specimen FSSBSC250-20 was connected to the slab through single-bracket connectors (SBSC) and FSDBSC250-20 through double-bracket connectors (DBSC); FSSC250-20 was a non-composite companion. The 2 mm thick connectors were 100 mm long, 78 mm wide and 190 mm deep, and each was bolted to the two channels with two M16 grade 8.8 bolts [8,35].
2.2. Geometry, Elements and Mesh
The model was built in ABAQUS/CAE [63]. The CFS channels and the connectors were modelled with four-node doubly curved shell elements with reduced integration, hourglass control and finite membrane strains (S4R), the slab with eight-node brick elements with reduced integration (C3D8R), and the reinforcing bars with two-node truss elements (T3D2). A mesh study was performed with element sizes of 50, 20, 10 and 5 mm for the steel and 100, 50 and 20 mm for the concrete and the bars (Figure 2b). The peak load changed negligibly below 10 mm for the steel and 50 mm for the concrete and bars, which were adopted, in line with comparable studies [10,57,64,65,66]; a 20 mm concrete mesh was used where the crack pattern of the slab was to be resolved. The meshed slab and steel assembly are shown in Figure 2(c, d).
2.3. Material Models
The CFS was described by a bilinear elastic-plastic law (Figure 2a) with the coupon properties of Table 1. The reinforcing bars were assigned a yield stress of 641 MPa, an ultimate stress of 676.9 MPa and a Poisson’s ratio of 0.3, with an elastic-plastic law with hardening [67,68,69,70].
The concrete was represented by the concrete damage plasticity (CDP) model, which accounts for tensile cracking and compressive crushing and is widely used for composite and strengthened members [71,72]. The cylinder strength was 23 MPa, the elastic modulus Ec = 20,600 MPa and Poisson’s ratio 0.15 [8]. The compressive stress-strain relation of Carreira and Chu [73] was adopted,
where σc and εc are the compressive stress and strain and εc0 is the strain at the peak stress fc. In tension the stress rose linearly to the tensile strength ft at the cracking strain εt0 and softened beyond it [64],
σc = fc β (εc/εc0) / [β − 1 + (εc/εc0)β]
β = (fc/32.4)3 + 1.55
σt = ft [1.2 (εt/εt0) − 0.2 (εt/εt0)6], 0 ≤ εt ≤ εt0
σt = ft (εt/εt0) / [1.25 (εt/εt0 − 1)2 − εt/εt0], εt > εt0
2.4. Interactions, Boundary Conditions and Solution
Surface-to-surface contact was defined between the slab and the steel section, and the reinforcing bars and the connectors were embedded in the slab. The bolts joining the connectors to the channel webs were represented with the ABAQUS fastener tool, rather than with the explicit bolt models used when the progressive failure of the joint itself is of interest [74], with surface-to-surface contact between each web and the connector. One support was a hinge and the other a roller. The two loads were applied through coupling constraints on the top surface of the slab in displacement control, and the analysis was quasi-static with the implicit solver.
The contact between the slab and the steel section was defined as hard in the normal direction and frictional in the tangential direction, with a friction coefficient of 0.3. Initial geometric imperfections and residual stresses, which in press-braked sections concentrate at the corners [75,76], were not introduced: the restraint of the compression flange by the slab makes the composite response insensitive to them, as the validation in Section 2.5 confirms; the non-composite beam, whose flange is unrestrained, is the one case in which this simplification is felt.
2.5. Validation
Table 3 compares the measured and computed peak loads and the deflections at peak load, and Figure 3 the load-deflection curves. For the two composite beams the ratio of measured to computed peak load is 1.02 and 1.04, and the deflection at peak load is predicted within 8 and 16%. The model reproduces the initial stiffness, the gradual loss of stiffness and the post-peak plateau of both beams. The computed failure modes (Figure 4) also agree with those reported for the tests [8]. In the composite beams the model develops local buckling of the compression flange and upper web of the channels beneath the loading points (Figure 4a), which is where the tested beams failed, and transverse cracks in the slab under the loads (Figure 4b), matching the crack pattern photographed in the tests; in the non-composite beam it develops local buckling of the unrestrained compression flange (Figure 4c), again as observed. The agreement in mechanism, and not only in peak load, is what qualifies the model for the parametric study.
The non-composite beam is the exception: the model overestimates its peak load by 23%, although it reproduces the deflection at peak within 2%. This beam is governed by local buckling of a compression flange that no slab restrains, which is the case most sensitive to initial imperfections [75] and to the idealization of the bolted connections, whereas in the composite beams the slab restrains the flange and the response is far less sensitive to these assumptions. Since every beam of the parametric study is composite, the model is considered adequate for the purpose, and its use is restricted to composite beams.
3. Parametric Study
3.1. Design of the Study
All parametric beams shared the baseline of the control beam: a simply supported span of 3000 mm under four-point bending, a built-up CFS section 250 mm deep and 2 mm thick, and a 700 mm wide concrete slab. The material models and the modelling procedure were those of Section 2; the only material variable was the cylinder strength of the slab, fc = 30, 40, 50 and 60 MPa (C30 to C60). Thirty beams were analyzed in three groups (Table 4). Group one covers the slab cross-section, the CFS profile and the concrete grade; group two the type and spacing of the shear connectors; and group three the external stiffening of the section, applied individually and in combination, together with a concrete-grade sweep on the best configuration.
Each beam is identified by a code A-B-C-D-E, in which A is the slab (RS, rectangular solid slab; HS, hollow slab), B the CFS section (DC, back-to-back double channel; DS, double sigma; DCi and DSi, their inverted-lip counterparts), C the connector and its spacing in mm (SPSC, single-plate; DPSC, double-plate), D the concrete grade (C30 to C60), and E, where present, the external stiffening (LS and TS, angle and trapezoidal web stiffeners with their spacing in mm; LFP, lower-flange plate). HS-DC-SPSC300-C30 is the control beam.
3.2. Slab and Section Geometry
The rectangular and hollow slabs (Figure 5a, b) have the same self-weight of 188 kg/m, so that their comparison isolates the effect of the slab geometry. For that weight the hollow slab has a stiffness-to-weight ratio of 206.86 cm4/kg against 38.47 cm4/kg for the solid slab, 5.4 times higher, and it was adopted for all other beams. Voided slabs are used for the same reason in flat-slab construction, where the void height is the variable that trades self-weight against stiffness and shear capacity [77]. The four CFS profiles (Figure 5c to f) have the same depth of 250 mm and thickness of 2 mm, so that their comparison isolates the profile geometry. The sigma profile carries an intermediate fold that divides the web into two narrower panels; in the inverted-lip profiles the lips are turned inward.
The solid slab is 700 mm wide and 107.4 mm deep, and the hollow slab is 700 mm wide and 200 mm deep with two 270 x 120 mm voids, leaving 40 mm outer walls, an 80 mm central web and 40 mm top and bottom flanges (Figure 5b); the two slabs therefore have the same cross-sectional area of 75,200 mm2. The channel and sigma profiles are 250 mm deep with 80 mm flanges and 20 mm lips; the sigma profile has a 25 mm deep web fold spanning the middle 150 mm of the web depth, and the inverted-lip profiles carry the same dimensions with the lips turned inward (Figure 5c to f).
3.3. Shear Connectors
Whereas the reference tests used bracket connectors, the parametric study used plate connectors placed between the back-to-back channels (Figure 6d, e), because the plate is simpler to fabricate, transfers shear over a larger contact area and allows the type and spacing to be varied consistently. The single-plate (SPSC) and double-plate (DPSC) connectors were each fixed to the channels with M16 grade 8.8 bolts. The type was varied on all four profiles and the spacing (225, 300 and 450 mm) on DC and DCi.
3.4. External Stiffeners
Three stiffening devices were examined (Figure 6a to c): an angle web stiffener (LS) and a trapezoidal web stiffener (TS), both bolted to the web at 300 mm spacing, and a plate attached to the lower (tension) flange (LFP).
The angle stiffener has 60 x 60 mm legs; the trapezoidal stiffener is 50 mm deep with a 100 mm crown, inclined webs of 50 mm horizontal projection and 40 mm flat feet; and the lower-flange plate is 160 mm wide and 2000 mm long, centered on the span. All three devices are 2 mm thick, the same as the channels, and are bolted to the webs or to the flange, the bolts being represented with the fastener tool as for the connectors.
3.5. Performance Measures
Four quantities were extracted from each load-deflection curve: the peak load Pu; the midspan deflection at the first peak, δu; the maximum deflection Δu, taken at the end of the analysis; and the toughness T, taken as the area under the complete curve up to Δu. The toughness measures the energy absorbed over the whole loading history and therefore distinguishes a beam that loses its peak load abruptly, or that deforms at a low load, from one that sustains a high load over a long deflection range. All thirty analyses used an identical step definition and were terminated at the same prescribed number of increments, so that Δu is the midspan deflection at the last converged increment rather than a physically defined failure deflection. In every model the peak load was reached well before this point, so the strengths are independent of the termination setting; the toughness values are comparative quantities, evaluated under identical termination conditions and interpreted as ratios to the control beam rather than as absolute energy capacities.
4. Results and Discussion
4.1. Overview and Classification of Failure Modes
Table 5 lists the results. The control beam reached Pu = 278.1 kN at δu = 22 mm, with Δu = 34.7 mm and T = 7.96 kN m. Across the study the peak load ranged from 202.6 kN (RS-DC-SPSC300-C30) to 709.0 kN (HS-DCi-SPSC300-C60-LFP-TS300), and the toughness from 5.63 to 34.98 kN m.
The maximum von Mises stress in the CFS section lay between 545.5 and 575.7 MPa in every model, a scatter of less than 6%, so the beams were distinguished not by whether the steel yielded but by the extent of the yielded region and by the instability that ended the response. Yielding always began in the constant-moment region and spread along the tension flange, and no lateral-torsional deformation was observed, since the slab restrained the compression flange over its full length. Four failure modes were identified from the deformed shapes and stress fields, and are illustrated for each group in Section 4.2 to 4.4:
- Mode A: local buckling of the compression flange and upper web concentrated in a single sharp fold beneath a loading point (standard channel);
- Mode B: local buckling distributed over several longer half-waves without a dominant fold (sigma profile);
- Mode C: distortional rippling of the compression flange along the span with extensive yielding of the web and tension flange and no localized fold (inverted-lip profiles);
- Mode D: flexural yielding of the flanges while the web panels between successive stiffeners remain largely elastic (web-stiffened sections).
A lower-flange plate alone did not change the mode of the profile to which it was attached (Section 4.4), so the plated inverted-lip beams are assigned to Mode C. The four modes form the framework for the following sections.
4.2. Section Geometry and Concrete Grade
The hollow slab raised the peak load from 202.6 to 278.1 kN (+37.3%) and the toughness by 41.3% at an unchanged maximum deflection (Figure 7a). Both beams failed in Mode A with the fold in the same place (Figure 8a, b), the fold of the solid-slab beam being deeper and its maximum stress higher (572.1 against 556.0 MPa). The slab geometry therefore did not change the mechanism; it delayed it. At the same self-weight the hollow slab is 1.9 times as deep and 5.4 times stiffer, so the neutral axis of the composite section rises, the lever arm of the slab increases, and a larger share of the moment is carried by the slab before the critical stress is reached in the steel flange. The solid-slab beam also lost load immediately after its peak, whereas the hollow-slab beam held its peak to the end of the analysis.
The double-sigma and double-channel curves coincide up to about 150 kN (Figure 7b), since the web fold does not change the initial flexural stiffness. Beyond that load the channel softens first, and the sigma section reaches a peak of 316.6 kN (+13.8%) at 30 mm instead of 22 mm, with a maximum deflection 40.6% larger and a toughness 62.4% larger. The sigma section failed in Mode B (Figure 8d, e): the fold divides the web into two narrower panels and lengthens the buckling wave, so that capacity is lost gradually rather than abruptly. The gain is therefore mainly in deformation and energy, not in strength.
Raising the concrete grade from C30 to C60 increased the peak load of the channel section by 3.4, 4.1 and 6.6% (Figure 7d) and that of the sigma section by 2.3, 6.4 and 7.4% (Figure 7c). The curves of each section are indistinguishable up to 250 kN, and the peak moved to larger deflections as the grade increased (22 to 28 mm for DC, 30 to 39 mm for DS). The gain in toughness was 7.2% for the channel but 13.7% for the sigma section, the latter coming from a fuller post-peak plateau. The contours explain why the gain is small: for the channel the fold occupies the same position and the maximum stress varies only between 555.8 and 556.4 MPa from C30 to C60 (Figure 8b, c). The instability that ends the response develops at the same steel stress irrespective of the grade, so the extra compressive capacity of the slab remains unused. The distributed Mode B of the sigma section lets the slab work somewhat longer before the steel becomes unstable, which is why the same change of grade is worth twice as much toughness to the sigma section.
4.3. Shear Connection
The connector spacing controlled the degree of composite action of the standard channel (Figure 9a). The three curves separated almost from the origin; reducing the spacing from 300 to 225 mm raised the peak load by 14.9% and the toughness by 65.9%, while widening it to 450 mm reduced the peak load by 21.2%. Both spaced variants failed in Mode A (Figure 10a, b), but the fold at 450 mm was deeper and its maximum stress higher (575.7 against 568.8 MPa): with less composite action the steel section carries a larger share of the moment, and its compression flange buckles earlier and more severely. The beam with 450 mm spacing deflected 21.0% more than the control beam yet absorbed 1.1% less energy, because the extra deformation came from a more severe local collapse at a load 21.2% lower. Partial interaction, therefore, does not compensate in energy for the strength it costs.
The inverted-lip channel was almost insensitive to the spacing (Figure 9b). Its three curves coincide up to about 350 kN, and the peak load changed by only +1.2% at 225 mm and -1.8% at 450 mm. All three beams failed in Mode C with nearly identical contours (Figure 10c, d). Because the compression flange of this profile is restrained by its own lip rather than by composite action alone, the demand on each connector is lower and near-full interaction is maintained at the widest spacing examined. The required connector spacing thus depends on the profile: 450 mm carries no measurable penalty for DCi, whereas DC needs the closer spacing to develop its capacity.
Replacing the single-plate by the double-plate connector at 300 mm left the response of all four profiles unchanged (Figure 9c to f). The peak load changed by at most 0.7%, the toughness by at most 1.0%, and each double-plate beam failed in the mode of its single-plate companion (Figure 10e, f), including the snap-back at the end of the inverted-lip channel curve, which confirms that this unloading reflects the instability of the section and not the connection. Within the range studied, it is the spacing of the connectors, not their configuration, that governs the composite action, and the choice between the two plate types can be made on fabrication grounds.
4.4. External Stiffening
Applied individually to the inverted-lip channel (Figure 11a), the stiffening devices improved the response in two different ways. The lower-flange plate stiffened the ascending branch from the start and gave the highest peak load, 547.0 kN (+10.2%), but its curve descended gently after the peak and ended at 39.5 mm, only 9.7% beyond that of the unstiffened beam, so the toughness rose by 26.7%. The web stiffeners followed the unstiffened curve up to about 450 kN, adding no stiffness, but removed the abrupt post-peak instability: both peaked at about 45 mm, reached 538.8 kN (TS, +8.6%) and 526.8 kN (LS, +6.2%), and continued to 68.1 and 67.1 mm, so that the toughness rose by 124.0% and 116.5%. Both web-stiffened beams failed in Mode D (Figure 12a, b): the stiffeners divide the web into short panels that do not buckle at the stress attained, the web remains lightly stressed, and the beam fails by progressive yielding of its flanges. The trapezoidal stiffener was slightly better than the angle, by 2.3% in peak load and 3.5% in toughness.
Applied to each profile in turn (Figure 11b to e), the lower-flange plate raised the peak load by 7.9% (DC), 7.8% (DS), 10.2% (DCi) and 9.3% (DSi), a nearly uniform gain. The toughness gains were 11.0, 20.1, 26.7 and 13.4%. On DS the plate removed the load drop that followed the peak, on DCi it removed the final unloading segment, and on DSi it moved the peak from 22 to 35 mm. The contours (Figure 12c, d) show that the plated DC and DS beams still failed in Modes A and B, with milder deformation and a longer yielded tension flange. By adding area to the tension flange the plate lowers the neutral axis and shortens the compression zone, which raises the load at which the compression flange becomes unstable without changing how that instability develops. This explains why its benefit is moderate and largely independent of the profile.
Combining the plate with a web stiffener was super-additive in strength (Figure 11f). With the trapezoidal stiffener the peak load of the inverted-lip channel rose by 26.5%, against 10.2 and 8.6% for the two devices applied separately; with the angle stiffener it rose by 20.0% against 10.2 and 6.2%. The combined beams failed in Mode D with a longer yielded tension flange and a fully yielded plate in the constant-moment region (Figure 12e, f). The two devices act on complementary parts of the mechanism: the plate raises the load at which instability starts, and the web stiffener prevents it from propagating once started.
Raising the concrete grade of the plated, trapezoidally stiffened beam from C30 to C60 increased the peak load by 3.9, 7.9 and 12.9%, to 709.0 kN, and the toughness by 16.9, 25.1 and 37.5%, to 34.98 kN m (Figure 11f). The mode remained D, while the yielded region grew with the grade and the maximum steel stress rose from 561.7 to 573.3 MPa (Figure 12f, g). The contrast with Figure 8(b, c), where the grade changed nothing in the contour, is the central result of the study. Once the web instability is suppressed the steel can yield over a far larger volume and the slab is used much more completely, so that the same increase in grade was worth 12.9% in strength and 37.5% in toughness instead of 6.6 and 7.2% for the unstiffened channel. HS-DCi-SPSC300-C60-LFP-TS300 was the strongest and toughest beam of the study, exceeding the control beam by 154.9% in peak load and 339.5% in toughness.
4.5. Toughness and the Failure-Mode Hierarchy
Figure 13 sets the peak-load and toughness gains of all thirty beams side by side, colored by failure mode. The toughness ranged from -29.2% to +339.5% of the control value, and only two beams fell below it: the solid-slab beam (-29.2%) and the channel with 450 mm connector spacing (-1.1%), whose larger deflection was obtained at a lower load.
The ranking of toughness follows the failure mode, not the peak load. Every Mode A beam lay below +12%, with the single exception of the closely spaced connector arrangement (+65.9%); the Mode B beams lay between +62 and +95%; the Mode C beams between +79 and +196%; and every Mode D beam exceeded +190%. Within a mode, the peak load can be a poor guide. The inverted-lip sigma section absorbed twice as much energy as the inverted-lip channel (+160.6 against +79.6%) despite a peak load 5.6% lower, and the web-stiffened inverted-lip channels gave the two largest single-device toughness gains of the study (+302.3 and +288.7%) with peak loads below that of the plated beam, whose toughness gain was +127.6%. A beam selected on peak load alone would thus have been the plated one, which absorbs 43% less energy than the trapezoidally stiffened beam.
The same trade-off appears when the devices are combined. Adding the plate to the trapezoidally stiffened beam raised the peak load by 16.5% but reduced the toughness by 20.5% (from +302.3 to +219.7% of the control value); for the angle stiffener the figures are +13.1% and -24.5%. The plate shortens the descending branch, and the energy lost along the deflection axis exceeds that gained along the load axis. Only at C60 did the combined beam overtake the trapezoidally stiffened beam in toughness, by 9.2%; at C30 the simpler and lighter web-stiffened section absorbs appreciably more energy.
Figure 14 examines what the toughness gains are made of. Since T is the area under the load-deflection curve, it can be written as T = F Pu Δu, where the fullness ratio F = T/(Pu Δu) describes the shape of the curve: F = 1 for a rigid-plastic response that holds Pu up to Δu, and lower values for a curve with a long elastic rise or a steep descending branch. Figure 14(a) shows that F is nearly constant across the study. The thirty values lie between 0.79 and 0.88 (Table 6), and a single proportionality, T = 0.85 Pu Δu, reproduces all thirty toughness values with R2 = 0.996 and a maximum error of 7%. The shape of the curve therefore contributes little to the differences in toughness; almost the whole of the spread from 5.6 to 35.0 kN.m comes from the product of the peak load and the maximum deflection.
Figure 14(b) splits the toughness ratio of each principal comparison into its three multiplicative factors, and the split identifies the quantity through which each measure acts. The hollow slab, the inverted lips, the closer connector spacing and the lower-flange plate act almost entirely through the peak load, their deflection factors being close to unity. The sigma fold, the inverted-lip sigma profile and above all the web stiffeners act mainly through the maximum deflection: the trapezoidal stiffener multiplied the toughness of the inverted-lip channel by 2.24, of which a factor of 1.89 came from the deflection, 1.09 from the peak load and 1.09 from the fuller curve. Adding the plate to the stiffened beam raised the load factor to 1.17 but reduced the deflection factor to 0.71, a net factor of 0.79, whereas raising the grade of the combined beam from C30 to C60 acted on both, 1.13 in load and 1.19 in deflection. The 450 mm spacing is the one case in which the two factors cancel, a deflection factor of 1.21 against a load factor of 0.79. Table 6 summarizes the same picture by failure mode: the maximum deflection, not the peak load or the curve shape, is what separates Mode D from the other three, and it is the reason the toughness hierarchy follows the mode.
4.6. Interaction of the Stiffening Devices
Figure 15 makes the interaction between the lower-flange plate and the web stiffeners explicit by comparing the gain of each combination with the sum of the gains of its two constituents applied separately. In peak load the combinations are super-additive: the plate and the trapezoidal stiffener gave 10.2 and 8.6% alone, 18.8% in sum and 26.5% together, an interaction ratio of 1.41, and the plate with the angle stiffener gave a ratio of 1.22. In toughness the combinations are strongly sub-additive: 26.7 and 124.0% alone against 78.0% together, a ratio of 0.52, and 0.44 for the angle stiffener. The two ratios have the same origin. The web stiffener suppresses the instability of the web, so that the beam fails by flexural yielding (Mode D) and the plate, which adds area to the tension flange, can raise the flexural capacity in full, whereas on the unstiffened section the contribution of the plate is cut short by the instability. The same change of mechanism, however, replaces the long post-peak plateau of the web-stiffened beam by a descending branch, because the plated section yields at a higher load and the eventual failure of the compression flange is more abrupt (Figure 11f). The interaction is therefore favourable for a design governed by strength and unfavourable for one governed by energy absorption. At C30 the trapezoidally stiffened beam without the plate absorbs 26% more energy than the plated one, while the plated one carries 17% more load, and the choice between them depends on which quantity governs.
4.7. Sensitivity to Concrete Grade and Connector Spacing
Figure 16 summarizes the two sensitivities that depend most strongly on the failure mode. Figure 16(a) and (b) plot the gains in peak load and toughness against the cylinder strength for the three sections whose grade was varied, together with the slope of a linear fit through the four points. The slope in peak load rises from 0.21%/MPa for the channel (Mode A) to 0.26%/MPa for the sigma section (Mode B) and 0.43%/MPa for the plated and stiffened inverted-lip channel (Mode D), and the slope in toughness from 0.22 to 0.42 and 1.21%/MPa. Each step up the failure-mode hierarchy thus roughly doubles the value of a unit of concrete strength, and in the stiffened section the 30 MPa increase in grade was worth as much toughness as the sigma fold, the inverted lip or the lower-flange plate applied to the standard channel. The relations are close to linear over the range examined, so that the gains can be interpolated for intermediate grades.
Figure 16(c) plots the change in peak load and toughness against the connector spacing for the two channel profiles. For the standard channel the response is steep on both sides of the reference spacing, +14.9 and -21.2% in peak load and +65.9 and -1.1% in toughness, whereas for the inverted-lip channel the whole range lies within 2% in peak load and within 10% in toughness. The inverted lip therefore not only raises the capacity by 78% but also removes the dependence of the beam on its shear connection: the widest spacing examined may be used with the inverted-lip profile without penalty, whereas the standard channel needs the closest spacing to reach 319.6 kN, about the capacity of the sigma section at the reference spacing. For a beam of this type the spacing of the connectors and the shape of the profile are therefore interchangeable to a degree, and the profile is the more economical of the two, since it adds no parts.
5. Conclusions
A nonlinear FE model of composite cold-formed steel beams was validated against three full-scale tests and used for a thirty-beam parametric study of a 3000 mm span covering the slab geometry, the CFS profile, the concrete grade, the shear connection and external stiffening. The main conclusions are:
- The model predicted the peak loads of the two composite test beams with measured-to-computed ratios of 1.02 and 1.04 and precisely reproduced their failure modes.
- At equal self-weight, a hollow slab raised the peak load by 37.3% and the toughness by 41.3% relative to a solid slab without changing the failure mode, owing to its 5.4 times higher stiffness-to-weight ratio.
- Four failure modes govern the system: a concentrated flange-web fold (Mode A, standard channel), distributed local buckling (Mode B, sigma), distortional rippling with extensive yielding (Mode C, inverted lip) and flange yielding with elastic web panels (Mode D, web-stiffened). The maximum steel stress varied by less than 6% across all models, so the mode, not yielding, distinguished the beams.
- Inverting the lips gave the largest single-parameter gain in strength, 78% for the channel and 48% for the sigma profile, and made the inverted-lip channel insensitive to the connector spacing, whereas the standard channel lost a fifth of its capacity at the widest spacing. The connector type, single or double plate, had no measurable effect.
- Strength and toughness were raised by different devices. On the inverted-lip channel the lower-flange plate gave the highest strength but only a modest gain in toughness, whereas the web stiffeners gave a smaller gain in strength and more than doubled the toughness. Combining the plate with a web stiffener was super-additive in strength (about 1.4 times the sum of the separate gains) but sub-additive in toughness (about half the sum), because the plate shortens the post-peak plateau that the stiffener creates.
- Raising the concrete grade from C30 to C60 was worth about 7% in peak load and toughness while the channel failed by local buckling (Mode A), but 13% in peak load and 38% in toughness once the section was stiffened and failed by flange yielding (Mode D). High-performance concrete is therefore of value in these beams only after the premature instability of the steel section has been suppressed.
- The toughness of all thirty beams followed the failure-mode hierarchy rather than the ranking of peak loads: the Mode A beams stayed within a few percent of the control beam, Modes B and C gained roughly one to two times its toughness, and every Mode D beam gained about three times or more. The governing mode, rather than the peak load, should therefore guide the selection of strengthening measures.
Author Contributions
Conceptualization, S.A.G., H.M.M., Y.E.I. and M.T.N.; methodology, S.A.G., A.M.M., H.M.M., Y.E.I. and M.T.N.; software, A.M.M.; validation, A.M.M. and Y.E.I.; formal analysis, S.A.G., A.M.M. and M.T.N.; investigation, S.A.G., A.M.M., H.M.M., Y.E.I. and M.T.N.; data curation, A.M.M.; writing—original draft preparation, S.A.G. and A.M.M.; writing—review and editing, S.A.G., H.M.M., Y.E.I. and M.T.N.; visualization, A.M.M. and M.T.N.; supervision, S.A.G., H.M.M. and M.T.N.; project administration, S.A.G., H.M.M. and M.T.N. All authors have read and agreed to the published version of the manuscript.
Funding
This research received no external funding.
Data Availability Statement
The finite element results supporting this study are available from the corresponding author on reasonable request.
Acknowledgments
The authors would like to acknowledge the support of Prince Sultan University for covering the Article Processing Charges (APC) of this publication.
Conflicts of Interest
The authors declare no conflicts of interest.
References
- Roy, K.; Ho Lau, H.; Ting, T.C.H.; Chen, B.; Lim, J.B.P. Flexural behaviour of back-to-back built-up cold-formed steel channel beams: experiments and finite element modelling. Structures 2021, 29, 235–253. [Google Scholar] [CrossRef]
- Hussein, A.B.; Papp, F. State-of-the-art: integrating fastener technology and design guidelines for enhanced performance of cold-formed steel sections. Buildings 2023, 13, 2338. [Google Scholar] [CrossRef]
- Hussein, A.B.; Papp, F. Structural behavior of built-up I-shaped cold-formed steel beams with edge-stiffened holes, unstiffened holes, plain webs, and batten reinforcement. Results Eng. 2025, 28, 107545. [Google Scholar] [CrossRef]
- Schafer, B.W. Review: The Direct Strength Method of cold-formed steel member design. J. Constr. Steel Res. 2008, 64, 766–778. [Google Scholar] [CrossRef]
- AISI S100-16; North American Specification for the Design of Cold-Formed Steel Structural Members. American Iron and Steel Institute: Washington, DC, USA, 2016.
- EN 1993-1-3:2006; Eurocode 3: Design of steel structures, Part 1-3: General rules, Supplementary rules for cold-formed members and sheeting. European Committee for Standardization (CEN): Brussels, Belgium, 2006.
- Vu, H.H.; Vu, Q.A.; Pham, C.H. Local buckling coefficients for thin-walled lipped channels under bending about asymmetrical axis. Results Eng. 2025, 26, 104935. [Google Scholar] [CrossRef]
- Bamaga, S.O.; Tahir, M.M.; Ngian, S.P.; Mohamad, S.; Sulaiman, A.; Aghlara, R. Structural behaviour of cold-formed steel of double C-lipped channel sections integrated with concrete slabs as composite beams. Lat. Am. J. Solids Struct. 2019, 16, 1–15. [Google Scholar] [CrossRef]
- Hsu, C.T.T.; Punurai, S.; Punurai, W.; Majdi, Y. New composite beams having cold-formed steel joists and concrete slab. Eng. Struct. 2014, 71, 187–200. [Google Scholar] [CrossRef]
- Nawar, M.T.; El-Zohairy, A.; Eisa, A.S.; Mohammed, A.; Gomaa, S. FE parametric study of composite cold-formed steel beams under positive and negative loadings. J. Compos. Sci. 2025, 9, 209. [Google Scholar] [CrossRef]
- Duan, H.; Cao, B.; Zeng, X.; Liu, J. Flexural performance of cold-formed steel-OSB-concrete composite floor slabs. Results Eng. 2026, 29, 109937. [Google Scholar] [CrossRef]
- Gomaa, S.; Bhaduri, T.; Alnaggar, M. Coupled experimental and computational investigation of the interplay between discrete and continuous reinforcement in ultrahigh performance concrete beams. I: Experimental testing. J. Eng. Mech. 2021, 147, 04021049. [Google Scholar] [CrossRef]
- Bhaduri, T.; Gomaa, S.; Alnaggar, M. Coupled experimental and computational investigation of the interplay between discrete and continuous reinforcement in ultrahigh performance concrete beams. II: Mesoscale modeling. J. Eng. Mech. 2021, 147, 04021050. [Google Scholar] [CrossRef]
- Gomaa, S.; Alnaggar, M. Transitioning from shear to flexural failure of ultra-high-performance concrete beams by varying fiber content. In Proceedings of the 2nd International Interactive Symposium on Ultra-High-Performance Concrete, Albany, NY, USA, 2–5 June 2019. [Google Scholar] [CrossRef]
- Bhaduri, T.; Gomaa, S.; Alnaggar, M. Prediction of flow-induced fiber orientation and its effects on hardened behavior of ultra-high-performance concrete: An experimental and numerical study. J. Build. Eng. 2025, 108, 112738. [Google Scholar] [CrossRef]
- Ren, W.X.; Fang, S.E.; Young, B. Analysis and design of cold-formed steel channels subjected to combined bending and web crippling. Thin-Walled Struct. 2006, 44, 314–320. [Google Scholar] [CrossRef]
- Lee, Y.H.; Lee, Y.L.; Tan, C.S. Experimental investigation on cold-formed steel beams under pure bending. J. Teknol. (Sci. Eng.) 2012, 58, 13–20. [Google Scholar] [CrossRef]
- Laím, L.; Rodrigues, J.P.C.; da Silva, L.S. Experimental and numerical analysis on the structural behaviour of cold-formed steel beams. Thin-Walled Struct. 2013, 72, 1–13. [Google Scholar] [CrossRef]
- Laím, L.; Rodrigues, J.P.C.; Craveiro, H.D. Flexural behaviour of beams made of cold-formed steel sigma-shaped sections at ambient and fire conditions. Thin-Walled Struct. 2015, 87, 53–65. [Google Scholar] [CrossRef]
- Ajay, P.S.; Samuel, J.; Joanna, P.S.; Sakaria, E. Flexural behaviour of cold formed steel beams with diagonal stiffener. Int. J. Eng. Trends Technol. 2014, 17, 406–410. [Google Scholar] [CrossRef]
- Wang, L.; Young, B. Behavior of cold-formed steel built-up sections with intermediate stiffeners under bending. I: Tests and numerical validation. J. Struct. Eng. 2016, 142, 1–9. [Google Scholar] [CrossRef]
- Ye, J.; Hajirasouliha, I.; Becque, J.; Pilakoutas, K. Development of more efficient cold-formed steel channel sections in bending. Thin-Walled Struct. 2016, 101, 1–13. [Google Scholar] [CrossRef]
- El-Taly, B.; El-shami, M. Structural performance of cold-formed steel face-to-face and back-to-back beams. Int. J. Civ. Eng. 2021, 19, 1427–1444. [Google Scholar] [CrossRef]
- Ma, D.; Rasmussen, K.J.R.; Zhang, H. Test and design of cold-formed steel closed built-up beams with double sigma sections and triple lipped channel sections. Thin-Walled Struct. 2023, 192, 111192. [Google Scholar] [CrossRef]
- Elbacklesh, T.A.; Khalil, N.N.; El-Shenawy, I.M.; Abou-Rayan, A.M. Flexural behavior of cold-formed steel I-beams strengthened in the web with different materials. J. Constr. Steel Res. 2024, 223, 109083. [Google Scholar] [CrossRef]
- Hussein, A.B. Web crippling behavior of cold-formed steel built-up I-sections with stiffened and unstiffened perforated webs. Results Eng. 2025, 28, 107565. [Google Scholar] [CrossRef]
- Ishac, I.; El-Hosseiny, O.; Matar, E.; Gomaa, S. Behavior analysis of stiffened slender plate girders. In Proceedings of the IABSE Conference, Sharm El Sheikh, Egypt, 2012. [Google Scholar]
- Ishac, I.; El-Hosseiny, O.; Matar, E.; Gomaa, S. Experimental and theoretical analysis of stiffened plate girders. In Proceedings of the Eurosteel Conference, Naples, Italy, 2014. [Google Scholar]
- Gomaa, S.; Elbelasi, M.; Elsisi, A.; Matar, E.; El-Hosseiny, O.; Ishac, I.; Nawar, M.T. Failure-mode switching in longitudinally stiffened slender steel I-girders: experiments and simulations. SSRN 2026. [Google Scholar] [CrossRef]
- Lakkavalli, B.S.; Liu, Y. Experimental study of composite cold-formed steel C-section floor joists. J. Constr. Steel Res. 2006, 62, 995–1006. [Google Scholar] [CrossRef]
- Irwan, J.M.; Hanizah, A.H.; Azmi, I. Test of shear transfer enhancement in symmetric cold-formed steel-concrete composite beams. J. Constr. Steel Res. 2009, 65, 2087–2098. [Google Scholar] [CrossRef]
- Irwan, J.M.; Hanizah, A.H.; Azmi, I.; Koh, H.B. Large-scale test of symmetric cold-formed steel (CFS)-concrete composite beams with BTTST enhancement. J. Constr. Steel Res. 2011, 67, 720–726. [Google Scholar] [CrossRef]
- Hsu, C.T.T.; Munoz, P.R.; Punurai, S.; Majdi, Y.; Punurai, W. Behavior of composite beams with cold-formed steel joists and concrete slab. In Proceedings of the 21st International Specialty Conference on Cold-Formed Steel Structures, 2012; pp. 339–353. [Google Scholar]
- Majdi, Y.; Hsu, C.T.T.; Zarei, M. Finite element analysis of new composite floors having cold-formed steel and concrete slab. Eng. Struct. 2014, 77, 65–83. [Google Scholar] [CrossRef]
- Bamaga, S.O.; Tahir, M.M.; Tan, C.S.; Shek, P.N.; Aghlara, R. Push-out tests on three innovative shear connectors for composite cold-formed steel concrete beams. Constr. Build. Mater. 2019, 223, 288–298. [Google Scholar] [CrossRef]
- Simon, S.S.; Colla, N.; Kafle, B.; Al-Ameri, R. Assessing the shear capacity of screw connectors in composite columns of cold-formed steel and concrete infill. J. Compos. Sci. 2025, 9, 261. [Google Scholar] [CrossRef]
- Alhajri, T.M.; Tahir, M.M.; Azimi, M.; Mirza, J.; Lawan, M.M.; Alenezi, K.K.; Ragaee, M.B. Behavior of pre-cast U-shaped composite beam integrating cold-formed steel with ferro-cement slab. Thin-Walled Struct. 2016, 102, 18–29. [Google Scholar] [CrossRef]
- Salih, M.N.A.; Tahir, M.M.; Mohammad, S.; Ahmad, Y. Behavior of boxed cold-formed steel as composite beam with rebar as shear connector; Springer International Publishing: Cham, Switzerland, 2019. [Google Scholar] [CrossRef]
- Mahmoud, N.S.; Abd-Rabou, S.E.M.; Ghannam, M.; Abdel-Kader, A.A. Experimental and theoretical study of composite cold formed steel-concrete beams. Int. J. Sci. Eng. Res. 2019, 7, 1–10. [Google Scholar] [CrossRef]
- Shi, Y.; Yang, K.; Guan, Y.; Yao, X.; Xu, L.; Zhang, H. The flexural behavior of cold-formed steel composite beams. Eng. Struct. 2020, 218, 110819. [Google Scholar] [CrossRef]
- de Seixas Leal, L.A.A.; de Miranda Batista, E. Composite floor system with cold-formed trussed beams and prefabricated concrete slab: selected and extended contribution of SDSS 2019. Steel Constr. 2020, 13, 12–21. [Google Scholar] [CrossRef]
- Lukačević, I.; Ćurković, I.; Rajić, A.; Čudina, I. Innovative lightweight cold-formed steel-concrete composite floor system: LWT-FLOOR project. IOP Conf. Ser. Mater. Sci. Eng. 2021, 1203, 032078. [Google Scholar] [CrossRef]
- Ćurković, I.; Lukačević, I.; Žuvelek, V.; Rajić, A. Numerical investigation of shear connection in cold-formed steel-concrete composite beam. ce/papers 2022, 5, 847–856. [Google Scholar] [CrossRef]
- Mirmoghtadaei, S.; Mostofinejad, D.; Eftekhar, M.R. Innovative precast HPC slab-steel composite floor with high-strength expansive grout shear key: a full-scale experimental evaluation under uniform stacking loading. Results Eng. 2026, 29, 108749. [Google Scholar] [CrossRef]
- Ataei, A.; Mahmoudy, S.A.; Zeynalian, M.; Chiniforush, A.A.; Ngo, T.D. Experimental study of innovative bolted shear connectors in demountable cold-formed steel-concrete composite beams. Thin-Walled Struct. 2023, 192, 111116. [Google Scholar] [CrossRef]
- Ataei, A.; Mahmoudy, S.A. Modeling of innovative bolted shear connectors in demountable cold-formed steel-concrete composite beams: validation of finite element model and parametric study. J. Build. Eng. 2024, 95, 110076. [Google Scholar] [CrossRef]
- Victoire, A.B.; Mwero, J.N.; Gathimba, N. Experimental study on the effect of partial shear studs layout on flexural behavior of steel-concrete composite beams. Results Eng. 2024, 21, 101959. [Google Scholar] [CrossRef]
- Haruna, S.I.; Farouk, A.I.B.; Ibrahim, Y.E.; Nawar, M.T.; Abdulrahman, S.; Abdulhadi, M. Insights into the feature-selection mechanisms for modeling the shear capacity of stud connectors in concrete: A machine learning approach. J. Compos. Sci. 2026, 10, 34. [Google Scholar] [CrossRef]
- Haruna, S.I.; Bashir, A.; Abba, S.I.; Ibrahim, Y.E.; Gomaa, S.; Gora, A.M.; Nawar, M.T. Metaheuristic-based prediction of shear resistance of headed stud connectors embedded in concrete coupled with SHAP explainability. Results Eng. 2025, 25, 104445. [Google Scholar] [CrossRef]
- Xiao, L.; He, Y.; Wang, H.; Wei, X.; Liao, X.; Wang, Y.; Dai, X. Analysis of elastic-stage mechanical behavior of PBL shear connector in UHPC. J. Compos. Sci. 2025, 9, 547. [Google Scholar] [CrossRef]
- Shnain, M.D.; Al Zaidee, S.R. Experimental investigation of the structural behavior of steel–concrete composite beams with circular web openings. J. Compos. Sci. 2026, 10, 346. [Google Scholar] [CrossRef]
- Rajić, A.; Lukačević, I.; Skejić, D.; Ungureanu, V. Cold-formed steel-concrete composite beams with back-to-back channel sections in bending. Civ. Eng. J. 2023, 9, 2345–2369. [Google Scholar] [CrossRef]
- Karimipanah, A.; Zeynalian, M.; Ataei, A. A numerical study on a novel demountable cold-formed steel composite beam with profiled steel sheeting. Thin-Walled Struct. 2024, 199, 111812. [Google Scholar] [CrossRef]
- Lee, C.; Bae, B.H.; Lee, K.S.; Kim, T. Experimental study on shear performance of composite beam using lipped channels. Structures 2024, 70, 107707. [Google Scholar] [CrossRef]
- Rahnavard, R.; Craveiro, H.D.; Simões, R.A.; Santiago, A.; Laím, L.; Gardner, L. Built-up cold-formed steel-lightweight concrete (CFS-LWC) composite beams subjected to elevated temperatures. ce/papers 2024, 7, 202–208. [Google Scholar] [CrossRef]
- Ha, N.; Gao, H.Y.; Wang, L.G.; Fu, S.Y. Experimental and numerical investigations of the bending performance of prestressed cold-formed U-section steel-concrete composite beams. Structures 2025, 79, 109591. [Google Scholar] [CrossRef]
- Nawar, M.T.; Silem, O.A.; Ibrahim, I.; Maaly, H.M.; Ibrahim, Y.E. Enhancing the toughness of composite cold-formed steel beams with ECC and different stiffener arrangements and shapes. J. Compos. Sci. 2025, 9, 24. [Google Scholar] [CrossRef]
- Nawar, M.T.; Gomaa, S.; Eisa, A.S.; Mohammed, A.; Hamdy, O. Numerical modeling and evolutionary optimization of composite cold-formed steel beam response. Struct. Eng. Mech. 2026, in press. [Google Scholar]
- Gomaa, S.; El-Hossieny, O.; Alnaggar, M. Effects of mill scale and varying exposure conditions on corrosion behavior of A572 structural steel. Constr. Build. Mater. 2024, 440, 136995. [Google Scholar] [CrossRef]
- Gomaa, S.; El-Hossieny, O.; Alnaggar, M. Effect of corrosion morphology on the mechanical strength and ductility of structural steel: Experiments and simulations. Constr. Build. Mater. 2025, 472, 140713. [Google Scholar] [CrossRef]
- Nawar, M.T.; Salem, A.S.; Abdel-Monsef, S.; Ibrahim, Y.E.; Gomaa, S. Innovative UHPC-based rehabilitation strategies for enhancing the flexural capacity of corroded steel bridge beams. J. Compos. Sci. 2026, 10, 309. [Google Scholar] [CrossRef]
- Hassaine Daouadji, T.; Abbès, B.; Bensatallah, T.; Abbès, F. Analysis of interface sliding in a composite I-steel–concrete beam reinforced by a composite material plate: The effect of concrete–steel connection modes. J. Compos. Sci. 2025, 9, 273. [Google Scholar] [CrossRef]
- ABAQUS/CAE 2020; Dassault Systèmes Simulia Corp.: Johnston, RI, USA, 2019.
- Emara, M.; Elsamak, G.; Ghalla, M.; Hu, J.W.; Badawi, M.; Salama, M.I. Shear improvement of defected RC beams with sustainable aluminum boxes incorporating high performance concretes. Case Stud. Constr. Mater. 2024, 21, e03500. [Google Scholar] [CrossRef]
- Jabbar, A.M.; Al-Zuheriy, A.S.J.; Hasan, Q.A. A numerical investigation of the structural behavior of reinforced concrete beams fully or partially encased with UHPC layers in flexure. Structures 2024, 70, 107706. [Google Scholar] [CrossRef]
- Chen, F.; Yu, Z.; Yu, Y.; Liu, Q. Study on the bond-slip numerical simulation in the analysis of reinforced concrete wall-beam-slab joint under cyclic loading. Constr. Build. Mater. 2024, 449, 138266. [Google Scholar] [CrossRef]
- EN 1992-1-1:2004; Eurocode 2: Design of concrete structures, Part 1-1: General rules and rules for buildings. European Committee for Standardization (CEN): Brussels, Belgium, 2004.
- Le, K.B.; Van Cao, V. Numerical study of circular concrete filled steel tubes subjected to pure torsion. Buildings 2021, 11, 397. [Google Scholar] [CrossRef]
- Li, G.; Chen, B.; Yang, Z.; Feng, Y. Experimental and numerical behaviour of eccentrically loaded high strength concrete filled high strength square steel tube stub columns. Thin-Walled Struct. 2018, 127, 483–499. [Google Scholar] [CrossRef]
- Winful, D.; Cashell, K.A.; Afshan, S.; Barnes, A.M.; Pargeter, R.J. Behaviour of high strength steel columns under fire conditions. J. Constr. Steel Res. 2018, 150, 392–404. [Google Scholar] [CrossRef]
- Qasem, M.; Hasan, M.; Muhamad, R.; Chin, C.-L.; Alanazi, N. Generalised calibration and optimization of concrete damage plasticity model for finite element simulation of cracked reinforced concrete structures. Results Eng. 2025, 25, 103905. [Google Scholar] [CrossRef]
- Hany, N.; Issa, C.A. Finite element modeling of reinforced concrete (RC) beams strengthened with ultra-high-performance fiber-reinforced concrete (UHPFRC). Results Eng. 2026, 31, 111380. [Google Scholar] [CrossRef]
- Carreira, D.J.; Chu, K.H. Stress-strain relationship for plain concrete in compression. ACI J. 1985, 82, 797–804. [Google Scholar] [CrossRef] [PubMed]
- El-Sisi, A.E.-D.A.; Salim, H.A.; Gomaa, S.A.; El-Feky, M.H. Progressive failure analysis of woven and non-woven CFRP composite/steel bolted joints. Polym. Compos. 2025, 46, 1469–1485. [Google Scholar] [CrossRef]
- Schafer, B.W.; Peköz, T. Computational modeling of cold-formed steel: characterizing geometric imperfections and residual stresses. J. Constr. Steel Res. 1998, 47, 193–210. [Google Scholar] [CrossRef]
- Mutafi, A.; Irwan, J.M.; Yidris, N.; Ghaleb, A.M.; Al-Alimi, S.; Amran, M.; Qasem, M.; Hasan, M.; Al-Fakih, A. An in-depth comparative FEA on through-thickness residual stresses in press-braked cold-formed steel section. Results Eng. 2024, 22, 102124. [Google Scholar] [CrossRef]
- Almasabha, G.; Alhusban, L.; Tarawneh, A. Shear capacity of voided flat slabs: influence of void height, slab thickness, and shear span. Results Eng. 2026, 30, 113058. [Google Scholar] [CrossRef]
Figure 1.
Reference beams of Bamaga et al. [8]: (a) arrangement of the shear connectors; (b) cross-section; (c) connector types. Dimensions in mm.
Figure 1.
Reference beams of Bamaga et al. [8]: (a) arrangement of the shear connectors; (b) cross-section; (c) connector types. Dimensions in mm.
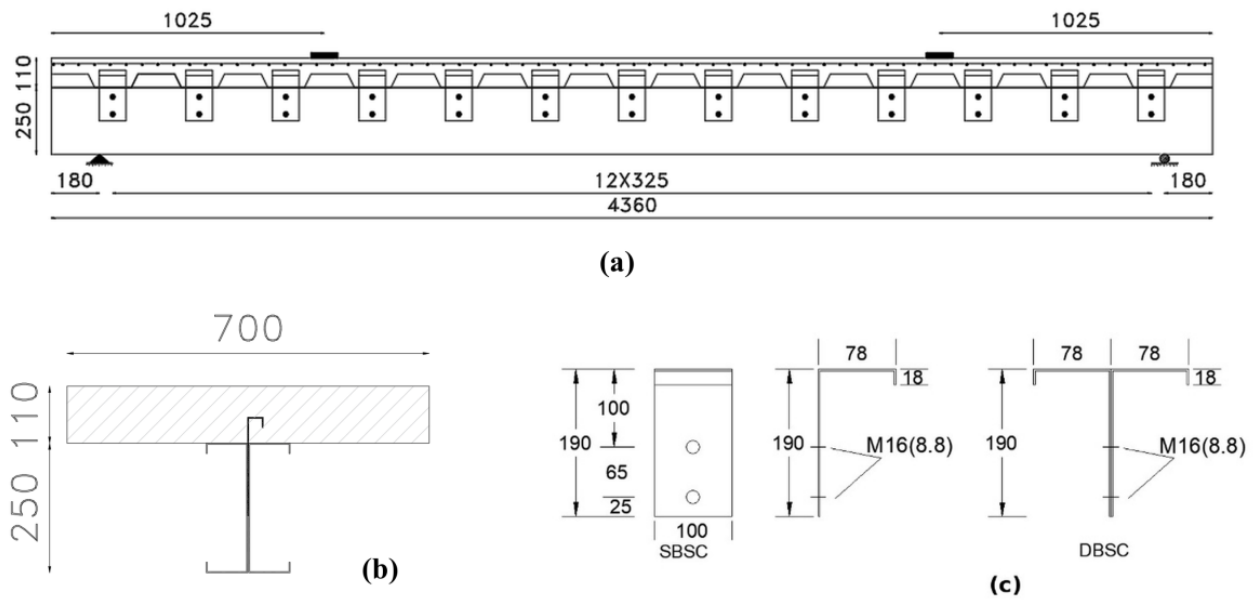
Figure 2.
Finite element model: (a) bilinear stress-strain law of the cold-formed steel; (b) mesh convergence study for FSSBSC250-20; (c) mesh of the concrete slab; (d) mesh of the steel beam and reinforcing bars.
Figure 2.
Finite element model: (a) bilinear stress-strain law of the cold-formed steel; (b) mesh convergence study for FSSBSC250-20; (c) mesh of the concrete slab; (d) mesh of the steel beam and reinforcing bars.
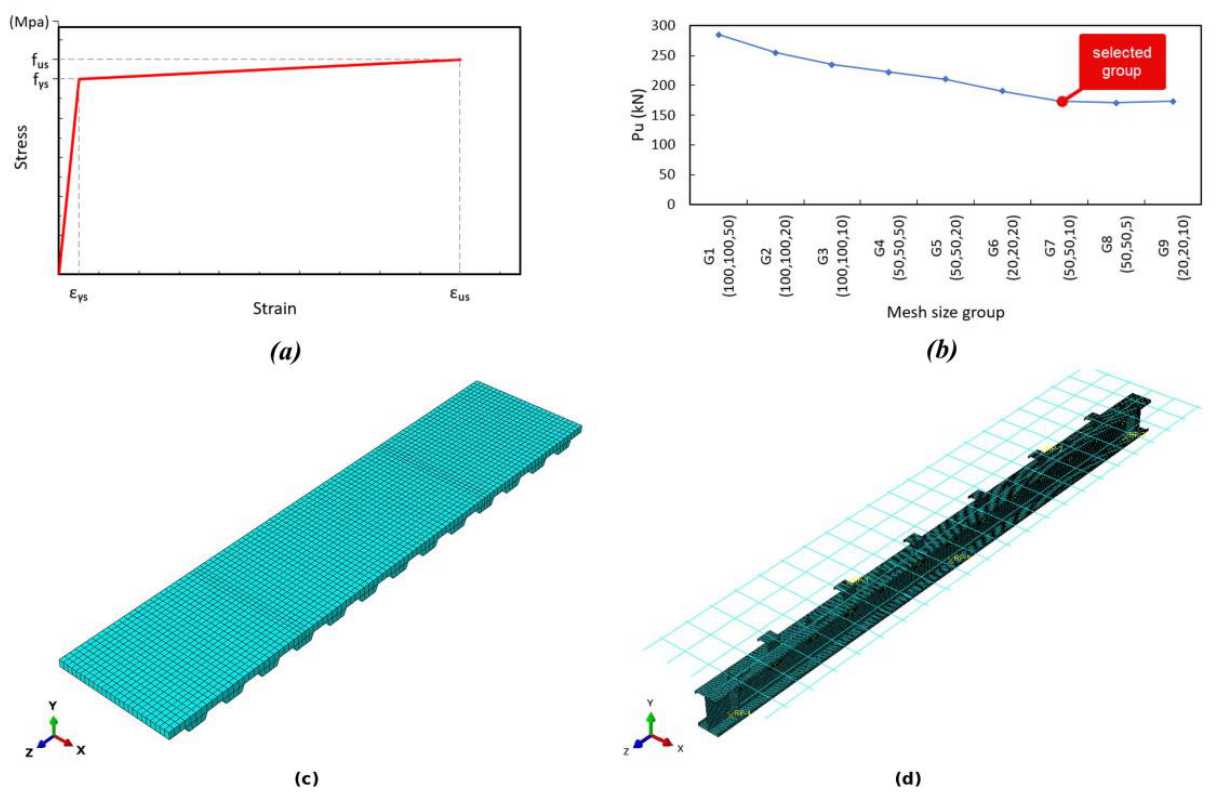
Figure 3.
Load versus midspan deflection, test [8] and finite element: (a) FSSBSC250-20; (b) FSDBSC250-20; (c) FSSC250-20.
Figure 3.
Load versus midspan deflection, test [8] and finite element: (a) FSSBSC250-20; (b) FSDBSC250-20; (c) FSSC250-20.
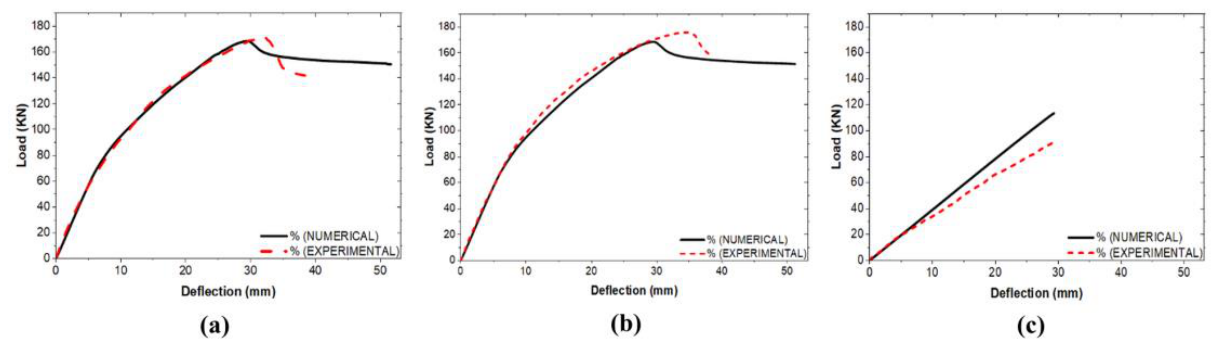
Figure 4.
Computed failure modes of the reference beams: (a) local buckling of the compression flange and upper web of the composite beams beneath the loading points; (b) tensile damage of the slab, showing transverse cracks under the loading points; (c) local buckling of the compression flange of the non-composite beam FSSC250-20. Each mode matches the failure reported in the corresponding test [8].
Figure 4.
Computed failure modes of the reference beams: (a) local buckling of the compression flange and upper web of the composite beams beneath the loading points; (b) tensile damage of the slab, showing transverse cracks under the loading points; (c) local buckling of the compression flange of the non-composite beam FSSC250-20. Each mode matches the failure reported in the corresponding test [8].
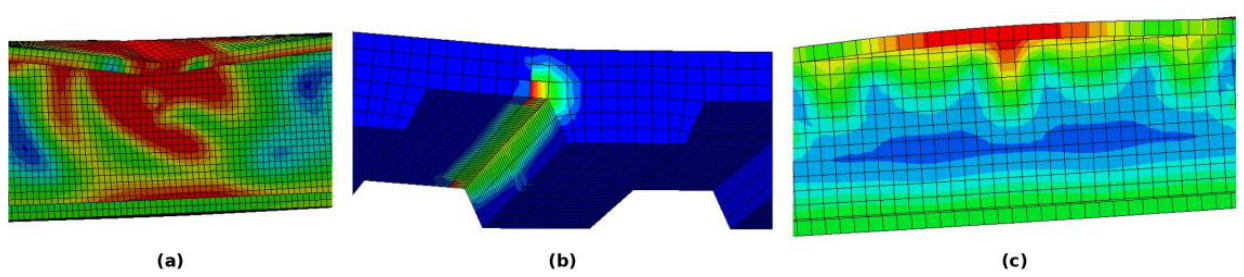
Figure 5.
Cross-sections of the parametric beams: (a) rectangular slab (RS); (b) hollow slab (HS); (c) double channel (DC); (d) double sigma (DS); (e) inverted-lip double channel (DCi); (f) inverted-lip double sigma (DSi).
Figure 5.
Cross-sections of the parametric beams: (a) rectangular slab (RS); (b) hollow slab (HS); (c) double channel (DC); (d) double sigma (DS); (e) inverted-lip double channel (DCi); (f) inverted-lip double sigma (DSi).
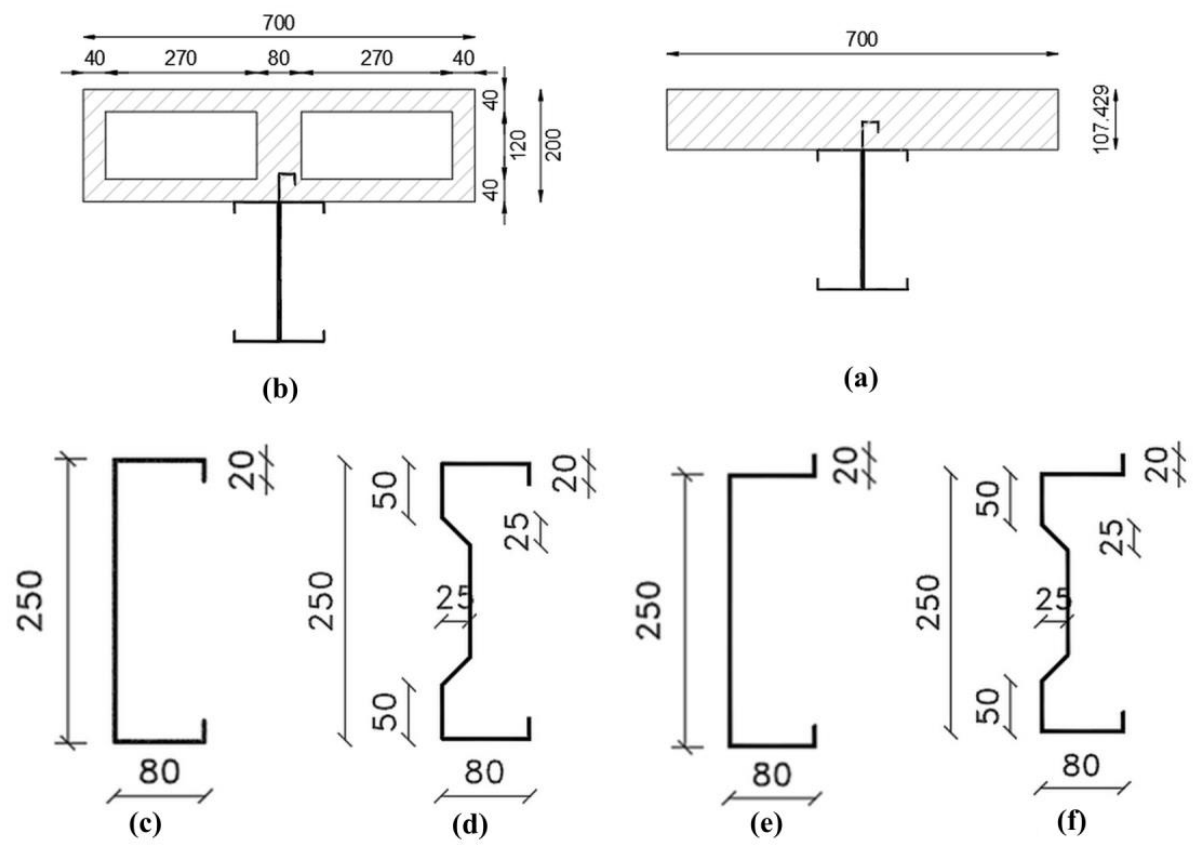
Figure 6.
Stiffening devices and shear connectors: (a) angle web stiffener (LS); (b) trapezoidal web stiffener (TS); (c) lower-flange plate (LFP); (d) single-plate shear connector (SPSC); (e) double-plate shear connector (DPSC).
Figure 6.
Stiffening devices and shear connectors: (a) angle web stiffener (LS); (b) trapezoidal web stiffener (TS); (c) lower-flange plate (LFP); (d) single-plate shear connector (SPSC); (e) double-plate shear connector (DPSC).
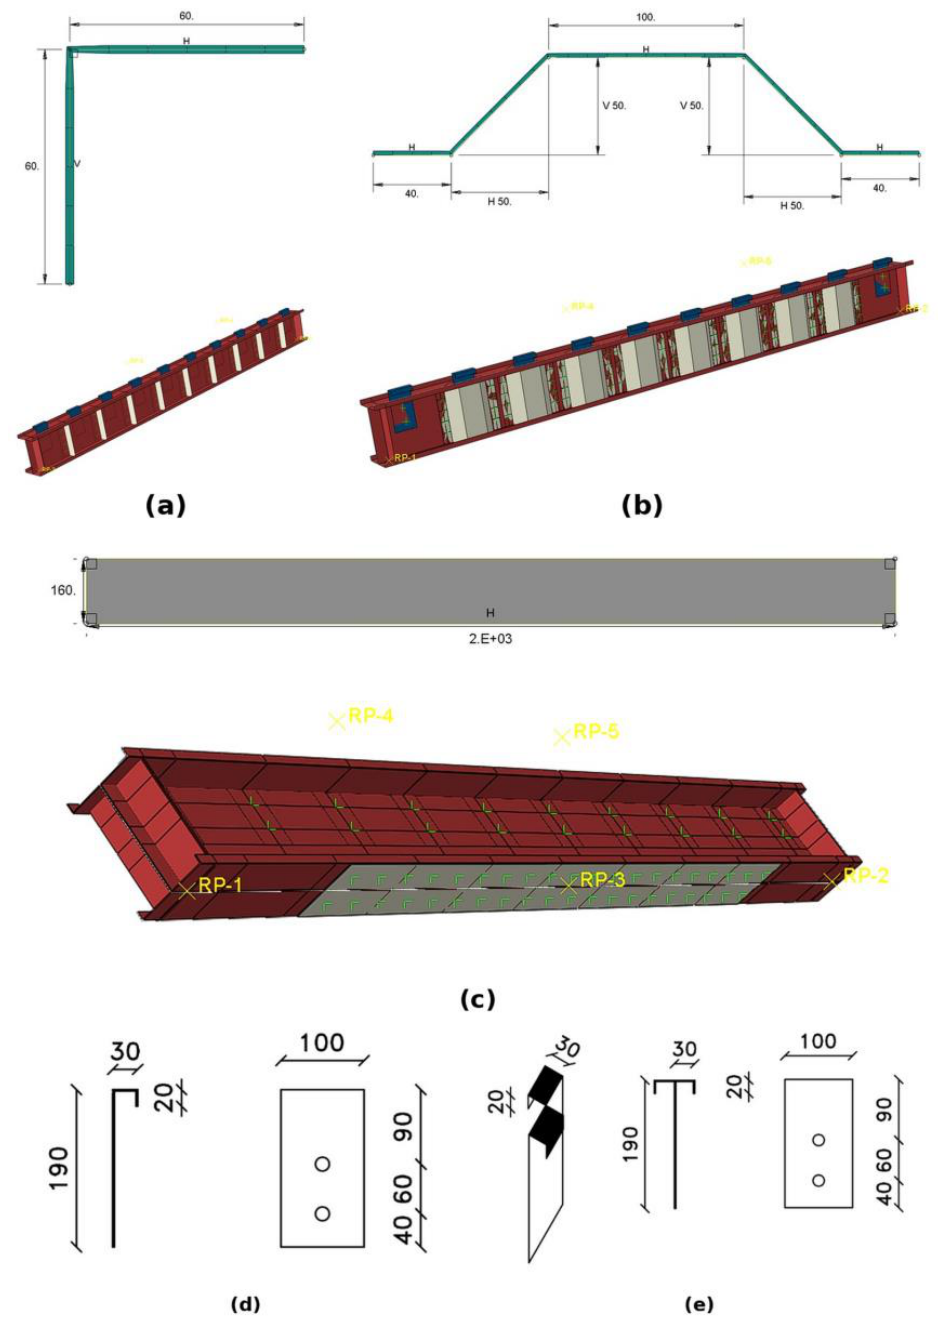
Figure 7.
Load versus midspan deflection, group one: (a) rectangular and hollow slab (DC section); (b) DC and DS sections; (c) DS at C30 to C60; (d) DC at C30 to C60; (e) DS and DSi; (f) DC and DCi. Hollow slab, SPSC300 and C30 unless stated.
Figure 7.
Load versus midspan deflection, group one: (a) rectangular and hollow slab (DC section); (b) DC and DS sections; (c) DS at C30 to C60; (d) DC at C30 to C60; (e) DS and DSi; (f) DC and DCi. Hollow slab, SPSC300 and C30 unless stated.
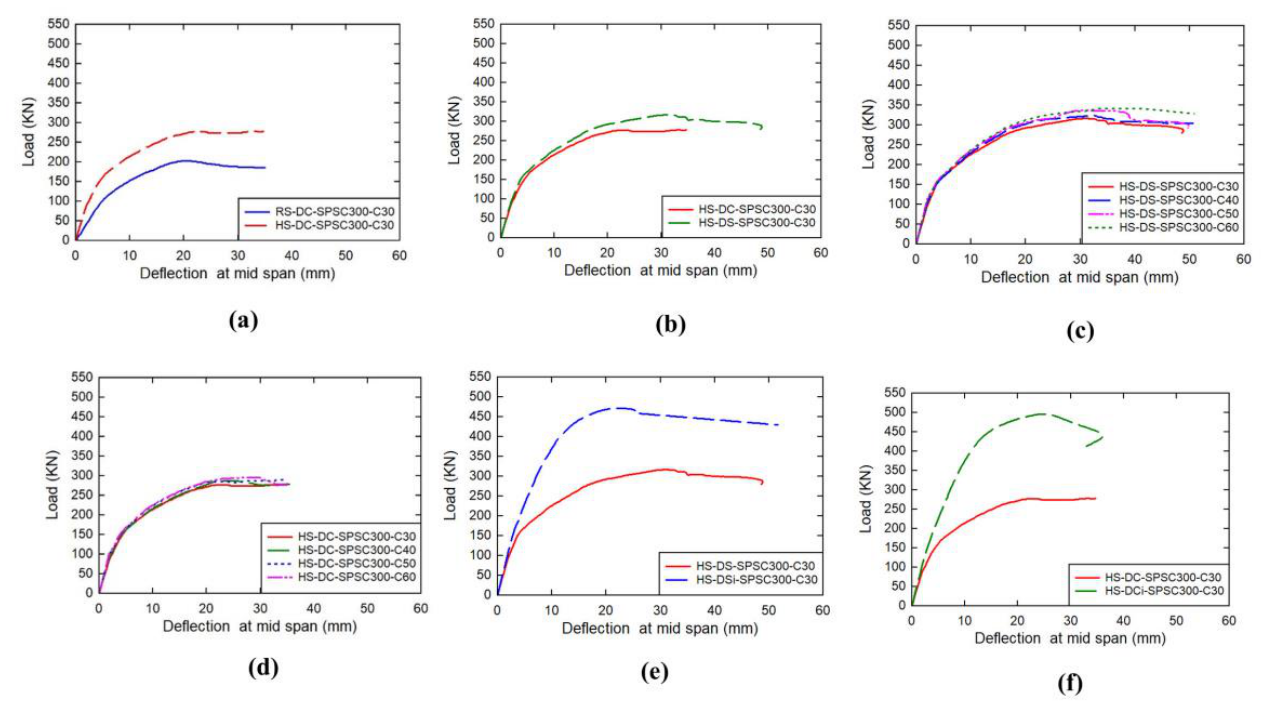
Figure 8.
Von Mises stress (MPa) at failure, group one: (a) RS-DC-SPSC300-C30 and (b) HS-DC-SPSC300-C30, Mode A; (c) HS-DC-SPSC300-C60, Mode A; (d) HS-DS-SPSC300-C30 and (e) HS-DS-SPSC300-C60, Mode B; (f) HS-DCi-SPSC300-C30 and (g) HS-DSi-SPSC300-C30, Mode C. The C40 and C50 contours are indistinguishable from those shown and are omitted.
Figure 8.
Von Mises stress (MPa) at failure, group one: (a) RS-DC-SPSC300-C30 and (b) HS-DC-SPSC300-C30, Mode A; (c) HS-DC-SPSC300-C60, Mode A; (d) HS-DS-SPSC300-C30 and (e) HS-DS-SPSC300-C60, Mode B; (f) HS-DCi-SPSC300-C30 and (g) HS-DSi-SPSC300-C30, Mode C. The C40 and C50 contours are indistinguishable from those shown and are omitted.
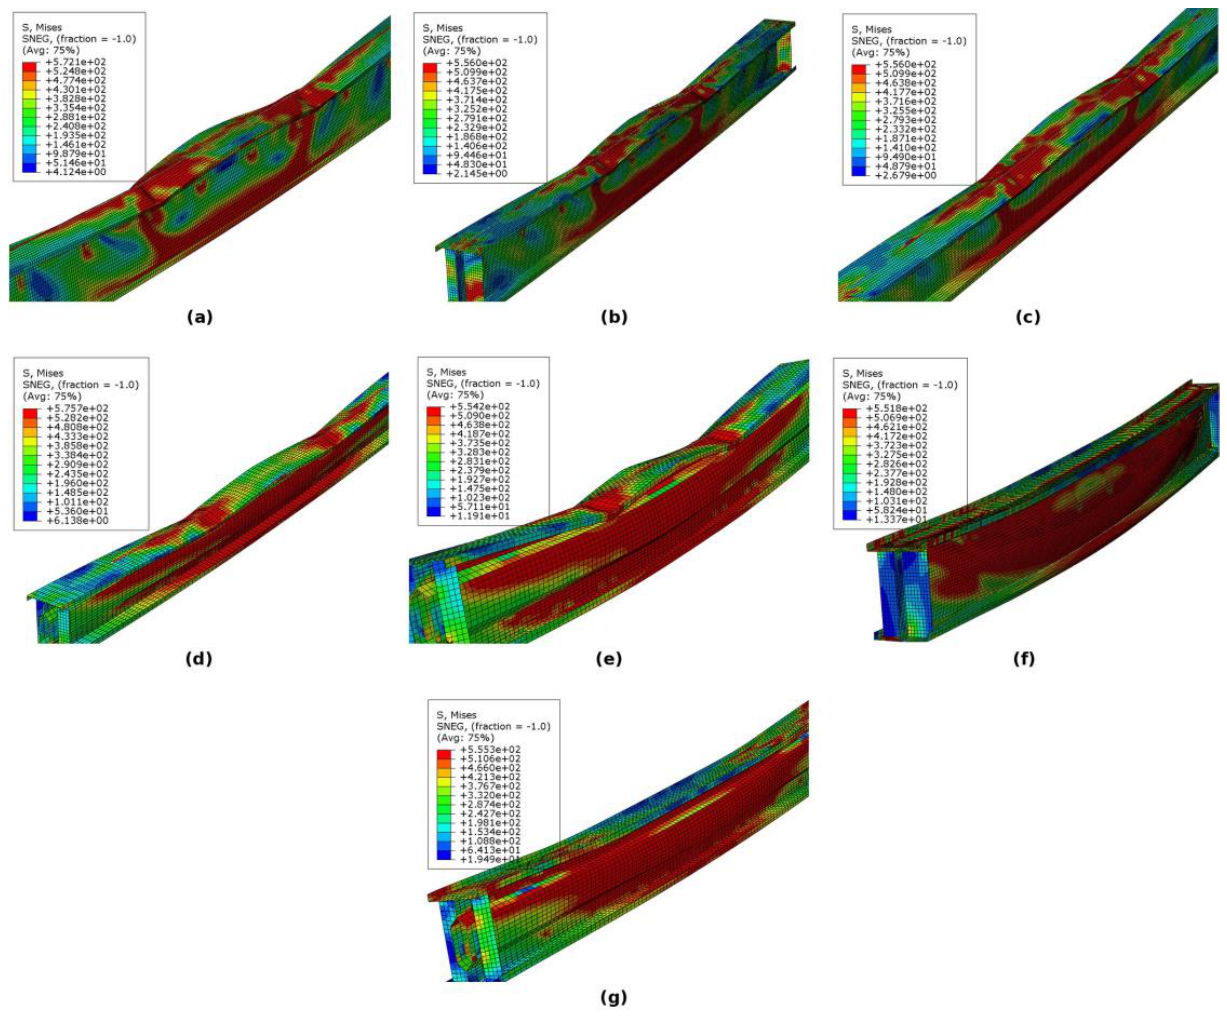
Figure 9.
Load versus midspan deflection, group two: (a) DC and (b) DCi with connector spacings of 225, 300 and 450 mm; (c) DC, (d) DS, (e) DCi and (f) DSi with single- and double-plate connectors at 300 mm spacing.
Figure 9.
Load versus midspan deflection, group two: (a) DC and (b) DCi with connector spacings of 225, 300 and 450 mm; (c) DC, (d) DS, (e) DCi and (f) DSi with single- and double-plate connectors at 300 mm spacing.
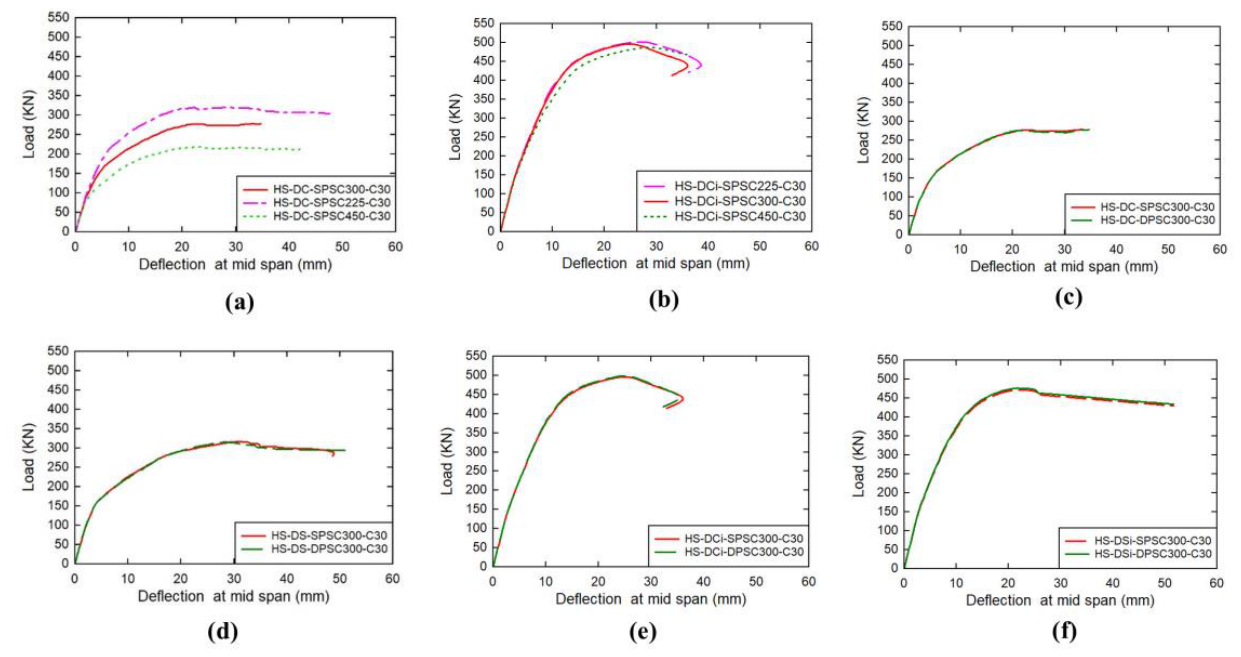
Figure 10.
Von Mises stress (MPa) at failure, group two: (a) HS-DC-SPSC225-C30 and (b) HS-DC-SPSC450-C30, Mode A; (c) HS-DCi-SPSC225-C30 and (d) HS-DCi-SPSC450-C30, Mode C; (e) HS-DS-DPSC300-C30, Mode B; (f) HS-DSi-DPSC300-C30, Mode C. The double-plate DC and DCi contours reproduce Figure 8(b) and (f) and are omitted.
Figure 10.
Von Mises stress (MPa) at failure, group two: (a) HS-DC-SPSC225-C30 and (b) HS-DC-SPSC450-C30, Mode A; (c) HS-DCi-SPSC225-C30 and (d) HS-DCi-SPSC450-C30, Mode C; (e) HS-DS-DPSC300-C30, Mode B; (f) HS-DSi-DPSC300-C30, Mode C. The double-plate DC and DCi contours reproduce Figure 8(b) and (f) and are omitted.
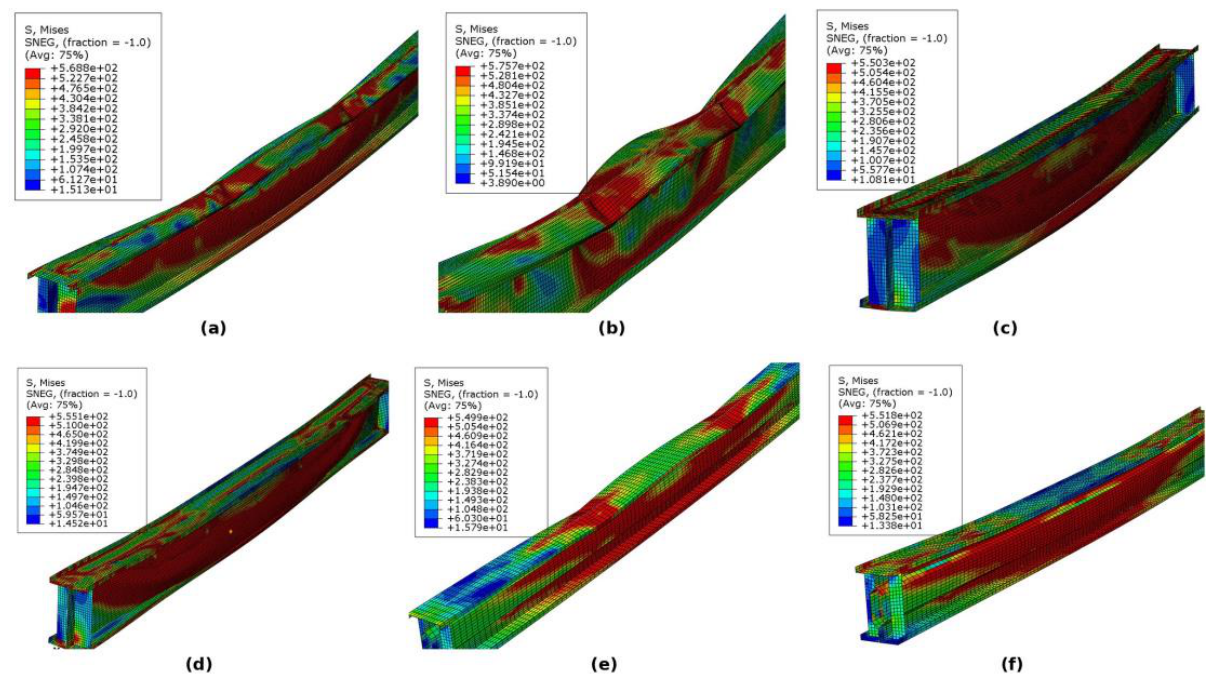
Figure 11.
Load versus midspan deflection, group three: (a) DCi with LS300, TS300 or LFP; (b) DC, (c) DS, (d) DCi and (e) DSi with and without LFP; (f) DCi with LFP + TS300 at C30 to C60 and with LFP + LS300 at C30.
Figure 11.
Load versus midspan deflection, group three: (a) DCi with LS300, TS300 or LFP; (b) DC, (c) DS, (d) DCi and (e) DSi with and without LFP; (f) DCi with LFP + TS300 at C30 to C60 and with LFP + LS300 at C30.
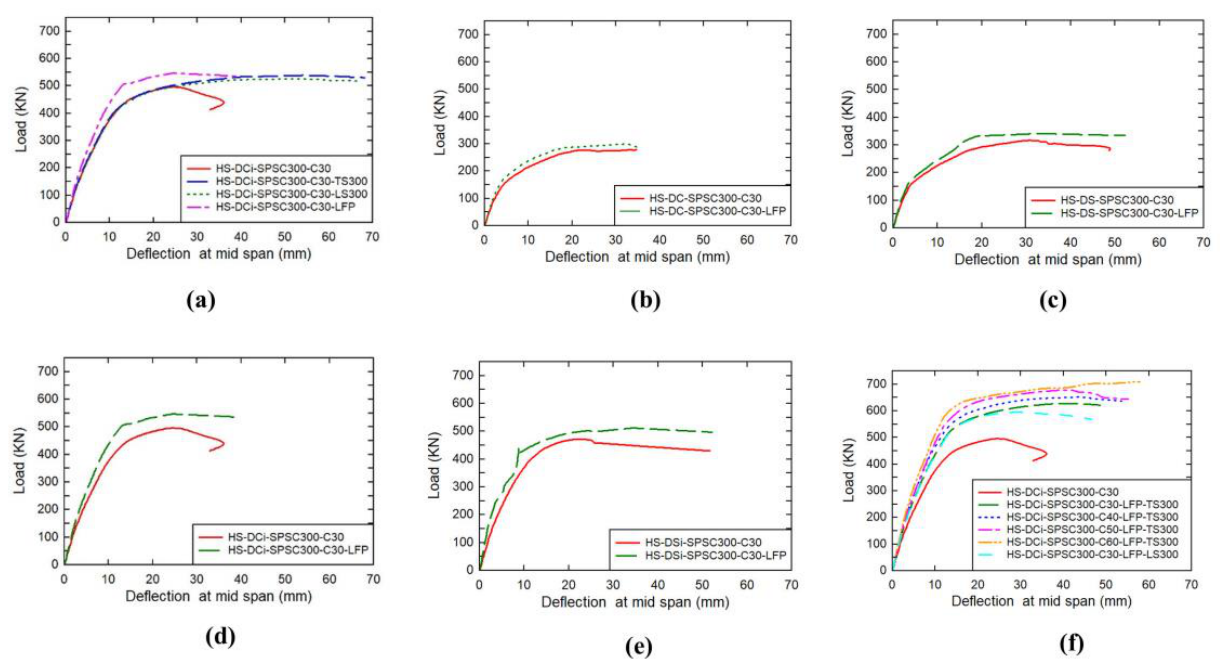
Figure 12.
Von Mises stress (MPa) at failure, group three: (a) HS-DCi-SPSC300-C30-LS300 and (b) HS-DCi-SPSC300-C30-TS300, Mode D; (c) HS-DC-SPSC300-C30-LFP, Mode A; (d) HS-DS-SPSC300-C30-LFP, Mode B; (e) HS-DCi-SPSC300-C30-LFP-LS300, (f) HS-DCi-SPSC300-C30-LFP-TS300 and (g) HS-DCi-SPSC300-C60-LFP-TS300, Mode D.
Figure 12.
Von Mises stress (MPa) at failure, group three: (a) HS-DCi-SPSC300-C30-LS300 and (b) HS-DCi-SPSC300-C30-TS300, Mode D; (c) HS-DC-SPSC300-C30-LFP, Mode A; (d) HS-DS-SPSC300-C30-LFP, Mode B; (e) HS-DCi-SPSC300-C30-LFP-LS300, (f) HS-DCi-SPSC300-C30-LFP-TS300 and (g) HS-DCi-SPSC300-C60-LFP-TS300, Mode D.
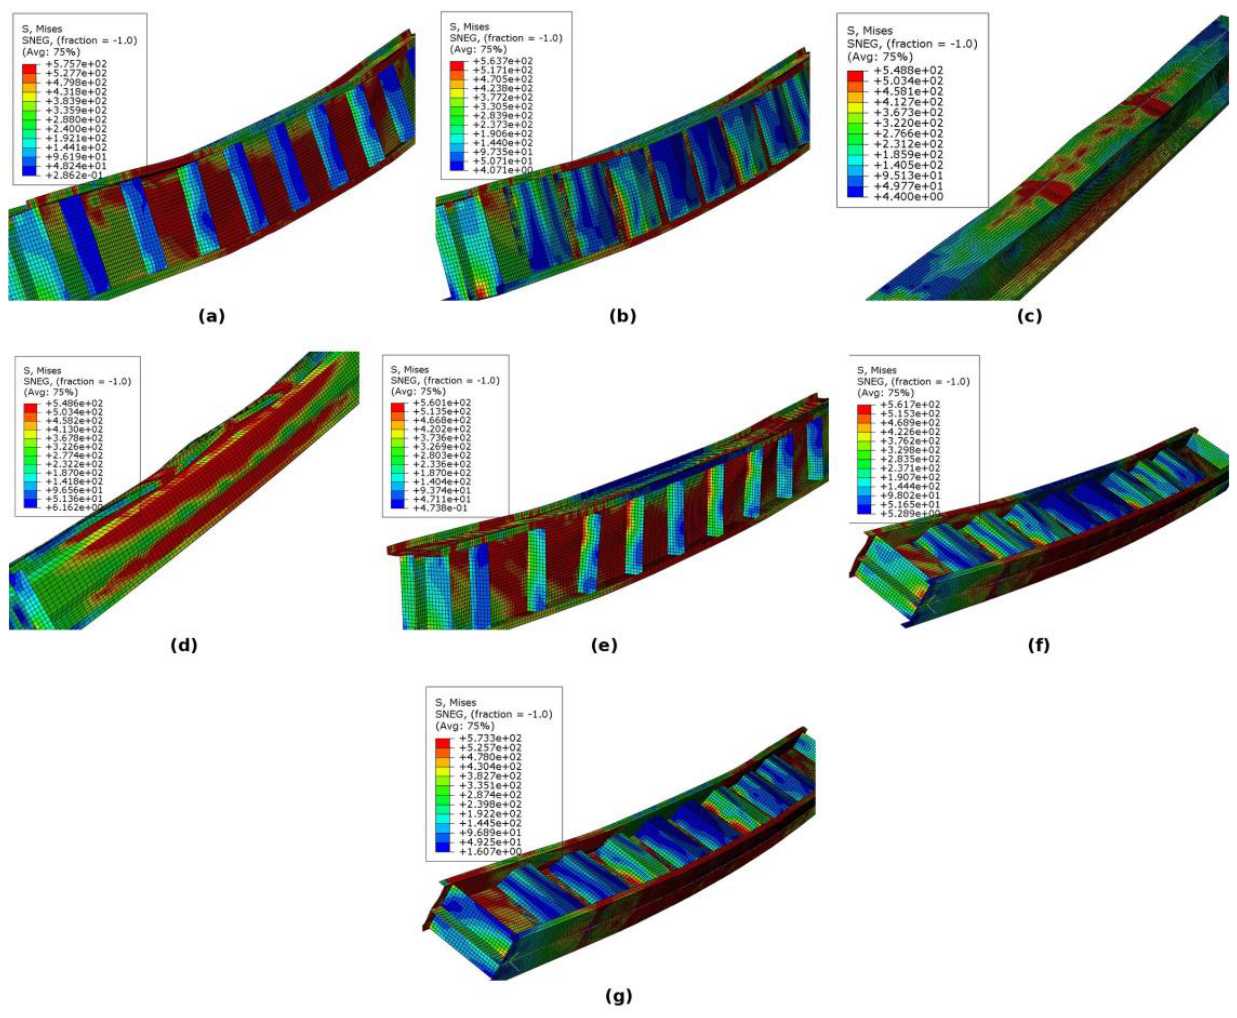
Figure 13.
Change relative to the control beam HS-DC-SPSC300-C30 (Pu = 278.1 kN, T = 7.96 kN m): (a) peak load; (b) toughness. Beams are sorted by toughness within each group and colored by failure mode.
Figure 13.
Change relative to the control beam HS-DC-SPSC300-C30 (Pu = 278.1 kN, T = 7.96 kN m): (a) peak load; (b) toughness. Beams are sorted by toughness within each group and colored by failure mode.
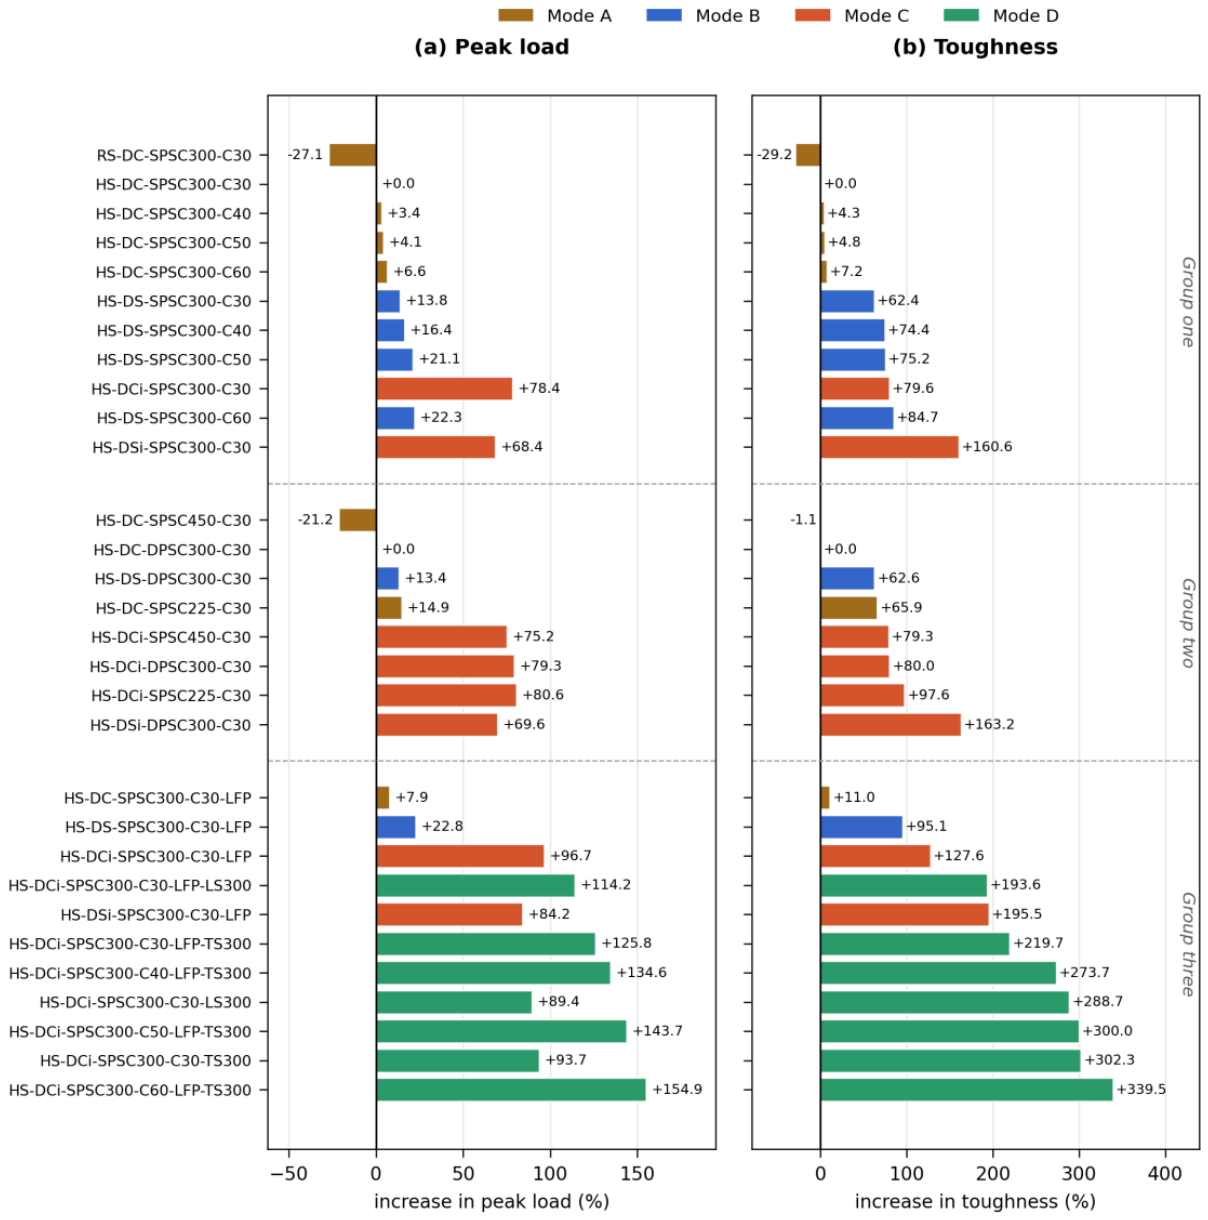
Figure 14.
Composition of the toughness: (a) toughness against the product of peak load and maximum deflection for the thirty beams, with the fitted proportionality; (b) decomposition of the toughness ratio of the principal comparisons into the factors contributed by the peak load, the maximum deflection and the curve fullness F = T/(Pu Δu), on a logarithmic scale so that the segments add to the net factor.
Figure 14.
Composition of the toughness: (a) toughness against the product of peak load and maximum deflection for the thirty beams, with the fitted proportionality; (b) decomposition of the toughness ratio of the principal comparisons into the factors contributed by the peak load, the maximum deflection and the curve fullness F = T/(Pu Δu), on a logarithmic scale so that the segments add to the net factor.
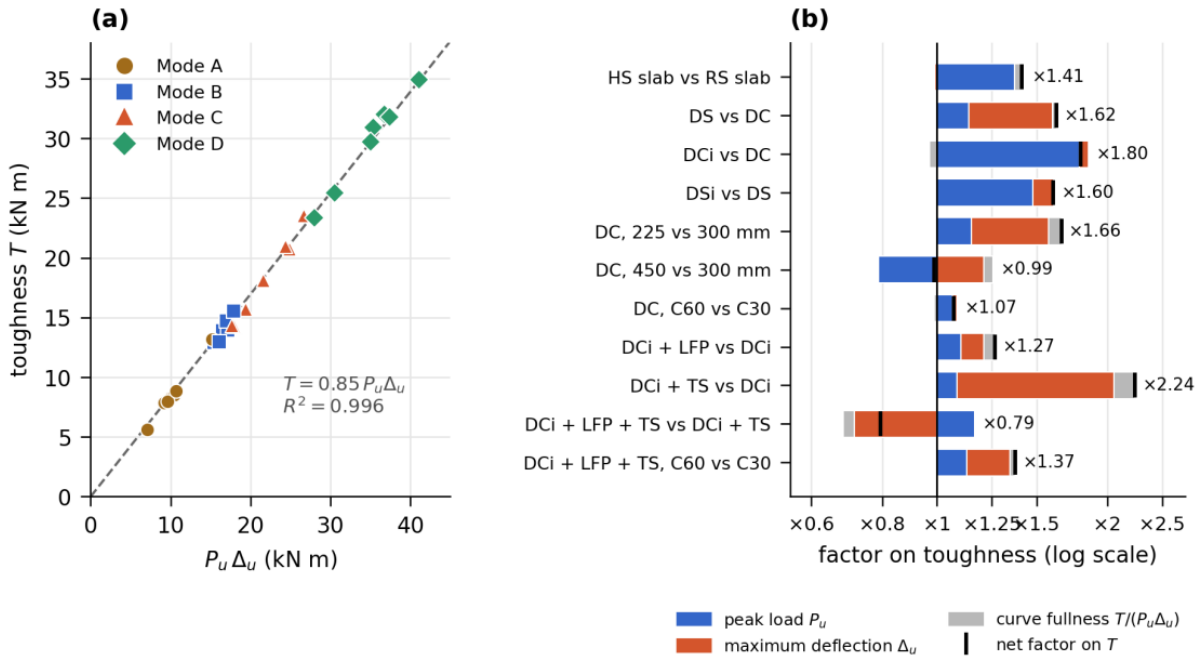
Figure 15.
Interaction of the lower-flange plate (LFP) with the trapezoidal (TS) and angle (LS) web stiffeners on the inverted-lip channel: gains in (a) peak load and (b) toughness of each device alone, their arithmetic sum, and the combination, relative to the unstiffened beam HS-DCi-SPSC300-C30.
Figure 15.
Interaction of the lower-flange plate (LFP) with the trapezoidal (TS) and angle (LS) web stiffeners on the inverted-lip channel: gains in (a) peak load and (b) toughness of each device alone, their arithmetic sum, and the combination, relative to the unstiffened beam HS-DCi-SPSC300-C30.
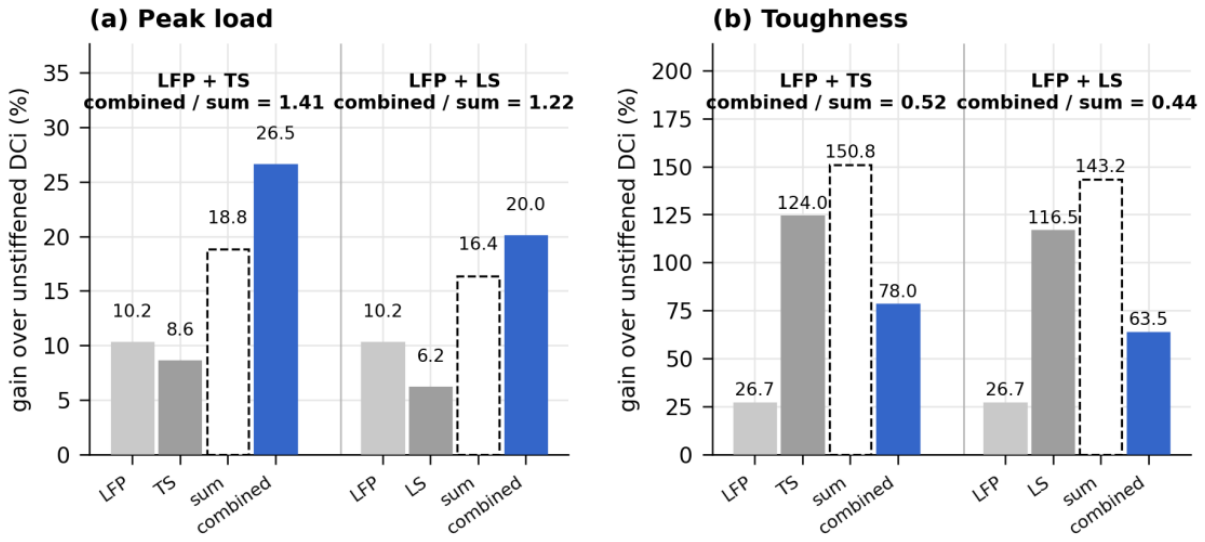
Figure 16.
Sensitivity of the response to the concrete grade and the connector spacing: (a) peak load and (b) toughness relative to C30 for the channel, the sigma section and the plated, trapezoidally stiffened inverted-lip channel, with the slopes of linear fits (dotted); (c) peak load and toughness relative to the 300 mm spacing for the standard and inverted-lip channels.
Figure 16.
Sensitivity of the response to the concrete grade and the connector spacing: (a) peak load and (b) toughness relative to C30 for the channel, the sigma section and the plated, trapezoidally stiffened inverted-lip channel, with the slopes of linear fits (dotted); (c) peak load and toughness relative to the 300 mm spacing for the standard and inverted-lip channels.
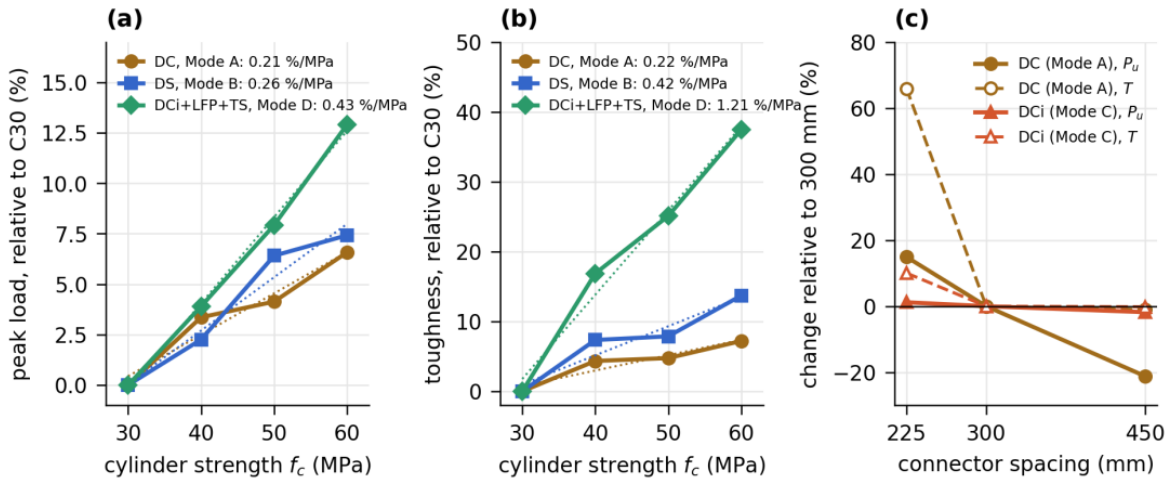

Table 1.
Mechanical properties of the cold-formed steel [8].
Table 1.
Mechanical properties of the cold-formed steel [8].
| Component | t (mm) | fy (MPa) | fu (MPa) | E (GPa) | ν |
|---|---|---|---|---|---|
| Channels, all specimens | 2.0 | 542.6 | 575.7 | 191 | 0.3 |
| Bracket connectors (SBSC, DBSC) |
Table 2.
Concrete damage plasticity parameters.
| Dilation angle ψ (°) | Eccentricity ϵ | σb0/σc0 | Kc | Viscosity μ |
|---|---|---|---|---|
| 34 | 0.05 | 1.16 | 0.667 | 0 |
Table 3.
Validation of the finite element model against the beams tested by Bamaga et al. [8].
Table 3.
Validation of the finite element model against the beams tested by Bamaga et al. [8].
| Specimen | Connector | Pexp (kN) | PFE (kN) | Pexp/PFE | δexp (mm) | δFE (mm) | δexp/δFE |
|---|---|---|---|---|---|---|---|
| FSSBSC250-20 | SBSC | 172.3 | 168.4 | 1.023 | 32.1 | 29.6 | 1.085 |
| FSDBSC250-20 | DBSC | 175.7 | 168.5 | 1.043 | 34.8 | 29.3 | 1.187 |
| FSSC250-20 | none | 92.5 | 113.4 | 0.816 | 28.7 | 29.3 | 0.980 |
| Mean, composite beams | 1.033 | 1.136 |
δ = midspan deflection at peak load.
Table 4.
Parametric groups, variables and fixed parameters.
| Group | Variables | Fixed parameters |
|---|---|---|
| One (a) | Slab: RS, HS | DC, SPSC300, C30, no stiffener |
| One (b) | Section: DC, DS; grade: C30 to C60 | HS, SPSC300, no stiffener |
| One (c) | Inverted lip: DCi, DSi | HS, SPSC300, C30, no stiffener |
| Two (a) | Connector type: SPSC, DPSC; section: DC, DS, DCi, DSi | HS, spacing 300 mm, C30, no stiffener |
| Two (b) | Connector spacing: 225, 300, 450 mm; section: DC, DCi | HS, SPSC, C30, no stiffener |
| Three (a) | Stiffener: LS300, TS300, LFP | HS, DCi, SPSC300, C30 |
| Three (b) | LFP on DC, DS, DCi, DSi | HS, SPSC300, C30 |
| Three (c) | LFP + LS300, LFP + TS300; grade: C30 to C60 (LFP + TS300) | HS, DCi, SPSC300 |
Table 5.
Results of the parametric study.
| No. | Beam | Pu (kN) | δu (mm) | Δu (mm) | T (kN m) | ΔPu (%) | ΔT (%) | Mode |
|---|---|---|---|---|---|---|---|---|
| Group one: section geometry and material | ||||||||
| 1 | RS-DC-SPSC300-C30 | 202.6 | 20 | 35.0 | 5.63 | -27.1 | -29.2 | A |
| 2 | HS-DC-SPSC300-C30 a | 278.1 | 22 | 34.7 | 7.96 | +0.0 | +0.0 | A |
| 3 | HS-DC-SPSC300-C40 | 287.4 | 25 | 35.5 | 8.30 | +3.4 | +4.3 | A |
| 4 | HS-DC-SPSC300-C50 | 289.6 | 27 | 34.9 | 8.34 | +4.1 | +4.8 | A |
| 5 | HS-DC-SPSC300-C60 | 296.4 | 28 | 35.3 | 8.53 | +6.6 | +7.2 | A |
| 6 | HS-DS-SPSC300-C30 | 316.6 | 30 | 48.8 | 12.93 | +13.8 | +62.4 | B |
| 7 | HS-DS-SPSC300-C40 | 323.7 | 32 | 50.9 | 13.88 | +16.4 | +74.4 | B |
| 8 | HS-DS-SPSC300-C50 | 336.9 | 33 | 50.9 | 13.95 | +21.1 | +75.2 | B |
| 9 | HS-DS-SPSC300-C60 | 340.1 | 39 | 49.9 | 14.70 | +22.3 | +84.7 | B |
| 10 | HS-DCi-SPSC300-C30 | 496.2 | 25 | 36.0 | 14.29 | +78.4 | +79.6 | C |
| 11 | HS-DSi-SPSC300-C30 | 468.3 | 22 | 53.1 | 20.74 | +68.4 | +160.6 | C |
| Group two: shear connection | ||||||||
| 12 | HS-DC-SPSC225-C30 | 319.6 | 20 | 47.6 | 13.20 | +14.9 | +65.9 | A |
| 13 | HS-DC-SPSC450-C30 | 219.1 | 23 | 42.0 | 7.87 | -21.2 | -1.1 | A |
| 14 | HS-DCi-SPSC225-C30 | 502.1 | 27 | 38.6 | 15.73 | +80.6 | +97.6 | C |
| 15 | HS-DCi-SPSC450-C30 | 487.3 | 26 | 36.6 | 14.27 | +75.2 | +79.3 | C |
| 16 | HS-DC-DPSC300-C30 | 278.1 | 22 | 34.6 | 7.96 | +0.0 | +0.0 | A |
| 17 | HS-DS-DPSC300-C30 | 315.3 | 30 | 51.0 | 12.94 | +13.4 | +62.6 | B |
| 18 | HS-DCi-DPSC300-C30 | 498.6 | 25 | 35.4 | 14.33 | +79.3 | +80.0 | C |
| 19 | HS-DSi-DPSC300-C30 | 471.7 | 22 | 51.7 | 20.95 | +69.6 | +163.2 | C |
| Group three: external stiffening | ||||||||
| 20 | HS-DCi-SPSC300-C30-LS300 | 526.8 | 45 | 67.1 | 30.94 | +89.4 | +288.7 | D |
| 21 | HS-DCi-SPSC300-C30-TS300 | 538.8 | 45 | 68.1 | 32.02 | +93.7 | +302.3 | D |
| 22 | HS-DCi-SPSC300-C30-LFP | 547.0 | 26 | 39.5 | 18.11 | +96.7 | +127.6 | C |
| 23 | HS-DC-SPSC300-C30-LFP | 300.1 | 30 | 35.5 | 8.83 | +7.9 | +11.0 | A |
| 24 | HS-DS-SPSC300-C30-LFP | 341.4 | 33 | 52.4 | 15.53 | +22.8 | +95.1 | B |
| 25 | HS-DSi-SPSC300-C30-LFP | 512.1 | 35 | 52.1 | 23.52 | +84.2 | +195.5 | C |
| 26 | HS-DCi-SPSC300-C30-LFP-TS300 | 627.9 | 33 | 48.6 | 25.45 | +125.8 | +219.7 | D |
| 27 | HS-DCi-SPSC300-C40-LFP-TS300 | 652.4 | 35 | 53.6 | 29.74 | +134.6 | +273.7 | D |
| 28 | HS-DCi-SPSC300-C50-LFP-TS300 | 677.7 | 38 | 55.2 | 31.83 | +143.7 | +300.0 | D |
| 29 | HS-DCi-SPSC300-C60-LFP-TS300 | 709.0 | 56 | 57.9 | 34.98 | +154.9 | +339.5 | D |
| 30 | HS-DCi-SPSC300-C30-LFP-LS300 | 595.6 | 34 | 46.9 | 23.37 | +114.2 | +193.6 | D |
a Control beam. δu: deflection at the first peak; Δu: deflection at the end of the analysis; ΔPu, ΔT: change relative to the control beam.
Table 6.
Performance measures by failure mode (range, with the median in parentheses).
| Mode | Beams | ΔPu (%) | ΔT (%) | δu (mm) | Δu (mm) | F = T/(Pu Δu) |
|---|---|---|---|---|---|---|
| A | 9 | -27.1 to +14.9 (+3.4) | -29.2 to +65.9 (+4.3) | 20 to 30 | 34.7 to 47.6 | 0.79 to 0.87 (0.82) |
| B | 6 | +13.4 to +22.8 (+18.8) | +62.4 to +95.1 (+74.8) | 30 to 39 | 48.8 to 52.4 | 0.80 to 0.87 (0.84) |
| C | 8 | +68.4 to +96.7 (+78.9) | +79.3 to +195.5 (+112.6) | 22 to 35 | 35.4 to 53.1 | 0.80 to 0.88 (0.82) |
| D | 7 | +89.4 to +154.9 (+125.8) | +193.6 to +339.5 (+288.7) | 33 to 56 | 46.9 to 68.1 | 0.83 to 0.88 (0.85) |
Disclaimer/Publisher’s Note: The statements, opinions and data contained in all publications are solely those of the individual author(s) and contributor(s) and not of MDPI and/or the editor(s). MDPI and/or the editor(s) disclaim responsibility for any injury to people or property resulting from any ideas, methods, instructions or products referred to in the content. |
© 2026 by the authors. Licensee MDPI, Basel, Switzerland. This article is an open access article distributed under the terms and conditions of the Creative Commons Attribution (CC BY) license.
Copyright: This open access article is published under a Creative Commons CC BY 4.0 license, which permit the free download, distribution, and reuse, provided that the author and preprint are cited in any reuse.