
Submitted:
08 November 2026
Posted:
09 November 2026
You are already at the latest version
Abstract
Microwave breast tumor detection relies on the dielectric contrast between healthy and malignant tissue, and the antenna bandwidth affects the cost, complexity and sensitivity of the system. This paper compares an ultra-wideband (UWB) and a narrowband (NB) circular patch antenna that share the same FR4 substrate, 30 × 30 mm2 footprint and radiator but differ in their ground plane and feed. Both antennas were fabricated and measured; the simulated UWB antenna covers 3.56–14.73 GHz, and the NB antenna resonates at 7.79 GHz in its TM21 mode; a finite-difference time-domain (FDTD) model with the measured patch dimensions explains the measured NB resonance shift. Sensing is evaluated with finite-element and FDTD solvers, with each antenna 10 mm from a homogeneous healthy or malignant phantom. Both solvers predict the same 140 MHz tumor-induced resonance shift for the NB antenna and a similar peak reflection-coefficient contrast for the two antennas (19.2 and 21.9 dB in the finite-element model; 7.1 and 9.7 dB in the FDTD model), while the UWB antenna is sensitive over a three to seven times wider spectrum and directs 5.5–6 dB more gain toward the phantom. The NB antenna therefore suits low-cost single-frequency detection, whereas the UWB antenna suits imaging systems that exploit frequency diversity.
Keywords:
breast cancer detection
; microwave sensing
; ultra-wideband antenna
; narrowband antenna
; circular patch antenna
; reflection coefficient
; breast phantom
; FDTD
1. Introduction
Breast cancer is the most commonly diagnosed cancer among women worldwide, and its incidence continues to increase. Detecting malignant cells before they multiply and spread is the key to reducing mortality and to enabling simpler and faster treatment. Established screening techniques such as X-ray mammography, ultrasound and magnetic resonance imaging are widely used, but each has limitations in terms of cost, ionizing radiation, false-negative or false-positive rates, breast compression or patient discomfort. Microwave imaging is being investigated as a complementary modality because it is low-cost, non-ionizing, non-invasive and does not require breast compression [1–3]. Malignant tissue contains more water than healthy breast tissue, which raises both its permittivity and its conductivity; this dielectric contrast perturbs the electromagnetic field propagating through the breast and is the physical basis of microwave detection [4,5]. Microwave imaging can therefore be viewed as a map of the dielectric properties of the tissue under test [4].
The main difference between mammography and microwave imaging is the operating frequency, and hence the wavelength. X-rays have wavelengths between roughly 0.01 and 10 nm, whereas microwave systems for medical imaging typically operate between about 1 and 20 GHz, corresponding to free-space wavelengths of several centimeters [6].
In a microwave detection system, the antenna acts as the sensor, and its bandwidth, gain, size and near-field behavior largely determine the performance of the whole system [6,7]. Microstrip patch antennas are attractive for this role because of their small size, low cost, simple design and ease of fabrication. The shape of the radiating patch and of the ground plane determines the operating frequency and bandwidth, and therefore the intended use. Both UWB and NB antennas have been proposed for breast sensing; they differ in the number of frequencies covered, in gain and directivity, and in the image resolution they support when used in an imaging system.
UWB antennas are the most widely studied sensors for microwave breast imaging [2,7]. Recent designs include an antipodal Vivaldi antenna used in radar-based imaging of measured hemispherical phantoms [8], a side-slotted tapered-slot array forming a low-cost portable imaging system [9], a compact planar monopole whose geometry is predicted by machine learning [10], a compact decagonal radiator [11] and flexible antennas integrated into a wearable tumor-monitoring vest [12]. The wide bandwidth of these antennas enables short-duration pulses, which improves spatial resolution and provides rich frequency-domain information, both highly desirable for imaging. On the other hand, tissue attenuation increases with frequency, which limits the useful penetration of the upper part of the band, and the wide bandwidth increases the complexity of the RF front-end, the antenna design and the calibration process. This is the main reason UWB imaging systems are generally more expensive than NB systems [2,13]. Despite the large number of UWB designs, their detection performance has rarely been compared directly with that of NB antennas for the same sensing task.
NB antennas remain widely used thanks to their low cost, ease of fabrication and compact size. Fortaleza et al. estimated a large cost difference between UWB and NB breast-screening systems: a 16-element system costs about US$42,000 with UWB antennas but about US$2,500 with NB elements, while the NB system still highlighted the tumor response under suitable conditions [13]. Single-frequency sensing has also been demonstrated through the change in reflection coefficient: Youssef et al. discriminated tumor types at 2.4 GHz from the magnitude and phase of S11 of a metasurface-loaded array [14], Ali et al. used return-loss changes of a printed antenna on a hemispherical breast model [15], and Dessai et al. evaluated both UWB and 2.45 GHz ISM-band operation in a wearable vest [12]. A narrow bandwidth and high directivity allow the radiated energy to be focused on a target and reduce interference from unwanted transmitters. NB systems also need simpler RF hardware, matching networks and signal processing, which makes them easier to implement and maintain in practical medical devices, and they suit localized sensing and dielectric characterization at a stable single frequency. Imaging and reconstruction applications, however, favor UWB systems because a narrow band provides less frequency-domain information. The choice between UWB and NB antennas therefore depends on image resolution, implementation complexity and cost, and not only on bandwidth.
This paper presents a controlled comparison between a UWB and an NB circular patch antenna that share the same FR4 substrate, 30 × 30 mm2 footprint and circular radiating element, so that differences in performance can be attributed to the ground plane and feed configuration that set the bandwidth. The contributions are as follows. (i) Both antennas are designed, fabricated and characterized in free space in terms of reflection coefficient, gain and radiation pattern. (ii) Their sensitivity to a change in tissue dielectric properties is quantified using a breast phantom made of either healthy or malignant tissue, through the resonance shift and the tumor-induced change in the reflection coefficient, using two independent full-wave solvers, and the electric field inside the phantom is visualized. (iii) The results are used to discuss when each type of antenna is the more suitable choice for a microwave breast-sensing system.
The remainder of the paper is organized as follows. Section 2 describes the two antenna designs and their fabrication. Section 3 presents their free-space performance. Section 4 compares their detection performance near the breast phantom. Section 5 discusses the results and the limitations of the study, and Section 6 concludes the paper.
2. Antenna Design and Fabrication
Both antennas are printed on an FR4 substrate (εr = 4.4, thickness 1.6 mm) with a square footprint of 30 × 30 mm2, and both use a circular radiating patch of radius 9 mm fed by a microstrip line. Their geometries are shown in Figure 1 and their main parameters are listed in Table 1.
2.1. UWB Antenna
The UWB antenna (Figure 1a–c) uses a defected (partial) ground plane whose length equals that of the 3 × 10 mm2 feed line. A 10 × 3 mm2 rectangle parallel to the feed line is also removed from the ground plane. Truncating the ground plane in this way suppresses the strong resonant behavior of a conventional patch and merges several closely spaced resonances into one wide impedance band.
2.2. NB Antenna
The NB antenna (Figure 1d–f) uses the same circular patch, but with a full ground plane covering the whole 30 × 30 mm2 substrate. It is inset-fed: two gaps of length Lgap = 4.6 mm are cut on both sides of the feed line where it enters the patch, which sets the input impedance at the feed point and provides a good match at the resonance frequency. The full ground plane restores the high-Q resonant behavior of the patch and therefore produces a narrow operating band.
2.3. Fabrication and Measurement
Both antennas were fabricated by chemical etching and fitted with SMA connectors (Figure 2). Their reflection coefficients were measured with a Keysight N5247B vector network analyzer from 10 MHz to 20 GHz, with a frequency step of about 100 MHz, after a standard calibration at the end of the test cable. In the full-wave model, the antennas are excited through a small lumped port at the edge of the feed line, so the SMA connector is not included in the simulation.
3. Free-Space Performance
Unless stated otherwise, all simulations were carried out with the finite-element solver ANSYS HFSS. The gains, radiation efficiencies and the sensitivity analysis in this section were obtained with the independent FDTD solver openEMS [16], which also serves as a cross-check of the HFSS results. In the simulation coordinate system, the antennas lie in the xz-plane and face the +y direction.
3.1. Reflection Coefficient
Figure 3 compares the simulated and measured reflection coefficients of the two antennas. In simulation, the UWB antenna (Figure 3a) achieves |S11| < −10 dB from 3.56 to 14.73 GHz, a bandwidth of about 11.2 GHz (122% fractional bandwidth), and again from 16.48 GHz up to the 20 GHz limit of the analysis. Its three main resonances are at 4.28, 5.94 and 12.26 GHz. The measured response is also wideband, covering 4.91–10.20 GHz and 11.70–20 GHz, with its deepest minimum (−44.4 dB) at 14.70 GHz. The measured lower band edge is therefore higher than the simulated one, and the resonances are redistributed within the band.
The simulated NB antenna (Figure 3b) resonates at 7.79 GHz with |S11| = −41.2 dB and a −10 dB bandwidth of 320 MHz (7.64–7.96 GHz, 4.1%). The measured NB antenna resonates at 8.71 GHz with |S11| = −25.8 dB and a −10 dB band of 8.51–9.41 GHz. The measured resonance is thus shifted upward by 0.92 GHz (11.8%), and the measured band is wider than the simulated one.
To verify the simulations and identify the origin of these discrepancies, both antennas were also modeled in openEMS with their nominal dimensions, a lumped port at the board edge and a lossy FR4 substrate (tan δ = 0.02), and the mesh was refined until the resonance frequencies changed by less than 2%. For the NB antenna, the FDTD model places the TM21 resonance at 7.66 GHz, within 1.7% of the HFSS result, and also shows a weak TM11 resonance at 4.74 GHz. The measured NB response is shifted upward by 12–13% for every mode: the TM11 dip appears at 5.31 GHz and the TM21 resonance at 8.71 GHz, followed by a secondary dip at 9.11 GHz that mirrors the second dip of the simulated response. A uniform shift of all modes indicates that the fabricated patch is electrically smaller than the nominal design, which points to the substrate and the etched radiator rather than to the feed. Measurements of the prototypes confirm this: the patch diameter is 16.5 mm on the NB antenna and 17 mm on the UWB antenna, instead of the nominal 18 mm, a reduction consistent with the undercut of chemical etching, while the inset gaps are below 1 mm. When the measured radius of 8.25 mm is used in the FDTD model (Figure 3b), a substrate permittivity of 4.2, slightly below the nominal value of 4.4 specified at low frequency, reproduces the measured TM11 dip within 0.2% (5.32 versus 5.31 GHz), the TM21 resonances within 1.3% (8.60 and 9.06 GHz versus 8.71 and 9.11 GHz), and the measured −10 dB band (8.38–9.44 GHz versus 8.51–9.41 GHz).
For the UWB antenna, the FDTD model agrees with HFSS at the lower band edge (3.74 GHz versus 3.56 GHz) and at the first resonance (4.46 GHz versus 4.28 GHz). Using the measured radius of 8.5 mm and a reduced permittivity of 4.0–4.1, however, leaves the lower band edge almost unchanged (3.71–3.73 GHz), whereas the measured edge lies at 4.91 GHz. The UWB discrepancy is therefore attributed mainly to the measurement setup: with a ground plane only 10 mm long, currents induced on the outer conductor of the feed cable and on the SMA connector, which are not included in either model, modify the effective ground of the antenna and its impedance at the lower frequencies. Since the comparison in Section 4 is based on simulations of the nominal designs, these deviations affect the absolute operating frequencies of the fabricated prototypes but not the relative comparison between the two antennas.
3.2. Gain
The gain and radiation efficiency of both antennas were computed with the FDTD model, from the full far-field pattern and the power accepted at the port. The UWB antenna has a peak gain of 2.8 dBi at 4.33 GHz and 3.5 dBi at 5.94 GHz, with a radiation efficiency of 90–92%. Its maximum radiation is on the −y side, opposite the radiating patch, about 1.3 dB above the level on the patch side. The NB antenna reaches a peak gain of 3.7 dBi at its TM21 resonance, but its radiation efficiency is only 56%, because its high-Q resonance stores more energy in the lossy FR4 substrate. Because the phantom is placed on the +y side, the gain toward the phantom (θ = 90°, φ = 90°) is more relevant to sensing. It is 1.4 dBi at 4.33 GHz and 2.0 dBi at 5.94 GHz for the UWB antenna, and about −4.1 dBi for the NB antenna, whose TM21 mode has a null in the broadside direction (Section 4.4). Toward the phantom, the UWB antenna therefore provides 5.5–6 dB more gain than the NB antenna.

Table 2.
Free-space performance of the two antennas.
| Metric | UWB (sim.) | UWB (meas.) | NB (sim.) | NB (meas.) |
|---|---|---|---|---|
| Resonances (GHz) | 4.28, 5.94, 12.26 | 5.51, 7.91, 14.70 | 7.79 | 8.71 |
| −10 dB band (GHz) | 3.56–14.73; 16.48–20 | 4.91–10.20; 11.70–20 | 7.64–7.96 | 8.51–9.41 |
| Bandwidth | 11.2 GHz (122%) | 5.3 GHz + 8.3 GHz | 320 MHz (4.1%) | 900 MHz (10.3%) |
| Peak gain (dBi) | 2.8 (4.33 GHz), 3.5 (5.94 GHz) | – | 3.7 (TM21) | – |
| Gain toward phantom, +y (dBi) | 1.4 (4.33 GHz), 2.0 (5.94 GHz) | – | −4.1 (TM21) | – |
| Radiation efficiency (%) | 92 (4.33 GHz), 90 (5.94 GHz) | – | 56 | – |
4. Tumor Detection Performance
Detecting a tumor inside healthy tissue relies on the difference in dielectric properties between cancerous and normal tissue. The two properties mainly affected are the permittivity, which describes how much energy the tissue stores when an electric field propagates through it, and the conductivity, which describes how much of that energy is dissipated. Tumorous tissue contains more water than healthy tissue and therefore has higher permittivity and conductivity [5]. These changes can be observed in the electric-field magnitude and phase inside the breast, as in our previous work, where 24- and 48-element arrays of miniaturized inward fractal antennas [17] were used to locate and size a tumor from the Ex and Ey field distributions [18,19]. The same contrast also changes the load presented to the antenna and therefore its reflection coefficient, which is the basis of the single-frequency sensors in [14,15]. Because the reflection coefficient is the quantity measured directly by a single-port sensing system, it is used here to compare the detection capability of the two antennas.
4.1. Breast Phantom Model
Each antenna is placed 10 mm from a homogeneous breast phantom, with its radiating face directed toward the phantom (+y direction), as shown in Figure 4. The phantom is a 34 × 34 × 15 mm3 block that slightly exceeds the antenna footprint. Two cases are simulated. In the healthy case, the block has εr = 6.5 and σ = 1.2 S/m. In the malignant case, the entire block is assigned the properties of tumorous tissue, εr = 57 and σ = 10 S/m. These values are representative of low-water-content (adipose-dominated) breast tissue and of malignant tissue in the microwave range [5]. They are taken as frequency-independent, and the malignant case represents a maximum-contrast scenario. This configuration isolates the intrinsic sensitivity of each antenna to the dielectric change, independently of tumor size and position. The phantom simulations were repeated with the openEMS model of Section 3, using a mesh with at least 15 cells per wavelength inside the tissue and the finer mesh of Section 3 for the NB antenna.
4.2. Reflection Coefficient near the Phantom
Figure 5 compares the reflection coefficients in free space and near the healthy and malignant phantoms. For the UWB antenna (Figure 5a), the healthy phantom shifts the first resonance down from 4.28 to 3.85 GHz and deepens it to −41.6 dB. With the malignant phantom, this resonance stays at 3.85 GHz but becomes much shallower (−19.8 dB). The other resonances move upward slightly with the malignant phantom: from 5.89 to 6.04 GHz, from 7.79 to 7.89 GHz and from 12.12 to 12.21 GHz. Near the healthy phantom the −10 dB band widens to 3.38–15.16 GHz, and it changes little with the malignant phantom (3.42–15.16 GHz). The antenna therefore remains well matched in both cases.
For the NB antenna (Figure 5b), the healthy phantom shifts the resonance from 7.79 to 7.88 GHz and reduces its depth from −41.2 to −29.8 dB. The malignant phantom moves it further to 8.02 GHz, with a depth of −21.5 dB. The tumor therefore produces a resonance shift of 140 MHz (1.8%) and an 8.3 dB change in matching depth, while the −10 dB band moves from 7.73–8.03 GHz to 7.87–8.15 GHz.
4.3. Tumor-Induced Change in the Reflection Coefficient
To compare the detection capability of the two antennas directly, Figure 6 plots the difference Δ|S11| = |S11|tumor − |S11|healthy (in dB) across each antenna’s analysis band. A larger magnitude of Δ|S11| indicates a stronger, and therefore more easily measurable, response to the malignant tissue.
The NB antenna produces a peak contrast of 19.2 dB at 7.88 GHz, followed by a contrast of −10.6 dB at 8.02 GHz. This bipolar signature is the typical signature of a shifted resonance. The contrast exceeds 3 dB over a single continuous window of about 0.49 GHz (7.68–8.17 GHz). The UWB antenna reaches a slightly higher peak contrast of 21.9 dB at 3.85 GHz, and it shows a second independent window around 12 GHz with a contrast of up to about 15 dB. Its contrast exceeds 3 dB over 3.71–4.32 GHz and 11.59–12.35 GHz, about 1.4 GHz of spectrum in total, plus a narrow region near the 20 GHz edge of the analysis band.
The FDTD model reproduces the main trends. For the NB antenna, the TM21 resonance moves from 7.70 GHz with the healthy phantom to 7.84 GHz with the malignant phantom, a shift of 140 MHz identical to the HFSS result, and the secondary dip moves from 8.31 to 8.46 GHz. For the UWB antenna, the resonances above 7 GHz again move upward with the malignant phantom (from 7.26 to 7.44 GHz and from 12.91 to 13.10 GHz), whereas the first resonance changes little (from 4.14 to 4.18 GHz). The FDTD results also confirm that the UWB antenna is sensitive over a much wider spectrum: |Δ|S11|| exceeds 3 dB over about 3.8 GHz in three windows (3.66–4.10, 6.82–9.58 and 12.71–13.46 GHz), compared with about 0.5 GHz between 7.56 and 8.34 GHz for the NB antenna. The peak contrasts, however, are lower than in HFSS: 9.7 dB at 13.1 GHz for the UWB antenna and 7.1 dB at 7.86 GHz for the NB antenna. The peak values of Δ|S11| occur at very deep resonance minima, whose depth is highly sensitive to the solver, the mesh and the port model, whereas the resonance frequencies are much more robust. The resonance shift and the width of the sensitive spectrum are therefore the more reliable comparison metrics, and both solvers agree on them. In both solvers, the peak contrast of the UWB antenna is also slightly larger than that of the NB antenna. Table 3 summarizes the detection metrics of the two antennas obtained with both solvers.
4.4. Radiation Patterns
Figure 7 shows the radiation patterns in the xy-plane (θ = 90°), which contains the direction toward the phantom (φ = 90°). For each antenna, the free-space and phantom cases are evaluated at the same frequency (5.94 GHz for the UWB antenna and 7.79 GHz for the NB antenna) and normalized to the maximum of the three curves. In free space, the UWB antenna is nearly omnidirectional in this plane, with a variation of about 5 dB and its maximum on the −y side, opposite the patch. With the phantom present, the level toward the phantom drops from −2.8 dB to −6.8 dB (healthy) and −9.2 dB (malignant), while the backward lobe is preserved. The NB antenna has two main lobes at φ ≈ 46° and 132°, both on the phantom side, and a reduced broadside level (−8.8 dB) in free space, while its full ground plane keeps the radiation toward −y about 18.6 dB below the maximum. These features identify the TM21 mode of the circular patch: for a radius of 9 mm on FR4, cavity theory places the fundamental TM11 mode near 4.4 GHz and the TM21 mode near 7.4 GHz, and the FDTD model confirms a weak TM11 resonance at 4.74 GHz. The NB antenna therefore operates in its TM21 mode, whose broadside null explains its low gain toward the phantom. Near the phantom, the broadside level falls to −17.8 dB (healthy) and −20.2 dB (malignant). In both antennas, the stronger attenuation in front of the malignant phantom is consistent with the higher conductivity of tumorous tissue, which absorbs more of the incident energy. The patterns also confirm that the phantom is in the near field of each antenna, so it acts as part of the antenna’s load rather than as a distant scatterer.
4.5. Electric-Field Distribution in the Phantom
To show how each antenna couples energy into the tissue, Figure 8 presents the magnitude of the electric field computed with the FDTD model in the plane normal to the antenna that contains the feed line, normalized to a 1 V incident wave at the port. With the healthy phantom, the field penetrates the whole 15 mm block and decays gradually. With the malignant phantom, it is confined to the first few millimeters: averaged over the phantom, the field is 14 dB (3.85 GHz) and 16 dB (5.94 GHz) lower for the UWB antenna and 20 dB lower for the NB antenna at 7.80 GHz than in the healthy case, and at a depth of 8 mm the difference reaches 12–22 dB. This behavior is consistent with a penetration depth of about 4 mm in malignant tissue, compared with about 12 mm in healthy tissue, at these frequencies. Just inside the phantom surface, the malignant tissue lowers the field by 6–7 dB for the UWB antenna and by about 13 dB for the NB antenna. These maps confirm that the changes in the reflection coefficient in Section 4.2 and Section 4.3 result from the strong reflection and absorption of the near field by the high-permittivity, high-conductivity malignant tissue. They also indicate that a small tumor deep inside the breast would be reached only by a strongly attenuated field, which motivates the study of a small inclusion in a realistic phantom.
5. Discussion
The comparison shows that bandwidth alone does not determine detection capability. At its most sensitive frequency, the NB antenna produces a tumor-induced contrast close to that of the UWB antenna (19.2 versus 21.9 dB in HFSS, and 7.1 versus 9.7 dB in the FDTD model), and its high-Q resonance converts the dielectric change into a clear frequency shift of 140 MHz, which both solvers predict. For a system that monitors a single frequency or tracks one resonance, the NB antenna therefore provides nearly the same sensitivity with a simpler front-end, a simpler matching network and lower cost, in line with the cost comparison reported in [13].
The UWB antenna, by contrast, responds to the malignant tissue in two well-separated frequency windows, and it directs 5.5–6 dB more gain toward the breast than the NB antenna, with a higher radiation efficiency (about 90% versus 56%), which would help when the target lies deeper in tissue. Its sensitive spectrum is about three times (HFSS) to seven times (FDTD) wider than that of the NB antenna. This spectral diversity offers redundancy, since a detection decision does not depend on a single frequency that may be affected by fabrication tolerances, as Section 3 showed for the NB prototype. It also provides the frequency-domain information needed by imaging and localization algorithms, where bandwidth translates into range resolution. The UWB antenna is therefore preferable for imaging-oriented systems, whereas the NB antenna is a cost-effective choice for detection or monitoring at a known frequency. The measured results in Section 3 also show that the NB design is more sensitive to fabrication deviations, which matters when the operating frequency of the sensing system is fixed.
Table 4 compares the two antennas with recently reported breast-sensing antennas. On a low-cost FR4 substrate and within a 30 × 30 mm2 footprint, the UWB antenna reaches a bandwidth comparable to that of the machine-learning-designed monopole in [10], which uses a low-loss Rogers substrate, although with a lower gain (3.5 versus 6.2 dBi), and it is considerably smaller than the Vivaldi-type antennas in [8,9]. The NB antenna provides a gain similar to that of the 2.4 GHz metasurface-loaded array in [14] and a simulated S11 contrast of the same order (7.1–19.2 dB depending on the solver, versus about 11 dB), although the phantoms, tumor models and detection metrics differ between studies, so the contrast values are indicative only. The main distinction of this work is that the UWB and NB antennas share the same substrate, footprint and radiator, so their comparison is not confounded by differences in materials or size.
This study has several limitations. The phantom is homogeneous, and the malignant case assigns tumorous properties to the whole block. This is a maximum-contrast scenario that measures the antennas’ intrinsic sensitivity, but it does not reproduce a small tumor embedded in heterogeneous breast tissue. The tissue properties were taken as constant with frequency, whereas real tissues are dispersive; this mainly affects the UWB results, which span a wide band. The detection comparison is based on simulation, and the measured prototypes show frequency shifts relative to the simulated designs. The two solvers agree on the resonance shifts and on the width of the sensitive spectrum but differ in the peak contrast, which should therefore be confirmed by measurement. Future work will consider a small tumor inclusion in a multilayer, dispersive phantom, the effect of tumor size and depth, and measurements with physical tissue-mimicking phantoms.
6. Conclusions
A UWB and an NB circular patch antenna with identical substrates, footprints and radiating patches have been designed, fabricated and compared for microwave breast tumor detection. In free space, the UWB antenna achieves a simulated bandwidth of 11.2 GHz with a peak gain of 3.5 dBi and a radiation efficiency of about 90%, and the NB antenna resonates at 7.79 GHz in its TM21 mode with a 320 MHz bandwidth, 3.7 dBi gain and 56% efficiency. Measurements confirm the wideband and narrowband behaviors, and an independent FDTD model attributes the NB frequency shift to the substrate permittivity and etching tolerance, and the UWB deviation to the feed cable and connector. Near a breast phantom, both antennas clearly distinguish healthy from malignant tissue. The NB antenna yields a 140 MHz resonance shift and a 19.2 dB peak contrast, while the UWB antenna yields a 21.9 dB peak contrast and a second independent sensitive window, for about 1.4 GHz of usable spectrum. An independent FDTD model confirms the 140 MHz shift and a UWB sensitive spectrum several times wider than that of the NB antenna, with lower peak contrasts (7.1 and 9.7 dB), and its field maps show that malignant tissue confines the field to the first few millimeters of the phantom. The NB antenna is thus a low-cost option with nearly equal per-frequency sensitivity, whereas the UWB antenna is better suited to imaging systems that exploit frequency diversity.
Author Contributions
Conceptualization, M.N.M.; methodology, M.N.M.; software, M.N.M.; formal analysis, M.N.M.; investigation, M.E.A.; resources, M.E.A.; writing—original draft preparation, M.N.M.; writing—review and editing, K.Y.K.; supervision, M.A.M. and K.Y.K. All authors have read and agreed to the published version of the manuscript.
Funding
This research received no external funding.
Institutional Review Board Statement
Not applicable.
Informed Consent Statement
Not applicable.
Data Availability Statement
The simulated and measured data supporting the findings of this study, and the openEMS simulation scripts, are available from the corresponding author upon reasonable request.
Acknowledgments
During the preparation of this manuscript, the authors used Claude (Anthropic) to assist with language editing. The authors have reviewed and edited the output and take full responsibility for the content of this publication.
Conflicts of Interest
The authors declare no conflicts of interest.
Abbreviations
The following abbreviations are used in this manuscript:
| FDTD | Finite-difference time domain |
| FR4 | Flame-retardant glass-epoxy laminate |
| HFSS | High-Frequency Structure Simulator |
| ISM | Industrial, scientific and medical |
| NB | Narrowband |
| SMA | SubMiniature version A |
| TM | Transverse magnetic |
| UWB | Ultra-wideband |
References
- Lu, M.; Xiao, X.; Pang, Y.; Liu, G.; Lu, H. Detection and Localization of Breast Cancer Using UWB Microwave Technology and CNN-LSTM Framework. IEEE Trans. Microw. Theory Tech. 2022, 70, 5085–5094. [Google Scholar] [CrossRef]
- Felício, J.M.; Martins, R.A.; Costa, J.R.; Fernandes, C.A. Microwave Breast Imaging for Cancer Diagnosis: An Overview. IEEE Antennas Propag. Mag. 2024, 66, 85–97. [Google Scholar] [CrossRef]
- Safdar, A.; Sohani, B.; Iqbal, F.; Barzamini, R.; Rahmani, A.; Aliyu, A. Advanced Microwave Imaging Techniques for Early Detection of Breast Cancer: A Review and Future Perspectives. BioMed 2026, 6, 6. [Google Scholar] [CrossRef]
- Fear, E.C. Microwave Imaging of the Breast. Technol. Cancer Res. Treat. 2005, 4, 69–82. [Google Scholar] [CrossRef]
- Lazebnik, M.; Popovic, D.; McCartney, L.; Watkins, C.B.; Lindstrom, M.J.; Harter, J.; Sewall, S.; Ogilvie, T.; Magliocco, A.; Breslin, T.M.; Temple, W.; Mew, D.; Booske, J.H.; Okoniewski, M.; Hagness, S.C. A Large-Scale Study of the Ultrawideband Microwave Dielectric Properties of Normal, Benign and Malignant Breast Tissues Obtained from Cancer Surgeries. Phys. Med. Biol. 2007, 52, 6093–6115. [Google Scholar] [CrossRef]
- Shao, W.; Zeng, X.; Gong, Z. Optimizing Antennas for Microwave Medical Imaging: A Comprehensive Review. IEEE Antennas Propag. Mag. 2025. [Google Scholar] [CrossRef]
- Saeidi, T.; Mahmood, S.N.; Saleh, S.; Timmons, N.; Al-Gburi, A.J.A.; Razzaz, F. Ultra-Wideband (UWB) Antennas for Breast Cancer Detection with Microwave Imaging: A Review. Results Eng. 2025, 25, 104167. [Google Scholar] [CrossRef]
- Yıldız, Ş.; Kurt, M.B. Breast Cancer Detection Using a High-Performance Ultra-Wideband Vivaldi Antenna in a Radar-Based Microwave Breast Cancer Imaging Technique. Appl. Sci. 2025, 15, 6015. [Google Scholar] [CrossRef]
- Islam, M.T.; Mahmud, M.Z.; Islam, M.T.; Kibria, S.; Samsuzzaman, M. A Low Cost and Portable Microwave Imaging System for Breast Tumor Detection Using UWB Directional Antenna Array. Sci. Rep. 2019, 9, 15491. [Google Scholar] [CrossRef]
- Mahmud, M.Z. A Machine Learning-Based Ultra-Wideband Microstrip Antenna for Microwave Imaging Applications. Electronics 2026, 15, 455. [Google Scholar] [CrossRef]
- Ashok, G.L.P.; Nath, G.V.; Kumar, R.; Neelapu, B.C. Compact Decagonal Shaped UWB Antenna for Breast Cancer Detection. IETE J. Res. 2025, 71, 3358–3374. [Google Scholar] [CrossRef]
- Dessai, R.; Singh, D.; Sonkki, M.; Reponen, J.; Myllylä, T.; Myllymäki, S.; Särestöniemi, M. A Breast Tumor Monitoring Vest with Flexible UWB Antennas—A Proof-of-Concept Study Using Realistic Breast Phantoms. Micromachines 2024, 15, 1153. [Google Scholar] [CrossRef]
- Fortaleza, L.; Kranold, L.; Popović, M. Flexible 16-Antenna System for Microwave Breast Screening: NB vs. UWB Performance. In Proceedings of the 2020 IEEE International Symposium on Antennas and Propagation and North American Radio Science Meeting, Montreal, QC, Canada, 5–10 July 2020; pp. 1289–1290. [Google Scholar] [CrossRef]
- Youssef, K.; Abo-Zahhad, M.; Kanaya, H.; Abd El-Malek, A.H. A Unified Approach for Breast Cancer Discrimination Using Metasurface-Based Microwave Technology. Discov. Appl. Sci. 2024, 6, 395. [Google Scholar] [CrossRef]
- Ali, N.; Sree, M.F.A.; Uyguroglu, R.; Allam, A.M.M.A. Stage II Cancer Diagnosis Using Printed Antenna Implemented on Hemispherical Model for Human Breast. J. Instrum. 2020, 15, P09016. [Google Scholar] [CrossRef]
- Liebig, T.; Rennings, A.; Held, S.; Erni, D. openEMS—A Free and Open Source Equivalent-Circuit (EC) FDTD Simulation Platform Supporting Cylindrical Coordinates Suitable for the Analysis of Traveling Wave MRI Applications. Int. J. Numer. Model. Electron. Netw. Devices Fields 2013, 26, 680–696. [Google Scholar] [CrossRef]
- Moussa, M.N.; Madi, M.A.; Kabalan, K.Y. Miniaturized Inward Fractal Antenna for Breast Cancer Detection. In Proceedings of the 2021 International Conference on Electrical, Computer and Energy Technologies (ICECET), Cape Town, South Africa, 9–10 December 2021; pp. 1–4. [Google Scholar] [CrossRef]
- Moussa, M.N.; Madi, M.A.; Kabalan, K.Y. Breast Tumor Detection, Sizing and Localization Using a 24-Element Antenna Array. IEEE J. Biomed. Health Inform. 2022, 26, 5109–5121. [Google Scholar] [CrossRef]
- Moussa, M.N.; Madi, M.A.; Kabalan, K.Y. Work-in-Progress: Improved Antenna Array for Breast Tumor Detection. In Proceedings of the 2023 IEEE International Black Sea Conference on Communications and Networking (BlackSeaCom), Istanbul, Türkiye, 4–7 July 2023; pp. 379–383. [Google Scholar] [CrossRef]
Figure 1.
Simulated geometries of the two antennas. UWB antenna: (a) front, (b) back and (c) perspective views. NB antenna: (d) front, (e) back and (f) perspective views.
Figure 1.
Simulated geometries of the two antennas. UWB antenna: (a) front, (b) back and (c) perspective views. NB antenna: (d) front, (e) back and (f) perspective views.
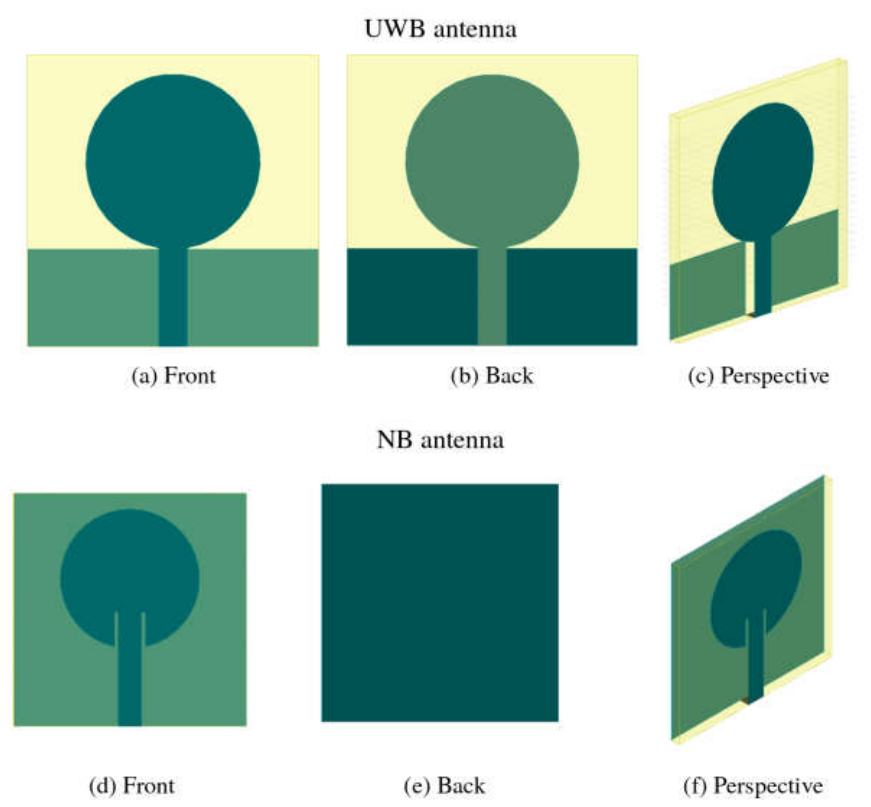
Figure 2.
Fabricated prototypes: UWB antenna (a) front and (b) back; NB antenna (c) front and (d) back.
Figure 2.
Fabricated prototypes: UWB antenna (a) front and (b) back; NB antenna (c) front and (d) back.
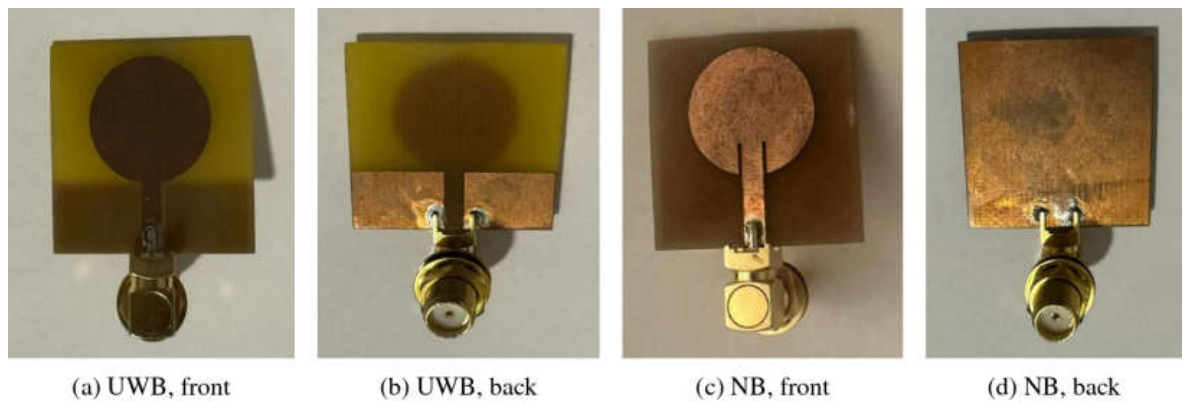
Figure 3.
Simulated and measured reflection coefficients in free space: (a) UWB antenna; (b) NB antenna. The dotted gray line marks the −10 dB level. The dotted blue curve in (b) is the FDTD (openEMS) simulation of the NB prototype with its measured patch radius (8.25 mm) and a substrate permittivity of 4.2.
Figure 3.
Simulated and measured reflection coefficients in free space: (a) UWB antenna; (b) NB antenna. The dotted gray line marks the −10 dB level. The dotted blue curve in (b) is the FDTD (openEMS) simulation of the NB prototype with its measured patch radius (8.25 mm) and a substrate permittivity of 4.2.
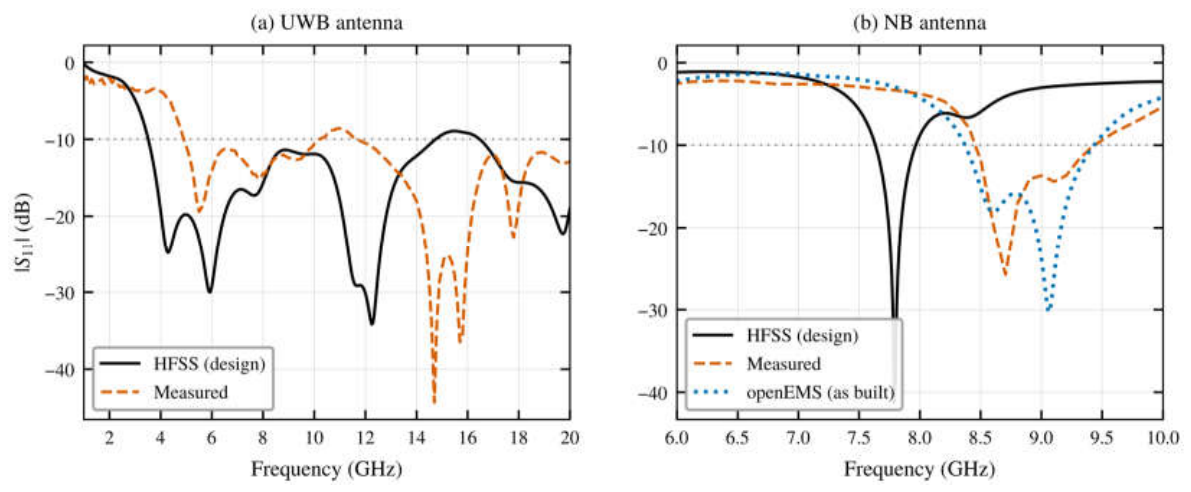
Figure 4.
Simulation setup: (a) top view (xy-plane) of the antenna placed 10 mm from the breast phantom; 3D views with (b) the healthy and (c) the malignant phantom, with the radiating face of the antenna toward the phantom. The same setup is used for both antennas.
Figure 4.
Simulation setup: (a) top view (xy-plane) of the antenna placed 10 mm from the breast phantom; 3D views with (b) the healthy and (c) the malignant phantom, with the radiating face of the antenna toward the phantom. The same setup is used for both antennas.
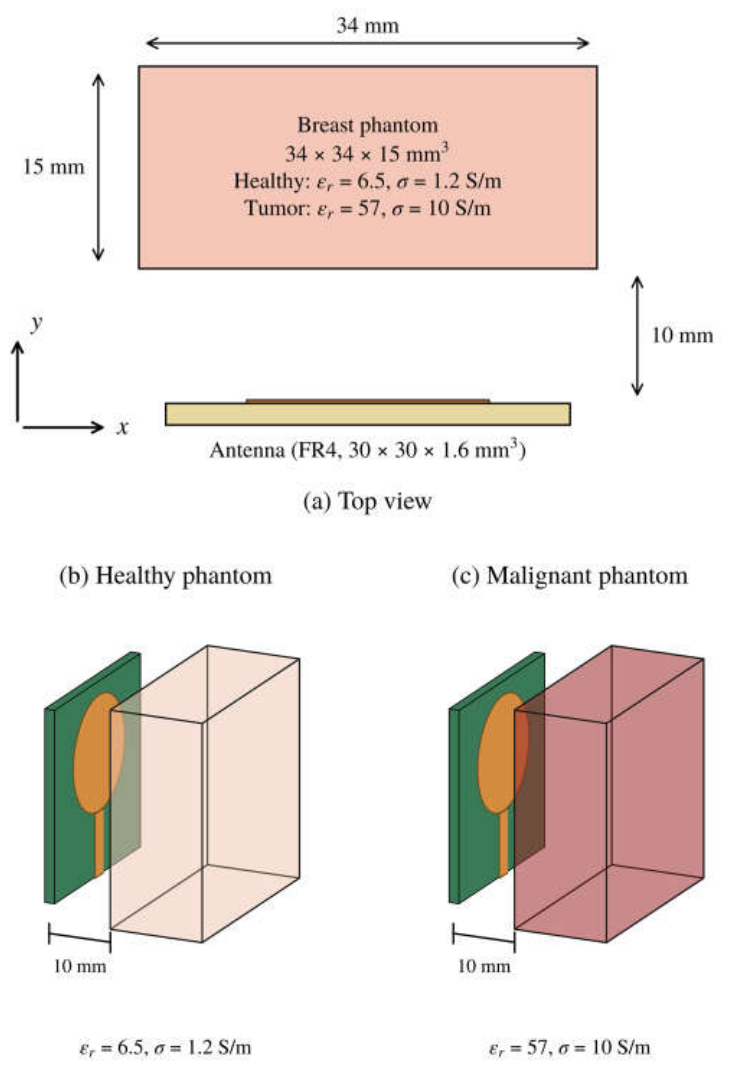
Figure 5.
Simulated reflection coefficients in free space and at 10 mm from the healthy and malignant phantoms: (a) UWB antenna; (b) NB antenna.
Figure 5.
Simulated reflection coefficients in free space and at 10 mm from the healthy and malignant phantoms: (a) UWB antenna; (b) NB antenna.
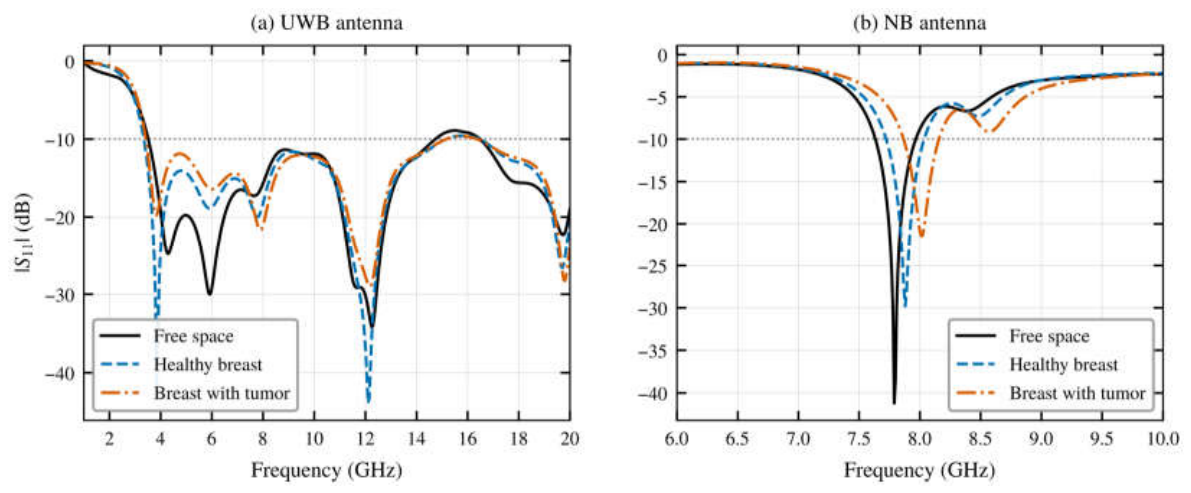
Figure 6.
Tumor-induced change in the reflection coefficient, Δ|S11| = |S11|tumor − |S11|healthy: (a) UWB antenna; (b) NB antenna.
Figure 6.
Tumor-induced change in the reflection coefficient, Δ|S11| = |S11|tumor − |S11|healthy: (a) UWB antenna; (b) NB antenna.
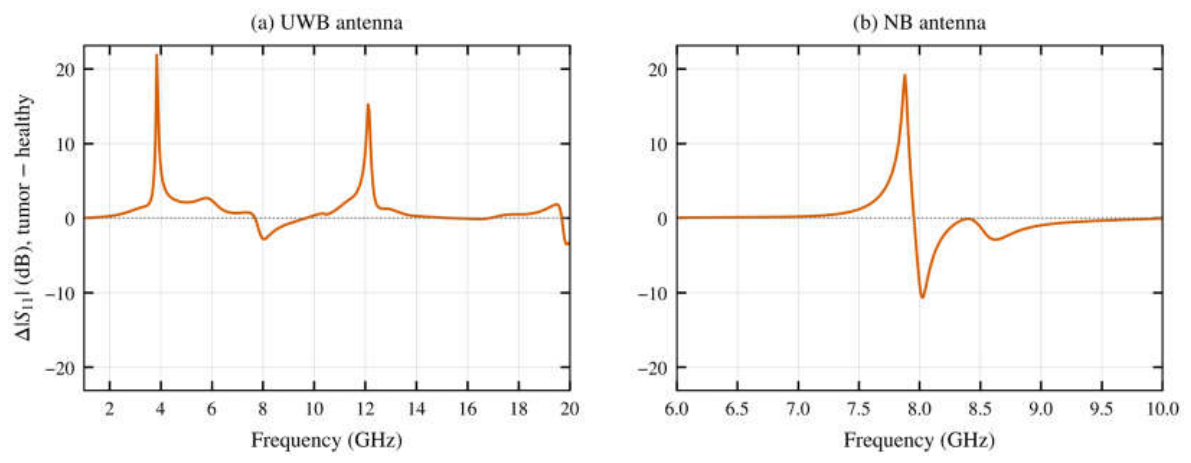
Figure 7.
Normalized radiation patterns in the xy-plane (θ = 90°) in free space and near the healthy and malignant phantoms: (a) UWB antenna at 5.94 GHz; (b) NB antenna at 7.79 GHz. The phantom is located in the φ = 90° direction.
Figure 7.
Normalized radiation patterns in the xy-plane (θ = 90°) in free space and near the healthy and malignant phantoms: (a) UWB antenna at 5.94 GHz; (b) NB antenna at 7.79 GHz. The phantom is located in the φ = 90° direction.
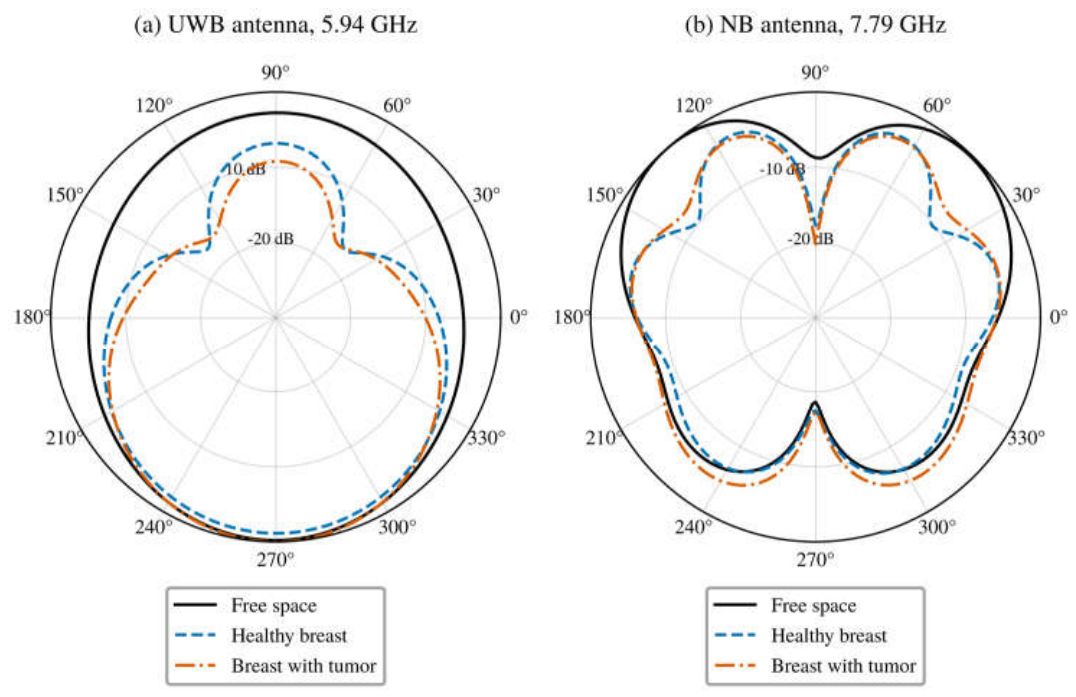
Figure 8.
Electric-field magnitude (FDTD) in the plane normal to the antenna that contains the feed line, near the healthy and malignant phantoms: (a,b) UWB antenna at 3.85 GHz; (c,d) UWB antenna at 5.94 GHz; (e,f) NB antenna at 7.80 GHz. The field is normalized to a 1 V incident wave. Height is measured from the back of the substrate, and the dashed rectangle marks the phantom.
Figure 8.
Electric-field magnitude (FDTD) in the plane normal to the antenna that contains the feed line, near the healthy and malignant phantoms: (a,b) UWB antenna at 3.85 GHz; (c,d) UWB antenna at 5.94 GHz; (e,f) NB antenna at 7.80 GHz. The field is normalized to a 1 V incident wave. Height is measured from the back of the substrate, and the dashed rectangle marks the phantom.
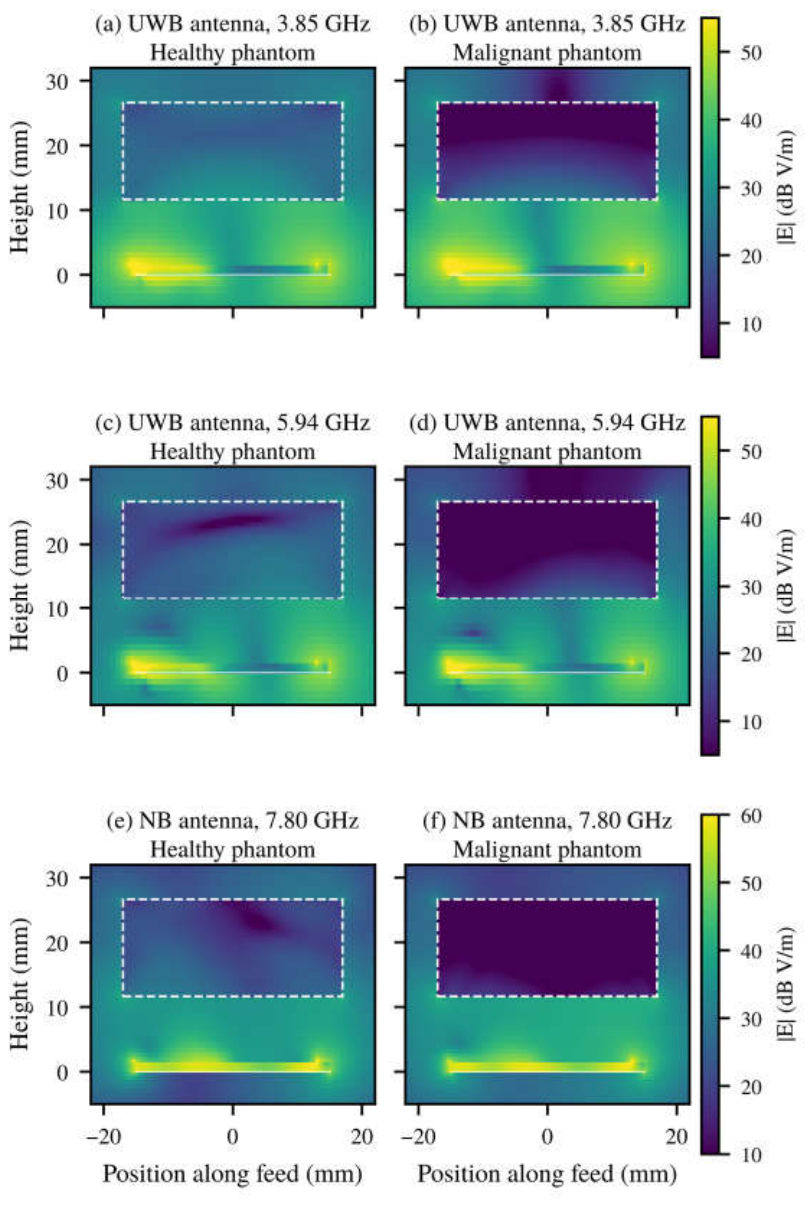
Table 1.
Main parameters of the two antennas.
| Parameter | UWB antenna | NB antenna |
|---|---|---|
| Substrate | FR4, εr = 4.4, h = 1.6 mm | FR4, εr = 4.4, h = 1.6 mm |
| Substrate size | 30 × 30 mm2 | 30 × 30 mm2 |
| Patch radius | 9 mm | 9 mm |
| Ground plane | Partial, length = feed-line length (10 mm), with 10 × 3 mm2 slot | Full, 30 × 30 mm2 |
| Feed | Microstrip line, width 3 mm, length 10 mm | Inset microstrip line, width 3 mm, Lgap = 4.6 mm |
Table 3.
Detection performance of the two antennas (simulation, phantom at 10 mm; HFSS unless marked FDTD).
Table 3.
Detection performance of the two antennas (simulation, phantom at 10 mm; HFSS unless marked FDTD).
| Metric | UWB antenna | NB antenna |
|---|---|---|
| Resonances, healthy (GHz) | 3.85, 5.89, 7.79, 12.12 | 7.88 |
| Resonances, malignant (GHz) | 3.85, 6.04, 7.89, 12.21 | 8.02 |
| Resonance shift (healthy → malignant) | +0.14 GHz (5.9 GHz mode), +0.10 GHz (7.8 GHz mode), +0.09 GHz (12.1 GHz mode) | +0.14 GHz (1.8%) |
| Resonance shift (FDTD) | +0.18 GHz (7.3 GHz mode), +0.19 GHz (12.9 GHz mode) | +0.14 GHz (1.8%) |
| Change in resonance depth | 21.8 dB (3.85 GHz) | 8.3 dB |
| Peak |Δ|S11|| | 21.9 dB at 3.85 GHz | 19.2 dB at 7.88 GHz |
| Peak |Δ|S11|| (FDTD) | 9.7 dB at 13.1 GHz | 7.1 dB at 7.86 GHz |
| Spectrum with |Δ|S11|| > 3 dB | ≈1.4 GHz in two windows (3.71–4.32, 11.59–12.35 GHz) | ≈0.49 GHz in one window (7.68–8.17 GHz) |
| Spectrum with |Δ|S11|| > 3 dB (FDTD) | ≈3.8 GHz in three windows (3.66–4.10, 6.82–9.58, 12.71–13.46 GHz) | ≈0.5 GHz (7.56–8.34 GHz) |
| Simulation frequency step | 47.5 MHz | 10 MHz |
Table 4.
Comparison with recently reported breast-sensing antennas.
| Ref. | Antenna / substrate | Size (mm2) | Band (GHz) | Gain (dBi) | Detection evaluation |
|---|---|---|---|---|---|
| [8] | Antipodal Vivaldi / FR4 | 34.6 × 33 | 3.6–13 | 9.3 | Radar imaging, measured hemispherical phantoms |
| [9] | Side-slotted Vivaldi array / RT5870 | 51 × 42 | 2.8–7.0 | n.r. | Imaging, measured heterogeneous phantoms |
| [10] | Bulb-shaped monopole / RT5880 | 24 × 20 | 3.49–14.6 | 6.2 | S11, S21 change, layered breast model |
| [12] | Flexible monopoles (vest) | 30 × 20 to 40 × 40 | UWB and 2.45 | n.r. | Channel change, measured gelatin phantoms, 1 cm tumor |
| [14] | 2 × 2 array + metasurface / FR4, RO3003 | 47.06 × 38.62 (element) | 2.4 | 4.0 | Δ|S11| ≈ 11 dB (sim.) |
| This work | UWB circular patch / FR4 | 30 × 30 | 3.56–14.73 | 3.5 | Δ|S11| = 21.9 dB (HFSS), 9.7 dB (FDTD) |
| This work | NB circular patch / FR4 | 30 × 30 | 7.64–7.96 | 3.7 | Δ|S11| = 19.2 dB (HFSS), 7.1 dB (FDTD); 140 MHz shift |
n.r.: not reported.
Disclaimer/Publisher’s Note: The statements, opinions and data contained in all publications are solely those of the individual author(s) and contributor(s) and not of MDPI and/or the editor(s). MDPI and/or the editor(s) disclaim responsibility for any injury to people or property resulting from any ideas, methods, instructions or products referred to in the content. |
© 2026 by the authors. Licensee MDPI, Basel, Switzerland. This article is an open access article distributed under the terms and conditions of the Creative Commons Attribution (CC BY) license.
Copyright: This open access article is published under a Creative Commons CC BY 4.0 license, which permit the free download, distribution, and reuse, provided that the author and preprint are cited in any reuse.