

Submitted:
06 November 2026
Posted:
06 November 2026
You are already at the latest version
Abstract
High predicted target compound content does not ensure that an extraction condition will also meet composition requirements. This retrospective benchmark tested whether composition screening increased successful recommendations compared with selection based on predicted content alone. The evidence base included 39 datasets from 28 studies, with separate extensions. Within datasets, polynomial regression, Gaussian process, and tree ensemble models predicted component responses at held-out measured conditions. Both selection rules were evaluated against identical training-derived content and panel-share requirements. Attainment was the proportion of evaluation problems yielding a successful recommendation. Across seven original primary datasets, the median-share constraint increased attainment in only three of 35 focal dataset–model comparisons on common sets, by at most 1.4 percentage points. In grape pomace, reduced quadratic regression gained eight successes through candidate switching but lost 60, including 45 through additional abstention. Medicinal plant evidence meeting primary-analysis criteria was limited to saffron and sage herbal dust, with source-specific qualifications. These findings support jointly evaluating attainment, coverage, conditional violation rates, and model availability. By distinguishing unsuitable recommendations from missed suitable conditions, the benchmark supports comparison of selection strategies and prioritization of extraction conditions for prospective validation across independent batches, informing ingredient and process development for industrial applications.
Keywords:
fruit by-products
; medicinal plant residues
; extraction condition selection
; composition constraints
; machine learning
; response surface methodology
; retrospective benchmarking
; joint target attainment
1. Introduction
Fruit peels, pomaces, and press cakes contain phenolic compounds that can be recovered as potential ingredients, providing a route to the valorization of processing by-products [1,2,3]. Examples include hesperidin and narirutin in citrus residues [4,5,6], phloridzin and phloretin in apple pomace [7,8], and flavan-3-ols, phenolic acids, ellagitannins, and anthocyanins in other fruit by-products [9,10,11,12,13,14,15,16]. Extracts from fruit by-products have been investigated as antioxidant ingredients in foods [17,18,19], while their bioactivity and biocompatibility have also been evaluated for potential cosmetic applications [20,21]. The suitability of these by-products for ingredient production also depends on tissue identity, postharvest condition, and stabilization history [22]. Steam distillation of medicinal and aromatic plants also produces solid residues containing recoverable phenolic compounds, including rosmarinic acid, carnosol, and carnosic acid in rosemary and Greek sage [23,24]. Saffron processing likewise generates floral by-products after stigma removal, retaining individually measurable anthocyanins and flavonol glycosides [25,26]. Published profiles also report individual ginsenosides in red ginseng marc after hot-water extraction [27]. These applications motivate extraction strategies that consider the identity and relative amounts of the compounds recovered together.
Developing such extracts as ingredients requires defining both the desired target-compound content and the composition relevant to the intended application. Chemical profiling and marker-based characterization provide a basis for defining extract specifications, while suitability for food applications requires further validation in the intended matrix [28,29]. Extraction conditions can affect individual constituents differently [11,12,15,30,31]. Maximizing target content therefore need not produce the desired relative composition. Here, panel share expresses the target response as a proportion of the summed responses in a specified analytical panel. Its interpretation depends on which components are included and the basis used to report their responses. Quantitative comparisons also require attention to calibration and compound-specific analytical responses [32,33].
Response surface methodology (RSM) and machine learning (ML) have been compared for modeling extraction responses and identifying favorable operating conditions [34,35,36]. Predictive accuracy measures agreement with observed responses, whereas decision quality concerns whether the selected conditions meet the intended requirements [37,38,39,40,41]. Lower average prediction error therefore need not lead to better condition selection [42]. For extraction-condition selection, an error near a content or panel-share threshold can admit an unsuitable candidate or exclude a suitable one, even when average prediction error is low [43]. Confirming a proposed optimum establishes its performance under the tested conditions [44]. A distinct question is how often a procedure selects suitable conditions across different training and candidate sets. Addressing that question requires repeated, controlled comparisons against common measured requirements [45,46,47].
A predictive model estimates component responses, whereas a selection rule determines which candidate, if any, to recommend [37,48,49]. Here, the amount-only and composition-constrained rules use identical predictions, candidate sets, ranking procedures, and minimum target-content requirements. The composition-constrained rule adds a minimum predicted panel share, but both rules are evaluated against the same measured content and panel-share requirements. If no candidate satisfies the predicted requirements, the rule withholds a recommendation. Prediction errors can therefore exclude conditions that would meet the measured requirements [43]. Selective prediction evaluates errors among accepted predictions together with coverage [50,51,52]. In this benchmark, coverage is the proportion of evaluation problems receiving a recommendation, and joint target attainment is the proportion yielding a recommendation that meets both measured requirements. The conditional violation rate is the proportion of recommendations that fail at least one requirement. A low conditional violation rate alone does not establish a higher frequency of successful recommendations.
Published experimental datasets allow recommendations to be evaluated against measured outcomes for both selected and unselected candidates [45,53,54]. This makes it possible to distinguish unsuitable recommendations and missed suitable alternatives from problems in which no candidate meets both requirements. Reusing the same records also permits paired comparisons of models and selection rules within each dataset [45,53]. Selection performance is one part of ingredient development. Extraction conditions must also be considered alongside product specifications and downstream separation, concentration, drying, and formulation [55,56]. Studies that measure extraction responses together with time and energy illustrate a complementary stage of process assessment [57,58]. Practical process advantages cannot be inferred from chemical selection alone. Reliable reuse requires preserving units, reporting bases, and panel definitions. Repeated measurements at the same factor setting must remain in the same split, and candidate responses must be withheld from model fitting, tuning, target setting, and selection [46,59]. Shared data and code support reproducible comparisons [46,54].
This study evaluates how model choice and a composition constraint affect the selection of measured extraction conditions that meet joint content and panel-share requirements. The retrospective benchmark compares polynomial response surface models with established ML procedures using 39 datasets from 28 studies, with separate analyses of Magnolia residues, sage herbal dust, and three additional rosemary extraction blocks from one study. The seven original primary datasets provide the main paired comparisons. Among the medicinal plant sources, saffron (D33) and sage herbal dust (D41) meet the criteria for primary-compatible evidence with their documented source qualifications. The remaining medicinal plant datasets are evaluated separately as secondary evidence. Models are fitted within datasets, and held-out candidate responses are used only to score recommendations. The analyses distinguish successful candidate switches, lost suitable recommendations, abstention, unavailable fits, and problems with no feasible candidate, and examine how panel definitions and reporting bases change the evaluation objective. By linking model evaluation to the measured chemical suitability of recommended conditions, this benchmark provides a reproducible basis for comparing selection procedures and prioritizing extraction conditions for experimental validation and ingredient development.
2. Materials and Methods
2.1. Study Design and Data Sources
Published experimental measurements were reanalyzed to compare extraction conditions recommended from predictions for held-out candidates. Within each dataset, comparisons of models and selection rules used the same training conditions, candidate conditions, and joint evaluation requirements. The estimand was the proportion of configured within-source selection problems yielding a recommendation that met both measured requirements, conditional on the specified comparison set and analytical panel. Measurements for unselected candidates allowed missed suitable alternatives to be distinguished from problems with no feasible candidate. Established algorithms were fitted separately within each dataset; no models were transferred between sources, and no new laboratory experiments were performed. The analysis plan and prior exposure to data and results are described in Section 2.8.
Eligibility screening focused on experimental designs linking measurements of at least two individual compounds to multiple extraction conditions. Designs reporting a defined compound-group sum together with an additional individual compound were also considered as secondary evidence. Assessment covered the traceability of units and reporting bases, the number and structure of unique conditions available for the intended comparisons, and documented terms for data reuse. Group definitions, compound sums, calibration methods and bases, source uncertainties, and design characteristics were recorded to distinguish primary from secondary evidence and guide interpretation (Section 2.2). Studies reporting only total phenolic content or antioxidant assays, individual compounds only at an optimized condition, or model predictions without corresponding experimental measurements were ineligible.
For medicinal and aromatic plants, the process generating the residue and subsequent stabilization were documented when available; missing details were recorded as source limitations. Unprocessed plant materials were not included solely because the species was medicinal. Eligibility was distinguished from compatibility with the existing modeling protocol and from completion of model evaluation. The source registry records queries, access routes, screening decisions, and unresolved issues. Studies remained unresolved candidates when unavailable full texts or supplementary files prevented an eligibility assessment.
Bounded searches of public sources were conducted on October 12, 15, 16, and 17, 2026 (Korea Standard Time). Queries combined terms for residues, extraction methods, experimental designs, and individual-compound measurements. Earlier searches covered web search results, publisher articles and supplementary files, the Directory of Open Access Journals (DOAJ), PubMed, repositories, and reference lists. Google Scholar searches were followed by Web of Science Core Collection searches on October 17; Scopus was not searched. The historical targeted registry was separate from the original benchmark search and contained 67 candidate papers before a further targeted search added 55 records (52 papers and three theses). These counts were separate from the later Scholar–Web of Science integration. Sixteen fixed Web of Science queries yielded 1,753 query occurrences before deduplication. Google Scholar counts refer to identifiable acquired records, not approximate platform totals.
Queries, settings, acquired record ranges, and screening decisions are documented in Table S1 and Supplementary Methods Sections S1, S17, and S18. Sections S9–S13 describe extension datasets and source qualifications. Section S17 preserves the earlier bounded follow-up, whereas Section S18 documents the later integration, newly available evidence, and unresolved access items. Earlier source qualifications remain in Sections S10, S12, and S15. The searches were intended to assemble an auditable benchmark of suitable datasets and did not establish exhaustive literature coverage.
Full texts and available supplementary materials for previously identified studies were obtained or reexamined on October 18, 2026 (Korea Standard Time). This update concerned source acquisition and verification, not a new dataset search. A rosemary study provided three matrices of individual-compound concentrations across extraction conditions, one per extraction method; these supported separate secondary analyses [60]. A sage study using subcritical water extraction reported extraction yield, total phenolic and flavonoid contents, and antioxidant activity, but its full text lacked the individual-compound measurements across conditions required for the benchmark and was excluded [61]. Supplementary-material availability could not be confirmed from its article webpage. Supplementary data from the sage supercritical fluid extraction study and the reacquired full text of the red ginseng residue study were checked against the existing D41 and D38 records, respectively (Section S19).
2.2. Datasets and Data Preparation
Original benchmark (D1–D22)
The original benchmark comprised 22 datasets from 18 published studies, classified by source and design characteristics (Table 1; Table S2). The seven primary datasets (D1, D2, D5, D7–D10) reported target-compound amounts per unit mass of dry material or concentrations in extracts, used authentic standards for individual compounds, and included continuous experimental factors and at least 13 unique extraction conditions [4,5,6,9,10,62,63]. Primary classification indicated compatibility with the primary-analysis criteria, not complete analytical validation. Source limitations and uncertainties were retained. In D9, two epicatechin values exceeded the reported detection limit but fell below the quantification limit; both were retained as reported (Table S2).
The 15 secondary datasets were retained with specified limitations or methodological considerations: unresolved source normalization (D3) [7]; assay-equivalent quantification (D4, D11, D14) [13,64,65]; a defined compound-group sum in the panel (D12, D13) [11]; hydrolysis or chemical conversion (D6, D17, D18) [14,66,67]; a dried-extract basis or extract concentrations combined with small or grid designs (D15, D16, D19) [15,68]; an incomplete grid (D20) [16]; or a categorical solvent factor (D21, D22) [12]. Each of the pairs D9/D10, D12/D13, D15/D16, and D21/D22 shared a source study and material provenance and was counted as one study. Available records did not establish the number or independence of material batches within these pairs.
Source verification and condition-level preparation
The source audit distinguished direct checks against original tables, evidence from earlier direct checks with verified file links and coverage, transcription-to-input checks, computational reproduction, and unresolved source information (Supplementary Methods, Section S13). Reports of earlier separate transcription passes were not taken as evidence that every source value had been independently verified. Generative AI assistance is disclosed in the Acknowledgments. Reporting discrepancies and their treatment were documented in the source registry, while original values were preserved in the source records. For D9 and D10, values were obtained from the original authors’ publicly available Zenodo CSV file [63], retained at the supplied precision, and cross-checked against the published table [10]. Reported means and standard deviations were preserved; individual replicate observations were not reconstructed from these summaries. Explicitly reported nondetects were coded as zero for calculation and flagged. This convention did not imply a true concentration of zero, and no unreported detection limits were assumed.
Within each dataset, runs with identical factor combinations were grouped, and each response was averaged arithmetically to obtain one response vector per unique extraction condition. Each unique condition received equal weight in model fitting. For D1, recovery percentages were converted to mg/g of dry pomace using the initial hesperidin and narirutin contents reported in the source. D2 retained the reported mass basis of peel remaining after supercritical CO2 extraction. No other response units were converted in the original benchmark, and extract concentrations were not converted to recovery per unit mass of raw material.
One D21 run was excluded before modeling because the reported means for 16 of its 18 analytes matched a row in the ultrasound extraction block of the same article; only myricetin and the quercetin derivative differed. These matching means were recorded as a source-reporting concern, not as proof of duplicated experiments. Both the disputed run and the ultrasound block remained excluded from the reference analysis. The sensitivity analysis of the disputed D21 row is described in Section 2.7.
Extensions within the established collection (D23–D39)
The first extension added five datasets from three studies, comprising 57 unique extraction conditions (Table S12) [69,70,71]. D23 contained 40 records from a two-block olive-pomace design, yielding 15 unique conditions after identical factor combinations were grouped. Responses were reported per mass of extract, and the assignment of calibration standards to individual compounds was incompletely documented. D24 contained 17 rows and 15 unique grape-pomace conditions and met the original criteria for primary evidence, with source-reporting qualifications retained. D25–D27 were three nine-condition citrus-peel grids from one study and were classified as secondary evidence because of their size and reporting qualifications. These separate datasets did not add training conditions to D1–D22. Their roles, targets, and panels were fixed before extension performance was examined. All candidate combinations were evaluated with the existing model settings and selection rules, using three candidates for D23/D24 and two for D25–D27. Original and extension results were reported separately.
The second extension included five datasets from two studies of post-distillation solid residues: rosemary ultrasound-assisted extraction (UAE), microwave-assisted extraction (MAE), and accelerated solvent extraction (ASE; D28–D30), and Greek sage MAE and UAE (D31–D32) [23,24]. The materials underwent pilot-scale steam distillation followed by drying and milling. Each rosemary design contained 15 rows and 13 unique conditions; each sage design contained 27 rows and 25 unique conditions. The five datasets therefore comprised 99 reported rows and 89 unique conditions. Both studies quantified rosmarinic acid, carnosol, and carnosic acid against their respective authentic standards. Because responses were expressed in mg/g of freeze-dried extract, these datasets were secondary evidence in the baseline analysis. A later sensitivity analysis used extraction yields to derive amounts per mass of starting residue, as defined by each source (Section 2.7). Each study contributed one group with shared source material, irrespective of the number of extraction methods. Source-table transcriptions were compared with retrieved originals in separate automated review passes, and responses at identical settings were averaged before splitting.
The source registry retains a malformed rosemary extraction-yield entry and an inconsistent sage solvent-to-solid ratio unit as unresolved reporting issues. The sage study also incompletely documented the relationship between its calibration range and any additional sample dilution; measured values were retained with this qualification. On rechecking, the sage sample masses (0.67, 1.00, and 2.00 g in 20 mL) were consistent with the tabulated solvent-to-solid ratios of 30, 20, and 10 mL/g. This supported the mL/g unit in the methods and factor table rather than the g/L label in one table footnote; factor coding was unchanged. No published correction of the malformed rosemary yield entry was identified.
The second extension also included saffron floral by-products extracted by UAE (D33) from a third study [25]. Tepals and stamens remained after stigma removal. Sixteen reported rows yielded 13 unique combinations of ultrasound amplitude, impulse, and ethanol concentration. Both main-panel compounds were calibrated individually against authentic standards and reported per mass of dry material. D33 therefore met the original quantification and reporting-basis criteria for primary evidence within the expanded material scope, with source-specific qualifications retained. Actual ethanol levels of 0, 50, and 96% were preserved. Values followed the mg/g unit in the supplementary table and main text; a conflicting mg/100 g figure caption was documented without rescaling. A condition reported in both the main text and supplement had identical values, consistent with the mg/g basis. Detection limits were not reported. Together, D28–D33 contributed 115 rows and 102 unique conditions from three studies. Other newly retrieved designs remained in the eligibility register when source interpretation or changes to the modeling protocol were still needed and did not contribute to reported performance estimates.
A further secondary extension included studies of exhausted olive pomace and Opuntia peel [72,73]. The olive study supplied two linked matrices, each containing 17 rows and 13 unique upstream conditions: aqueous recovery of hydroxytyrosol and mannitol (D34), followed by ethanol extraction of maslinic and oleanolic acids from the corresponding residues (D35). Downstream ethanol extraction conditions were fixed, so D35 was modeled using factors from the preceding aqueous extraction. The matrices shared 13 upstream settings and were not counted as 26 independent physical conditions. The Opuntia study supplied UAE and MAE matrices (D36/D37), each with 31 rows and 25 unique conditions. Betacyanins were reported per mass of extract using gomphrenin III calibration and were retained as secondary evidence. The tabulated UAE temperature of 5 °C was preserved despite a conflicting value of 3 °C in the methods. Identical MAE response profiles at distinct conditions were retained with a source-reporting qualification. The four matrices contributed 96 rows and 76 dataset-specific unique-condition entries; shared source material was documented separately.
The red ginseng marc dataset (D38) came from a separate study [27]. The marc remained after hot-water extraction, and dimethyl ether extraction was evaluated using a face-centered central composite design with temperature, pressure, and time. Seventeen rows, including three technical center-point runs, represented 15 unique conditions. The source reported 12 ginsenosides in mg/g of dried marc and individual calibration equations. These features initially supported classification as compatible with the primary-analysis criteria in the frozen analysis. However, calibration inconsistencies and missing dilution information prevent confirmation of the quantitative basis. D38 is therefore retained only as a secondary sensitivity analysis with an unresolved quantitative basis. Detection limits and paired analytical replicates also remain undocumented. Reported zeros were preserved without implying confirmed absence or replacing unreported measurements. The reported total was retained for provenance but was not added to the component columns. Original values and previous D38 outputs were preserved; the current restriction concerns their interpretation (Section 3.5).
A separate extension used a saffron processing-waste dataset (D39) that differed from D33 in publication, research group, and reported raw-material origin [26]. Tepals collected at a processing plant immediately after manual stigma separation were freeze-dried, then extracted by pressurized liquid extraction (PLE; 120 °C, 10 min) or batch stirred-tank extraction (80 °C, 180 min), with or without 15 min ultrasonication pretreatment for the latter. Solvents were water or 1 or 5% (w/v) citric or lactic acid, at a liquid-to-solid ratio of 40 mL/g. Each of the 15 reported combinations of mode and solvent was a unique condition. Extraction mode and acid identity were treated as nominal factors without ordinal coding. Mode was represented by two binary process attributes (PLE versus stirred-tank extraction, and ultrasonication pretreatment). Solvent composition was represented by citric and lactic acid concentrations, with both set to zero for water. Four flavonol glycosides were reported individually per mass of dry material. However, the source listed three standards for seven quantified glycosides and referred to an earlier publication for calibration details; D39 was therefore secondary evidence.
D39 evaluation had been deferred until a protocol for nominal factors was available. That protocol was frozen after source values and earlier benchmark results had been viewed; this was an analysis freeze, not preregistration or external validation. Before the freeze, which included input and code hashes, all 240 values in the two source composition tables (210 means and standard deviations for seven glycosides and 30 reported-total values) were re-extracted from the archived publisher page using separately written code and matched the archived transcription.
Separate analyses of additional residue datasets (D40–D44)
A targeted source check recovered the previously inaccessible supplementary design table for Magnolia officinalis residual waste biomass (D40) [74]. Its 46 rows represented 41 unique combinations of liquid-to-solid ratio, hydrogen-bond donor-to-acceptor ratio, water content, temperature, and time, after six repeated center-point rows were grouped. Magnolol was designated as the benchmark target and honokiol as the companion compound, although the source targeted both. The reported total was excluded to prevent double counting. Authentic standards were specified, but the residue-generating process, dry-matter correction, calibration ranges, dilution schedule, and paired raw replicate measurements were not established for the supplier-provided material. The reported mg/g raw-material basis was retained. D40 was included only as a separate secondary extension with these qualifications and did not increase the number of medicinal-plant studies compatible with primary-analysis criteria. The source audit and analysis amendment were recorded before model evaluation.
A separately specified supercritical fluid extraction (SFE) analysis of sage herbal dust (D41) used 17 rows representing 15 unique combinations of pressure, temperature, and CO2 flow [75]. Responses from three center-point rows were averaged, with equal weight assigned to each unique condition. Six individually calibrated monoterpenes were modeled on the reported basis of mg/100 g dry herbal dust: limonene, eucalyptol, α-terpineol, carvacrol, camphor, and α-thujone. Eucalyptol was selected as an illustrative target before the new evaluations, with its share calculated relative to the sum of these six responses. The reported monoterpene total, conventional extraction controls, and predicted optimization solutions were excluded from the panel and measured design. This target and panel share did not define purity or safety specifications. All 455 held-out triples were evaluated using the ten established model configurations and a multilayer perceptron (MLP) with three fixed random seeds, training-derived amount and share thresholds, and the existing selection rules.
The D41 source audit and earlier benchmark results were known before the dated analysis amendment, but no D41 comparison outcomes had been computed. Source qualifications include reuse of the earlier 2017 design and yield data, unresolved independence of material lots, and a discrepancy in the reported aggregate (Section S18; Table S26). Supplementary Table S1–S3 from the source, acquired on October 18, 2026, contain relative GC–MS profiles and predicted optimization solutions; they neither alter the six calibrated responses nor add observed runs. Differences in terpineol labels and ambiguous profile notation remain unresolved (Section S19).
The newly acquired rosemary study [60] supplied ASE, UAE, and SFE blocks designated D42, D43, and D44, respectively. Hydrodistillation residues were dried at 45 °C to less than 7% moisture and milled to less than 1 mm. The respective 17, 17, and 30 rows represented 13, 13, and 25 unique factor combinations after repeated center-point rows were grouped. Carnosol, carnosic acid, and rosmarinic acid were quantified against their respective standards and reported in mg/100 mg of extract. The blocks came from one study, and the number and independence of material batches were not established. They remained secondary evidence because responses were expressed per mass of extract. Yields were available only at optimized conditions, so amounts per mass of starting residue were not derived for individual conditions. Denominators for the previously reported D1–D39 analyses and separate D40 and D41 analyses were retained.
2.3. Target Responses and Composition Criteria
Response definitions and thresholds
The target compound or compound sum was selected with reference to the source study before the corresponding benchmark analysis. Target and panel definitions specified the benchmark objective and did not necessarily reproduce the source study’s extraction objective. For each condition, the target response A was the sum of responses yj in the target set T. The panel share C was A divided by the sum of responses in the analytical panel P, which included T (Equation (1)). The same definitions were applied to measured and predicted responses.
For each main evaluation problem, the minimum target amount or concentration was the 60th percentile of measured A among the training conditions, calculated by linear interpolation. The minimum panel share was the median of defined, measured C values in the training set; the 25th and 75th percentiles were examined in sensitivity analyses. A candidate met the joint requirements when its measured target response and panel share were both at or above their respective thresholds. These thresholds were illustrative benchmark requirements, not product specifications, and did not assess consistency around a target composition or across material batches. In the analysis of training budgets with fixed evaluation requirements, thresholds were calculated once from all noncandidate conditions and held constant across budgets (Section 2.7).
Panel share was undefined when its denominator was at or below the dataset-specific numerical floor recorded in the input manifest. These floors were numerical safeguards, not analytical detection or quantification limits. Negative predicted component responses were clipped to zero before A and C were calculated, and clipping was recorded. An undefined predicted share made a candidate ineligible under the composition-constrained rule. A candidate with an undefined measured share failed the joint requirements, but the evaluation problem was retained.
Dataset-specific targets and panels
For the seven original primary datasets, each panel comprised the target compound and one other individually quantified compound (Table 1). In D7, the panel contained hesperidin and limonin, the only other individually quantified compound in the source study. The index was therefore H/(H + limonin), where H denotes the hesperidin response, and expressed hesperidin’s share of their combined mass. Secondary panels retained their qualifications concerning calibration and compound-group sums, including assay-equivalent responses in D4 and the reported flavan-3-ol group sum in D12/D13. The D12/D13 study also used calibration curves for structurally related compounds when authentic standards for the compounds of interest were unavailable [11]. Shares based on compound-specific mass measurements represented relative mass within the specified panel; shares based on assay equivalents or surrogate calibration were indices on those reporting bases. Neither represented total extract purity. Responses were not pooled across studies. Alternative panels are described in Section 2.7.
For D28–D32, rosmarinic acid was an illustrative common target within a panel of rosmarinic acid, carnosol, and carnosic acid. Its share was calculated relative to the sum of these three responses on the same extract-mass basis. This choice specified a benchmark preference for relative composition; it did not imply that the source studies prioritized rosmarinic acid over the accompanying diterpenes or regarded those compounds as impurities. The target and panel were recorded before the corresponding held-out evaluations.
For D33, the target was kaempferol-3-O-sophoroside, paired with delphinidin-3,5-di-O-glucoside in the main panel. These were the two individual responses optimized in the source study [25]. Preference for a higher target share was specific to this benchmark; the source study optimized both compounds. A seven-compound sensitivity panel additionally included petunidin-3,5-di-O-glucoside, delphinidin-3-O-glucoside, petunidin-3-O-glucoside, quercetin, and kaempferol, with source qualifications retained. Their inclusion was supported by corresponding authentic standards and complete reported means. Isorhamnetin-3-O-glucoside was excluded because censoring information for nondetects was unavailable. Glycosides quantified using surrogate calibration, grouped peaks, and overlapping totals were also excluded. The reported kaempferol value for 7UAE, 0.05 ± 0.03, was retained, and the conflicting mg/100 g figure caption was not used to rescale the mg/g data. Eligibility for the expanded panel was fixed before its evaluation results were inspected. Both panels were retained.
The additional fruit panels were fixed before held-out performance was computed. D34 paired the hydroxytyrosol target with mannitol, explicitly combining a phenolic compound and a polyol. D35 used maslinic acid as the target within a panel of maslinic and oleanolic acids. D36/D37 used betanin as the target within a panel of seven reported betacyanin peaks, all quantified against the same surrogate standard. Source values were preserved without combining overlapping group totals or treating companion compounds as impurities.
For D38, which was retained only for secondary sensitivity analysis because its quantitative basis remained unresolved (Section 2.2), Rg3 was selected because the source identified it as the predominant ginsenoside in dimethyl ether extracts [27]. The panel comprised 12 individually reported ginsenosides: Rg1, Re, Rf, Rg2, Rh1, Rb1, Rc, Rb2, Rd, Rg3, Rk1, and Rg5. The source optimized total ginsenoside content and other extraction responses. Preference for Rg3 within this panel was a separately specified benchmark objective. The target and panel were fixed before D38 held-out performance was computed.
For D39, kaempferol-3-O-sophoroside was selected because the source identified it as the most abundant flavonol glycoside [26]. The panel comprised the four individually reported compounds in the source’s flavonol table: kaempferol-3-O-sophoroside-7-O-glucoside, quercetin-3-O-sophoroside, kaempferol-3-O-sophoroside, and kaempferol-3-O-glucoside. The reported total and separately tabulated anthocyanins were retained only for provenance. The source compared extraction techniques and solvents without optimizing this share. Preference for a higher target share was a benchmark objective fixed before held-out performance was computed.
For D42–D44, the target was the sum of individually measured carnosol and carnosic acid, consistent with the source study’s optimization objective [60]. The denominator included carnosol, carnosic acid, and rosmarinic acid once each. The source column labeled “C+CA” (carnosol plus carnosic acid) was retained for audit but excluded from model inputs. In ASE row 3, the printed aggregate was 11.9 mg/100 mg extract, whereas the printed component values summed to 10.96 mg/100 mg extract. The individual values were retained without assuming which entry was incorrect. An amendment recorded before analysis specified a sensitivity analysis excluding this row. The target sum was a derived response, not a fourth measured analyte or a correction to the printed aggregate. These shares represented neither total extract purity nor recovery from the starting biomass.
2.4. Held-Out Evaluation and Selection Rules
Candidate sets and paired evaluation
A retrospective held-out design evaluated selection among measured extraction conditions. In the original benchmark, each main problem reserved three unique conditions as candidates when the dataset contained at least 13 unique conditions, or two when it contained 9–12 (D15, D17, D18, and D19). All remaining conditions were used for training. Two candidates preserved more training conditions in smaller datasets while retaining a choice between alternatives. Repeated runs at identical factor settings were grouped before splitting (Section 2.2), preventing the same condition from appearing in both sets. All possible candidate sets were evaluated when their number was at most 500; otherwise, 500 distinct sets were sampled uniformly without replacement using seed 20261012 to limit computation. Identical training and candidate sets were used across models and rules. Candidate measurements were withheld from fitting, tuning, threshold calculation, and model-based selection and were used only to evaluate recommendations and reference performance retrospectively.
Selection rules and reference procedures
The amount-only rule selected the candidate with the highest predicted A among those meeting the predicted amount or concentration threshold (Section 2.3). The composition-constrained rule used the same predictions, ranking criterion, and amount threshold, but also required a defined predicted panel share C at or above its threshold. A rule abstained when no candidate met its predicted requirements. Exact ties in predicted A were resolved by the lowest condition identifier. Both rules were scored against identical joint requirements using held-out measurements, isolating the effect of the rule while holding the evaluation criteria constant. With the model, candidates, and thresholds fixed, adding the composition constraint could change the selected condition or lead to abstention, but could not increase coverage. When both rules recommended a condition, the constrained choice could not have a higher predicted A than the amount-only choice; its measured A could be higher or lower.
A uniform random-choice reference gave every candidate equal probability and always recommended one condition (coverage = 1). Its expected success probability was calculated exactly as the fraction of candidates meeting both measured requirements in each problem. A coverage-matched random reference made the same uniform choice only in problems receiving a recommendation from the evaluated model and rule, and otherwise abstained. It therefore compared candidate selection within the same set of recommended problems. For both references, expected attainment was averaged over all problems in the relevant comparison set, assigning zero success probability to abstentions. The oracle reference equaled 1 when at least one candidate met both measured requirements and 0 otherwise. Its mean provided the upper bound on joint target attainment for the available candidate sets.
These references were retrospective comparators and did not inform model-based selection. The coverage-matched reference was conditional on the problems in which the evaluated model and rule actually recommended a condition. Uniform selection probabilities did not depend on candidate responses; measurements were used only to calculate expected scores. The oracle used measured feasibility to define the best attainable outcome. Random-reference scores were exact expectations, requiring neither an additional random seed nor simulation and thus introducing no Monte Carlo error from random-choice simulation.
Evaluation of the extensions
D28–D33 used the existing model settings, selection rules, and procedure for deriving amount thresholds from training data, with panel-share thresholds at the 25th, 50th, and 75th percentiles. All 286 three-candidate combinations were evaluated for each rosemary dataset and the saffron UAE dataset. For each sage dataset, 500 distinct triples were sampled using seed 20261012. D28–D32 were excluded from analyses of alternative panels, training budgets, six-candidate sets, additional seeds, and near ties. The D33 panel analysis is described in Section 2.3. Common-set and all-attempted results for D28–D33 were reported separately from the original benchmark and earlier fruit by-product extension.
D34–D38 used the ten established model configurations with corrected ridge preprocessing, both rules, and panel-share quantiles of 0.25, 0.50, and 0.75. Each problem held out three candidates: all 286 combinations were evaluated for each of D34 and D35, all 455 for D38, and 500 distinct sets for each of D36 and D37 were sampled using seed 20261012. These 2,027 problems were evaluated separately from earlier cohorts. Numerical denominator floors were 0.005 in the respective response units for D34, D35, and D38, and 0.05 for D36/D37. These floors reflected stored numerical precision, not analytical detection limits. Model settings and tuning procedures were unchanged, and no alternative-panel, additional-seed, or prospective validation analyses were added. D38 remained restricted to secondary sensitivity analysis because its quantitative basis was unresolved (Section 2.2).
D39 used the same ten model configurations, rules, and panel-share quantiles, evaluating all 455 three-candidate combinations. Its numerical denominator floor was 0.005 mg/g. With 12 training conditions, ordinary least squares (OLS) full quadratic (FQ) regression was structurally unavailable. Reduced quadratic (RQ) regression was also unavailable in the five problems that held out all three extracts obtained at one solvent setting: the four remaining solvent settings could not support the five solvent terms, comprising the intercept and the linear and quadratic terms for each acid concentration. In the available polynomial comparators, the two binary process attributes were represented by indicator effects. Acid concentrations had linear terms and, for RQ and ridge-regularized FQ, quadratic terms; pairwise interactions were included only in ridge FQ. These models represented process categories and acid concentrations rather than a response surface over continuous process variables. D39 results were reported separately from earlier cohorts.
D40 was evaluated separately using 500 sampled three-candidate problems, the ten established model configurations with corrected ridge preprocessing, and an MLP with three fixed seeds. Unique conditions were held out as units, and thresholds were derived only from training responses. Both selection rules were scored against the same joint requirements. The 41-condition, 500-problem evaluation remained separate from the established collection (Section S15; Table S24).
D42–D44 used the unchanged ten model configurations and an MLP with three fixed seeds. All 286 held-out triples were evaluated for each 13-condition ASE and UAE block. For the 25-condition SFE block, 500 distinct triples were sampled using seed 20261012, retaining the existing cap of 500 problems per dataset. These 1,072 problems were analyzed separately by block. The sensitivity analysis excluding ASE row 3 evaluated all 220 triples from the remaining 12 conditions and matched them by candidate identifiers to baseline triples not containing the excluded condition. Row exclusion changed both the training set and its derived thresholds, so paired differences reflected both changes. Model availability and the sets underlying common-set and all-attempted summaries were reported separately (Section S19; Table S27).
2.5. Predictive Models
Model scope and input preprocessing
Models were fitted separately within each dataset. Responses were modeled individually, except in the supplementary multilayer perceptron (MLP), whose outputs shared a hidden layer. Comparators were the training-mean baseline; OLS linear, RQ, and FQ regression; ridge-regularized FQ; Gaussian process (GP) regression [76]; random forest (RF) [77]; and extremely randomized trees (ET) [78]. Continuous factors were linearly coded from −1 to +1 using their ranges in the retained design, and binary categorical levels were coded −1 and +1. Coding used factor settings, including candidate settings, but no responses. Additional input standardization for GP, RF, and ET was estimated from training conditions only and applied unchanged to candidates.
Polynomial regression
RQ included an intercept, main effects, and squared terms for factors with at least three levels in the retained design. FQ additionally included all pairwise interactions. Squared terms were omitted for two-level factors, including solvent in D21/D22 and time in D15, because they were redundant with the intercept. OLS required a training design matrix with full column rank and at least one residual degree of freedom, calculated as the number of unique training conditions minus the number of coefficients. Saturated fits were therefore unavailable. Availability was recorded and included in operational summaries (Section 2.6).
For ridge FQ, the penalty was selected separately for each response from {0.001, 0.01, 0.1, 1, 10} by minimizing mean squared error in leave-one-condition-out cross-validation within the outer training set. In each inner fold, nonintercept polynomial features were centered and scaled using only the remaining training conditions; the omitted condition was transformed with those parameters. The intercept was not penalized. After penalty selection, preprocessing and regression were refitted on the full outer training set before candidate prediction. Ridge fitting required at least three training conditions. Fold-specific preprocessing prevented the validation condition from informing centering and scaling [79,80]. The correction to the earlier implementation and its numerical effects are documented in Supplementary Methods, Section S14, and Table S20. Candidate responses were excluded in both implementations.
Gaussian process and tree ensemble models
GP models normalized training responses and used predictive means for selection. The default kernel was a constant multiplied by an anisotropic radial basis function (RBF) kernel, plus white noise. Parameters were estimated by maximizing the training-data log marginal likelihood, with bounds of 0.01–100 for the constant, 0.1–10 for each length scale, and 0.0001–1 for noise, and one optimizer restart. Two prespecified variants used wider RBF bounds (constant 0.001–1000, length scales 0.01–100, noise 0.000001–10; three restarts) or an anisotropic Matérn 5/2 kernel with the default bounds and one restart. For all GP models, initial constant and length-scale values were 1, initial noise was 0.1, and additional diagonal regularization was 10−10. All three configurations were compared without selecting a preferred one from held-out performance.
RF and ET each used 256 trees, a minimum leaf size of one, all input features at each split, and fixed random seeds. Bootstrap sampling was enabled only for RF, and ensemble settings were not tuned. Candidate responses were excluded from all fitting and tuning. Computations used Python, NumPy for OLS and ridge regression, and scikit-learn version 1.8.0 for GP, RF, and ET [81].
Supplementary neural-network comparator
The supplementary MLP used one hidden layer of eight units, tanh activation, squared-error loss, L-BFGS optimization, and L2 regularization with α = 0.01. Limits were 200 iterations and 15,000 function evaluations, with a tolerance of 10−4. Inputs and each response were standardized using only outer training conditions; a scale factor of one was used for a response with zero training standard deviation. Outputs shared the hidden layer. No hyperparameter search, validation-based early stopping, or retry was performed. Seeds 20261012, 20261013, and 20261014 were reported separately, without selecting the best seed or ensembling predictions. These settings defined a limited comparator, not a comprehensive evaluation of neural-network architectures.
Finite MLP predictions were retained and flagged when fitting produced iteration-limit or other convergence warnings. Fits raising exceptions or producing nonfinite predictions were classified as unavailable. Warning-free summaries were reported as a secondary diagnostic alongside all-attempted summaries. The original common set for RQ, default GP, RF, and ET was preserved; the supplementary MLP comparison additionally required available predictions from all three MLP seeds. Excluded problems and model-specific reasons were recorded. Failed or unexecuted fits were distinguished from abstention after a valid fit.
The three MLP seeds used identical candidate splits and differed only in network initialization. For each seed, a post hoc convergence diagnostic first compared MLP and RQ predictions on problems available to both, then restricted both models to the same subset without MLP convergence warnings. Changes in these summaries therefore reflected task-set restriction rather than further optimization. No network was retrained for this diagnostic (Section S16; Table S25).
2.6. Performance Metrics and Comparison Sets
Metrics and denominators
For valid-fit summaries, each model and rule was evaluated over M problems in the specified comparison set. For problem b, Rb equaled 1 if a recommendation was made and 0 otherwise; Sb equaled 1 if that recommendation met both measured requirements and 0 otherwise. R and S were the total numbers of recommendations and successful recommendations. Attainment was S/M, coverage was R/M, conditional success was S/R, and conditional violation (the violation rate) was (R − S)/R (Equations (2) and (3)). Both conditional metrics were undefined when R = 0. Fit failures and structural unavailability were recorded separately. Operational summaries additionally used all attempted problems as the denominator.
For illustration, 30 successful recommendations among 40 recommendations in 100 valid problems give 30% attainment, 40% coverage, 75% conditional success, and 25% conditional violation. These are explanatory values, not additional empirical results. Where at least one recommendation was made, the identity attainment = coverage × (1 − violation rate) was checked numerically. Among problems with valid fits and at least one candidate meeting both measured requirements, failure to obtain a successful recommendation was classified as abstention or an unsuccessful recommendation. Regret was calculated only for successful recommendations as the largest measured A among eligible candidates minus the selected candidate’s measured A. Eligibility for this calculation was based on both measured requirements. Regret retained the dataset’s response units and was not used to rank methods. Prediction errors were descriptive because model availability could change the evaluated problem sets.
Common sets and operational summaries
The main ML–RQ comparisons used problems with finite predictions from RQ, default GP, RF, and ET. In symmetric Box–Behnken designs, holding out the center can make the RQ matrix rank deficient because the sum of squared coded factors is constant across the remaining conditions. These problems were excluded from the common set. Where specified, additional pairwise comparisons used problems available to both models. Table 3 used the same RQ–GP–RF–ET set for every model. Within that fixed set, unavailable fits for additional models contributed no successful recommendations to operational attainment and were not counted as valid abstentions. Separate valid-fit summaries used each model’s available problems.
Across all attempted problems, operational attainment and coverage were S/Nattempted and R/Nattempted, respectively, where Nattempted was the number of attempted problems. Fit failures and structural unavailability remained in this denominator and were recorded separately from abstentions after valid fits. Comparison-set membership, fit validity, and recommendation status were therefore treated as distinct attributes.
Dependence and sampling uncertainty
Overlapping splits were treated as dependent evaluation problems, not independent experiments. Results were summarized by dataset without t tests or confidence intervals assuming independent splits [82]. For all-attempted summaries from sampled evaluation sets, excluding training-budget analyses, Monte Carlo standard errors for attainment and coverage included the finite-population correction. They described variation from candidate-set sampling conditional on the observed data, fitting procedure, and fixed model seed. Earlier sensitivity analyses with additional seeds combined variation from candidate-set sampling and stochastic fitting without separating their contributions. Neither assessment quantified experimental measurement uncertainty.
2.7. Sensitivity Analyses and Post Hoc Diagnostics
Composition thresholds, analytical panels, and model specifications
Sensitivity analyses examined composition thresholds, analytical panels, GP specifications, training-set size, and candidate-set size. Composition thresholds were the 25th, 50th, and 75th percentiles of defined panel shares among training conditions. Expanded panels added gallic acid in D5; cryptochlorogenic acid, neochlorogenic acid, rutin, and kaempferol-3-O-rutinoside in D8; procyanidin C1 in D9/D10; quercetin-3-O-glucoside in D11; cyanidin-3-O-galactoside in D15/D16; hesperidin in D18; rutin in D19; ellagic acid in D20; and procyanidin B2 in D21/D22. The alternative D17 panel retained hesperidin and replaced narirutin with hesperetin-7-O-glucoside and hesperetin. The source supplement reported that procyanidin C1 was quantified using the procyanidin B1 calibration curve [10]; C1 was therefore restricted to sensitivity analyses because its own authentic standard was not used. Source values and panel assignments were unchanged, and current ridge predictions used the corrected preprocessing procedure. Comparisons of the original benchmark panels reused the same component predictions, candidate sets, and target-response thresholds; only panel shares and their thresholds were recalculated. GP variants are described in Section 2.5.
Training budgets, candidate sets, and random seeds
To assess training-set size under fixed evaluation requirements, RQ, ridge FQ, default GP, and RF were evaluated in D5, D7, D12, and D13. For each of the first 100 main evaluation problems, thresholds were calculated once from all noncandidate conditions and held constant across training budgets. Nested training subsets were generated from a seeded permutation: 10, 15, 20, and 22 conditions for D5, D12, and D13, and 10, 15, 20, 25, 30, and 33 for D7. Candidate responses were excluded from threshold calculation. At smaller budgets, the reference set used to define thresholds included responses outside the fitting subset. Thus, the training budget described the number of conditions used for fitting, not all response information needed to define the evaluation requirements. The earlier D5 analysis, in which thresholds were recalculated within each training subset, was retained for RQ and RF.
Candidate-set size was examined for RQ, ridge FQ, default GP, and RF in D5 and D7 using six held-out candidates and 200 sampled problems per dataset. For datasets with sampled main evaluation problems (D5, D7, D12, D13, D21, and D22), RQ, ridge FQ, default GP, RF, and ET were also evaluated with two additional seeds (20261013 and 20261014). These seeds changed both sampled splits and, for stochastic models, fitting randomness. A descriptive leave-one-study-out assessment examined whether qualitative conclusions persisted after omitting each source study in turn (Supplementary Methods, Section S7). No pooled effect estimate or model of transfer across studies was fitted, and no synthetic experimental measurements were generated.
Source-record and reporting-basis sensitivities
The D21 exclusion was examined by conditionally including the disputed row while retaining the 17-condition dataset as the reference. The high-voltage electrical discharge (HVED) row was used exactly as reported (50% ethanol with 1% HCl, 50 Hz, 15 min), including chlorogenic acid, epicatechin, and procyanidin B2 values of 425.42, 30.91, and 37.71 µg/g dry weight, respectively. RQ, ridge FQ with corrected preprocessing, and RF were evaluated with both panels and all three share quantiles. For the original 500 sampled candidate triples, the effect of adding the row to training was evaluated first with the reference thresholds and then with thresholds recalculated from the enlarged training set. A separate exhaustive comparison evaluated all 136 pairs of the 17 reference conditions. Each pair was compared with the same pair plus the disputed row, using the same remaining 15 conditions for training and identical thresholds. This analysis separated the effects of training data, thresholds, and candidate sets without resolving the concern about source reporting (Table S23).
Reporting-basis sensitivity was assessed in D28–D32 by linking the three compound responses to the extraction yield from the same reported run. Each compound mean in mg/g of extract was multiplied by the corresponding yield percentage divided by 100; these products were then averaged across rows with identical factor settings. The resulting values were derived estimates per mass of the starting residue as defined by each source, rather than direct replicate-level measurements, absolute dry-matter recoveries, or recovery efficiencies. Rosemary residues were reported to contain less than 10% moisture and sage residues approximately 10%, but the sources did not establish a common moisture-correction procedure. The ambiguous D28 yield entry “16..9” was not corrected by inference. Its row was excluded only from this sensitivity analysis, leaving 12 unique conditions. Models on the extract and derived residue bases were refitted on the same subset using all 220 three-candidate problems. Three candidates were retained to match the original protocol despite the smaller subset. D29–D32 retained their original condition sets and candidate splits. Derived responses were modeled with unchanged settings and rules for training-derived thresholds. The numerical denominator floor of 0.00005 was distinct from an analytical detection limit. Original extract-basis values and historical results were preserved; current ridge comparisons used the corrected preprocessing procedure.
Source-data diagnostics compared the mean of row-specific concentration–yield products with the product of the corresponding condition means. Variation among rows at repeated factor settings was summarized descriptively for D28–D32 and D34–D37. These rows contained published response means, not recoverable paired raw measurements, so their variation was not used to reconstruct within-sample covariance or confidence intervals for panel shares. The cited LC–MS method for rosemary and sage was retrieved to document calibration and validation information [83]. Differences in sample preparation and analytical settings prevented its precision estimates and detection limits from being assigned to responses in the extraction designs evaluated here.
Post hoc prediction and decision diagnostics
Saved predictions were used to assess sensitivity to numerical tie handling. Selection was repeated separately using a relative tolerance of 10−9 or dataset-specific absolute tolerances equal to half the smallest decimal increment in the stored target-response columns. Eligible candidates within the specified tolerance of the highest predicted A were treated as tied, and the candidate with the lowest condition identifier was selected. The relative tolerance was scaled by the absolute value of the highest eligible predicted A; feasibility thresholds were unchanged. Because stored precision can reflect unit conversion and numerical formatting, absolute tolerances were numerical settings rather than estimates of analytical measurement resolution.
Prediction diagnostics included every held-out candidate occurrence with an available model fit in the main evaluation, including repeated appearances of the same condition. Classification agreement indicated whether predicted and observed panel shares gave the same eligibility classification relative to the composition threshold; undefined shares were classified as failing the threshold. A retrospective majority-class reference assigned the more frequent observed outcome to every occurrence. Correlations used only occurrences with both predicted and observed shares defined. These diagnostics used each model’s available problem set, whereas paired comparisons of selection rules used common comparison sets.
Additional diagnostics related selection-rule effects to measured composition and component prediction errors. Saved component predictions and selection records were taken from the original common comparison sets at the median panel-share threshold (Supplementary Methods, Sections S5 and S8; Table S11). The five focal models (RQ, ridge FQ, default GP, RF, and ET) were examined in the seven original primary datasets and, separately, in D12/D13. Four transitions were distinguished: neither rule recommended a condition, both selected the same candidate, they selected different candidates, or only the amount-only rule recommended a condition. Gains and losses in successful recommendations were decomposed by transition. When both rules made a recommendation, changes in measured target response A, the sum B of the remaining panel responses, and panel share C were examined; candidate switches were reported separately.
Where both observed and predicted shares were defined, errors relative to the composition threshold were examined using the feasibility margin (1 − c)A − cB. Its predicted-minus-observed error was decomposed as , where hats denote predictions and c is the problem-specific share threshold. Undefined shares were recorded separately. These descriptive analyses preserved the original clipping rules, denominator floors, and selection decisions and did not treat repeated candidate occurrences as independent observations.
A fifth transition—recommendation only under the composition-constrained rule—was checked as structurally impossible. With identical candidates, predictions, and amount thresholds, the candidates eligible under this rule are a subset of those eligible under the amount-only rule. Unavailable fits and unexecuted problems were recorded separately. For abstentions, the selected target response, companion response, and panel share were missing, not zero. Assigning a zero success score to abstention did not create a chemical measurement.
2.8. Analysis Plan and Reproducibility
The original plan and subsequent amendments were dated and linked to hashes of the inputs, configurations, and code. Published measurements, earlier benchmark outputs, and source authors’ model statistics had already been inspected; preliminary D15 and D19 tests also exposed held-out results before the original plan was finalized. These records therefore document analysis freezes after prior exposure, not preregistration or external validation without prior exposure. Dataset roles, targets, panels, model settings, evaluation sets, and failure policies were recorded before each corresponding extension. The current method correction and supplementary analyses were specified in a dated amendment before their new outcomes were inspected. Original plans, amendments, exposure histories, and execution states are preserved separately.
The October 18 source-acquisition amendment was recorded after the published data, source-model results, and historical benchmark results had been inspected, but before D42–D44 comparison outcomes were computed. It preserved individual source-reported values and fixed the target, panel, grouping, model configurations, sampling cap, and ASE row-exclusion sensitivity before execution. D41 source inputs and stored decisions were checked and reused; D38 inputs, grouped conditions, and splits were rechecked without refitting. Unchanged historical outputs were preserved. Actual runtime versions, execution dates, warnings, and newly generated versus reused artifacts are recorded separately in the reproducibility package.
Analyses were performed in stage-specific Python environments (3.13.16 for the original analyses and analyses using alternative split seeds; 3.12.14 for subsequent corrections and extensions), using NumPy 2.3.5, pandas 2.2.3, SciPy 1.17.0, and scikit-learn 1.8.0. Selected reproducibility checks were performed in Python 3.12.14; their scope and comparison criteria are documented in the accompanying analysis workbook. Reproducibility records distinguish executed refits from reused predictions for which selection decisions were reconstructed and checked. Categorical fields require exact agreement; representative numerical comparisons use relative and absolute tolerances of 10−8 and 10−10, respectively. Source and code hashes, commands using relative paths, environment specifications, warnings, and execution records are retained by the author. The inner-fold ridge correction and subsequent supplementary evaluations are documented in Section S14, and the matched convergence diagnostic in Section S16.
The source audit separately checked transcription links, condition means, counts of repeated settings, split membership, and thresholds derived from training or reference data (Section S13; Table S19). Direct source checks and inherited checks with verified file links were documented by scope. Agreement establishes consistency within the checked records, not the validity of analytical quantification or independence of material batches.
3. Results
3.1. Evidence Base, Response Characteristics, and Model Availability
The original benchmark included 22 datasets from 18 published studies and 347 unique-condition entries counted within their respective datasets (Table 1; Figure 1; Table S2–S4). Of 400 reported design rows, 399 were retained after one D21 row was excluded because of an unresolved source-reporting concern (Section 2.2). The seven primary datasets contributed 130 condition entries from six studies; the 15 secondary datasets contributed 217 entries and were analyzed separately according to their source and design qualifications. Designs included a 36-condition full factorial design (D7), four-factor Box–Behnken designs (D12/D13), central composite designs (D9/D10), grids, and designs with a categorical solvent factor. D12/D13 shared one source study, as did D9/D10. Some secondary datasets involved hydrolysis or chemical conversion.
The original benchmark and four separately evaluated extensions together comprised 39 dataset matrices from 28 studies, with 726 retained rows and 612 dataset-specific unique-condition entries. These are counts of analysis inputs, not independent physical experiments; D34 and D35, for example, shared 13 upstream settings. Within D1–D39, D33 was the only medicinal plant study that met the individual-calibration and dry-material reporting criteria for primary evidence, contributing 13 conditions with source-specific qualifications. D38 comprised 15 conditions and was retained only as a separate sensitivity case because its quantitative basis remained unresolved. The 15-condition D39 saffron dataset remained secondary evidence.
The recovered D40 supplement added 46 rows and 41 unique conditions from one further study. D40 was evaluated separately because residue generation and quantitative reporting remained insufficiently resolved; it did not add a medicinal plant study meeting the primary-evidence criteria. The subsequently evaluated sage herbal-dust dataset (D41) added 17 rows and 15 unique conditions compatible with those criteria, subject to its source-specific qualifications. The denominators for D1–D39 and the separate D40 analysis were unchanged. D42–D44 added three secondary rosemary datasets from one study, with 64 rows and 51 unique-condition entries counted within the respective extraction blocks. Other archived numerical tables were excluded from model comparisons while questions about source interpretation, censoring, or experimental design remained unresolved.
Target responses and panel shares were associated to different degrees across the primary datasets (Figure 2; Figure S1; Table S4). Spearman correlations across conditions were 0.97 in D1, 0.75 in D7, 0.52 in D8, 0.46 in D10, 0.32 in D5, 0.31 in D2, and 0.16 in D9. These correlations were descriptive because the target response entered both the numerator and denominator of the share. In D7, hesperidin shares ranged from 0.017 to 0.817; one condition (100% ethanol, pH 11, 70 °C) had a reported hesperidin response of 0.003 mg/g. In the secondary datasets D12/D13, shares ranged from 0.988 to 0.994, reflecting the predominance of the reported flavan-3-ol group sum within the specified panel. Based on condition means, gallic acid accounted for 0.60–1.18% of the panel total in D12 and 0.55–0.84% in D13, with amounts of 111.87–237.97 and 114.66–166.09 mg/kg of dry seeds, respectively. These ranges describe its relative and absolute contributions. Their size relative to measurement variability could not be assessed because the source design table provided no condition-specific standard deviations for either response [11].
Source-specific qualifications were retained in the benchmark records (Table S2). In D4, all responses at one condition were reported as zero, making its panel share undefined. The condition remained in the dataset and, when held out as a candidate, failed the measured joint requirements under Section 2.3. D3 had a narrow range of phloridzin shares and an unresolved source normalization basis. Concerns about the reported total in D11, a hesperetin value and compound-group labels in D18, and repeated rutin means in D20 were documented without altering the source-reported values.
Evaluation problems and model availability
The original main evaluation comprised 7,261 held-out problems across 22 datasets. D5, D7, D12, D13, D21, and D22 each contributed 500 sampled candidate sets; all possible candidate sets were evaluated in the remaining datasets. These overlapping problems reused the 347 dataset-specific conditions and were not independent experiments. Model definitions and fitting criteria are given in Section 2.5. Unless stated otherwise, Section 3.2, Section 3.3, Section 3.4 and Section 3.5 concern the ten established model configurations; the fixed-configuration MLP comparison is reported separately in Section 3.6.
Reduced quadratic regression (RQ) availability depended on the training design after candidate conditions were withheld (Table S3). RQ was available in 76.9% of problems in each three-factor, 13-condition dataset (D1–D4, D8, and D14), 88.2% in D5, 89.2% in D12 and D13, 99.3% in D9 and D10, and 99.7–99.8% in D6, D11, D16, and D20. It was available throughout D7, D15, D17–D19, D21, and D22. Under the main holdout scheme, all 66 unavailable RQ fits in each 13-condition Box–Behnken dataset, all 59 in D5, and all 54 in each of D12 and D13 occurred when the center condition was withheld. In the symmetric designs, the sum of squared coded factor values was then constant across training conditions, leaving the RQ design matrix rank deficient. D14 also lost rank when its reported center condition was withheld, although its unequally spaced factor levels did not satisfy this constant-sum identity.
Full quadratic regression (FQ) fitted by ordinary least squares (OLS) was unavailable in the three-factor, 13-condition datasets: ten training conditions for ten coefficients left no residual degrees of freedom. FQ availability was 88.2% in D5 and 98.5% in D9 and D10. Ridge FQ, linear regression, and both tree ensembles were available in every main evaluation problem, and all three Gaussian process (GP) configurations returned finite predictions throughout.
Common comparison sets included only problems with available, finite predictions from RQ, default GP, RF, and ET. They contained 220 of 286 problems in each three-factor, 13-condition dataset; 441 of 500 in D5; 446 of 500 in each of D12 and D13; 452 of 455 in each of D9 and D10; 454 of 455 in each of D6 and D11; and 285 of 286 in each of D16 and D20. All problems were retained in D7, D15, D17–D19, D21, and D22. Candidate feasibility differed between excluded and retained problems in several datasets. In D1, every excluded problem contained at least one candidate meeting both measured requirements, compared with 65.0% in the common set; expected attainment under uniform random choice was 58.6% and 32.3%, respectively. In D5 and D8, the proportion of problems containing a feasible candidate was lower in the excluded sets than in the common sets (54.2% versus 67.3% and 59.1% versus 74.5%, respectively). Common-set comparisons therefore describe performance conditional on model availability. Results over all attempted problems are reported separately (Table S5), with unavailable fits retained in the denominator, assigned no success, and distinguished from abstention by a fitted model.
3.2. Successful Recommendations Lost or Gained Through Composition Screening
Adding the composition constraint increased attainment in only three of 35 comparisons of the five focal models (RQ, ridge FQ, default GP, RF, and ET) across the seven primary datasets (Table 2; Figure 3). The largest increase was 1.4 percentage points for RQ in D2, with four successful recommendations gained and one lost. Ridge FQ in D2 increased by 0.5 percentage points (four gained, three lost), and ET in D8 increased by 0.9 percentage points (six gained, four lost). Among the additional comparators, linear regression in D2 increased by 3.2 percentage points, from 5.5% to 8.6%, but remained below all five focal models. Differences were calculated from unrounded rates. In D1 and D7, changes ranged from −2.3 to 0.0 percentage points, except for GP in D7, which decreased by 4.0 percentage points.
Larger decreases occurred in D5, D8, and the avocado datasets. RQ attainment fell by 11.8 percentage points in D5 (eight successful recommendations gained, 60 lost) and by 20.9 percentage points in D8 (one gained, 47 lost). All five focal models had lower attainment under the composition-constrained rule in D9 and D10, with decreases of 4.2–22.8 and 1.3–17.9 percentage points, respectively. GP, RF, and ET gained no successes in D9. RF attainment in D9 fell from 44.7% under the amount-only rule to 21.9% under the composition-constrained rule, compared with an expected 25.4% under uniform random choice.
Coverage decreased in 34 of the 35 focal comparisons and was unchanged for RF in D1. The nested eligibility sets prevent coverage from increasing, but the frequency and size of the observed decreases were empirical results. Transition analysis separated successes lost through additional abstention from those lost through switching to an unsuitable candidate (Table S11). Losses through additional abstention exceeded losses through switching in 32 of the 35 comparisons. For RQ in D5, the 60 lost successes comprised 45 additional abstentions and 15 switches to unsuitable candidates; other switches gained eight successes. For RF in D9, additional abstention lost 80 successes and switching lost 23, with none gained. Of its 41 candidate switches, 29 selected a condition with a lower measured panel share than the condition chosen by the amount-only rule. These counts describe overlapping evaluation problems, including repeated selections involving the same conditions.
Conditional violation rates changed in both directions. In D2, the RQ violation rate fell from 42.3% to 25.9% as coverage fell from 76.4% to 61.4%; for GP, the corresponding changes were 40.1% to 16.7% and 69.1% to 43.6%. Ridge FQ in D8 also had a lower violation rate (19.6% to 14.0%). In contrast, violation rates increased for every focal model in D9 and D10 except ridge FQ in D10 (87.9% to 87.3%). Examples included RQ in D9 (51.7% to 55.5%), GP in D9 (50.1% to 70.1%), and RF in D10 (70.4% to 91.8%). Under the constrained rule, RF attainment in D10 was 3.1%, below the 10.2% expected for the coverage-matched random reference. A lower conditional violation rate did not necessarily accompany higher overall attainment because screening changed both the problems receiving recommendations and the candidates selected.
A post hoc diagnostic related panel-share classification to the effects of the selection rule (Table S7). Classification agreement was calculated over candidate occurrences with available predictions for each model, whereas changes in conditional violation were calculated on the common comparison sets. Across the 35 focal comparisons, the change in conditional violation (composition-constrained minus amount-only) was negatively associated with classification agreement above the majority-class baseline (Spearman ρ = −0.56). Because these comparisons shared datasets, source studies, and overlapping problems, the association was descriptive and did not validate a threshold for applying the constraint. Exceeding the classification baseline did not ensure a lower violation rate: all five models in D8 exceeded it, but RQ, GP, and RF had higher conditional violation rates under the constrained rule. In D9, predicted and measured panel shares were negatively correlated for GP, RF, and ET (ρ = −0.42 to −0.38).
3.3. Model Performance Under a Common Selection Rule
Model rankings under the composition-constrained rule varied across the primary datasets on the fixed RQ–default GP–RF–ET common comparison sets (Table 3; Figure 4). RQ had the highest attainment in D1 (61.8%) and D2 (45.5%). RF, ET, and default GP attained 59.1%, 56.8%, and 24.1%, respectively, in D1 and 35.0%, 21.4%, and 36.4% in D2. In D5, RF (55.3%), ET (51.5%), and GP (48.3%) exceeded RQ (42.6%) and FQ (33.1%) on the same 441 problems. The RF–RQ difference was 12.7 percentage points: RF alone succeeded in 70 problems, RQ alone in 14, and both models had the same success status in the remaining 357. The ordering of ET and GP in D5 varied across seeds (Section 3.4).

Table 3.
Model attainment under the composition-constrained selection rule in the seven original primary datasets.
Table 3.
Model attainment under the composition-constrained selection rule in the seven original primary datasets.
| Dataset (N) |
Training mean |
Linear | RQ | FQ | Ridge FQ |
GP | GP- wide |
GP- Matérn |
RF | ET | Uniform random |
Oracle |
|---|---|---|---|---|---|---|---|---|---|---|---|---|
| D1 (220) | 0.0 | 60.5 | 61.8 | Unavail. | 54.1 | 24.1 | 39.5 | 23.2 | 59.1 | 56.8 | 32.3 | 65.0 |
| D2 (220) | 0.0 | 8.6 | 45.5 | Unavail. | 12.3 | 36.4 | 36.4 | 38.6 | 35.0 | 21.4 | 20.9 | 49.5 |
| D5 (441) | 0.0 | 45.1 | 42.6 | 33.1 | 27.7 | 48.3 | 31.5 | 48.1 | 55.3 | 51.5 | 31.0 | 67.3 |
| D7 (500) | 44.2 | 56.8 | 60.2 | 59.0 | 60.4 | 60.8 | 60.8 | 61.0 | 59.8 | 61.2 | 39.8 | 77.2 |
| D8 (220) | 3.6 | 50.9 | 35.5 | Unavail. | 53.2 | 45.0 | 44.5 | 45.0 | 45.0 | 49.5 | 38.5 | 74.5 |
| D9 (452) | 0.0 | 23.0 | 25.0 | 14.6 | 8.6 | 17.7 | 14.4 | 17.9 | 21.9 | 21.5 | 25.4 | 56.0 |
| D10 (452) | 0.0 | 11.7 | 8.8 | 10.4 | 5.8 | 15.5 | 16.8 | 12.4 | 3.1 | 7.7 | 26.9 | 56.6 |
Attainment is the percentage of evaluation problems yielding a recommendation that meets both measured requirements: target amount or concentration at or above the training 60th percentile and panel share at or above the training median. Within each dataset, all ten model configurations are evaluated on the same fixed common set of N problems, defined by the availability of RQ, default GP, RF, and ET predictions. This set is not the intersection of available fits for all ten configurations. Unavailable fits for additional comparators remain in N but contribute neither recommendations nor successes and are recorded separately from abstention by a fitted model. Unavail. indicates that FQ was unavailable for every problem in that comparison set. Uniform random gives the exact expected attainment when one candidate is selected with equal probability from the full candidate set in every problem (100% coverage). The oracle gives the percentage of problems containing at least one candidate that meets both measured requirements. It is a retrospective upper bound based on candidate measurements, not a predictor available for prospective selection. GP denotes the default GP configuration. The three fixed MLP seed configurations are reported separately in Table S21 and are not included here. Rankings apply to the tested configurations and common comparison sets and do not establish performance on new material batches. Overlapping evaluation problems are not independent experimental replicates.
Other primary datasets showed different patterns. In the 36-condition lime-peel design (D7), quadratic regression, GP, and tree ensemble models attained 59.0–61.2%, compared with 56.8% for linear regression, 39.8% expected under uniform random choice, and an oracle upper bound of 77.2%. In D8, ridge FQ (53.2%), linear regression (50.9%), and ET (49.5%) had the highest attainment. RQ attained 35.5%, below the random expectation of 38.5%. Ridge FQ exceeded RQ by 17.7 percentage points, with 47 problems successful only for ridge FQ and eight only for RQ. In the avocado datasets, no model exceeded uniform random choice with full coverage. The highest model attainment was 25.0% for RQ in D9, compared with 25.4% for random choice, and 16.8% for GP-wide in D10 (Section 2.5), compared with 26.9% for random choice. The oracle upper bounds were 56.0% and 56.6%, respectively.
Relative performance also depended on the selection rule. On the same common sets, the RF–RQ attainment difference in D5 was 2.3 percentage points under the amount-only rule and 12.7 under the composition-constrained rule. In D8, amount-only differences relative to RQ were +3.2 percentage points for ridge FQ, +9.5 for linear regression, and −7.7 for ET. The default GP–RQ difference in D10 was 13.1 percentage points under the amount-only rule and 6.6 under the constrained rule. All differences were calculated from unrounded rates.
Including all attempted problems changed the relative performance of some models (Table S5). Unavailable fits remained in the denominator without contributing successes and were distinguished from abstention by fitted models. Under the constrained rule, RF attained 57.0% and RQ 47.6% across all 286 D1 problems, reversing their common-set ordering. Across all 500 D5 problems, RF and RQ attained 53.8% and 37.6%, respectively. These results incorporate model unavailability over the full attempted set. Common-set estimates instead condition on the availability of RQ, default GP, RF, and ET; unavailable fits for additional comparators remain in that fixed denominator, as specified in Table 3.
3.4. Sensitivity to Model Settings, Evaluation Design, and Chemical Objectives
GP specification and quadratic regularization
In the original benchmark, changing the GP specification changed the selected candidate or recommendation status in 0–38% of all attempted main evaluation problems under the composition-constrained rule at the training-median share threshold, depending on the dataset and configuration. On the common comparison sets, the effects on attainment varied: GP-wide attained 39.5% in D1 versus 24.1% for default GP, but 31.5% in D5 versus 48.3%. GP-Matérn attained 69.1% in D4 versus 57.7% for default GP and 43.0% in D22 versus 33.8%. At least one kernel-bound warning was recorded in 93% of problem–configuration combinations across the three GP configurations (Table S8). For default GP, the proportion of individual response fits with noise estimates at or near the lower bound ranged from 4% in D9 to 85% in D18. Based on the rounded estimates retained in the fit records, up to 48% of fitted length-scale parameters for default GP (D5) and 46% for GP-wide (D19) were at or near a bound. In D1, default GP predictions had little rank correlation with measured hesperidin responses (ρ = 0.03; Table S7). No GP configuration consistently achieved the highest attainment across datasets.
Ridge FQ was available in every main evaluation problem of the original benchmark. Under the composition-constrained rule on the common comparison sets, its attainment was lower than that of RQ in 15 of 22 datasets, including D2 (−33.2 percentage points), D5 (−15.0), and D9 (−16.4). Ridge FQ exceeded RQ in D8 (+17.7 percentage points), D14 (+7.7), and D18 (+11.1), and differed by no more than 0.5 percentage points in D7, D17, D19, and D21. Leave-one-condition-out selection chose the largest tested penalty in 94.0% of response-specific fits in D12, 78.5% in D7, and 72.0% in D10. This proportion exceeded 70% in seven datasets: D3, D4, D6, D7, D10, D12, and D16. Penalty selection therefore frequently reached the upper boundary of the tested grid; larger penalties were not evaluated.
Composition thresholds and analytical panels
On the common comparison sets, attainment under the composition-constrained rule was lower at the 0.75 training-share quantile than at the 0.25 quantile in all 35 primary dataset–focal model combinations. Conditional violation rates were higher in 34 combinations (Figure S3). In D5, RF attainment decreased from 75.7% to 10.0%, while its conditional violation rate increased from 0.0% to 12.0%. RQ attainment decreased from 68.7% to 15.4%, and its conditional violation rate reached 64.2%. In D9, ridge FQ was the only focal model with nonzero attainment at the 0.75 quantile (3.8%); the additional FQ comparator attained 5.8%. Each quantile defined a different joint evaluation requirement.
Changing the analytical panel also changed attainment and model rankings on the common comparison sets under the composition-constrained rule (Figure S4a). In D5, the expanded three-compound panel reduced attainment to 35.6% for GP, 34.5% for ET, 29.9% for RF, 27.4% for RQ, and 20.2% for ridge FQ, making GP the highest-attainment focal model. In D9, the expanded panel increased attainment for all five focal models, including RQ (32.1%) and RF (25.2%). Alternative panels left the focal-model selection metrics unchanged in D11 and D21. In D17, RF attainment increased from 5.6% to 41.7%, whereas RQ attainment decreased from 50.0% to 36.1% across 36 problems. These comparisons retained the same predictions for each compound but changed the panel composition and the resulting training-derived share thresholds. They therefore assessed sensitivity to the compositional requirement rather than to changes in prediction alone.
For D33, the two-compound and seven-compound panels were calculated from the same stored predictions for seven responses for each model and split (Table S22). On the 220-problem common set under the composition-constrained rule at the training-median share threshold, expanding the panel increased the oracle upper bound from 13.6% to 22.3% and expected attainment under uniform random choice from 4.7% to 8.5%. Default GP attainment changed from 1.4% to 16.4%, RF from 5.0% to 5.5%, and RQ from 0.9% to 0.0%. The three MLP configurations attained 1.8–5.0% with the expanded panel. These differences reflect changes in the panel denominator and training-derived share thresholds. They do not indicate improved chemical purity, corrected source units, or replication in an independent medicinal plant study. Increasing the number of jointly fitted MLP responses from two to seven also changed the fitted model; only the comparison using the same seven-response predictions isolates the effect of panel definition.
Training budget and candidate-set size
With evaluation thresholds calculated from all noncandidate conditions and held fixed across training budgets, increasing the number of fitting conditions changed both attainment and RQ availability under the composition-constrained rule (Figure 5a–d; 100 problems per dataset). In D5, as the number of training conditions increased from 10 to 22, attainment over all attempted problems increased from 28% to 47% for GP, 21% to 49% for RF, and 8% to 37% for RQ. RQ availability increased from 19% to 89%, while ridge FQ attainment remained between 21% and 29%. Within the sets where RQ was available at each budget (Table S9), RQ attainment was similar at the endpoints: 42.1% on 19 problems and 41.6% on 89 problems. Within those sets, GP attainment increased from 36.8% to 44.9% and RF attainment from 21.1% to 47.2%. Because set membership changed with budget, these conditional comparisons did not use a fixed set of problems. The increase in all-attempted RQ attainment accompanied an increase in availability.
Across all attempted problems in D7, attainment for all four evaluated models increased from 37–45% with ten training conditions to 53–55% with 33. In D12, RQ attainment increased from 1% to 28% as availability increased from 16% to 88%, and ridge FQ attainment increased from 16% to 27%; GP and RF remained between 7% and 13%. In D13, all four models attained more successes at the largest than at the smallest budget, including RQ (6% to 40%), GP (17% to 36%), and RF (24% to 37%). Under the earlier rule that recalculated thresholds within each training subset, D5 RF attainment at ten conditions was 30%, compared with 21% under fixed thresholds (Figure 5e). The learning curves therefore depended on whether evaluation requirements remained fixed as the fitting budget changed. At smaller budgets, the fixed thresholds used responses from noncandidate conditions outside the fitting subset, as specified in Section 2.7.
With six held-out candidates under the composition-constrained rule, GP, RF, and RQ attained 53.5%, 48.0%, and 35.0%, respectively, across all 200 D5 problems; RQ was available in 68.0% of them (Figure 5f). On the 136 problems where all four evaluated models were available, RQ attained 51.5%, RF 48.5%, and GP 53.7%. The RQ–RF ordering on this common set differed from that under the three-candidate protocol. In D7, attainment across the four models ranged from 68.0% to 72.5% with six candidates. These comparisons also changed the number of remaining training conditions and the training-derived thresholds.
Split sampling, stochastic fitting, and numerical ties
Across three seeds that changed both split sampling and stochastic model fitting, the largest attainment range on the common sets under the composition-constrained rule was 7.6 percentage points, observed for RQ, GP, and RF in D7. The median range across the 30 dataset–model combinations was 2.2 percentage points (Figure S4b). D5, D12, D13, D21, and D22 each had at least one model that ranked first or tied for first under every seed. In D7, the leading model changed across seeds, although the five focal models were within 4.2 percentage points of one another under each seed. RF ranked first in D5 under every seed, whereas ET and GP exchanged ranks. GP exceeded ET under one of the three seeds; attainment ranged from 45.8% to 49.9% for GP and from 45.2% to 51.5% for ET.
The post hoc analysis of nearly tied predictions reevaluated 447,508 recommendations recorded with the main seed across the original benchmark experiments, selection rules, and share quantiles (Table S10). A relative tolerance of 10−9 changed the selected candidate in 614 recommendations and the success status in 318. Dataset-specific absolute tolerances, defined as half the smallest decimal increment in stored target-response values, changed the selected candidate in 1,527 recommendations and the success status in 647. These selection changes were concentrated in the GP configurations and, under the absolute tolerance, RF. At the training-median share threshold under the composition-constrained rule, attainment over all attempted problems changed by more than two percentage points in only one of 201 dataset–model combinations with at least one recommendation. For GP-Matérn in D4, the absolute tolerance changed the selected candidate in 44 of 280 recommendations and reduced attainment over all attempted problems from 60.5% to 50.3%. This estimate was therefore sensitive to the ordering of nearly identical predictions. The absolute tolerances were numerical settings, not estimates of analytical measurement resolution.
Inclusion of the disputed D21 row
In D21, adding the disputed row to training while retaining the original thresholds left constrained attainment at the training-median share threshold unchanged at 383/500 (76.6%) for RQ, corrected ridge FQ, and RF with the main analytical panel (Table S23). Recalculating thresholds from the enlarged training set changed the oracle upper bound to 357/500 (71.4%); RQ and RF attained 71.4%, and ridge FQ attained 68.0%. In the separate candidate-set comparison with the main panel, adding the row to each of the 136 original candidate pairs increased both the oracle upper bound and attainment for all three models from 91/136 (66.9%) to 136/136 (100%). With the expanded panel, attainment after adding the row to the candidate sets was 100% for RF, 93.4% for RQ, and 85.3% for ridge FQ. Recalculating thresholds changed the evaluation requirement, whereas adding the row to candidate sets introduced an option that met both measured requirements. Neither comparison isolates a general improvement in prediction. The original 17-condition analysis remains the reference, and including the row as reported does not resolve the source-reporting concern.
Reporting basis and source qualifications
Linking compound concentrations to the corresponding extraction yields changed the joint selection objective (Table S15). Comparisons used identical problems where RQ, default GP, RF, and ET were available under both reporting bases: 160 in the D28 subset, 220 each in D29 and D30, and 441 each in D31 and D32. At the training-median share threshold, constrained attainment was higher on the derived starting-residue basis in all 25 dataset–focal model combinations. However, the proportion of problems with at least one candidate meeting both measured requirements also increased in every dataset. For example, RF attainment in D29 changed from 0.0% to 25.5%, while the oracle upper bound increased from 0.0% to 27.7%. RQ attainment in D31 changed from 0.0% to 32.0%, while the oracle upper bound increased from 5.7% to 51.2%. These comparisons reflect changes in the reporting basis and training-derived amount thresholds, not improved prediction or selection under a fixed chemical objective.
In the 12-condition D28 sensitivity subset, ET attainment changed from 0.6% on the extract basis to 48.8% on the derived basis, while the oracle upper bound increased from 9.4% to 58.1%. Models were refitted under both bases after omitting the condition with the unresolved yield entry. Removing that condition also changed the training-derived thresholds relative to the original 13-condition analysis. Nonzero extract-basis attainment in this subset therefore does not contradict the absence of jointly feasible candidates in the original D28 analysis, whose results were retained separately.
Concentration–yield checks confirmed that multiplying all panel components by the same positive yield preserved each reported run’s panel share within floating-point precision. After repeated factor settings were averaged, the maximum absolute share difference between reporting bases was less than 0.0001. Across 264 evaluable condition–compound combinations, the largest relative difference between the mean of concentration–yield products and the product of the corresponding means was 0.105%. These diagnostics describe the arithmetic effects of using published means and averaging repeated settings; they do not estimate uncertainty in the original measurements. Descriptive variation among repeated reported means and remaining gaps in calibration, replication, and process-resource information are documented in Table S16.
3.5. Secondary Evidence and Qualified Dataset Extensions
Unless otherwise stated, this section compares the ten established model configurations under the composition-constrained rule at the training-median share threshold. Common comparison sets were defined by the availability of RQ, default GP, RF, and ET; additional comparators were evaluated on those same sets. The five focal models were RQ, ridge FQ, default GP, RF, and ET.
Original secondary datasets
Attainment varied across the original secondary datasets (Table S6; Figure S2). Among datasets quantified in assay-equivalent units, RQ, FQ, ridge FQ, and the three GP configurations attained 65.4–72.9% in D11, compared with 54.4% for RF and 56.8% for ET. In D4, GP-Matérn attained 69.1%, compared with 56.8–57.7% for RQ, default GP, and RF, although its estimate was sensitive to numerical tie handling (Section 3.4). No model exceeded the uniform-random expected attainment of 15.8% in D14. In D12 and D13, whose panels included a reported compound-group sum, RQ had the highest attainment, at 35.0% and 45.1%, respectively; the corresponding values were 15.5% and 36.8% for GP and 13.5% and 36.5% for RF.
Among datasets involving hydrolysis or chemical conversion, RF had the highest attainment in D6 (66.7%, versus 33.7% for RQ). In D17, RQ, FQ, and ridge FQ reached the oracle upper bound of 50.0% across 36 problems, whereas RF attained 5.6%. No model exceeded 11.1% in D18, compared with 12.5% for uniform random choice.
Among datasets reported on an extract basis or using grid designs, the GP configurations and RQ attained 42.1–45.6% in D16, and RF had the highest attainment in D20 (26.0%, versus 15.1% for RQ). The highest model attainment exceeded random choice by only 1.1 percentage points in D15, and no model reached the random expectation in D19. In D21, which included a categorical solvent factor, RQ, FQ, ridge FQ, GP-wide, and RF reached the oracle upper bound of 76.6%; all models except the training-mean baseline attained 70.4–76.6%. Adding the composition constraint left attainment unchanged. In D22, RQ attained 66.2%, FQ, ridge FQ, and RF each attained 62.4%, and default GP attained 33.8%.
Adding the composition constraint increased attainment for all five focal models in D16, by 4.9–8.4 percentage points. For RQ, attainment increased by 8.7 percentage points in D12, with 39 successes gained and none lost, and by 2.0 percentage points in D13. Other increases among the five focal models amounted to no more than eight net additional successes per dataset–model comparison; attainment was unchanged or lower in the remaining comparisons (Table S6).
Candidate switching accounted for the RQ gains in D12 and D13 (Table S11). In D12, 43 switches gained 39 successes without losing any, and none of the 134 additional abstentions removed a success under the amount-only rule. In D13, 11 switches gained nine successes without losses, and none of the 42 additional abstentions removed a success. Every switch in both comparisons selected a candidate with a higher measured panel share.
The descriptive leave-one-study-out assessment retained the pattern of dataset-specific model advantages (Supplementary Methods, Section S7). Excluding D3 left the separately evaluated primary comparisons unchanged. After D5 was omitted, RF and ET still exceeded RQ in D8, and RF remained the highest-attainment model in the secondary datasets D6 and D20. Omitting either D1 or D2 left primary datasets favoring RQ and others favoring ML models. Omitting the avocado study removed both D9 and D10, where no model exceeded random choice under the constrained rule; this pattern remained in D14, D18, and D19. This assessment compared the remaining dataset-level results without pooling effects or fitting models for transfer across studies.
Additional fruit datasets (D23–D27)
The five fruit extension datasets contributed 1,018 held-out evaluation problems: 455 each in D23 and D24 and 36 each in D25–D27. Their common sets contained 454, 452, 36, 36, and 36 problems, respectively (Table S12). RF attained 56.2% in D23, compared with 49.8% for RQ, 35.8% for uniform random choice, and an oracle upper bound of 73.6%. In D24, ridge FQ attained 40.5% and FQ 36.3%, compared with 11.7% for RQ and 35.5% for random choice; the oracle upper bound was 67.9%.
Results also varied across the citrus grids. In D25, the training-mean baseline attained 66.7%; among models using factor values, the highest attainment was 52.8% for linear regression and GP-wide, compared with 44.4% for uniform random choice. In D26, RQ had the highest model attainment at 8.3%, below the random expectation of 33.3%. In D27, GP-Matérn and default GP attained 41.7% and 38.9%, respectively, compared with 33.3% for random choice. Across the 25 dataset–focal model comparisons on these common sets, adding the composition constraint increased attainment in three, left it unchanged in six, and decreased it in 16. The largest increase was 0.7 percentage points for ET in D23. All five focal models were unchanged in D25, whereas decreases in D26 ranged from 25.0 to 36.1 percentage points. These results were reported separately from the original benchmark and showed dependence on both dataset and selection rule.
Post-distillation residues and saffron floral by-products (D28–D33)
The six medicinal plant by-product datasets contributed 2,144 evaluation problems: 286 each in D28–D30 and D33 and 500 each in D31 and D32. Common sets contained 220 problems in each of D28–D30 and D33 and 441 in each of D31 and D32 (Table S13). No D28 problem contained a candidate meeting both measured requirements at the median-share threshold, so every model had zero attainment under both rules. D29 also had no jointly feasible candidate in its common set, although the oracle across all 286 attempted problems was 23.1%. All 66 problems containing a feasible candidate were outside that common set. Thus, zero attainment in these common sets coincided with the absence of a candidate meeting both requirements.
In D30, ridge FQ was the only model with nonzero attainment (9.5%), compared with 8.3% for uniform random choice and an oracle upper bound of 25.0%. In D31, linear regression and FQ had the highest attainment among the ten established configurations (0.7%), below the random expectation of 2.0%; the oracle upper bound was 5.7%. In D32, RF attained 16.6%, ET 15.2%, and RQ 10.7%, compared with 6.4% for random choice and an oracle upper bound of 17.2%. In D33, RF had the highest attainment (5.0%), compared with 0.9% for RQ, 4.7% for random choice, and an oracle upper bound of 13.6%. These values apply to each dataset’s specified targets and common set; they do not compare performance on a shared task across materials.
Across the 30 dataset–focal model comparisons, the constraint increased attainment in four, left it unchanged in ten, and decreased it in 16. All increases occurred in D32: 1.8 percentage points for RQ, 2.9 for default GP, 8.2 for RF, and 6.8 for ET. All ten unchanged comparisons were in D28 and D29, whose common sets contained no jointly feasible candidate. The constraint therefore had different effects even between the MAE and UAE datasets from the same sage study. The extension was retained regardless of these outcomes; targets, panels, and model settings were not revised after examining performance.
Linked fruit matrices (D34–D37)
On the 220-problem common sets, linear regression reached the oracle upper bound in D34 (52.3%), compared with 51.4% for RQ, 49.5% for default GP, and 23.5% for uniform random choice (Table S14). In D35, linear regression attained 35.5%, RF 26.4%, and RQ 25.9%, compared with 14.5% for random choice and an oracle of 38.6%. These matrices represent different chemical responses linked to the same upstream olive-pomace conditions, rather than independent experimental replications. In the Opuntia UAE dataset D36, all ten models had zero attainment on the 498-problem common set, although 45 problems contained a jointly feasible candidate (oracle 9.0%; expected random attainment 3.0%). In the MAE dataset D37, ET attained 39.0%, linear regression 36.5%, RF 33.3%, default GP 32.4%, and RQ 27.7% across 441 common problems, compared with 26.2% for random choice and an oracle of 57.4%. The reporting-basis, calibration, and source-reporting qualifications in Section 2.2 apply to these secondary comparisons.
Red ginseng with an unresolved quantitative basis (D38)
The D38 sensitivity analysis retained the published values despite their unresolved quantitative basis. RQ was available in 452 of 455 problems and FQ in 448. On the 452-problem common set, constrained attainment was 45.4% for ridge FQ, 40.9% for ET, 37.2% for RF, 32.5% for default GP, and 28.1% for RQ, compared with 33.2% for uniform random choice and an oracle upper bound of 64.4% (Table S14). Adding the constraint reduced attainment for all five focal models, by 5.8 percentage points for default GP to 18.6 for RQ. The reported values thus yielded feasible alternatives in many problems, but screening by predicted Rg3 share did not consistently improve attainment. This computational result does not establish selection performance against validated ginsenoside quantities.
Source reexamination did not change any analyzed value (Table S18). The original supplementary equations were checked directly, and the diagnostic calculations were repeated. The source supplement’s Table S2 does not explicitly define the equation symbols or their units. If x is the stated standard concentration in µg/mL and y is detector response, the printed Rg3 and Rk1 equations cross zero at approximately 114 and 188 µg/mL, respectively, and predict negative responses throughout the stated calibration range of 16.67–100 µg/mL. The Rh1 and Rg5 equations predict negative responses below approximately 78 and 79 µg/mL, respectively.
Combining the reported contents per mass of dry residue with extraction yields and reconstitution at 10 mg extract/mL gives conditional Rg3 solution concentrations of 312–1,388 µg/mL across 17 runs. If no additional dilution was used, 50 of the 83 nonzero compound values would imply concentrations above the calibration range. Additional dilution was not reported, so these calculations do not establish the injected concentrations. Alternatively, interpreting the contents as amounts per gram of extract would place 70 of the 83 corresponding concentrations below the lowest calibration level; this is a diagnostic scenario, not a corrected unit assignment. The purchased-standard list also omits Rg2, although its calibration equation is printed. These discrepancies do not prove that the published contents are incorrect, but the available information is insufficient to establish their quantitative validity. The calibration equations, units, standards, and dilution procedure still require clarification.
Saffron waste with nominal process attributes (D39)
Across 15 unique D39 conditions, the kaempferol-3-O-sophoroside share of the four-flavonol panel ranged from 0.721 to 0.805 and was positively associated with its amount (Spearman ρ = 0.73; Table S17). RQ was available in 450 of 455 problems, whereas FQ was unavailable throughout. On the 450-problem common set, constrained attainment was 68.4% for RQ, 65.6% for GP-Matérn, 65.1% for RF, 64.4% for default GP, 64.2% for GP-wide, 63.8% for ET, 63.3% for linear regression, and 58.9% for ridge FQ, compared with 32.9% for uniform random choice and an oracle upper bound of 69.1%. RQ succeeded in 308 of the 311 problems with a jointly feasible candidate. In the paired RQ–RF comparison, RQ alone succeeded in 15 problems, whereas RF never succeeded when RQ failed. Across all 455 attempted problems, RQ attained 67.7% and RF 65.1%; the five unavailable RQ fits remained in the denominator without contributing a success and were recorded separately from abstention.
The composition constraint did not increase attainment for any focal model: attainment was unchanged for RQ and RF and decreased by 0.4 percentage points for default GP, 0.7 for ET, and 2.9 for ridge FQ. Coverage decreased by 0.7–5.1 percentage points. Conditional violation rates decreased by 1.1–2.6 percentage points except for ET, for which the rate increased by 0.2 percentage points. These results concern one secondary study with largely surrogate-calibrated responses and nominal process attributes; they were not pooled with D33 or the continuous-factor designs.
Separate Magnolia-residue analysis (D40)
The recovered D40 supplementary design table contained 46 reported rows representing 41 unique conditions. A separate secondary analysis evaluated 500 held-out problems (Table S24). RQ and FQ were each available in 469 problems; all other configurations returned finite predictions. On the 469-problem common set, constrained attainment was 42.2% for corrected ridge FQ, 42.0% for FQ, 35.0% for ET, 33.7% for default GP, 32.8% for RQ, and 32.6% for RF, compared with 18.8% for uniform random choice and an oracle of 44.8%. The three MLP initialization seeds attained 22.2–26.0%. Of 1,500 MLP fits, 1,470 (98.0%) generated convergence warnings; finite predictions were retained under the fixed policy with a 200-iteration limit. These exploratory comparisons used the reported magnolol–honokiol panel. Unresolved dry-matter correction, residue-generation details, calibration ranges, and dilution information prevented D40 from qualifying as an additional medicinal plant study meeting the primary-evidence criteria. The results do not establish a validated process improvement.
Separate sage herbal-dust analysis (D41)
The separate D41 sage herbal-dust dataset supplied 17 rows and 15 unique conditions from one additional source, without changing the denominators for D1–D39 or D40. All 455 held-out triples and 5,915 configured model fits were attempted. RQ was available in 454 problems and FQ in 448; all other configurations returned finite predictions. On the 454-problem common set, constrained attainment was 37.4% for RQ, 26.2% for RF, 23.6% for ET, 17.6% for default GP, and 6.2% for corrected ridge FQ, compared with 31.4% for uniform random choice and an oracle of 62.1% (Table S26). The three supplementary MLP seeds attained 21.6–25.6% on the same 454 problems. Adding the constraint reduced attainment for all five focal models by 1.8–13.9 percentage points. Of 1,365 MLP fits, 1,098 (80.4%) generated convergence warnings; finite predictions were retained under the unchanged policy. This monoterpene comparison broadens the chemistry evaluated while retaining the source qualifications. It does not establish extract purity, safety, or performance across independent material batches.
Separate rosemary analyses on an extract basis (D42–D44)
D42–D44 contributed 51 unique-condition entries counted within their respective extraction blocks from one rosemary study; they were not pooled with the original benchmark. Common sets contained 220 ASE, 220 UAE, and 439 SFE problems, with all five focal models evaluated on the same set within each block. Adding the composition constraint changed attainment by 0 percentage points for all five focal models in ASE and UAE. In SFE, constrained-minus-amount-only differences were −2.050, +1.139, −1.595, 0, and 0 percentage points for RQ, ridge FQ, default GP, RF, and ET, respectively. On the same 439 SFE problems, the three supplementary MLP seeds yielded differences of −2.961, −3.417, and −5.239 percentage points. The constraint therefore showed no consistent benefit across the three blocks.
Across the main and ASE row-exclusion analyses, 16,796 configured model fits produced 15,690 finite outputs. The remaining 1,106 fits were mathematically unavailable because of matrix-rank or residual-degrees-of-freedom requirements; there were no technical execution failures. Of 3,876 MLP fits, 2,247 generated convergence warnings, and their finite predictions were retained under the existing policy. In the matched ASE sensitivity analysis, excluding row 3 changed constrained attainment by −0.455 to +0.909 percentage points across the five focal models on their respective paired available sets (160 pairs for RQ and 220 for each other model). All three MLP differences were +0.455 percentage points on 220 pairs. These differences include changes in training-derived thresholds and do not identify a corrected source value. Table S27 reports availability, warnings, and comparison sets in full.
3.6. Supplementary Neural Network Comparison and Convergence Diagnostics
On the original common comparison sets, the three fixed-seed multilayer perceptron (MLP) configurations attained 32.0–39.0% in D5 under the composition-constrained rule at the training-median share threshold, compared with 42.6% for RQ and 55.3% for RF. In D7, MLP attainment ranged from 39.8% to 55.0%, compared with 59.0–61.2% for the quadratic regression, GP, and tree ensemble models (Table S21). Each seed was evaluated as a separate configuration; predictions were not combined into an ensemble, and no best-performing seed was selected.
Across the 39 datasets, all 38,715 MLP fits for 12,905 main evaluation problems returned finite predictions, but 24,702 fits (63.8%) generated a convergence warning. These fits were retained under the fixed analysis policy, with results for fits without convergence warnings reported separately. Finite predictions established model availability but did not confirm convergence or adequate optimization.
Restricting MLP and RQ to the same problems without an MLP convergence warning changed RQ attainment in 99 of 117 dataset–seed summaries despite unchanged RQ predictions (Table S25). In D5 with seed 20261012, MLP and RQ attained 172/441 (39.0%) and 188/441 (42.6%), respectively, on their common available set. On the 214-problem subset without an MLP convergence warning, both attained 76/214 (35.5%), while the oracle upper bound decreased from 67.3% to 63.6%. The subset was selected after fitting, and no models were refitted. These score changes therefore reflect a change in the evaluated problems and do not isolate a benefit from improved MLP optimization. Absence of a convergence warning does not establish an optimal solution. The overlapping evaluation problems and dataset–seed summaries are not independent experimental replicates.
4. Discussion
Adding a composition requirement to model predictions did not consistently increase successful recommendations. Across the seven original primary datasets, attainment increased in only three of 35 comparisons involving the five focal models. Both rules were evaluated on the same common comparison sets against identical measured content and panel-share requirements. With predictions and candidates fixed, the additional eligibility requirement cannot increase coverage. Its effect on attainment depends on successes gained through candidate switching relative to successes lost through switching or additional abstention. In 32 comparisons, additional abstention accounted for more lost successes than switching to an unsuitable candidate. RQ gained eight successes but lost 60 in D5, whereas it gained 39 without losses in the secondary dataset D12. Screening also changed which problems received recommendations, so a lower conditional violation rate did not necessarily indicate higher attainment.
The contribution of this benchmark is to evaluate models through repeated selection decisions against explicit chemical requirements. This complements comparisons of response surface methodology (RSM) and machine learning based on prediction error or an experimentally tested optimum [34,35,36,84,85], as well as sequential constrained optimization and benchmarks using finite sets of measured candidates [45,86,87]. Threshold classification, candidate ranking, and the decision to withhold a recommendation jointly determine attainment [37,38,39]. Comparing selection rules while holding the measured requirements constant therefore connects predictive accuracy to the chemical suitability of the selected conditions.
The chemical objective depends on the analytical panel. D1 compares hesperidin with narirutin, whereas D7 compares hesperidin with limonin [4,62]. In D9/D10, the share is the mass of procyanidin B1 divided by the combined mass of procyanidin B1 and epicatechin; it is neither a molar ratio nor a measure of the overall procyanidin size distribution [10,88]. D12/D13 compare a reported flavan-3-ol group sum with that sum plus gallic acid. The source study identified different extraction conditions for maximizing these responses; other enzyme-treatment studies provide context for changes in phenolic profiles but do not establish the mechanism in D12/D13 [11,89]. Because the source studies for D1, D7, and D12/D13 sought to recover both components or responses, the accompanying compounds should not be treated as unwanted impurities [4,11,62]. Changing the panel changes the objective, so attainment alone cannot identify a preferred panel.
A higher target share does not necessarily mean lower content of accompanying compounds: target content may increase more rapidly than accompanying content. All seven RQ candidate switches in D2 increased the measured hesperidin share, yet two also increased narirutin. Those two evaluation problems repeated the same switch between conditions and did not represent independent chemical effects (Table S11). Relative composition must therefore be interpreted together with component content and the intended use of the extract.
Screening also depends on prediction errors near the eligibility thresholds. In CO2-exhausted mandarin peel, some models reduced conditional violation rates while making fewer recommendations. In avocado peel, default GP, RF, and ET predicted shares that were inversely associated with measured shares in D9 (ρ = −0.42 to −0.38) and weakly associated in D10 (ρ = 0.16–0.26). These correlations used predictions available for each model rather than the common set used for the main selection comparisons. Among RF candidate occurrences that passed the predicted amount threshold but incorrectly passed the composition threshold, the target-response error made the larger absolute contribution to the composition-margin error in about half of D9 occurrences and most D10 occurrences (Tables S7 and S11). This diagnostic describes prediction errors, not extraction mechanisms. Likewise, the RQ gains in D12/D13 do not establish whether small share differences exceeded measurement variability. Component predictions and threshold decisions therefore require joint validation before practical use.
Model comparisons also depend on which problems are evaluated. Common sets were defined by the availability of RQ, default GP, RF, and ET. Additional comparators used these fixed sets, with unavailable fits contributing no successes. Results over all attempted problems also included tasks excluded from the common sets; unavailable fits remained in the denominator and were distinguished from abstention by a fitted model. Because availability depended on design structure, the two summaries answer different questions. Similar attainment among nonlinear models in D7 does not establish that larger datasets eliminate model differences, because chemistry, sample size, and experimental design varied together. Ridge FQ remained available throughout, yet its attainment varied and penalty selection often reached the largest tested value. Availability alone therefore does not establish effective selection.
The benchmark compares specified procedures rather than equally optimized algorithm families. Ridge FQ selected its penalty internally, GP optimized kernel parameters, and tree ensembles and MLP used fixed configurations [79,90]. GP results illustrate the importance of these choices. At least one kernel-bound warning occurred in 93% of problem–configuration combinations across the three GP configurations in the original benchmark. Changing the kernel or its bounds changed the selected candidate or recommendation status in up to 38% of attempted problems under the constrained rule. Default GP predictions in D1 had little rank association with measured hesperidin responses (ρ = 0.03), and GP-Matérn attainment in D4 was sensitive to the ordering of nearly identical predictions (Tables S7, S8, and S10). These findings concern the tested kernels, bounds, and numerical settings.
The supplementary MLP comparison concerns a small fixed architecture under the stated computational budget. Finite predictions were retained even when convergence warnings occurred. Restricting evaluation to problems without an MLP convergence warning changed RQ attainment despite unchanged RQ predictions (Table S25). Scores on this selected subset cannot therefore be interpreted as the benefit of improving MLP optimization, and absence of a warning does not establish an optimal solution. The MLP seeds varied initialization on identical splits, whereas the earlier repeated-seed analysis changed both split sampling and stochastic fitting. Its maximum attainment range of 7.6 percentage points cannot be attributed specifically to tree randomization (Figure S4). Closely spaced rankings require interpretation alongside model specification and these sources of variation. These results apply to the tested procedures and do not establish a general ranking of model families.
The analysis with fixed thresholds examined changes in fitting information while holding the evaluation requirements constant (Figure 5a–d; Table S9). In D5, all-attempted RQ attainment increased with availability, whereas attainment within its available sets was similar at the smallest and largest budgets. Because those sets changed with budget, they did not provide a comparison on the same problems. GP and RF achieved higher attainment at the largest budget on the fixed set of 100 candidate problems. In D12, ridge FQ attainment increased from 16% to 27%, while GP and RF remained between 7% and 13%. Fixed thresholds excluded candidate responses but used all noncandidate responses, including those outside smaller fitting subsets. These results describe reduced fitting budgets under an already specified objective, not the total information needed to define that objective. The comparisons that recalculated thresholds or changed candidate-set size also changed the requirements or available choices and did not isolate changes in predictive performance (Figure 5e,f).
The extensions reinforced the dependence of model performance on the dataset. Leading configurations differed across D23–D27, and none reached the uniform-random expectation in D26. D25–D27 came from one study and do not provide three independent study-level replications. In D25, the training-mean baseline assigned identical predictions to all candidates within each problem, leaving selection to the fixed condition-identifier tie rule. The D39 saffron study differed from D33 in material origin, extraction setup, panel, and calibration [25,26]. RQ combined additive categorical process-attribute effects with quadratic acid-concentration terms and came within one percentage point of the oracle upper bound. The composition requirement rarely changed recommendations, consistent with the positive association between kaempferol-3-O-sophoroside content and share. This pattern cannot be assumed to extend to other saffron residues or categorical designs.
The medicinal and aromatic plant extensions evaluated distinct chemical objectives. Post-distillation rosemary and sage contain recoverable phenolic compounds [23,24,83]. D28–D32 prioritize rosmarinic acid relative to carnosol and carnosic acid, whereas D42–D44 prioritize the combined share of carnosol and carnosic acid in the same three-compound panel. Because both studies and target preferences differ, their attainment rates cannot identify a better extraction method. D33 compares a flavonol glycoside with an anthocyanin on a dry-material basis, whereas D41 targets eucalyptol within a six-monoterpene panel. These shares do not establish overall extract purity, recovery from the starting residue, or safety. Feasibility also limits attainment: D28 had no feasible candidates under the main joint thresholds, and D29 had feasible candidates only outside the RQ-based common set. Separate amount and share thresholds therefore need not be jointly achievable within a candidate set.
Reporting basis is also part of the objective. Multiplying all panel components in a reported run by the same positive extraction yield preserves that run’s share but changes the amount response and its threshold. Averaging these products across repeated settings can change condition-level shares when yields differ. Extract concentration and derived content per mass of starting residue therefore address different selection questions. The conversion depends on the reported yield denominator, matched fractions, and means; it does not establish experimental recovery efficiency. Analytical errors need not cancel in a ratio because calibration, detector responses, dilution, and detection-limit effects can differ among compounds [32,91]. The D33 panel sensitivity changes the denominator and training-derived threshold; it does not demonstrate improved purity or quantify measurement uncertainty. Without paired analytical replicates and covariance, experimental uncertainty in the ratios could not be reconstructed.
Unresolved source issues further limit interpretation. In the ASE block among D42–D44, printed component values differ from their reported sum. Retaining the individual values preserves traceability, while row exclusion tests dependence on that record without identifying the correct value (Table S27). Missing condition-specific yields and raw replicate measurements prevent conclusions about residue-level recovery or uncertainty in measured shares. D38 remains a secondary sensitivity case because its calibration reporting is unresolved; its reported ginsenoside values do not establish validated quantification. Excluding D38 from evidentiary claims does not change the seven original primary datasets, which never included it. D33 and D41 meet the primary-compatible criteria with their documented source qualifications. The post-distillation datasets, D39, D40, and D42–D44 remain separately qualified secondary evidence. These extensions broaden the chemical cases examined without demonstrating transfer across plants or consistency across material batches.
More evaluation problems do not provide more independent experimental evidence. The established 39 datasets contained 9–36 unique settings each, totaling 612 condition entries and 12,905 configured main problems; D40 separately contained 41 settings. Several datasets shared source studies, materials, or upstream processing conditions, and independent batch counts could not always be established. Later extensions do not remove this dependence. Models were refitted within each dataset, so transfer across by-products was not tested. Small samples and overlapping splits limit inference [82,92]; confidence intervals treating splits as independent experimental replicates were therefore not reported. Random seeds and numerical tie checks assess computational variation, not biological or analytical measurement uncertainty.
For ingredient development, the benchmark provides a traceable comparison of procedures for prioritizing extraction conditions under defined chemical requirements. Selecting the best model after observing the results would not provide an unbiased estimate of future performance [79,93]. The preferred rule also depends on the application: attainment assigns zero to both unsuccessful recommendations and abstentions, although their costs may differ. Research on prediction with a reject option addresses such costs and the trade-off between errors and coverage [50,52,94], but does not supply statistical guarantees for the chemical rule evaluated here. When unsuitable recommendations are costly, lower conditional violation rates may justify reduced coverage. Panels, thresholds, and these costs should be specified for the intended use, followed by prospective chemical testing across independent material batches.
Chemical suitability must also be assessed alongside process and product performance. The source review recorded extraction time, solvent use, yields, and some energy information, but did not establish comparable, condition-level measurements of total energy. Rated power was therefore not treated as measured process energy. Studies evaluating extraction together with energy consumption illustrate the additional evidence required [57,58]. Product specifications are use specific: the EFSA assessment and EU authorization for a defined rosemary feed additive do not apply directly to the rosmarinic acid panel evaluated here [95,96]. Safety, efficacy, solvent acceptability, scale-up, economics, and environmental performance require separate evidence. The benchmark evaluates how reliably selection procedures prioritize chemically suitable conditions; product compliance and process benefits require subsequent evaluation of the resulting extracts and production conditions.
5. Conclusions
This retrospective benchmark showed that stricter composition screening did not consistently improve the selection of suitable extraction conditions. Across the seven original primary datasets, adding the median-share constraint increased attainment in only three of 35 focal dataset–model comparisons, by at most 1.4 percentage points. Both rules were evaluated on the same common comparison sets against identical measured content and panel-share requirements. In 32 comparisons, more successful recommendations were lost through additional abstention than through switching to an unsuitable candidate.
Model performance also depended on the dataset. Under the composition-constrained rule, random forest attained 55.3% in grape pomace (D5), compared with 42.6% for reduced quadratic regression, whereas reduced quadratic regression had the highest attainment among the established models in D1 and D2. These rankings apply to the tested configurations and comparison sets. Attainment must be interpreted alongside coverage and conditional violation rates, because a lower violation rate among recommendations can coincide with fewer successful recommendations overall. Unavailable fits must also be reported separately from a fitted model’s decision to abstain; results restricted to available fits describe a selected set of problems.
The chemical objective is specific to the measured panel and reporting basis. A higher target share indicates relative enrichment within that panel; it does not establish greater overall extract purity, greater recovery from the starting material, or lower absolute amounts of accompanying compounds. Changing the panel or reporting basis can therefore change which conditions meet the requirements. The broader dataset collection expanded the chemical objectives examined, but shared sources and materials limited independent replication. Among the medicinal plant sources evaluated, only saffron (D33) and sage herbal dust (D41) met the criteria for primary-compatible evidence, with their documented source qualifications.
For ingredient development, the benchmark provides a reproducible comparison that distinguishes unsuitable recommendations and missed suitable alternatives from problems with no feasible candidate. The analytical panel and minimum content and share requirements should be specified for the intended use. Choosing a selection rule also requires weighing the consequences of an unsuitable recommendation against those of no recommendation; these application-specific costs were not estimated here. Prospective testing should measure the panel components at the selected conditions across independent material batches before the results are used to support extract standardization.
Supplementary Materials
The following supporting information can be downloaded at the website of this paper posted on Preprints.org. Supplementary Methods Sections S1–S19 describe the searches and dataset eligibility, chemical qualifications, model specifications and comparison sets, sensitivity analyses, source and computational checks, and the matched convergence diagnostic. Section S19 distinguishes source acquisition on October 18, 2026, from the earlier searches and links the associated source transcriptions, chemical issues, updated decisions, and data reuse checks. Table S1 documents the search history and integration of Google Scholar and Web of Science records. Table S11 provides verified success-transition summaries, and Table S20 documents the ridge correction. Table S21–S24 report the supplementary MLP comparison, D33 panel sensitivity, D21 row-inclusion sensitivity, and separate D40 analysis, respectively. Table S25 reports the matched convergence comparison, and Table S26 reports the separate D41 sage herbal-dust analysis. Table S27 presents the D42–D44 rosemary analyses and the ASE row-exclusion sensitivity. Figure S1–S4 provide supplementary chemical and sensitivity results. The supplementary analysis workbook (Supplementary_Analysis_VF.xlsx) contains the analysis code, supporting input data, split definitions, model settings, reference results, and instructions for running the analyses and checking the outputs. Source attribution and available information on reuse conditions are recorded in the workbook. Inclusion in the workbook does not grant additional rights to third-party material.
Funding
This research received no external funding.
Data Availability Statement
The analysis code and supporting data are provided in the supplementary analysis workbook (Supplementary_Analysis_VF.xlsx). Additional tabulated results generated by this study may be shared by the corresponding author upon reasonable request, where permitted by applicable reuse conditions. The original sources are identified in the dataset tables, and available information on source-specific access and reuse conditions is documented in the supplementary analysis workbook.
Acknowledgments
During the preparation of this manuscript, ChatGPT (OpenAI, San Francisco, CA, USA; GPT-6 Astra, accessed via the ChatGPT web interface in August–October 2026) was used to assist with Python code development, language editing and proofreading, translation, and non-substantive checks of caption clarity. The author reviewed and, where necessary, revised the AI-assisted code and all suggestions incorporated into the manuscript and takes full responsibility for the code and the content of the final manuscript.
Conflicts of Interest
The author declares no conflicts of interest.
References
- Casas-Rodríguez, A.D.; Contreras, S.A.C.; González-Martínez, D.W.; Meléndez-Rentería, N.P.; Sáenz-Galindo, A.; Morales-Martínez, T.K.; Ascacio-Valdés, J.A.; Sepúlveda-Torre, L. Evaluation of Process Parameters on Phenolic Recovery and Antioxidant Activity Using Ultrasonic and Microwave-Assisted Extraction from Pineapple Peel. Processes 2025, 13, 2500. [Google Scholar] [CrossRef]
- Poblete, J.; Aranda, M.; Quispe-Fuentes, I. Efficient Conditions of Enzyme-Assisted Extractions and Pressurized Liquids for Recovering Polyphenols with Antioxidant Capacity from Pisco Grape Pomace as a Sustainable Strategy. Molecules 2025, 30, 2977. [Google Scholar] [CrossRef]
- Brennan, E.; Pressete, C.G.; Mohammadi, N.; Antunes, L.M.G.; Shang, Q.; Chen, J.; Bennett, J.; Franchin, M.; Granato, D. Ultrasound-assisted recovery of blackcurrant press cake anthocyanins: Antioxidant and anti-inflammatory properties, bioaccessibility, and application in functional gummies. Food Chem. X 2025, 26, 102285. [Google Scholar] [CrossRef]
- Kim, D.-S.; Lim, S.-B. Extraction of flavanones from immature Citrus unshiu pomace: process optimization and antioxidant evaluation. Sci. Rep. 2020, 10, 19950. [Google Scholar] [CrossRef]
- Šafranko, S.; Ćorković, I.; Jerković, I.; Jakovljević, M.; Aladić, K.; Šubarić, D.; Jokić, S. Green Extraction Techniques for Obtaining Bioactive Compounds from Mandarin Peel (Citrus unshiu var. Kuno): Phytochemical Analysis and Process Optimization. Foods 2021, 10, 1043. [Google Scholar] [CrossRef]
- Banožić, M.; Šafranko, S.; Bogadi, D.; Aladić, K.; Jokić, S. Poboljšana ekstrakcija fenolnih spojeva iz kore mandarine primjenom visokonaponskog električnog pražnjenja: Utjecaj procesnih parametara i optimizacija [Intensification of Polyphenols Extraction from Mandarin Peel by High Voltage Electric Discharge: Effect of Process Parameters and Optimisation]. Kem. Ind. 2022, 71, 699–709. [Google Scholar] [CrossRef]
- Razola-Díaz, M.d.C.; Aznar-Ramos, M.J.; Guerra-Hernández, E.J.; García-Villanova, B.; Gómez-Caravaca, A.M.; Verardo, V. Establishment of a Sonotrode Ultrasound-Assisted Extraction of Phenolic Compounds from Apple Pomace. Foods 2022, 11, 3809. [Google Scholar] [CrossRef]
- Orozco-Flores, L.A.; Salas, E.; Rocha-Gutiérrez, B.; Peralta-Pérez, M.D.R.; González-Sánchez, G.; Ballinas-Casarrubias, L. Determination of Polyphenolic Profile of Apple Pomace (Malus domestica Golden Delicious Variety) by HPLC–MS. ACS Omega 2024, 9, 196–203. [Google Scholar] [CrossRef]
- Atanacković Krstonošić, M.; Sazdanić, D.; Mikulić, M.; Ćirin, D.; Milutinov, J.; Krstonošić, V. Optimization of Surfactant-Mediated Green Extraction of Phenolic Compounds from Grape Pomace Using Response Surface Methodology. Int. J. Mol. Sci. 2025, 26, 2072. [Google Scholar] [CrossRef]
- Martínez-Zamora, L.; Bueso, M.C.; Kessler, M.; Zapata, R.; Gómez, P.A.; Artés-Hernández, F. Optimization of Extraction Parameters for Phenolics Recovery from Avocado Peels Using Ultrasound and Microwave Technologies. Foods 2025, 14, 2431. [Google Scholar] [CrossRef]
- Štambuk, P.; Tomašković, D.; Tomaz, I.; Maslov, L.; Stupić, D.; Karoglan Kontić, J. Application of pectinases for recovery of grape seeds phenolics. 3 Biotech 2016, 6, 224. [Google Scholar] [CrossRef]
- Lončarić, A.; Celeiro, M.; Jozinović, A.; Jelinić, J.; Kovač, T.; Jokić, S.; Babić, J.; Moslavac, T.; Zavadlav, S.; Lores, M. Green Extraction Methods for Extraction of Polyphenolic Compounds from Blueberry Pomace. Foods 2020, 9, 1521. [Google Scholar] [CrossRef]
- Atwi-Ghaddar, S.; Destandau, E.; Lesellier, E. Integrated Supercritical Fluid Extraction and Pre-Formulation Process of Punica granatum L. Pericarp Polar Compounds. Molecules 2023, 28, 8110. [Google Scholar] [CrossRef]
- Kyriakoudi, A.; Kalfa, E.; Zymvrakaki, E.; Kalogiouri, N.; Mourtzinos, I. Recovery of Ellagic Acid from Pomegranate Peels with the Aid of Ultrasound-Assisted Alkaline Hydrolysis. Molecules 2024, 29, 2424. [Google Scholar] [CrossRef]
- Mutavski, Z.; Nastić, N.; Živković, J.; Šavikin, K.; Veberič, R.; Medič, A.; Pastor, K.; Jokić, S.; Vidović, S. Black Elderberry Press Cake as a Source of Bioactive Ingredients Using Green-Based Extraction Approaches. Biology 2022, 11, 1465. [Google Scholar] [CrossRef]
- Nastić, N.; Mutavski, Z.; Živković, J.; Ambrus, R.; Fernández, N.; Menković, N.; Vidović, S. Green Processing of Black Raspberry Pomace: Application of Sonotrode-Based Extraction Technique and Particles from Gas-Saturated Solutions (PGSS) Technology. Foods 2023, 12, 3867. [Google Scholar] [CrossRef]
- Bambeni, T.; Tayengwa, T.; Chikwanha, O.C.; Manley, M.; Gouws, P.A.; Marais, J.; Fawole, O.A.; Mapiye, C. Biopreservative efficacy of grape (Vitis vinifera) and clementine mandarin orange (Citrus reticulata) by-product extracts in raw ground beef patties. Meat Sci. 2021, 181, 108609. [Google Scholar] [CrossRef]
- Shafahi, H.; Nouri, L.; Jafari, S.M.; Najafi, A. The Impact of Free and Nanoencapsulated Banana and Apple Peels Extracts on the Physicochemical, Oxidative Stability, Microbial and Sensory Properties of Whipped Cream. Food Sci. Nutr. 2025, 13, e70652. [Google Scholar] [CrossRef]
- Lima Campos, B.C.d.S.; Bellucci, E.R.B.; Alves Junior, C.A.; de Souza, D.P.M.; Bertuci, M.L.; Lorenzo, J.M.; Barretto, A.C.d.S. Açaí residue extract as a natural antioxidant to enhance the shelf-life of beef patties. J. Sci. Food Agric. 2025, 105, 6424–6431. [Google Scholar] [CrossRef]
- Gomes, S.M.; Campos, F.; Martins, M.C.L.; Monteiro, C.; Santos, L. Exploring the Bioactive Potential and Biocompatibility of Extracts from Agro-Industrial Residues for Cosmetic Applications. Int. J. Mol. Sci. 2025, 26, 9169. [Google Scholar] [CrossRef]
- Lasota, M.; Lechwar, P.; Kukula-Koch, W.; Czop, M.; Czech, K.; Gaweł-Bęben, K. Pulp or Peel? Comparative Analysis of the Phytochemical Content and Selected Cosmetic-Related Properties of Annona cherimola L., Diospyros kaki Thumb., Cydonia oblonga Mill. and Fortunella margarita Swingle Pulp and Peel Extracts. Molecules 2024, 29, 1133. [Google Scholar] [CrossRef]
- Won, H.J.; Choi, A.-j. Fruit and Vegetable By-Products as Postharvest Tissue Fractions: A Raw-Material Framework for Plant-Based Food Development. Plants 2026, 15, 2423. [Google Scholar] [CrossRef]
- Irakli, M.; Skendi, A.; Bouloumpasi, E.; Christaki, S.; Biliaderis, C.G.; Chatzopoulou, P. Sustainable Recovery of Phenolic Compounds from Distilled Rosemary By-Product Using Green Extraction Methods: Optimization, Comparison, and Antioxidant Activity. Molecules 2023, 28, 6669. [Google Scholar] [CrossRef]
- Irakli, M.; Bouloumpasi, E.; Christaki, S.; Skendi, A.; Chatzopoulou, P. Modeling and Optimization of Phenolic Compounds from Sage (Salvia fruticosa L.) Post-Distillation Residues: Ultrasound- versus Microwave-Assisted Extraction. Antioxidants 2023, 12, 549. [Google Scholar] [CrossRef]
- Masala, V.; Jokić, S.; Aladić, K.; Molnar, M.; Tuberoso, C.I.G. Exploring Phenolic Compounds Extraction from Saffron (C. sativus) Floral By-Products Using Ultrasound-Assisted Extraction, Deep Eutectic Solvent Extraction, and Subcritical Water Extraction. Molecules 2024, 29, 2600. [Google Scholar] [CrossRef]
- Pappas, V.M.; Athanasiadis, V.; Palaiogiannis, D.; Poulianiti, K.; Bozinou, E.; Lalas, S.I.; Makris, D.P. Pressurized Liquid Extraction of Polyphenols and Anthocyanins from Saffron Processing Waste with Aqueous Organic Acid Solutions: Comparison with Stirred-Tank and Ultrasound-Assisted Techniques. Sustainability 2021, 13, 12578. [Google Scholar] [CrossRef]
- Wulandari, S.; Cao, R.; Choi, J.; Myint, A.A.; Kim, J. Valorizing ginseng residues using dimethyl ether: Recovering functional lipids and ginsenosides. J. Ginseng Res. 2026, 50(4), 101067. [Google Scholar] [CrossRef]
- Won, H.J.; Choi, A.-j. From Agri-Food Byproducts to High-Value Bioactive Compounds: A Critical Review Linking Green Recovery and Chemical Profiling to Circular Valorization. Molecules 2026, 31, 2136. [Google Scholar] [CrossRef]
- Won, H.J.; Choi, A.-j. Agri-Food Byproducts as Food-Tech Material Resources: A Critical Review of Processing, Functionality, Matrix Validation, and Readiness. Agriculture 2026, 16, 1588. [Google Scholar] [CrossRef]
- Palos-Hernández, A.; del Nogal Sánchez, M.; Gutiérrez Fernández, M.Y.; Pérez-Iglesias, J.L.; Santos-Buelga, C.; González-Paramás, A.M. Sustainable valorization of grape pomace peels using NADES: a focus on selective recovery of anthocyanins and flavonols and bioactivity. Anal. Bioanal. Chem. 2026, 418, 1697–1712. [Google Scholar] [CrossRef]
- Stanek-Wandzel, N.; Krzyszowska, A.; Zarębska, M.; Gębura, K.; Wasilewski, T.; Hordyjewicz-Baran, Z.; Tomaka, M. Evaluation of Cellulase, Pectinase, and Hemicellulase Effectiveness in Extraction of Phenolic Compounds from Grape Pomace. Int. J. Mol. Sci. 2024, 25, 13538. [Google Scholar] [CrossRef]
- Zapata, R.; Artés-Hernández, F. Assessment of the inaccuracy associated with the quantification of phenolic compounds using UHPLC-DAD and HPLC-MS/MS. J. Chromatogr. A 2026, 1775, 466918. [Google Scholar] [CrossRef]
- Onsawang, T.; Suwanvecho, C.; Sithisarn, P.; Phechkrajang, C.; Rojsanga, P. Experimental design approach for the quantitative analysis of multicomponents by single marker and HPLC fingerprinting of Thunbergia laurifolia aqueous extract. Phytochem. Anal. 2024, 35, 1472–1485. [Google Scholar] [CrossRef]
- Yue, Q.; Tian, J.; Dong, L.; Zhou, L. Comparison of an Ultrasound-Assisted Aqueous Two-Phase System Extraction of Anthocyanins from Pomegranate Pomaces by Utilizing the Artificial Neural Network–Genetic Algorithm and Response Surface Methodology Models. Foods 2024, 13, 199. [Google Scholar] [CrossRef]
- Kunjiappan, S.; Ramasamy, L.K.; Kannan, S.; Pavadai, P.; Theivendren, P.; Palanisamy, P. Optimization of ultrasound-aided extraction of bioactive ingredients from Vitis vinifera seeds using RSM and ANFIS modeling with machine learning algorithm. Sci. Rep. 2024, 14, 1219. [Google Scholar] [CrossRef]
- Li, H.; Liu, Y.; Guo, S.; Shi, M.; Qin, S.; Zeng, C. Extraction of Ursolic Acid from Apple Peel with Hydrophobic Deep Eutectic Solvents: Comparison between Response Surface Methodology and Artificial Neural Networks. Foods 2023, 12, 310. [Google Scholar] [CrossRef]
- Elmachtoub, A.N.; Grigas, P. Smart “Predict, then Optimize”. Manag. Sci. 2022, 68, 9–26. [Google Scholar] [CrossRef]
- Donti, P.L.; Amos, B.; Kolter, J.Z. Task-based End-to-end Model Learning in Stochastic Optimization. In Advances in Neural Information Processing Systems; Curran Associates: Red Hook, NY, USA, 2017; Volume 30, pp. 5484–5494. [Google Scholar]
- Wilder, B.; Dilkina, B.; Tambe, M. Melding the Data-Decisions Pipeline: Decision-Focused Learning for Combinatorial Optimization. Proc. AAAI Conf. Artif. Intell. 2019, 33, 1658–1665. [Google Scholar] [CrossRef]
- Mandi, J.; Kotary, J.; Berden, S.; Mulamba, M.; Bucarey, V.; Guns, T.; Fioretto, F. Decision-Focused Learning: Foundations, State of the Art, Benchmark and Future Opportunities. J. Artif. Intell. Res. 2024, 80, 1623–1701. [Google Scholar] [CrossRef]
- Sadana, U.; Chenreddy, A.; Delage, E.; Forel, A.; Frejinger, E.; Vidal, T. A survey of contextual optimization methods for decision-making under uncertainty. Eur. J. Oper. Res. 2025, 320, 271–289. [Google Scholar] [CrossRef]
- Wen, J.; Abeel, T.; de Weerdt, M. Performance and interaction assessment of neural network architectures and bivariate smart predict-then-optimize. Mach. Learn. 2025, 114, 252. [Google Scholar] [CrossRef]
- Mandi, J.; Defresne, M.; Berden, S.; Guns, T. Feasibility-Aware Decision-Focused Learning for Predicting Parameters in the Constraints. In Advances in Neural Information Processing Systems; 2025; Volume 38, pp. 163285–163309. [Google Scholar]
- Patra, A.; Abdullah, S.; Pradhan, R.C. Microwave-assisted extraction of bioactive compounds from cashew apple (Anacardium occidenatale L.) bagasse: modeling and optimization of the process using response surface methodology. J. Food Meas. Charact. 2021, 15, 4781–4793. [Google Scholar] [CrossRef]
- Liang, Q.; Gongora, A.E.; Ren, Z.; Tiihonen, A.; Liu, Z.; Sun, S.; Deneault, J.R.; Bash, D.; Mekki-Berrada, F.; Khan, S.A.; et al. Benchmarking the performance of Bayesian optimization across multiple experimental materials science domains. npj Comput. Mater. 2021, 7, 188. [Google Scholar] [CrossRef]
- Kapoor, S.; Cantrell, E.M.; Peng, K.; Pham, T.H.; Bail, C.A.; Gundersen, O.E.; Hofman, J.M.; Hullman, J.; Lones, M.A.; Malik, M.M.; Nanayakkara, P.; Poldrack, R.A.; Raji, I.D.; Roberts, M.; Salganik, M.J.; Serra-Garcia, M.; Stewart, B.M.; Vandewiele, G.; Narayanan, A. REFORMS: Consensus-based Recommendations for Machine-learning-based Science. Sci. Adv. 2024, 10, eadk3452. [Google Scholar] [CrossRef]
- Weber, L.M.; Saelens, W.; Cannoodt, R.; Soneson, C.; Hapfelmeier, A.; Gardner, P.P.; Boulesteix, A.-L.; Saeys, Y.; Robinson, M.D. Essential guidelines for computational method benchmarking. Genome Biol. 2019, 20, 125. [Google Scholar] [CrossRef]
- Yang, J.; Liang, E.; Su, Z.; Zou, Z.; Zhen, P.; Guo, J.; Ma, W.; An, K. DFF: Decision-Focused Fine-Tuning for Smarter Predict-Then-Optimize with Limited Data. Proc. AAAI Conf. Artif. Intell. 2025, 39, 26868–26876. [Google Scholar] [CrossRef]
- Noskov, F.; Fishkov, A.; Panov, M. Selective Nonparametric Regression via Testing. Proceedings of the 15th Asian Conference on Machine Learning; Proceedings of Machine Learning Research 2024, 222, 1023–1038. Available online: https://proceedings.mlr.press/v222/noskov24a.html.
- Geifman, Y.; El-Yaniv, R. SelectiveNet: A Deep Neural Network with an Integrated Reject Option. In Proceedings of the 36th International Conference on Machine Learning, PMLR 2019, 97. Long Beach, CA, USA, 9–15 June 2019; pp. 2151–2159. [Google Scholar]
- Geifman, Y.; El-Yaniv, R. Selective Classification for Deep Neural Networks. Advances in Neural Information Processing Systems, 2017; 30. Available online: https://proceedings.neurips.cc/paper/2017/hash/4a8423d5e91fda00bb7e46540e2b0cf1-Abstract.html.
- El-Yaniv, R.; Wiener, Y. On the Foundations of Noise-free Selective Classification. J. Mach. Learn. Res. 2010, 11, 1605–1641. Available online: https://www.jmlr.org/papers/v11/el-yaniv10a.html.
- Wang, J.Y.; Stevens, J.M.; Kariofillis, S.K.; Tom, M.-J.; Golden, D.L.; Li, J.; Tabora, J.E.; Parasram, M.; Shields, B.J.; Primer, D.N.; Hao, B.; Del Valle, D.; DiSomma, S.; Furman, A.; Zipp, G.G.; Melnikov, S.; Paulson, J.; Doyle, A.G. Identifying general reaction conditions by bandit optimization. Nature 2024, 626, 1025–1033. [Google Scholar] [CrossRef]
- Fitzner, M.; Šošić, A.; Hopp, A.V.; Müller, M.; Rihana, R.; Hrovatin, K.; Liebig, F.; Winkel, M.; Halter, W.; Brandenburg, J.G. BayBE: a Bayesian Back End for experimental planning in the low-to-no-data regime. Digit. Discov. 2025, 4, 1991–2000. [Google Scholar] [CrossRef]
- Won, H.J.; Choi, A.-j. Sustainable processing of agri-food by-products into food ingredients: an integrated review from pre-treatment to formulation. Front. Sustain. Food Syst. 2026, 10, 1841645. [Google Scholar] [CrossRef]
- Won, H.J. Laboratory-to-Industrial Translation in Plant-Derived Bioproduct Valorization: A Critical Integrative Review and Proposed Framework for Route-Level Evidence Assessment. Molecules 2026, 31, 3689. [Google Scholar] [CrossRef]
- Dimitrov, K.; Pradal, D.; Vauchel, P.; Baouche, B.; Nikov, I.; Dhulster, P. Modeling and optimization of extraction and energy consumption during ultrasound-assisted extraction of antioxidant polyphenols from pomegranate peels. Environ. Prog. Sustain. Energy 2019, 38, 13148. [Google Scholar] [CrossRef]
- Pradal, D.; Vauchel, P.; Decossin, S.; Dhulster, P.; Dimitrov, K. Kinetics of ultrasound-assisted extraction of antioxidant polyphenols from food by-products: Extraction and energy consumption optimization. Ultrason. Sonochem. 2016, 32, 137–146. [Google Scholar] [CrossRef]
- Joeres, R.; Blumenthal, D.B.; Kalinina, O.V. Data splitting to avoid information leakage with DataSAIL. Nat. Commun. 2025, 16, 3337. [Google Scholar] [CrossRef]
- Ayyildiz, S.S.; Pelvan, E.; Karadeniz, B. Optimization of accelerated solvent extraction, ultrasound assisted and supercritical fluid extraction to obtain carnosol, carnosic acid and rosmarinic acid from rosemary. Sustain. Chem. Pharm. 2024, 37, 101422. [Google Scholar] [CrossRef]
- Pavlić, B.; Vidović, S.; Vladić, J.; Radosavljević, R.; Cindrić, M.; Zeković, Z. Subcritical water extraction of sage (Salvia officinalis L.) by-products—Process optimization by response surface methodology. J. Supercrit. Fluids 2016, 116, 36–45. [Google Scholar] [CrossRef]
- Phucharoenrak, P.; Muangnoi, C.; Trachootham, D. A Green Extraction Method to Achieve the Highest Yield of Limonin and Hesperidin from Lime Peel Powder (Citrus aurantifolia). Molecules 2022, 27, 820. [Google Scholar] [CrossRef]
- Martínez-Zamora, L.; Bueso, M.C.; Kessler, M.; Zapata, R.; Gómez, P.A.; Artés-Hernández, F. Dataset for the publication entitled Optimization of Extraction Parameters for Phenolics Recovery from Avocado Peels Using Ultrasound and Microwave Technologies (Version 5) [Data set]. Zenodo 2025. [Google Scholar] [CrossRef]
- Giordano, M.; Pinela, J.; Dias, M.I.; Calhelha, R.C.; Stojković, D.; Soković, M.; Tavares, D.; Cánepa, A.L.; Ferreira, I.C.F.R.; Caleja, C.; Barros, L. Ultrasound-Assisted Extraction of Flavonoids from Kiwi Peel: Process Optimization and Bioactivity Assessment. Appl. Sci. 2021, 11, 6416. [Google Scholar] [CrossRef]
- Razola-Díaz, M.d.C.; Sevenich, R.; Rossi Ribeiro, L.; Guerra-Hernández, E.J.; Schlüter, O.; Verardo, V. Combined effect of pulse electric field and probe ultrasound technologies for obtaining phenolic compounds from orange by-product. LWT 2024, 198, 115950. [Google Scholar] [CrossRef]
- Kim, D.-S.; Lim, S.-B. Semi-Continuous Subcritical Water Extraction of Flavonoids from Citrus unshiu Peel: Their Antioxidant and Enzyme Inhibitory Activities. Antioxidants 2020, 9, 360. [Google Scholar] [CrossRef]
- Lim, S.-B. Organic Acid-Catalyzed Subcritical Water Hydrolysis of Immature Citrus unshiu Pomace. Foods 2022, 11, 18. [Google Scholar] [CrossRef]
- Nour, V.; Cicanci, A.; Corbu, A.R.; Rumeus, I.; Ceclu, L. Ultrasound-Assisted Extraction of Phenolics from Pear Pomace: Method Optimization, Phenolic Profile, and Antioxidant Capacity. Molecules 2026, 31, 1938. [Google Scholar] [CrossRef]
- Silva, A.R.; Ayuso, M.; Oludemi, T.; Gonçalves, A.; Melgar, B.; Barros, L. Response surface methodology and artificial neural network modeling as predictive tools for phenolic compounds recovery from olive pomace. Sep. Purif. Technol. 2024, 330, 125351. [Google Scholar] [CrossRef]
- Karling, M.; Bicas, T.C.; de Lima, V.A.; Oldoni, T.L.C. Grape and Apple Pomaces from Southern Brazil: Valorization of By-Products through Investigation of Their Antioxidant Potential. J. Braz. Chem. Soc. 2017, 28(10), 1857–1865. [Google Scholar] [CrossRef]
- Ramírez-Sucre, M.O.; Avilés-Betanzos, K.A.; López-Martínez, A.; Rodríguez-Buenfil, I.M. Evaluation of Polyphenol Profile from Citrus Peel Obtained by Natural Deep Eutectic Solvent/Ultrasound Extraction. Processes 2024, 12(10), 2072. [Google Scholar] [CrossRef]
- Gómez-Cruz, I.; Contreras, M.D.M.; Romero, I.; Castro, E. Sequential Extraction of Hydroxytyrosol, Mannitol and Triterpenic Acids Using a Green Optimized Procedure Based on Ultrasound. Antioxidants 2021, 10(11), 1781. [Google Scholar] [CrossRef]
- Melgar, B.; Dias, M.I.; Barros, L.; Ferreira, I.C.F.R.; Rodriguez-Lopez, A.D.; Garcia-Castello, E.M. Ultrasound and Microwave Assisted Extraction of Opuntia Fruit Peels Biocompounds: Optimization and Comparison Using RSM-CCD. Molecules 2019, 24(19), 3618. [Google Scholar] [CrossRef]
- Lu, Y.; Tang, H.; Chen, F.; Tang, W.; Dessie, W.; Liao, Y.; Qin, Z. Extraction and Biological Activity of Lignanoids from Magnolia officinalis Rehder & E.H.Wilson Residual Waste Biomass Using Deep Eutectic Solvents. Molecules 2024, 29, 2352. [Google Scholar] [CrossRef]
- Pavlić, B.; Bera, O.; Teslić, N.; Vidović, S.; Parpinello, G.; Zeković, Z. Chemical profile and antioxidant activity of sage herbal dust extracts obtained by supercritical fluid extraction. Ind. Crops Prod. 2018, 120, 305–312. [Google Scholar] [CrossRef]
- Rasmussen, C.E.; Williams, C.K.I. Gaussian Processes for Machine Learning; The MIT Press: Cambridge, MA, USA, 2006; Available online: https://gaussianprocess.org/gpml/.
- Breiman, L. Random Forests. Mach. Learn. 2001, 45, 5–32. [Google Scholar] [CrossRef]
- Geurts, P.; Ernst, D.; Wehenkel, L. Extremely randomized trees. Mach. Learn. 2006, 63, 3–42. [Google Scholar] [CrossRef]
- Cawley, G.C.; Talbot, N.L.C. On Over-fitting in Model Selection and Subsequent Selection Bias in Performance Evaluation. J. Mach. Learn. Res. 2010, 11, 2079–2107. Available online: https://www.jmlr.org/papers/v11/cawley10a.html.
- Kapoor, S.; Narayanan, A. Leakage and the reproducibility crisis in machine-learning-based science. Patterns 2023, 4, 100804. [Google Scholar] [CrossRef]
- Pedregosa, F.; Varoquaux, G.; Gramfort, A.; Michel, V.; Thirion, B.; Grisel, O.; Blondel, M.; Prettenhofer, P.; Weiss, R.; Dubourg, V.; et al. Scikit-learn: Machine Learning in Python. J. Mach. Learn. Res. 2011, 12, 2825–2830. Available online: https://www.jmlr.org/papers/v12/pedregosa11a.html.
- Bengio, Y.; Grandvalet, Y. No Unbiased Estimator of the Variance of K-Fold Cross-Validation. J. Mach. Learn. Res. 2004, 5, 1089–1105. Available online: https://www.jmlr.org/papers/v5/grandvalet04a.html.
- Irakli, M.; Skendi, A.; Bouloumpasi, E.; Chatzopoulou, P.; Biliaderis, C.G. LC-MS Identification and Quantification of Phenolic Compounds in Solid Residues from the Essential Oil Industry. Antioxidants 2021, 10(12). [Google Scholar] [CrossRef]
- Carbone, K.; Amoriello, T.; Iadecola, R. Exploitation of Kiwi Juice Pomace for the Recovery of Natural Antioxidants through Microwave-Assisted Extraction. Agriculture 2020, 10, 435. [Google Scholar] [CrossRef]
- Ghattas, B.; Manzon, D. Machine Learning Alternatives to Response Surface Models. Mathematics 2023, 11, 3406. [Google Scholar] [CrossRef]
- Gardner, J.R.; Kusner, M.J.; Xu, Z.; Weinberger, K.Q.; Cunningham, J.P. Bayesian Optimization with Inequality Constraints. In Proceedings of the 31st International Conference on Machine Learning PMLR 2014, Beijing, China, 21–26 June 2014; 32, pp. 937–945. Available online: https://proceedings.mlr.press/v32/gardner14.html.
- Gelbart, M.A.; Snoek, J.; Adams, R.P. Bayesian Optimization with Unknown Constraints. In Proceedings of the 30th Conference on Uncertainty in Artificial Intelligence; Quebec City, Canada, Zhang, N.L., Tian, J., Eds.; AUAI Press, 23–27 July 2014; pp. 250–259. Available online: https://www.auai.org/uai2014/proceedings/individuals/107.pdf.
- Guyot, S.; Marnet, N.; Drilleau, J.-F. Thiolysis–HPLC Characterization of Apple Procyanidins Covering a Large Range of Polymerization States. J. Agric. Food Chem. 2001, 49, 14–20. [Google Scholar] [CrossRef]
- Chamorro, S.; Viveros, A.; Alvarez, I.; Vega, E.; Brenes, A. Changes in polyphenol and polysaccharide content of grape seed extract and grape pomace after enzymatic treatment. Food Chem. 2012, 133, 308–314. [Google Scholar] [CrossRef]
- Bouthillier, X.; Delaunay, P.; Bronzi, M.; Trofimov, A.; Nichyporuk, B.; Szeto, J.; Mohammadi Sepahvand, N.; Raff, E.; Madan, K.; Voleti, V.; et al. Accounting for Variance in Machine Learning Benchmarks. Proc. Mach. Learn. Syst. 2021, 3, 747–769. Available online: https://proceedings.mlsys.org/paper_files/paper/2021/hash/0184b0cd3cfb185989f858a1d9f5c1eb-Abstract.html.
- Hurst, W.J.; Stanley, B.; Glinski, J.A.; Davey, M.; Payne, M.J.; Stuart, D.A. Characterization of Primary Standards for Use in the HPLC Analysis of the Procyanidin Content of Cocoa and Chocolate Containing Products. Molecules 2009, 14, 4136–4146. [Google Scholar] [CrossRef]
- Vabalas, A.; Gowen, E.; Poliakoff, E.; Casson, A.J. Machine learning algorithm validation with a limited sample size. PLoS ONE 2019, 14, e0224365. [Google Scholar] [CrossRef]
- Varma, S.; Simon, R. Bias in error estimation when using cross-validation for model selection. BMC Bioinform. 2006, 7, 91. [Google Scholar] [CrossRef]
- Bartlett, P.L.; Wegkamp, M.H. Classification with a Reject Option using a Hinge Loss. J. Mach. Learn. Res. 2008, 9, 1823–1840. Available online: https://jmlr.org/papers/v9/bartlett08a.html.
- EFSA Panel on Additives; Products or Substances used in Animal Feed (FEEDAP). Safety and efficacy of two solvent extracts of rosemary (Rosmarinus officinalis L.) when used as feed additive for cats and dogs (Kemin Nutrisurance Europe SRL). EFSA J. 2022, 20(1), e06978. [Google Scholar] [CrossRef]
- European Commission. Commission Implementing Regulation (EU) 2024/1068 of 12 April 2024 concerning the authorisation of a preparation of rosemary extract as a feed additive for cats and dogs. Off. J. Eur. Union 2024, L 2024/1068. Available online: https://eur-lex.europa.eu/eli/reg_impl/2024/1068/oj/eng.
Figure 1.
Design and evaluation workflow of the original benchmark comprising D1–D22. Responses at identical factor settings were averaged before conditions were split into training and candidate sets within each dataset. The seven primary datasets contributed 130 unique condition entries, and the 15 secondary datasets contributed 217, counted within their respective datasets. The 7,261 main evaluation problems reused these conditions in overlapping splits and were not independent experimental replicates. Primary status indicates compatibility with the primary-analysis criteria; it does not establish complete analytical validation or independence of material batches. The workflow covers ten established model configurations. Supplementary multilayer perceptron (MLP) comparisons and subsequent dataset extensions were evaluated separately (Table S12–S27). Models were fitted and thresholds were defined using training data; held-out candidate responses were used only to score recommendations. Both selection rules were evaluated against identical measured target amount or concentration and panel-share requirements. With predictions, candidate sets, and ranking fixed, the composition-constrained rule restricts eligibility to a subset of the candidates eligible under the amount-only rule and therefore cannot increase recommendation coverage. Attainment can increase or decrease through candidate switching, whereas additional abstention can only preserve or reduce attainment.
Figure 1.
Design and evaluation workflow of the original benchmark comprising D1–D22. Responses at identical factor settings were averaged before conditions were split into training and candidate sets within each dataset. The seven primary datasets contributed 130 unique condition entries, and the 15 secondary datasets contributed 217, counted within their respective datasets. The 7,261 main evaluation problems reused these conditions in overlapping splits and were not independent experimental replicates. Primary status indicates compatibility with the primary-analysis criteria; it does not establish complete analytical validation or independence of material batches. The workflow covers ten established model configurations. Supplementary multilayer perceptron (MLP) comparisons and subsequent dataset extensions were evaluated separately (Table S12–S27). Models were fitted and thresholds were defined using training data; held-out candidate responses were used only to score recommendations. Both selection rules were evaluated against identical measured target amount or concentration and panel-share requirements. With predictions, candidate sets, and ranking fixed, the composition-constrained rule restricts eligibility to a subset of the candidates eligible under the amount-only rule and therefore cannot increase recommendation coverage. Attainment can increase or decrease through candidate switching, whereas additional abstention can only preserve or reduce attainment.
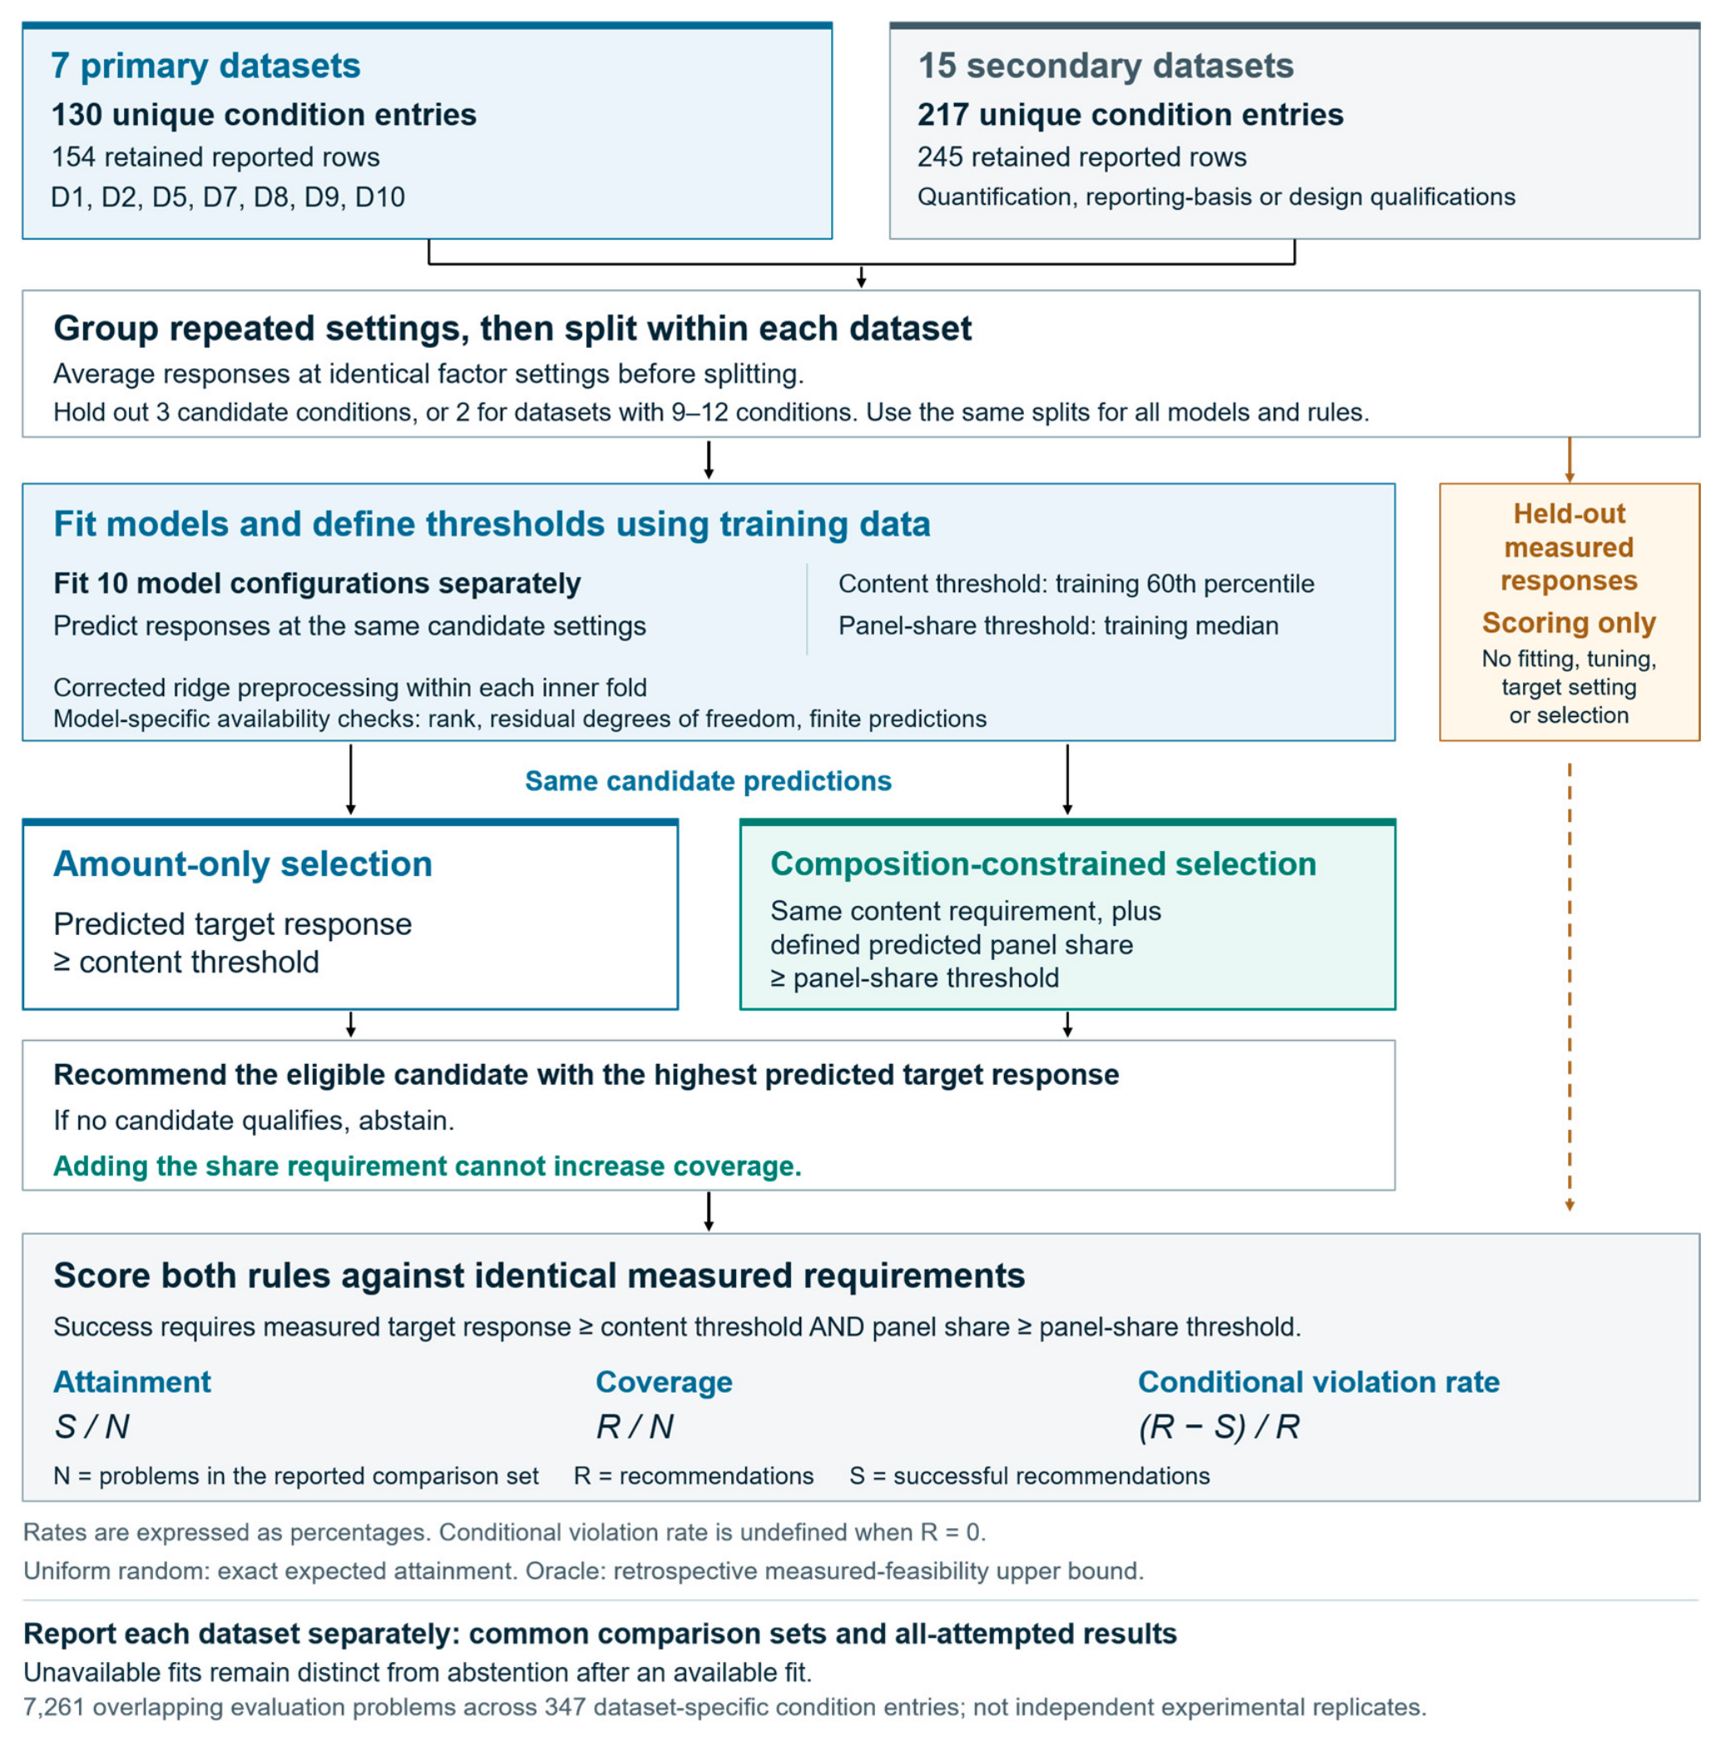
Figure 2.
Relationship between target compound amount or concentration and its share within the measured analytical panel across the seven original primary datasets. Each point represents one unique extraction condition after repeated factor settings were grouped within each dataset. The number of unique conditions (n) and Spearman’s rank correlation coefficient (ρ) are shown below each panel. Units, calibration qualifications, and the compounds included in each panel denominator are specific to each dataset (Table 1 and Table S2). The correlations describe associations across the measured conditions and do not represent evidence from independent material batches. The target response is also used to calculate panel share, so the two plotted quantities are mathematically coupled. Their correlation alone therefore does not establish an extraction mechanism. Panel share indicates relative composition within the measured panel, not overall extract purity. H, hesperidin; N, narirutin; C, catechin; Q, quercetin; Lim, limonin; B1, procyanidin B1; EC, epicatechin; UAE, ultrasound-assisted extraction; MAE, microwave-assisted extraction; HVED, high-voltage electrical discharge.
Figure 2.
Relationship between target compound amount or concentration and its share within the measured analytical panel across the seven original primary datasets. Each point represents one unique extraction condition after repeated factor settings were grouped within each dataset. The number of unique conditions (n) and Spearman’s rank correlation coefficient (ρ) are shown below each panel. Units, calibration qualifications, and the compounds included in each panel denominator are specific to each dataset (Table 1 and Table S2). The correlations describe associations across the measured conditions and do not represent evidence from independent material batches. The target response is also used to calculate panel share, so the two plotted quantities are mathematically coupled. Their correlation alone therefore does not establish an extraction mechanism. Panel share indicates relative composition within the measured panel, not overall extract purity. H, hesperidin; N, narirutin; C, catechin; Q, quercetin; Lim, limonin; B1, procyanidin B1; EC, epicatechin; UAE, ultrasound-assisted extraction; MAE, microwave-assisted extraction; HVED, high-voltage electrical discharge.
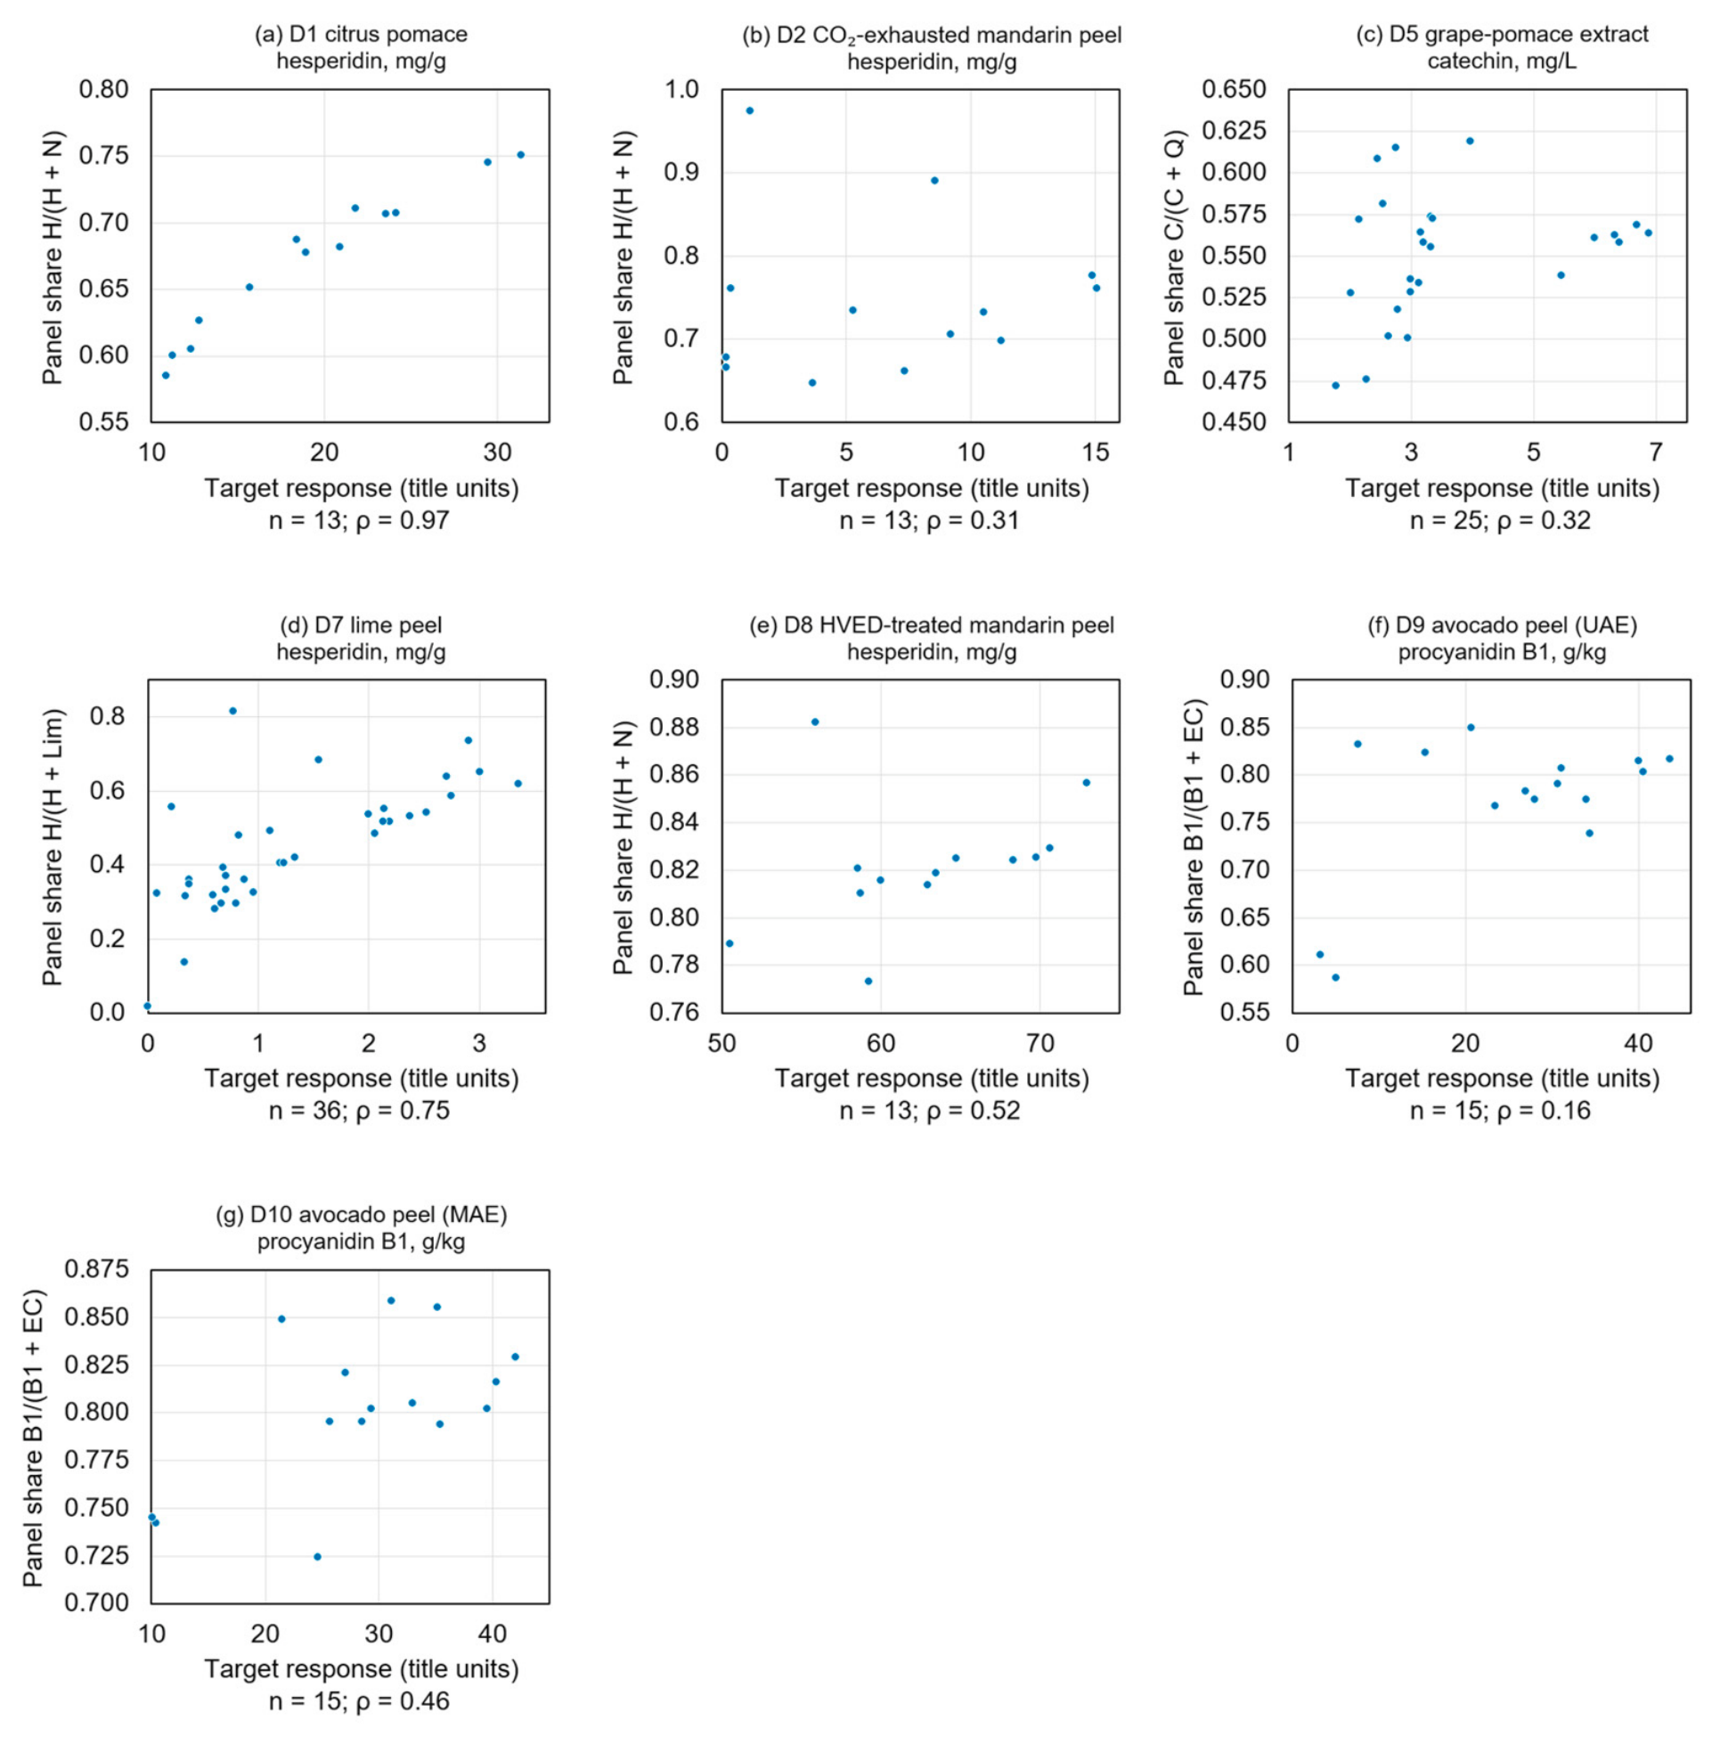
Figure 3.
Paired comparison of selection rules for five focal models across the seven original primary datasets. Panels show (a) attainment, (b) coverage, and (c) conditional violation rate. Open and filled markers represent amount-only and composition-constrained selection, respectively; lines connect results for the same model and dataset. GP denotes the default configuration. Within each dataset, both rules and all five models use the same common set of N evaluation problems, defined by the availability of RQ, default GP, RF, and ET predictions; N is shown below each dataset label. Both rules are evaluated against identical measured requirements: target amount or concentration ≥ the training 60th percentile and panel share ≥ the training median. A recommendation is successful only when both requirements are met. With R recommendations and S successful recommendations, attainment, coverage, and conditional violation rate are , , and , respectively, expressed as percentages. Conditional violation rate is undefined when R = 0. Because the rules can yield recommendations for different subsets of problems, a lower conditional violation rate alone does not imply higher attainment. Ridge FQ uses the corrected preprocessing procedure. These comparisons are descriptive: overlapping evaluation problems are not independent experimental replicates.
Figure 3.
Paired comparison of selection rules for five focal models across the seven original primary datasets. Panels show (a) attainment, (b) coverage, and (c) conditional violation rate. Open and filled markers represent amount-only and composition-constrained selection, respectively; lines connect results for the same model and dataset. GP denotes the default configuration. Within each dataset, both rules and all five models use the same common set of N evaluation problems, defined by the availability of RQ, default GP, RF, and ET predictions; N is shown below each dataset label. Both rules are evaluated against identical measured requirements: target amount or concentration ≥ the training 60th percentile and panel share ≥ the training median. A recommendation is successful only when both requirements are met. With R recommendations and S successful recommendations, attainment, coverage, and conditional violation rate are , , and , respectively, expressed as percentages. Conditional violation rate is undefined when R = 0. Because the rules can yield recommendations for different subsets of problems, a lower conditional violation rate alone does not imply higher attainment. Ridge FQ uses the corrected preprocessing procedure. These comparisons are descriptive: overlapping evaluation problems are not independent experimental replicates.
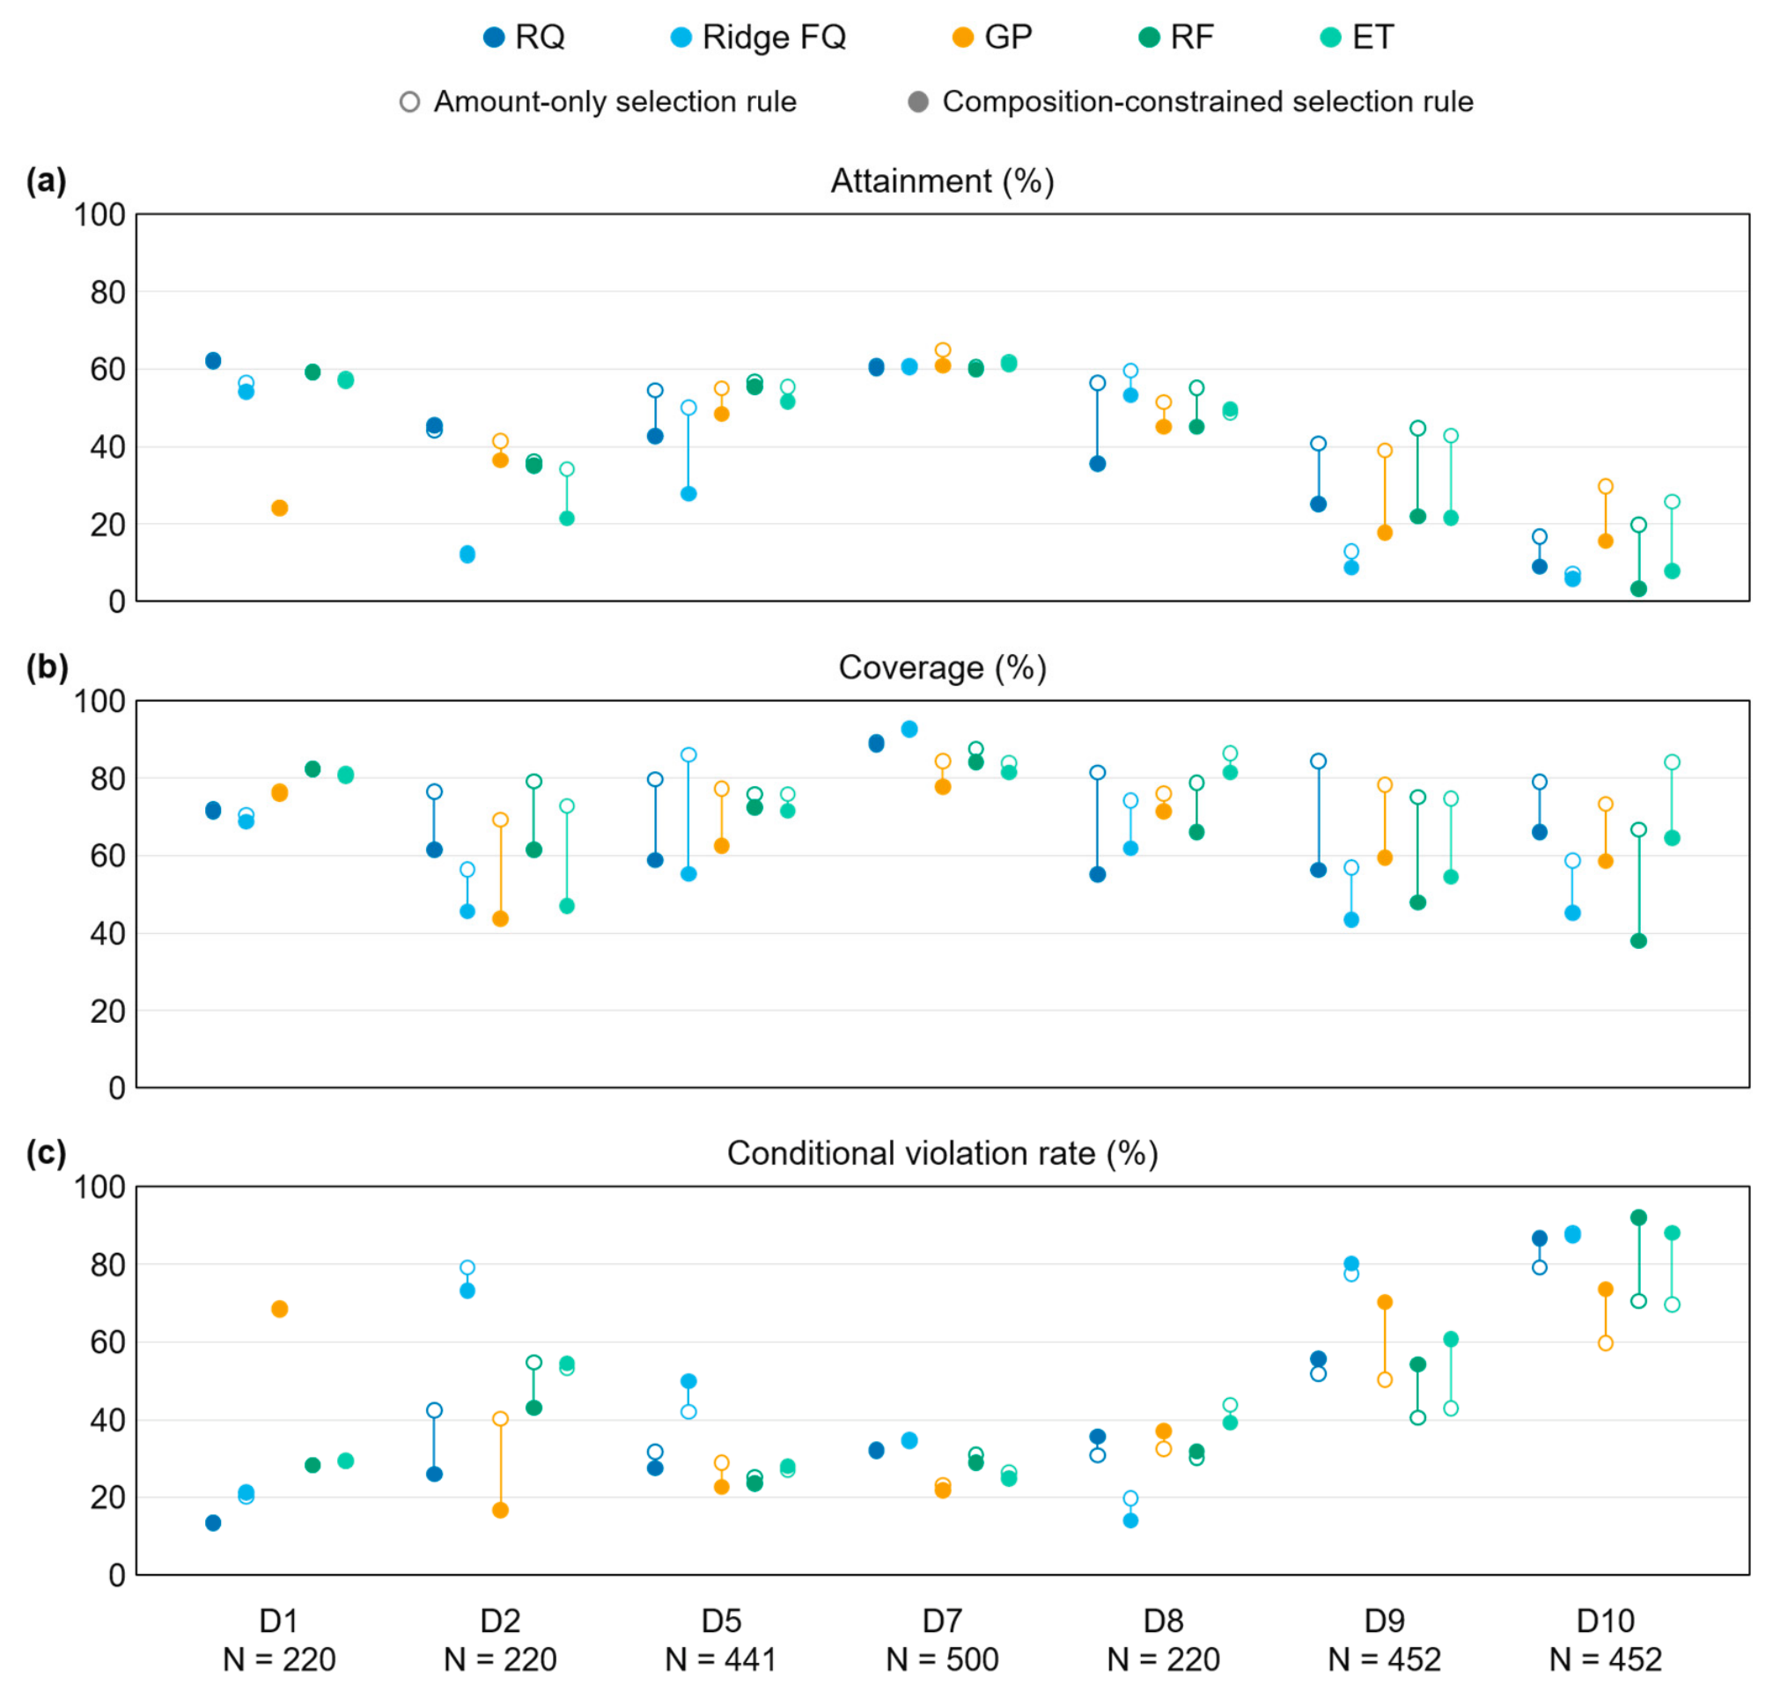
Figure 4.
Attainment under the composition-constrained selection rule for ten model configurations in the seven original primary datasets. Bars show the percentage of evaluation problems yielding a successful recommendation. Within each dataset, all models use the same fixed common set of N problems, defined by the availability of RQ, default GP, RF, and ET predictions; N is shown in each panel title. Success requires both a measured target amount or concentration ≥ the training 60th percentile and a measured panel share ≥ the training median. Unavailable fits for additional comparators remain in N but contribute neither recommendations nor successes. The label n/a indicates that FQ was unavailable throughout the comparison set; it does not denote 0% attainment from available fits or abstention by a fitted model. Orange dotted lines show the exact expected attainment of uniform random selection from the full candidate set in every problem (100% coverage). Gray dashed lines show the oracle: the percentage of problems containing at least one candidate meeting both measured requirements. This retrospective upper bound uses candidate measurements and is not a predictor available for prospective selection. Mean denotes the training-mean baseline, and GP denotes the default GP configuration. MLP results are reported separately in Table S21. Overlapping evaluation problems are not independent experimental replicates, and these results do not establish a general model ranking across datasets.
Figure 4.
Attainment under the composition-constrained selection rule for ten model configurations in the seven original primary datasets. Bars show the percentage of evaluation problems yielding a successful recommendation. Within each dataset, all models use the same fixed common set of N problems, defined by the availability of RQ, default GP, RF, and ET predictions; N is shown in each panel title. Success requires both a measured target amount or concentration ≥ the training 60th percentile and a measured panel share ≥ the training median. Unavailable fits for additional comparators remain in N but contribute neither recommendations nor successes. The label n/a indicates that FQ was unavailable throughout the comparison set; it does not denote 0% attainment from available fits or abstention by a fitted model. Orange dotted lines show the exact expected attainment of uniform random selection from the full candidate set in every problem (100% coverage). Gray dashed lines show the oracle: the percentage of problems containing at least one candidate meeting both measured requirements. This retrospective upper bound uses candidate measurements and is not a predictor available for prospective selection. Mean denotes the training-mean baseline, and GP denotes the default GP configuration. MLP results are reported separately in Table S21. Overlapping evaluation problems are not independent experimental replicates, and these results do not establish a general model ranking across datasets.
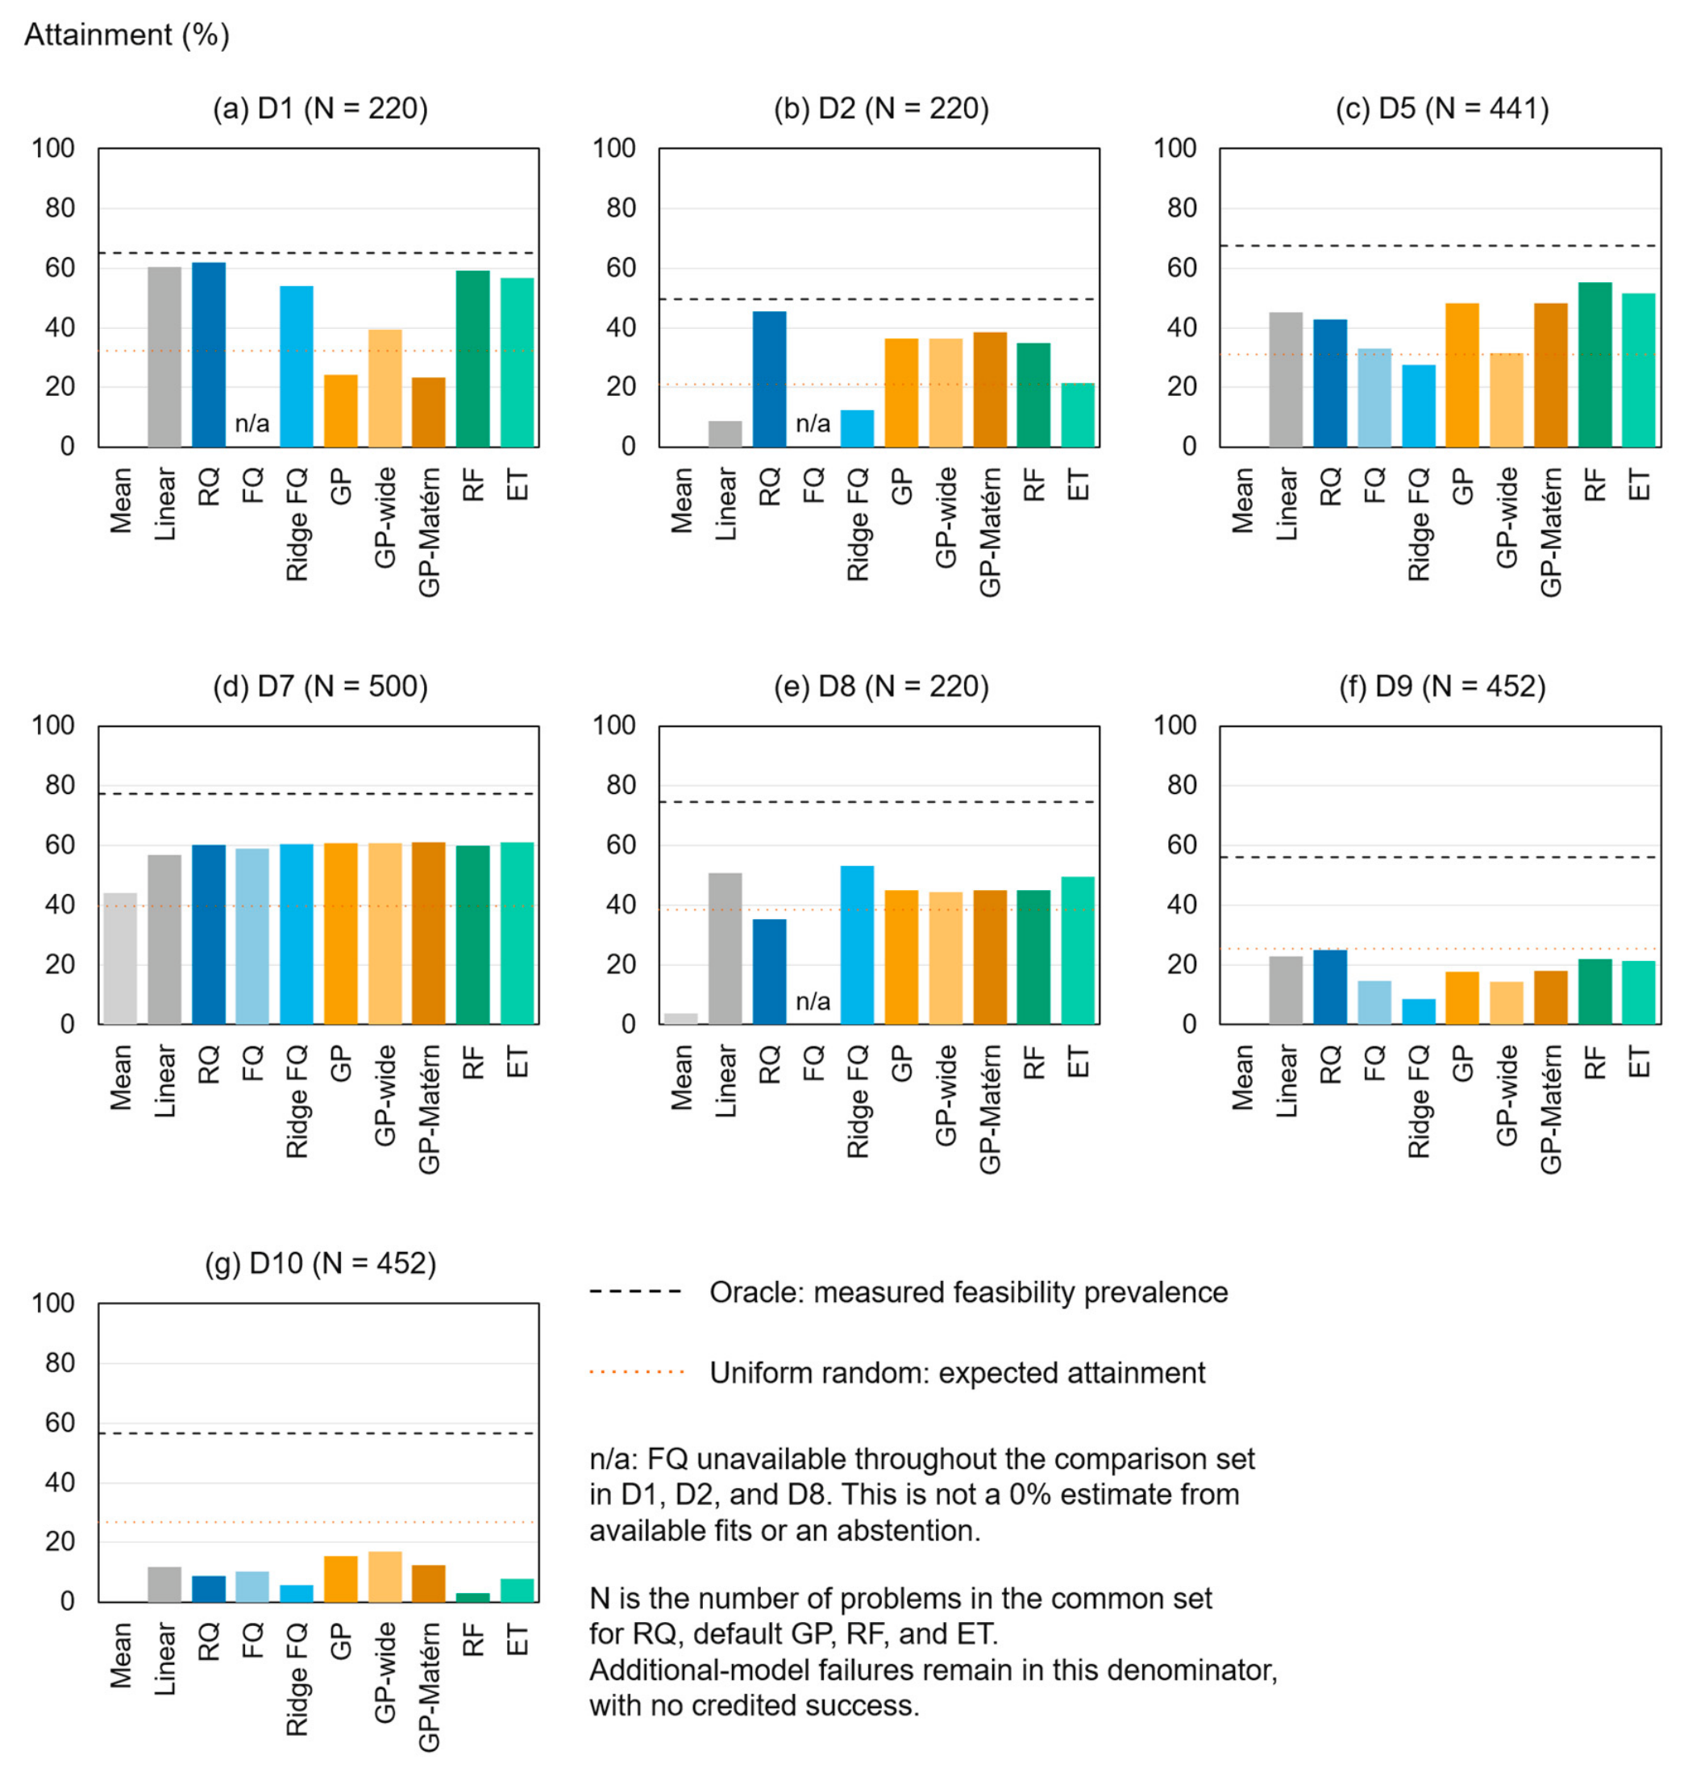
Figure 5.
Sensitivity of attainment to the numbers of training conditions and candidates under the composition-constrained selection rule. Attainment is the percentage of attempted problems yielding a successful recommendation; N denotes the number of attempted problems. Panels (a–d) correspond to D5, D7, D12, and D13, respectively, and show results for RQ, ridge FQ, default GP, and RF on the same 100 candidate problems per dataset across training budgets. Fixed thresholds were calculated from all noncandidate conditions, including those outside smaller fitting subsets: the 60th percentile for target amount or concentration and the median for panel share. Both measured requirements had to be met for success. Because candidates and thresholds were fixed, the oracle upper bound was unchanged across budgets on the full 100-problem set. Unavailable fits remain in the denominator but contribute neither recommendations nor successes; they are distinguished from abstention by a fitted model. RQ availability ranges are annotated. Panel (e) compares fixed thresholds (solid lines) with thresholds recalculated within each fitting subset (dashed lines) for RQ and RF in D5. Panel (f) compares three-candidate evaluations (500 problems per dataset) with six-candidate evaluations (200 problems per dataset) in D5 and D7; k denotes the number of candidates. The corresponding training-condition counts are 22 and 19 for D5 and 33 and 30 for D7, respectively. This comparison changes the candidate choices, training-set size, and training-derived thresholds. Thus, panels (e) and (f) do not isolate changes in predictive performance. GP denotes the default configuration, and ridge FQ uses the corrected preprocessing procedure.
Figure 5.
Sensitivity of attainment to the numbers of training conditions and candidates under the composition-constrained selection rule. Attainment is the percentage of attempted problems yielding a successful recommendation; N denotes the number of attempted problems. Panels (a–d) correspond to D5, D7, D12, and D13, respectively, and show results for RQ, ridge FQ, default GP, and RF on the same 100 candidate problems per dataset across training budgets. Fixed thresholds were calculated from all noncandidate conditions, including those outside smaller fitting subsets: the 60th percentile for target amount or concentration and the median for panel share. Both measured requirements had to be met for success. Because candidates and thresholds were fixed, the oracle upper bound was unchanged across budgets on the full 100-problem set. Unavailable fits remain in the denominator but contribute neither recommendations nor successes; they are distinguished from abstention by a fitted model. RQ availability ranges are annotated. Panel (e) compares fixed thresholds (solid lines) with thresholds recalculated within each fitting subset (dashed lines) for RQ and RF in D5. Panel (f) compares three-candidate evaluations (500 problems per dataset) with six-candidate evaluations (200 problems per dataset) in D5 and D7; k denotes the number of candidates. The corresponding training-condition counts are 22 and 19 for D5 and 33 and 30 for D7, respectively. This comparison changes the candidate choices, training-set size, and training-derived thresholds. Thus, panels (e) and (f) do not isolate changes in predictive performance. GP denotes the default configuration, and ridge FQ uses the corrected preprocessing procedure.
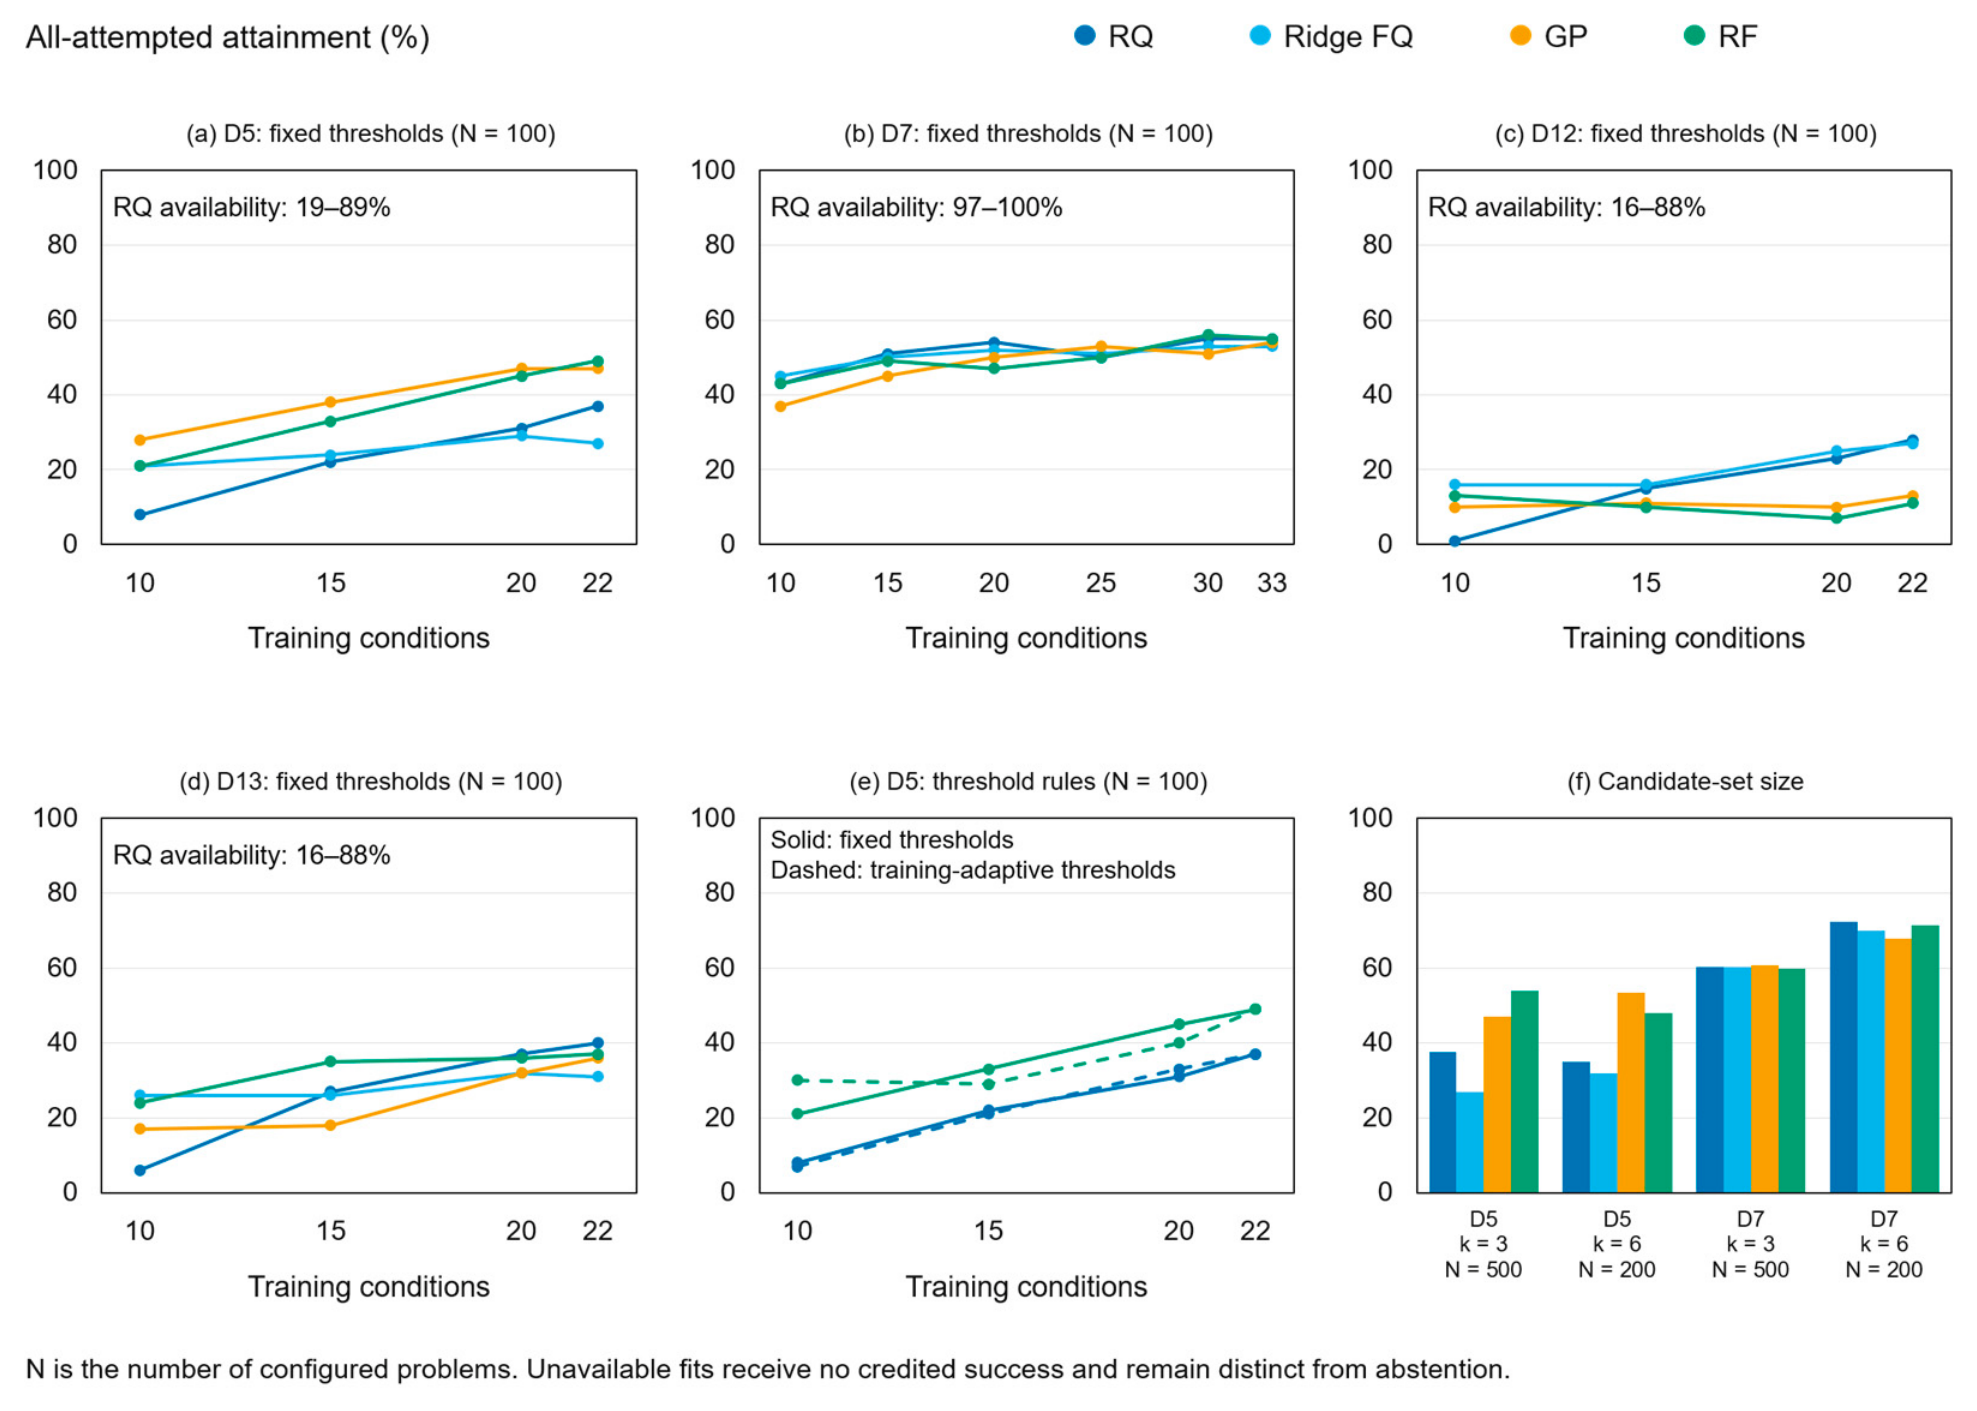
Table 1.
Source datasets and measured composition panels in the original benchmark.
| ID | Ref. | Material and extraction method | Design; factors; retained rows/unique conditionsa | Target response and reporting basis | Target share within the measured panelb | Analytical role and qualificationsc |
|---|---|---|---|---|---|---|
| D1 | [4] | Immature Citrus unshiu pomace; extraction with ethanol/water and shaking | BBD; 3; 17/13 | Hesperidin; mg g−1 dry pomace | Primary: mass-based content | |
| D2 | [5] | Mandarin peel after CO2 extraction; subcritical water extraction | BBD; 3; 17/13 | Hesperidin; mg g−1 exhausted peel | Primary: mass-based content | |
| D5 | [9] | Wine grape pomace; extraction with an aqueous surfactant | BBD; 4; 27/25 | Catechin; mg L−1 extract | Primary: extract concentration | |
| D7 | [62] | Lime peel powder (juice factory); extraction with pH-adjusted ethanol/water | Full factorial 4 × 3 × 3; 3; 36/36 | Hesperidin; mg g−1 dry peel | Primary: mass-based content | |
| D8 | [6] | Mandarin (Okitsu) peel; high-voltage electrical discharge in water | BBD; 3; 17/13 | Hesperidin; mg g−1 freeze-dried peel | Primary: mass-based content | |
| D9 | [10] | Avocado peel (guacamole production); probe ultrasound extraction | CCD; 3; 20/15 | Procyanidin B1; g kg−1 dry peel | Primary: mass-based content | |
| D10 | [10] | Avocado peel (same study as D9); microwave extraction | CCD; 3; 20/15 | Procyanidin B1; g kg−1 dry peel | Primary: mass-based content | |
| D3 | [7] | Apple pomace; sonotrode ultrasound extraction | BBD; 3; 15/13 | Phloridzin; µg g−1 dry weight as reported | Secondary: uncertainty in source reporting | |
| D4 | [13] | Pomegranate pericarp; supercritical fluid extraction | BBD; 3; 17/13 | Punicalagin α + β; mg EA eq. g−1 biomass | index | Secondary: assay-equivalent quantification |
| D6 | [14] | Previously extracted pomegranate peel; alkaline hydrolysis | CCD; 3; 20/15 | Ellagic acid; mg/100 g dry peel | Secondary: hydrolysis | |
| D11 | [64] | Kiwi peel; probe ultrasound extraction | CCRD; 3; 20/15 | Epicatechin; mg g−1 dry peel (catechin eq.) | Secondary: assay-equivalent quantification | |
| D12 | [11] | Seeds from grape marc; extraction assisted by pectinase (Lallzyme EX-V) | BBD; 4; 27/25 | Flavan-3-ol sum; mg kg−1 dry seeds | Secondary: group sum, surrogate calibration | |
| D13 | [11] | Seeds from grape marc (same study as D12); extraction assisted by pectinase (Lallzyme HC) | BBD; 4; 27/25 | Flavan-3-ol sum; mg kg−1 dry seeds | Secondary: group sum, surrogate calibration | |
| D14 | [65] | Orange peel (juice industry); pulsed electric field with fixed ultrasound conditions | BBD; 3; 15/13 | Hesperidin; µg g−1 dry weight (equivalents) | Secondary: assay-equivalent quantification | |
| D15 | [15] | Elderberry press cake; microwave extraction | Full factorial 5 × 2; 2; 10/10 | Cyanidin-3-O-glucoside; mg g−1 dried extract | Secondary: dried extract basis, few conditions | |
| D16 | [15] | Elderberry press cake (same study as D15); ultrasound extraction | Grid 5 × 3 (13 of 15 cells); 2; 13/13 | Cyanidin-3-O-glucoside; mg g−1 dried extract | Secondary: dried extract basis | |
| D17 | [66] | Mature C. unshiu peel; semicontinuous subcritical water extraction | CCD; 2; 11/9 | Hesperidin; µg g−1 dry peel | Secondary: conversion, few conditions | |
| D18 | [67] | Immature C. unshiu pomace; hydrolysis with citric acid in subcritical water | CCD; 2; 13/9 | Hesperetin-7-O-glucoside; mg g−1 sample | Secondary: hydrolysis, few conditions | |
| D19 | [68] | Pear pomace; ultrasound bath extraction at fixed power | Grid 3 × 3; 2; 9/9 | Chlorogenic acid; mg L−1 extract | Secondary: extract concentration, few conditions | |
| D20 | [16] | Black raspberry pomace; sonotrode ultrasound extraction | Grid 3 × 5 (13 of 15 cells); 2; 13/13 | Cyanidin-3-O-rutinoside; mg g−1 dry pomace | Secondary: grid design | |
| D21 | [12] | Blueberry pomace; high-voltage electrical discharge with two solvents | Grid 3 × 3 × 2; 3; 17/17 | Chlorogenic acid; µg g−1 dry pomace | Secondary: categorical solvent | |
| D22 | [12] | Blueberry pomace (same study as D21); pulsed electric field with two solvents | Grid 3 × 3 × 2; 3; 18/18 | Chlorogenic acid; µg g−1 dry pomace | Secondary: categorical solvent |
a Design entries list the design type, number of factors, and number of retained data rows/unique extraction conditions. Across the 22 datasets, 399 of 400 reported rows were retained. One D21 row was excluded because of an unresolved concern about source reporting (Section 2.2). The 347 unique-condition entries are summed within datasets and should not be interpreted as 347 independent physical experiments. BBD, Box–Behnken design; CCD, central composite design; CCRD, central composite rotatable design. b Shares describe only the measured panel, not overall extract purity; D4 is an assay-equivalent index. H, hesperidin; N, narirutin; C, catechin; Q, quercetin; EC, epicatechin; PZ, phloridzin; PT, phloretin; EA, ellagic acid; PNG, punicalagin; F3O, sum of the identified flavan-3-ols; GA, gallic acid; CGA, chlorogenic acid; C3Glu, cyanidin-3-O-glucoside; C3Rut, cyanidin-3-O-rutinoside; H7G, hesperetin-7-O-glucoside; HT, hesperetin; B1, procyanidin B1; dimer, procyanidin B-type dimer (catechin equivalents); eq., equivalents. c Primary classification indicates compatibility with the criteria for the primary analysis, without implying complete analytical validation. Shared study and material provenance do not establish batch independence. D9/D10 retain the qualifications concerning source units and limits of quantification. Full chemical definitions and qualifications are provided in Table S2 and the chemical decision table. D33 is the only medicinal source compatible with the primary analysis within D1–D39; D41, the later dataset on sage herbal dust, is evaluated separately with qualifications specific to its source. D38–D40 remain secondary analyses with stated qualifications.
Table 2.
Paired comparison of selection rules at the main evaluation thresholds.
| Dataset | Model | N | Attainment (%) |
Coverage (%) |
Conditional violation rate (%) |
Δ attainment (pp) |
Successes gained/lost |
|---|---|---|---|---|---|---|---|
| D1 | RQ | 220 | 62.3 → 61.8 | 71.8 → 71.4 | 13.3 → 13.4 | -0.5 | 0/1 |
| D1 | Ridge FQ | 220 | 56.4 → 54.1 | 70.5 → 68.6 | 20.0 → 21.2 | -2.3 | 0/5 |
| D1 | GP | 220 | 24.1 → 24.1 | 76.4 → 75.9 | 68.5 → 68.3 | +0.0 | 0/0 |
| D1 | RF | 220 | 59.1 → 59.1 | 82.3 → 82.3 | 28.2 → 28.2 | +0.0 | 0/0 |
| D1 | ET | 220 | 57.3 → 56.8 | 80.9 → 80.5 | 29.2 → 29.4 | -0.5 | 0/1 |
| D2 | RQ | 220 | 44.1 → 45.5 | 76.4 → 61.4 | 42.3 → 25.9 | +1.4 | 4/1 |
| D2 | Ridge FQ | 220 | 11.8 → 12.3 | 56.4 → 45.5 | 79.0 → 73.0 | +0.5 | 4/3 |
| D2 | GP | 220 | 41.4 → 36.4 | 69.1 → 43.6 | 40.1 → 16.7 | -5.0 | 2/13 |
| D2 | RF | 220 | 35.9 → 35.0 | 79.1 → 61.4 | 54.6 → 43.0 | -0.9 | 5/7 |
| D2 | ET | 220 | 34.1 → 21.4 | 72.7 → 46.8 | 53.1 → 54.4 | -12.7 | 1/29 |
| D5 | RQ | 441 | 54.4 → 42.6 | 79.6 → 58.7 | 31.6 → 27.4 | -11.8 | 8/60 |
| D5 | Ridge FQ | 441 | 49.9 → 27.7 | 85.9 → 55.1 | 42.0 → 49.8 | -22.2 | 4/102 |
| D5 | GP | 441 | 54.9 → 48.3 | 77.1 → 62.4 | 28.8 → 22.5 | -6.6 | 10/39 |
| D5 | RF | 441 | 56.7 → 55.3 | 75.7 → 72.3 | 25.1 → 23.5 | -1.4 | 1/7 |
| D5 | ET | 441 | 55.3 → 51.5 | 75.7 → 71.4 | 26.9 → 27.9 | -3.9 | 0/17 |
| D7 | RQ | 500 | 60.8 → 60.2 | 89.2 → 88.6 | 31.8 → 32.1 | -0.6 | 0/3 |
| D7 | Ridge FQ | 500 | 60.8 → 60.4 | 92.6 → 92.4 | 34.3 → 34.6 | -0.4 | 0/2 |
| D7 | GP | 500 | 64.8 → 60.8 | 84.2 → 77.6 | 23.0 → 21.6 | -4.0 | 0/20 |
| D7 | RF | 500 | 60.4 → 59.8 | 87.4 → 84.0 | 30.9 → 28.8 | -0.6 | 0/3 |
| D7 | ET | 500 | 61.8 → 61.2 | 83.8 → 81.4 | 26.3 → 24.8 | -0.6 | 0/3 |
| D8 | RQ | 220 | 56.4 → 35.5 | 81.4 → 55.0 | 30.7 → 35.5 | -20.9 | 1/47 |
| D8 | Ridge FQ | 220 | 59.5 → 53.2 | 74.1 → 61.8 | 19.6 → 14.0 | -6.4 | 3/17 |
| D8 | GP | 220 | 51.4 → 45.0 | 75.9 → 71.4 | 32.3 → 36.9 | -6.4 | 0/14 |
| D8 | RF | 220 | 55.0 → 45.0 | 78.6 → 65.9 | 30.1 → 31.7 | -10.0 | 5/27 |
| D8 | ET | 220 | 48.6 → 49.5 | 86.4 → 81.4 | 43.7 → 39.1 | +0.9 | 6/4 |
| D9 | RQ | 452 | 40.7 → 25.0 | 84.3 → 56.2 | 51.7 → 55.5 | -15.7 | 6/77 |
| D9 | Ridge FQ | 452 | 12.8 → 8.6 | 56.9 → 43.4 | 77.4 → 80.1 | -4.2 | 3/22 |
| D9 | GP | 452 | 38.9 → 17.7 | 78.1 → 59.3 | 50.1 → 70.1 | -21.2 | 0/96 |
| D9 | RF | 452 | 44.7 → 21.9 | 75.0 → 47.8 | 40.4 → 54.2 | -22.8 | 0/103 |
| D9 | ET | 452 | 42.7 → 21.5 | 74.6 → 54.4 | 42.7 → 60.6 | -21.2 | 0/96 |
| D10 | RQ | 452 | 16.6 → 8.8 | 79.0 → 65.9 | 79.0 → 86.6 | -7.7 | 1/36 |
| D10 | Ridge FQ | 452 | 7.1 → 5.8 | 58.6 → 45.1 | 87.9 → 87.3 | -1.3 | 3/9 |
| D10 | GP | 452 | 29.6 → 15.5 | 73.2 → 58.4 | 59.5 → 73.5 | -14.2 | 1/65 |
| D10 | RF | 452 | 19.7 → 3.1 | 66.6 → 37.8 | 70.4 → 91.8 | -16.6 | 0/75 |
| D10 | ET | 452 | 25.7 → 7.7 | 84.1 → 64.4 | 69.5 → 88.0 | -17.9 | 0/81 |
Arrows show the change from amount-only to composition-constrained selection. Both rules were scored against the same measured requirements: target amount or concentration at or above the training 60th percentile and panel share at or above the training median. N is the number of problems in each dataset’s fixed common comparison set, defined by the availability of RQ, default GP, RF, and ET predictions. With R recommendations and S successful recommendations, attainment, coverage, and conditional violation rate are , , and , respectively, expressed as percentages. Conditional violation rate is calculated using the recommendation set specific to each rule and is undefined when R = 0. Δ attainment is composition-constrained minus amount-only attainment, calculated from unrounded rates; pp, percentage points. Successes gained and lost are problems with a successful recommendation only under the composition-constrained rule or only under the amount-only rule, respectively. The nested eligibility sets prevent coverage from increasing; attainment can change through candidate switching or additional abstention. GP denotes default GP. Ridge FQ preprocessing was fitted separately within each inner leave-one-condition-out fold. These overlapping evaluation problems are not independent experimental replicates.
Disclaimer/Publisher’s Note: The statements, opinions and data contained in all publications are solely those of the individual author(s) and contributor(s) and not of MDPI and/or the editor(s). MDPI and/or the editor(s) disclaim responsibility for any injury to people or property resulting from any ideas, methods, instructions or products referred to in the content. |
© 2026 by the authors. Licensee MDPI, Basel, Switzerland. This article is an open access article distributed under the terms and conditions of the Creative Commons Attribution (CC BY) license (http://creativecommons.org/licenses/by/4.0/).
Copyright: This open access article is published under a Creative Commons CC BY 4.0 license, which permit the free download, distribution, and reuse, provided that the author and preprint are cited in any reuse.