
Submitted:
04 November 2026
Posted:
05 November 2026
You are already at the latest version
Abstract
The rapid growth of data-center (DC) demand is challenging transmission networks, where available capacity may accommodate new loads during most hours but not at all times. DC flexibility can enable earlier grid connections by reducing network withdrawals during congestion, while improving the utilization of existing transmission infrastructure. A DC whose bus hosting capacity varies hourly and is uncertain can become flexible with behind-the-meter storage, self-curtailment, or both. We formulate the least-cost sizing of battery energy and power capacity as a two-stage stochastic linear program with network-imposed charging limits, a transmission-usage (MUST) charge on the monthly peak recharge and optional curtailment at a penalty cost. For a 450 MW DC at a candidate bus in São Paulo, Brazil, with 100 hourly scenarios, full firm supply requires an 866 MWh/345 MW battery costing R$ 111.7 million per year to cover gaps in about 1.2% of the hours; energy and power capacities are set by different rare events. Curtailment at 8000 R$/MWh, of only 0.1% of DC consumption, reduces battery energy by 79% and total cost by 49%. Storage pays off above a curtailment cost of about 3700 R$/MWh, and firm supply is infeasible above 500 MW.
Keywords:
data centers
; large flexible loads
; battery energy storage
; storage sizing
; hosting capacity
; load curtailment
; value of lost load
; stochastic optimization
1. Introduction
Electricity demand from data centers (DCs) is growing faster than any other end use in many power systems. The International Energy Agency projects that global DC consumption will roughly double to about 945 TWh by 2030, driven mainly by artificial intelligence (AI) workloads [1], and estimates for the United States point to DCs consuming between 6.7% and 12% of national electricity by 2028 [2]. Unlike most demand growth, this load arrives in large, concentrated blocks of hundreds of megawatts at individual buses, on timescales of one to three years, whereas transmission reinforcements typically take much longer. The result is long interconnection queues and a growing mismatch between where DC developers wish to connect and where the network can deliver firm power.
A response that is gaining traction is to treat new large loads as flexible. Texas Senate Bill 6, enacted in 2025, requires new loads of 75 MW or more connecting to ERCOT to accept curtailment or remote disconnection during declared emergencies [3]. Norris et al. [4] estimate that on the order of 100 GW of new large load could be integrated into existing US systems if those loads accepted average annual curtailment of about 0.5% of their energy. Industry initiatives such as EPRI’s DCFlex [5] are characterizing which DC workloads can be shifted, throttled or backed up. Earlier work on DC demand response [6,7] and on carbon-aware scheduling of computation [8] shows that a sizeable fraction of computing tasks can tolerate delay, although latency-critical inference and large training jobs are less elastic.
From the grid’s point of view, a flexible DC is one whose withdrawal never exceeds what the network can deliver at its bus, the bus hosting capacity [9]. That capacity is not a single number: it varies hour by hour with load, generation dispatch and network conditions, and it is uncertain. From the DC’s point of view, flexibility can be supplied in two ways. The DC can install behind-the-meter storage that bridges the hours in which the grid falls short, so that the servers keep running while the withdrawal from the grid steps down. Alternatively, it can curtail part of its own consumption, at a cost that reflects lost computation, delayed tasks or contractual penalties. Which option is cheaper, and how large the storage must be, depends on how often, how deeply and for how long the hosting capacity falls below the DC load, and therefore on the tail of its distribution rather than on its average.
This paper addresses the following question: given an uncertain hourly hosting capacity at its bus, what is the least-cost combination of battery storage and self-curtailment that makes a DC flexible? Its contributions are as follows:
- 1.
- A two-stage stochastic linear program (LP) that sizes the energy and power capacities of a battery serving a constant DC load against an hourly, scenario-dependent hosting capacity. The model includes network-imposed limits on battery charging, which prevent the battery from being charged in the hours in which the network is constrained, a transmission-usage charge levied on the monthly peak recharge drawn from the grid and an optional curtailment variable.
- 2.
- An application to a 450 MW DC at a candidate bus of the Brazilian interconnected system with 100 hourly scenarios, which quantifies the cost of firm supply and identifies the distinct rare events that size the battery’s energy and power capacities.
- 3.
- An analysis of the trade-off between storage and curtailment, including the break-even curtailment cost below which no storage is built, and of how the optimal solution and the feasibility of firm supply change with the size of the DC load.
2. Materials and Methods
2.1. Problem Setting
A DC draws a constant power (MW) at every hour. The grid can deliver at most (MW) at the DC’s bus in hour t of typical day d of month m under scenario s; we call this quantity the hosting capacity of the bus. Whenever a gap opens that the grid cannot serve, and whenever a surplus is available that may be used to charge storage (Figure 1):
The year is represented by two typical days per month, obtained through a k-means clustering procedure applied to the hourly demand profiles. The clustering identifies two representative groups of days, generally corresponding to weekdays and to weekends and holidays, respectively. Each typical day is assigned a weight equal to the number of calendar days represented by its cluster in month m. Scenarios are equiprobable, . Hatted symbols denote data and barred symbols denote sizing variables (Table 1).
2.2. Case I: Firm Supply Without Load Curtailment
The battery must cover the gap in every hour and scenario. The problem is
The objective (2) minimizes annualized battery investment in energy and power capacity, the expected monthly transmission-usage charge and the expected cost of energy purchased for charging. Because the DC contracts transmission usage for its own load regardless of the battery, the only increase in withdrawal caused by the battery is its recharge; the transmission-usage term therefore applies the monthly tariff to the peak recharge of each month, , rather than to the battery’s power capacity. Discharge reduces the DC’s withdrawal and does not require additional transmission usage.
Constraint (3) is the storage balance: the stored energy falls by the energy withdrawn, , of which only the fraction reaches the DC, so that discharge losses reduce the stored energy. Each (typical day, month, scenario) block is a self-contained daily cycle in which the battery returns to its initial state of charge. Constraint (4) is the flexibility requirement: the energy delivered to the DC, , must cover the gap. The joint limit in (5) prevents simultaneous charging and discharging from exceeding the converter rating. Constraints (6) limit discharge to the stored energy and, importantly, limit charging to the network surplus : the battery cannot be charged from the grid in hours when the grid is already unable to serve the DC. Without these network-imposed charging limits, the model would charge the battery in precisely the hours in which the network is constrained. Constraint (7) sets the largest charging power of each month and scenario, on which the transmission-usage charge is levied. In the case study, the battery capital cost is expressed per unit of stored energy and is assumed to include the power-conversion equipment, so that . The power capacity then carries no cost of its own, and the value reported in Section 3 is the smallest compatible with the optimal total cost, obtained in a second optimization with the total cost fixed at its optimum.
2.3. Case II: Firm Supply With Load Curtailment
In Case I, some scenario-days become infeasible as the DC load grows, because the surplus available before a long gap is insufficient to charge a battery large enough to cover it. Allowing the DC to curtail part of its own load at a unit cost restores feasibility and turns the reliability requirement into an economic trade-off. Constraint (4) is replaced by
and the expected curtailment cost is added to (2). All other constraints are unchanged. The curtailment cost represents the DC’s opportunity cost of lost or delayed computation or, equivalently, the penalty agreed in a flexible-connection contract.
2.4. Hosting Capacity Assessment
The hosting capacity is obtained in two steps. First, the operation of the Brazilian interconnected system is simulated with the hydrothermal dispatch model SDDP [10], with detailed representation of the transmission network (about 13,600 buses and 9,900 circuits, DC power flow) and 100 scenarios of hydro inflows and renewable generation. Each hour–scenario state of this simulation provides a dispatch, that is, the generation, the loads, and the flow on every circuit k, together with the bus marginal cost used as the spot price .
Second, for each operating state, we compute the largest additional load that can be connected at the DC bus r without violating any circuit limits. Since a load connected at r mainly affects the flows on nearby circuits, only the circuits up to the fourth neighborhood level of r are considered. The first level consists of the circuits connected to r; the second level comprises the circuits connected to the buses at the other end of the first-level circuits, and so on up to the fourth level. These circuits form the set of monitored circuits, and their outages form the set of contingencies. The change in circuit flows caused by an additional load x at bus r is linearized through the power transfer distribution factors of the network, and every circuit in must remain within its limits both in the base case and after any single (N–1) contingency in :
where is the sensitivity of the flow on circuit k to a net injection at bus r, so that an additional load x changes that flow by ; and are the post-contingency flow and sensitivity of circuit k after the outage of circuit l; and and are its normal and emergency ratings.
2.5. Case Study and Data
The model was applied to a candidate DC connection at a 230 kV substation in the Barueri region of São Paulo, a major area of interest for data center development, with hourly hosting-capacity and bus spot-price series for 8760 h and 100 equiprobable scenarios obtained from a stochastic simulation of the Brazilian interconnected system’s operation. Two representative days per month were identified using k-means clustering based on hourly demand profiles, distinguishing predominantly weekdays from weekends and holidays. Each representative day was assigned a weight corresponding to the number of calendar days in its cluster. The resulting optimization problem comprises hour–scenario states. Table 2 lists the parameters, and Table 3 the typical-day weights.
The hosting capacity ranges from 121.8 MW to 1749.6 MW, with a 5th percentile of 643.2 MW, a median of 1119.7 MW and a mean of 1100.4 MW. The spot price has a median of 203.8 R$/MWh, a mean of 232.4 R$/MWh, a 95th percentile of 631.5 R$/MWh and a maximum of 1000 R$/MWh, and it is zero in 25% of hours. For a 450 MW DC, a gap occurs in 734 of the 57,600 states (1.3%), all of them between January and April; weighted by the typical-day weights, this corresponds to about 103 hours per year, or 1.2% of the hours of the year; the largest single-hour gap is 328.2 MW (Scenario 78, February) and the expected gap energy is 8294 MWh per year.
2.6. Implementation
3. Results
Figure 2 presents the probability distribution of the hourly grid hosting capacity across the 100 simulated scenarios. The results show considerable variability, with hosting capacity ranging from 121.8 MW to 1,749.6 MW. The distribution is concentrated around a mean value of 1,088.2 MW, with the 5th and 95th percentiles corresponding to 644.9 MW and 1,481.9 MW, respectively. Despite the relatively high average hosting capacity, the lower tail of the distribution reveals operating conditions under which the network’s ability to accommodate additional demand is substantially reduced.
A pronounced seasonal pattern is also observed in the hosting capacity results, with the lowest values concentrated between January and April, as illustrated in Figure 3. During this period, the average hosting capacity ranges from 843.7 MW in March to 919.3 MW in April, substantially below the values observed in the remaining months. The most restrictive condition occurs in February, when the available hosting capacity reaches a minimum of 121.8 MW. From May onwards,the minimum monthly hosting capacity remains above 580 MW, indicating significantly less restrictive network conditions during the remainder of the year.
Based on the hosting capacity results, the following sections present the results obtained for the two cases described in the methodology, considering a data center with a constant demand of 450 MW. As previously shown, the available hosting capacity falls below this demand under certain operating conditions between January and April, resulting in network constraints that require additional flexibility to maintain the data center’s electricity supply.
3.1. Case I: The Cost of Firm Supply
In the first case, without load curtailment, the optimal battery for the 450 MW DC has MWh and MW, an implied duration of 2.51 h, for a total cost of R$ 111.7 million per year (Table 5), of which R$ 110.3 million corresponds to battery investment. Investment therefore accounts for 98.8% of the total cost, while energy purchases amount to only R$ 0.96 million and the transmission-usage charge to R$ 0.39 million: the battery is a reliability asset, not an arbitrage asset. The MUST charge is small because recharging can be spread over the many hours with surplus before each gap: the largest hourly recharge is 89.5 MW, about one quarter of the discharge capacity, and recharging occurs only from January to April and in 135 of the 1200 month–scenario pairs. Considering the data center’s annual consumption of 3.94 TWh, the resulting cost of firm supply is approximately 28 R$/MWh, equivalent to R$ 248 thousand per MW of data center demand per year.
The optimal battery energy and power capacities are determined by different critical operating conditions. The energy capacity is set by an endurance day, Scenario 35 in March, with six consecutive gap hours (12:00 to 17:00) and 823.1 MWh of gap energy, which requires MWh of stored energy. Scenario 99, also in March, is a close second at 863.3 MWh: its eight gap hours carry more gap energy (839.2 MWh), but the battery can be partly recharged between them. In contrast, the power capacity is determined by a single hour in Scenario 78 in February at 16:00, when the maximum supply gap reaches 328.2 MW, requiring MW of battery discharge capacity. These results highlight that battery sizing is driven by a limited number of critical events, as 32 of the 100 scenarios do not require battery operation, while only nine present more than 300 hours of insufficient hosting capacity per year.
Figure 4a and Table 4 show that the required energy capacity grows faster than linearly with the DC load, from 400.8 MWh at 350 MW to 1415.8 MWh at 500 MW, while the power capacity grows almost linearly (240.2 to 398.1 MW). The duration increases from 1.67 h to 3.56 h because larger loads produce longer gaps as well as deeper ones. From 550 MW onward, Case I is infeasible: in some scenario-days the surplus available for charging runs out before the gap does, so that no battery, however large, can make the data-center load firm. Furthermore, the annual cost per MW of data center demand increases nonlinearly with load, rising from R$ 146.8 thousand/MW/year at 350 MW to R$ 365.5 thousand/MW/year at 500 MW, reflecting the increasing storage requirements under more restrictive network conditions.
3.2. Case II: Curtailment as an Alternative to Storage
In the second case, allowing the data center to curtail part of its demand at a cost of 8,000 R$/MWh significantly changes the optimal battery sizing and associated costs. The required energy and power capacities decrease to 178.51 MWh and 172.51 MW, representing reductions of 79% and 50%, respectively. As a result, the total annual cost decreases by 49%, from R$ 111.7 million to R$ 56.6 million (Table 5 and Figure 5). Load curtailment accounts for approximately 59% of the total cost, with 4140 MWh curtailed annually, while the battery still supplies half (50.1%) of the energy deficit. Relative to the data center’s annual consumption of 3.94 TWh, the curtailed energy corresponds to only about 0.1% of its demand, below the lowest annual curtailment rate (0.25%) considered by Norris et al. [4] in their assessment of flexible large loads.

Table 5.
Case I versus Case II at MW.
| Quantity | Case I (no curtailment) | Case II ( = 8000 R$/MWh) | Change |
|---|---|---|---|
| Battery energy capacity (MWh) | 866.45 | 178.51 | −79.4% |
| Battery power capacity (MW) | 345.46 | 172.51 | −50.1% |
| Implied duration (h) | 2.51 | 1.03 | −1.47 h |
| Battery investment (R$ M/yr) | 110.31 | 22.73 | −79.4% |
| MUST charge (R$ M/yr) | 0.39 | 0.21 | −46.8% |
| Energy purchase (R$ M/yr) | 0.96 | 0.54 | −43.9% |
| Curtailment cost (R$ M/yr) | – | 33.12 | – |
| Total cost (R$ M/yr) | 111.66 | 56.59 | −49.3% |
| Gap energy served by battery | 100% | 50.1% | −49.9 p.p. |
| Curtailed energy (MWh/yr) | 0 | 4140 | – |
| Curtailed energy (% of DC consumption) | 0 | 0.105% | – |
In Case II the battery covers the shallower and shorter gaps in full and leaves the deepest and longest ones partly or entirely to curtailment (Table 6). In 374 of the 734 gap hours (51%) the gap, of 48 MW on average, is covered entirely by the battery; in 162 hours (22%), with an average gap of 153 MW, the battery and curtailment share the gap; and in 198 hours (27%) the whole gap is curtailed. Across the 68 scenarios with at least one gap hour, the share of gap energy served by the battery ranges from 24% to 100%, with an average of 72%. In Scenario 78, for example, the battery is charged at 22.3 MW from 07:00 to 14:00, reaching 178.5 MWh; it covers the whole 94.0 MW gap at 15:00, delivers 22.7 MW of the 328.2 MW gap at 16:00, when 305.5 MW are curtailed, and covers the 52.9 MW gap at 18:00. Because curtailment has the same unit cost in every hour, the hour-by-hour split between battery and curtailment within a day is not unique: Table 6 and this example describe one of the optimal operations, whereas the energies served by the battery and curtailed are the same in all of them.
3.3. Sensitivity to the Curtailment Cost
The result is sensitive to the curtailment cost, as shown in Figure 6 and Table 7. Below a break-even value of approximately 3700 R$/MWh the optimal battery is zero and the DC simply curtails all 8294 MWh of gap energy, so that the total cost equals . The assumed 8000 R$/MWh is about 2.2 times the threshold. Above it, the battery grows steadily but with diminishing returns: it is 46% larger at 10,000 R$/MWh (259.7 MWh), reaches 52% of the Case I energy capacity at 20,000 R$/MWh (453.1 MWh) and 68% at 40,000 R$/MWh (586.3 MWh), while 452 MWh per year are still curtailed. The power capacity stabilizes at about 314 MW from 15,000 R$/MWh onward: covering the remaining deepest gaps is cheaper with curtailment than with additional storage.
With curtailment allowed, the DC remains feasible up to at least 650 MW (Figure 4). The battery grows from 19.2 MWh at 350 MW to 1105.5 MWh at 650 MW, while the curtailed energy remains small relative to the DC consumption, increasing from 0.07% at 350 MW to 0.33% at 650 MW, and the saving relative to Case I decreases from 64% at 350 MW to 48% at 500 MW, the largest load for which Case I is feasible.
4. Discussion
Firm supply is an insurance premium. The battery that makes a 450 MW DC firm costs R$ 111.7 million per year, essentially all of it fixed investment, to cover gaps that occur in about 1.2% of the hours of the year and that are concentrated in a few months and a few scenarios. This is consistent with the observation by Norris et al. [4] that the headroom of existing systems is limited by a small number of stressed hours. It also means that the cost of firm supply is driven by the tail of the hosting-capacity distribution, so the number and the construction of the scenarios used to represent that tail deserve as much attention as the cost assumptions. The infeasibility of Case I above 500 MW shows that, beyond some size, firm supply is not merely expensive but physically unattainable with storage charged from the same constrained bus.
Energy and power are sized by different events. Because the energy capacity is set by a six-hour endurance day and the power capacity by a single extreme hour, the optimal duration (2.51 h) is an outcome of the model rather than a design choice. Fixing the duration a priori, as is common in practice, would oversize one of the two capacities.
Recharging, not discharging, drives transmission usage. Charging the MUST on the monthly peak recharge rather than on the battery’s power rating reduces this component to less than 0.4% of the total cost in Case I. The battery must discharge fast, because the deepest gap appears in a single hour, but it can recharge slowly over the many hours with surplus that precede each gap, so its peak recharge (89.5 MW) is about one quarter of its discharge capacity. Representing the transmission charge on the withdrawal that the battery actually adds is therefore essential for a fair comparison between storage and curtailment.
The curtailment cost is a design parameter, not a detail. Allowing curtailment reduced the battery energy capacity by 79% and the total cost by 49%, and the battery grows by a factor of 2.5 when the curtailment cost rises from 8000 to 20,000 R$/MWh, while storage disappears below about 3700 R$/MWh. For a DC, the relevant curtailment cost is the opportunity cost of lost computation, which differs widely between latency-critical inference, deferrable batch work and large training runs [6,8]. Representing that heterogeneity, for instance by allowing tasks to be delayed with a penalty that grows with the delay, is a natural extension that would replace the single by a menu of curtailment and deferral options.
Implications for flexible connection. The results suggest that the connection capacity offered to a new DC need not be a fixed number but can depend on the flexibility it contracts. A DC that accepts curtailment can connect larger loads (here, above 500 MW, where firm supply is infeasible) and at much lower cost, while the operator retains the ability to reduce its withdrawal in the stressed hours. Flexible-connection agreements of this kind would need to specify the curtailment cost or, equivalently, the maximum curtailment frequency and depth, and the present model provides a way to evaluate both sides of that agreement.
Limitations. The model assumes perfect foresight within each typical day and resets the state of charge daily, which may understate storage needs for multi-day events and overstate the value of perfectly timed charging; a chronological representation of the critical scenarios would test the robustness of the energy capacity. Two clustered typical days per month may not preserve all extreme hosting-capacity conditions, so the robustness of the results to the number and selection of representative days should be tested. The hosting-capacity series is exogenous, so the interaction between the DC’s own behavior and system operation is not captured. The MUST charge is computed as the expected value of the monthly peak recharge over scenarios, whereas in practice transmission usage is contracted in advance; contracting, for each month, the largest peak over all scenarios raises this component in Case I from R$ 0.39 to 3.08 million per year without changing the optimal battery. The reported runs use an energy-based battery cost (); a separate power-related cost, for instance for the converter, would penalize power capacity and tend to lengthen the optimal duration. Finally, the curtailment cost is a single exogenous value. Ongoing work extends the analysis to a network-wide setting, in which the total DC load that a system can host is determined jointly with a risk-based criterion on curtailment.
5. Conclusions
We proposed a two-stage stochastic LP for sizing behind-the-meter battery storage that makes a DC flexible against an uncertain, hourly hosting capacity, with network-imposed charging limits, a transmission-usage charge and optional self-curtailment. For a 450 MW DC at a candidate bus of the Brazilian interconnected system, full firm supply requires an 866 MWh/345 MW battery costing R$ 111.7 million per year, sized by rare events that occur in about 1.2% of the hours of the year, with energy and power capacities set by two different events. Allowing curtailment at 8000 R$/MWh reduces the battery energy capacity by 79% and total cost by 49%, with the battery still serving half of the gap energy and curtailment covering the deepest gaps; below a curtailment cost of about 3700 R$/MWh, no storage is built at all, and above 500 MW firm supply becomes infeasible. Because the battery can recharge slowly before each gap, the transmission-usage charge it causes is small when levied on its monthly peak recharge. These results indicate that the curtailment cost, and the scenarios used to represent extreme hosting-capacity events, are the key inputs for designing flexible connections of large DC loads.
Author Contributions
Conceptualization, M.V.P. and S.B.; methodology, M.V.P., S.B. and S.G.; software, S.P.; validation, S.P., G.P. and A.O.; formal analysis, S.P. and A.C.C.; investigation, S.P., G.P. and A.O.; data curation, A.O. and G.P.; writing—original draft preparation, A.C.C.; writing—review and editing, all authors; visualization, S.P. and A.C.C.; supervision, M.V.P. and S.B.; project administration, A.O. All authors have read and agreed to the published version of the manuscript.
Funding
This research received no external funding.
Data Availability Statement
The hosting-capacity and price series used in this study were derived from proprietary simulation studies and are not publicly available. Aggregated results are available from the corresponding author upon reasonable request.
Acknowledgments
During the preparation of this manuscript, the authors used Claude (Anthropic) for grammar review and the correction of typographical errors. The authors have reviewed and edited the output and take full responsibility for the content of this publication.
Conflicts of Interest
The authors are employed by PSR, a consulting and software company that provides services related to power-system planning. The authors declare no other conflicts of interest.
Abbreviations
The following abbreviations are used in this manuscript:
| AI | Artificial intelligence |
| DC | Data center |
| ERCOT | Electric Reliability Council of Texas |
| LP | Linear program(ming) |
| MUST | Montante de Uso do Sistema de Transmissão (contracted transmission usage) |
| VOLL | Value of lost load |
References
- International Energy Agency. Energy and AI; IEA: Paris, France, 2025; Available online: https://www.iea.org/reports/energy-and-ai (accessed on 10 October 2026).
- Shehabi, A.; Smith, S.J.; Hubbard, A.; Newkirk, A.; Lei, N.; Siddik, M.A.B.; Holecek, B.; Koomey, J.; Masanet, E.; Sartor, D. 2024. 2024 United States Data Center Energy Usage Report; Report LBNL-2001637. Lawrence Berkeley National Laboratory: Berkeley, CA, USA. [Google Scholar]
- Texas Legislature. Senate Bill 6, 89th Legislature, Regular Session, relating to the planning for, interconnection of, and operation of large loads in the ERCOT power region. Signed into law. 2025. [Google Scholar] [PubMed]
- Norris, T.H.; Profeta, T.; Patiño-Echeverri, D.; Cowie-Haskell, A. 2025. Rethinking Load Growth: Assessing the Potential for Integration of Large Flexible Loads in US Power Systems; Report NI R 25-01; Nicholas Institute for Energy, Environment & Sustainability. Duke University: Durham, NC, USA. [Google Scholar]
- Electric Power Research Institute. DCFlex Initiative. Available online: https://dcflex.epri.com (accessed on 10 October 2026).
- Wierman, A.; Liu, Z.; Liu, I.; Mohsenian-Rad, H. Opportunities and challenges for data center demand response. In Proceedings of the International Green Computing Conference (IGCC), Dallas, TX, USA, 3–5 November 2014; pp. 1–10. [Google Scholar]
- Ghatikar, G.; Ganti, V.; Matson, N.; Piette, M.A. 2012. Demand Response Opportunities and Enabling Technologies for Data Centers: Findings from Field Studies; Report LBNL-5763E. Lawrence Berkeley National Laboratory: Berkeley, CA, USA. [Google Scholar]
- Radovanović, A.; Koningstein, R.; Schneider, I.; Chen, B.; Duarte, A.; Roy, B.; Xiao, D.; Haridasan, M.; Hung, P.; Care, N.; et al. Carbon-aware computing for datacenters. IEEE Trans. Power Syst. 2023, 38, 1270–1280. [Google Scholar] [CrossRef]
- Ismael, S.M.; Abdel Aleem, S.H.E.; Abdelaziz, A.Y.; Zobaa, A.F. State-of-the-art of hosting capacity in modern power systems with distributed generation. Renew. Energy 2019, 130, 1002–1020. [Google Scholar] [CrossRef]
- PSR. SDDP: Stochastic Hydrothermal Dispatch with Network Restrictions. Available online: https://www.psr-inc.com/en/software/sddp/ (accessed on 16 October 2026).
- Bezanson, J.; Edelman, A.; Karpinski, S.; Shah, V.B. Julia: A fresh approach to numerical computing. SIAM Rev. 2017, 59, 65–98. [Google Scholar] [CrossRef]
- Dunning, I.; Huchette, J.; Lubin, M. JuMP: A modeling language for mathematical optimization. SIAM Rev. 2017, 59, 295–320. [Google Scholar] [CrossRef]
- Huangfu, Q.; Hall, J.A.J. Parallelizing the dual revised simplex method. Math. Program. Comput. 2018, 10, 119–142. [Google Scholar] [CrossRef]
Figure 1.
Illustrative day showing the hosting capacity of the DC bus, the constant DC load, the surplus available for charging the battery and the gap that the battery or DC curtailment must cover. The curve is schematic.
Figure 1.
Illustrative day showing the hosting capacity of the DC bus, the constant DC load, the surplus available for charging the battery and the gap that the battery or DC curtailment must cover. The curve is schematic.
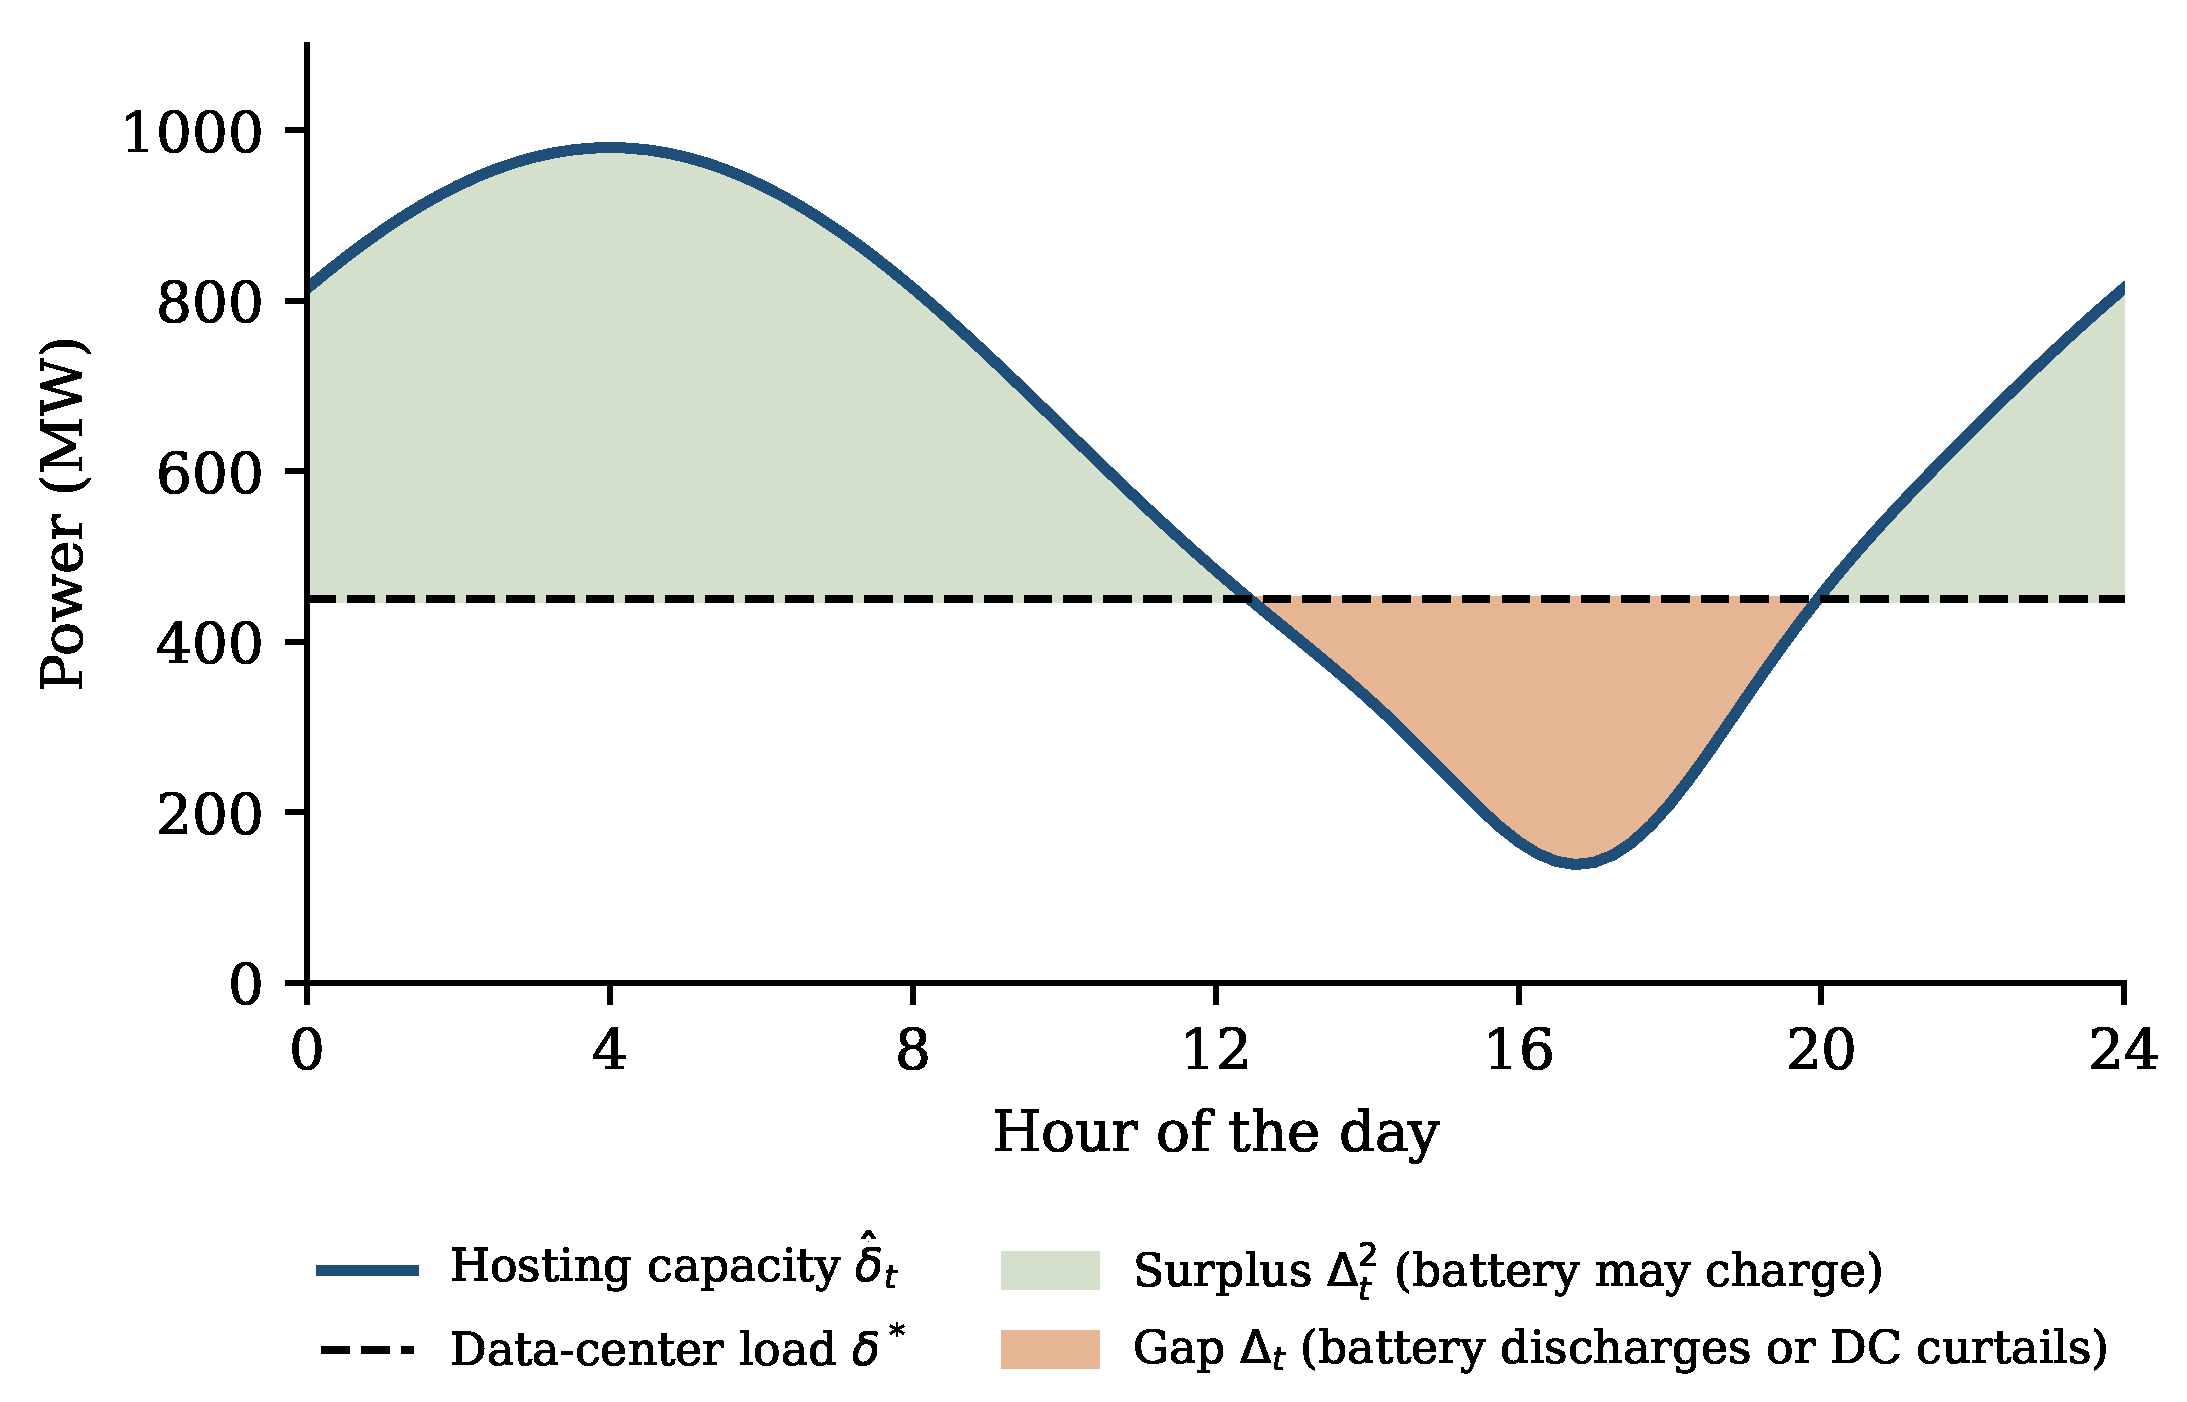
Figure 2.
Probability distribution of hourly grid hosting capacity across 100 simulated scenarios.
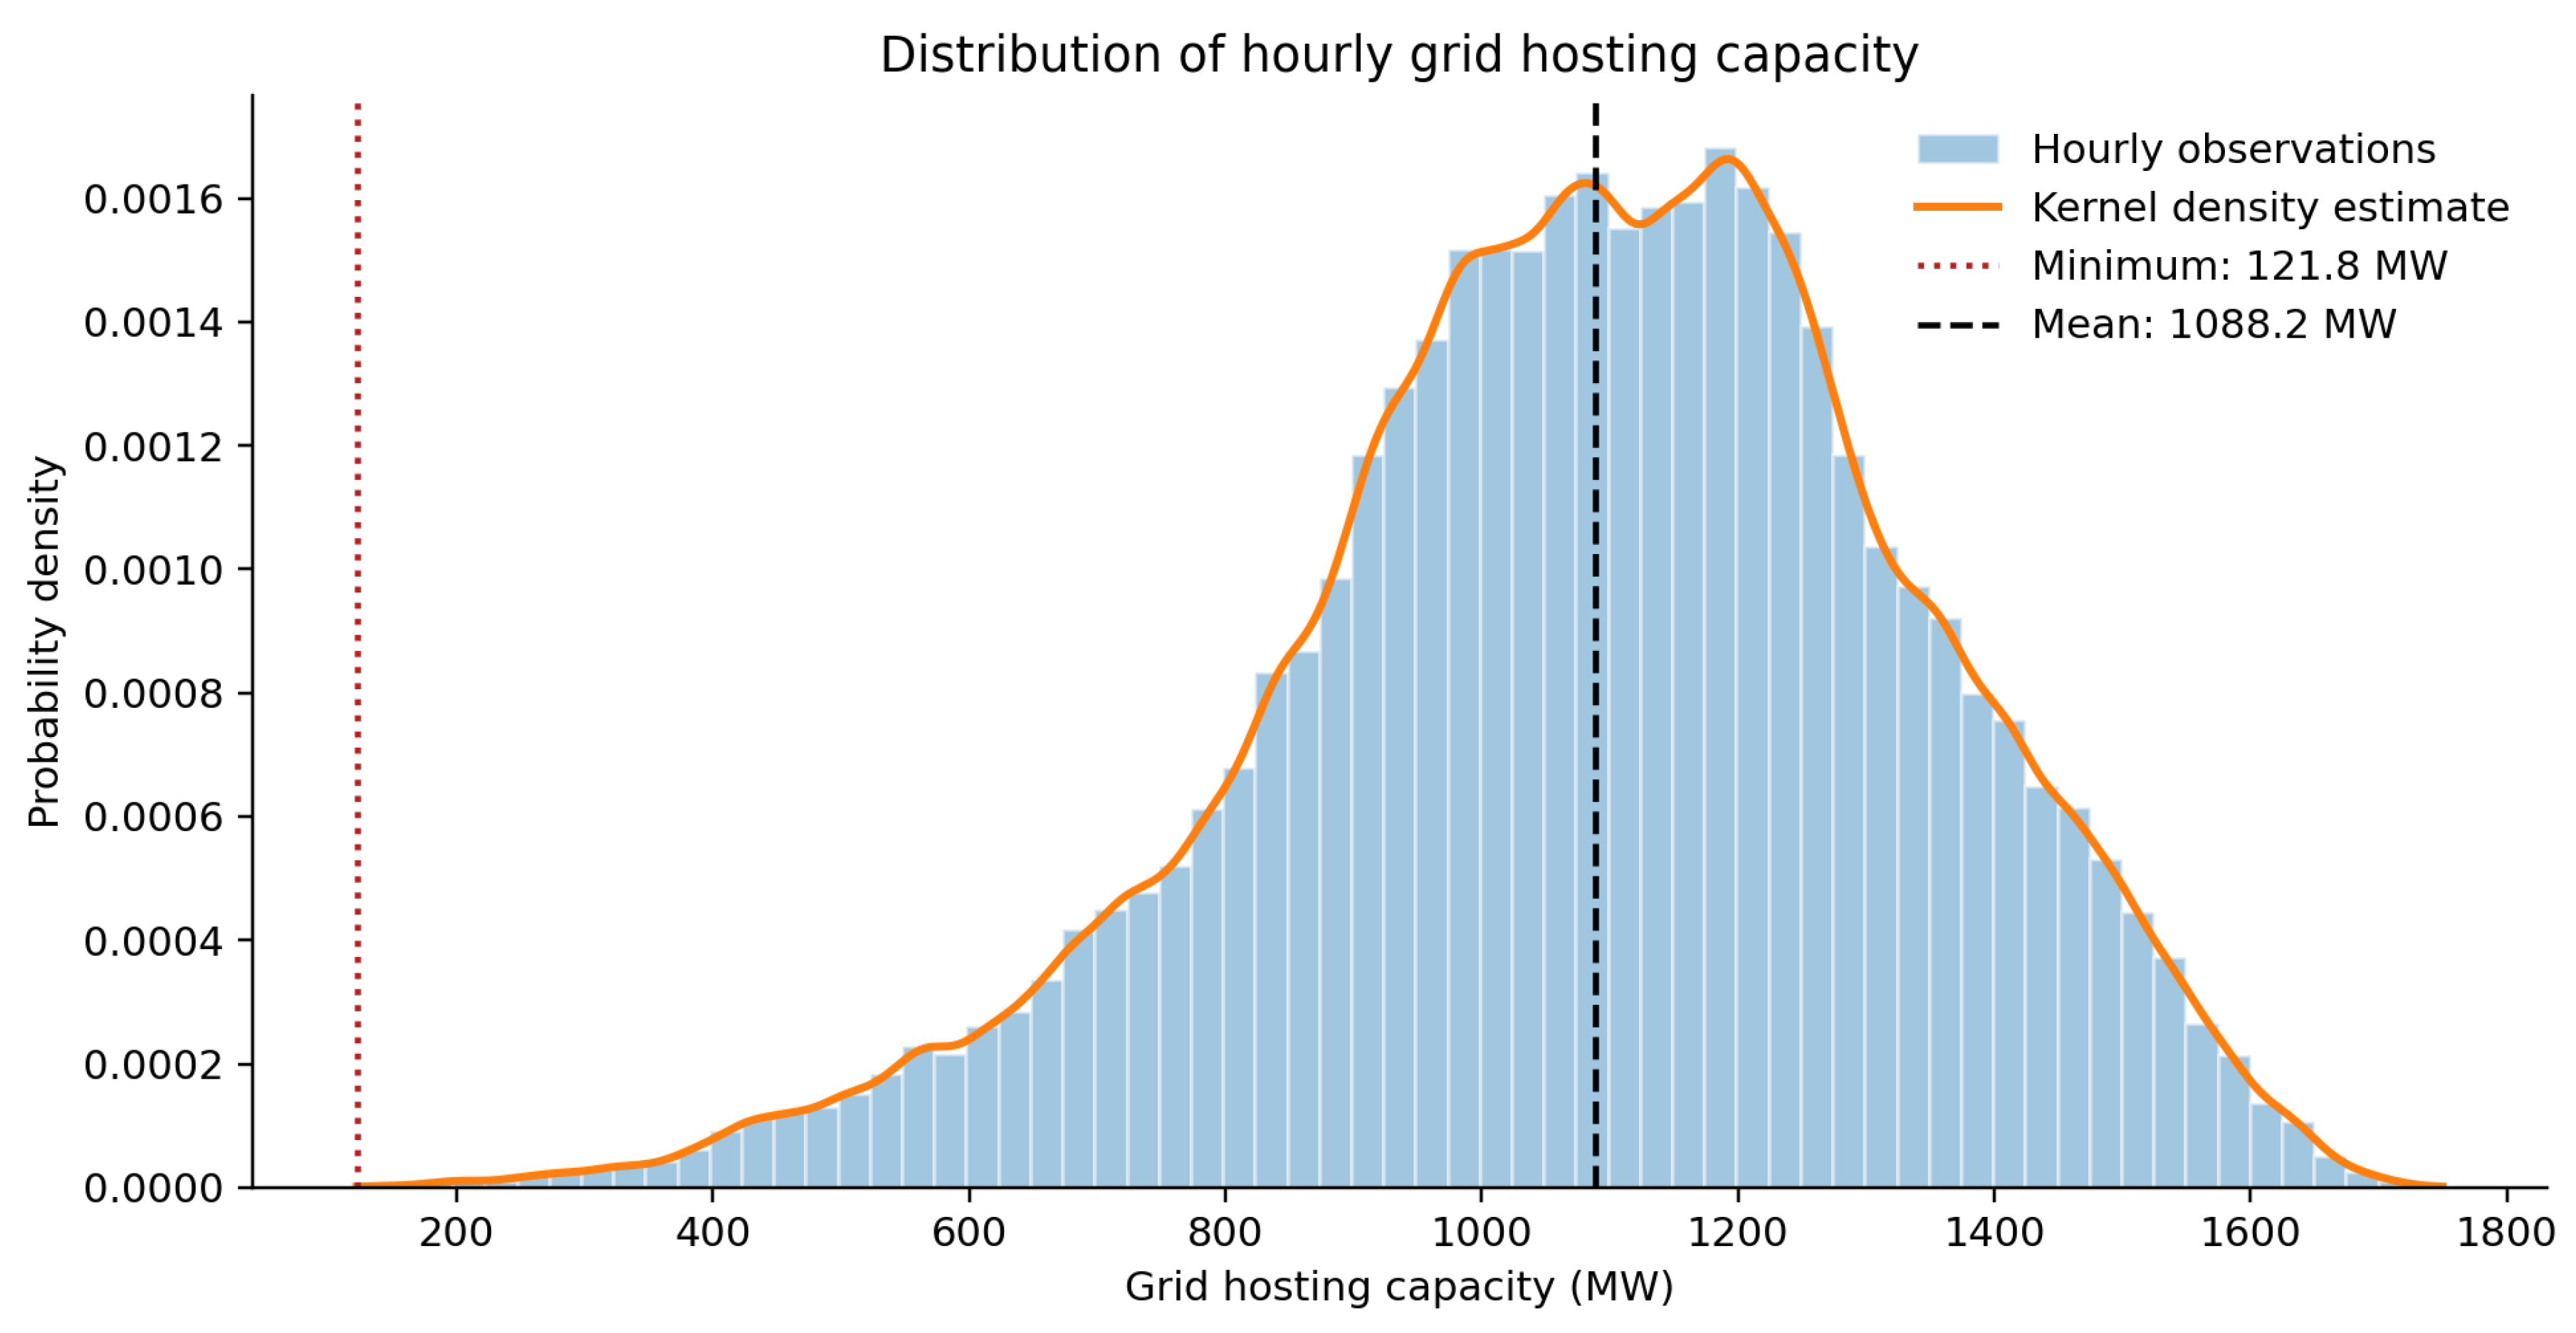
Figure 3.
Hourly grid hosting capacity from January to April across 100 simulated scenarios, showing the median, 5th–95th percentile range, and minimum values.
Figure 3.
Hourly grid hosting capacity from January to April across 100 simulated scenarios, showing the median, 5th–95th percentile range, and minimum values.
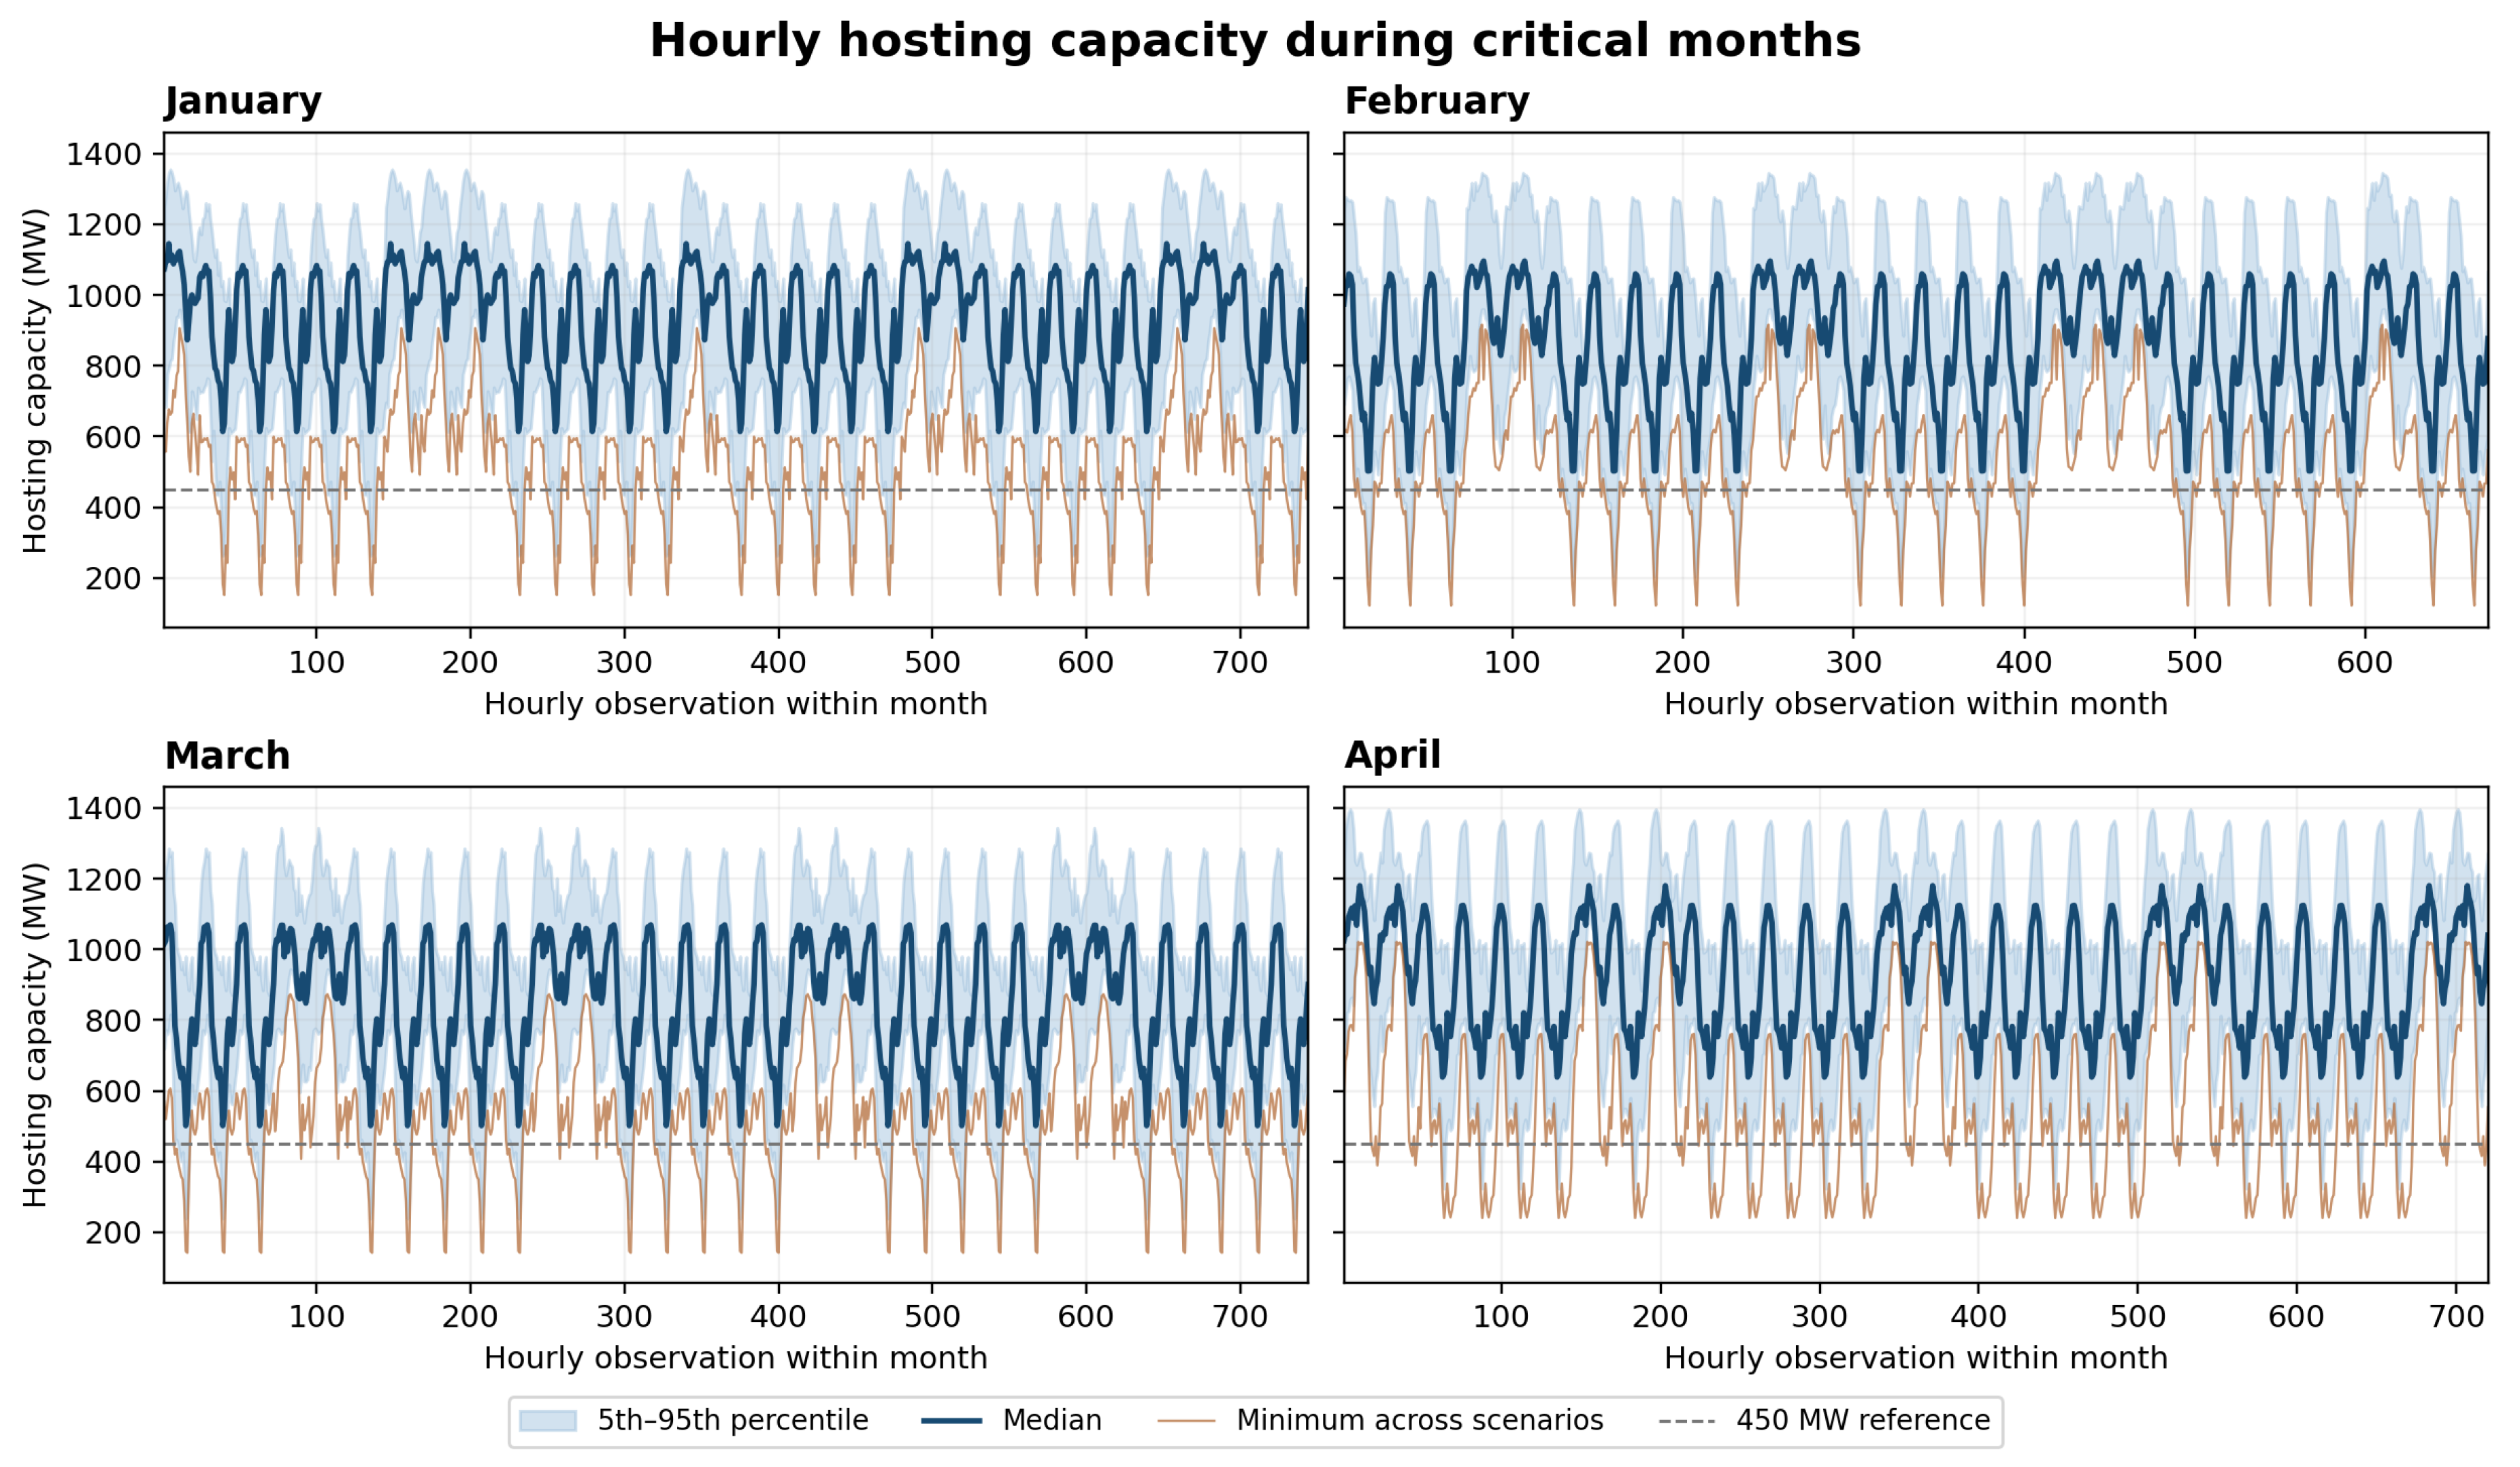
Figure 4.
Sensitivity to the DC load . (a) Battery energy capacity and (b) total annual cost for Case I (no curtailment) and Case II (curtailment at 8000 R$/MWh). Case I is infeasible above 500 MW.
Figure 4.
Sensitivity to the DC load . (a) Battery energy capacity and (b) total annual cost for Case I (no curtailment) and Case II (curtailment at 8000 R$/MWh). Case I is infeasible above 500 MW.
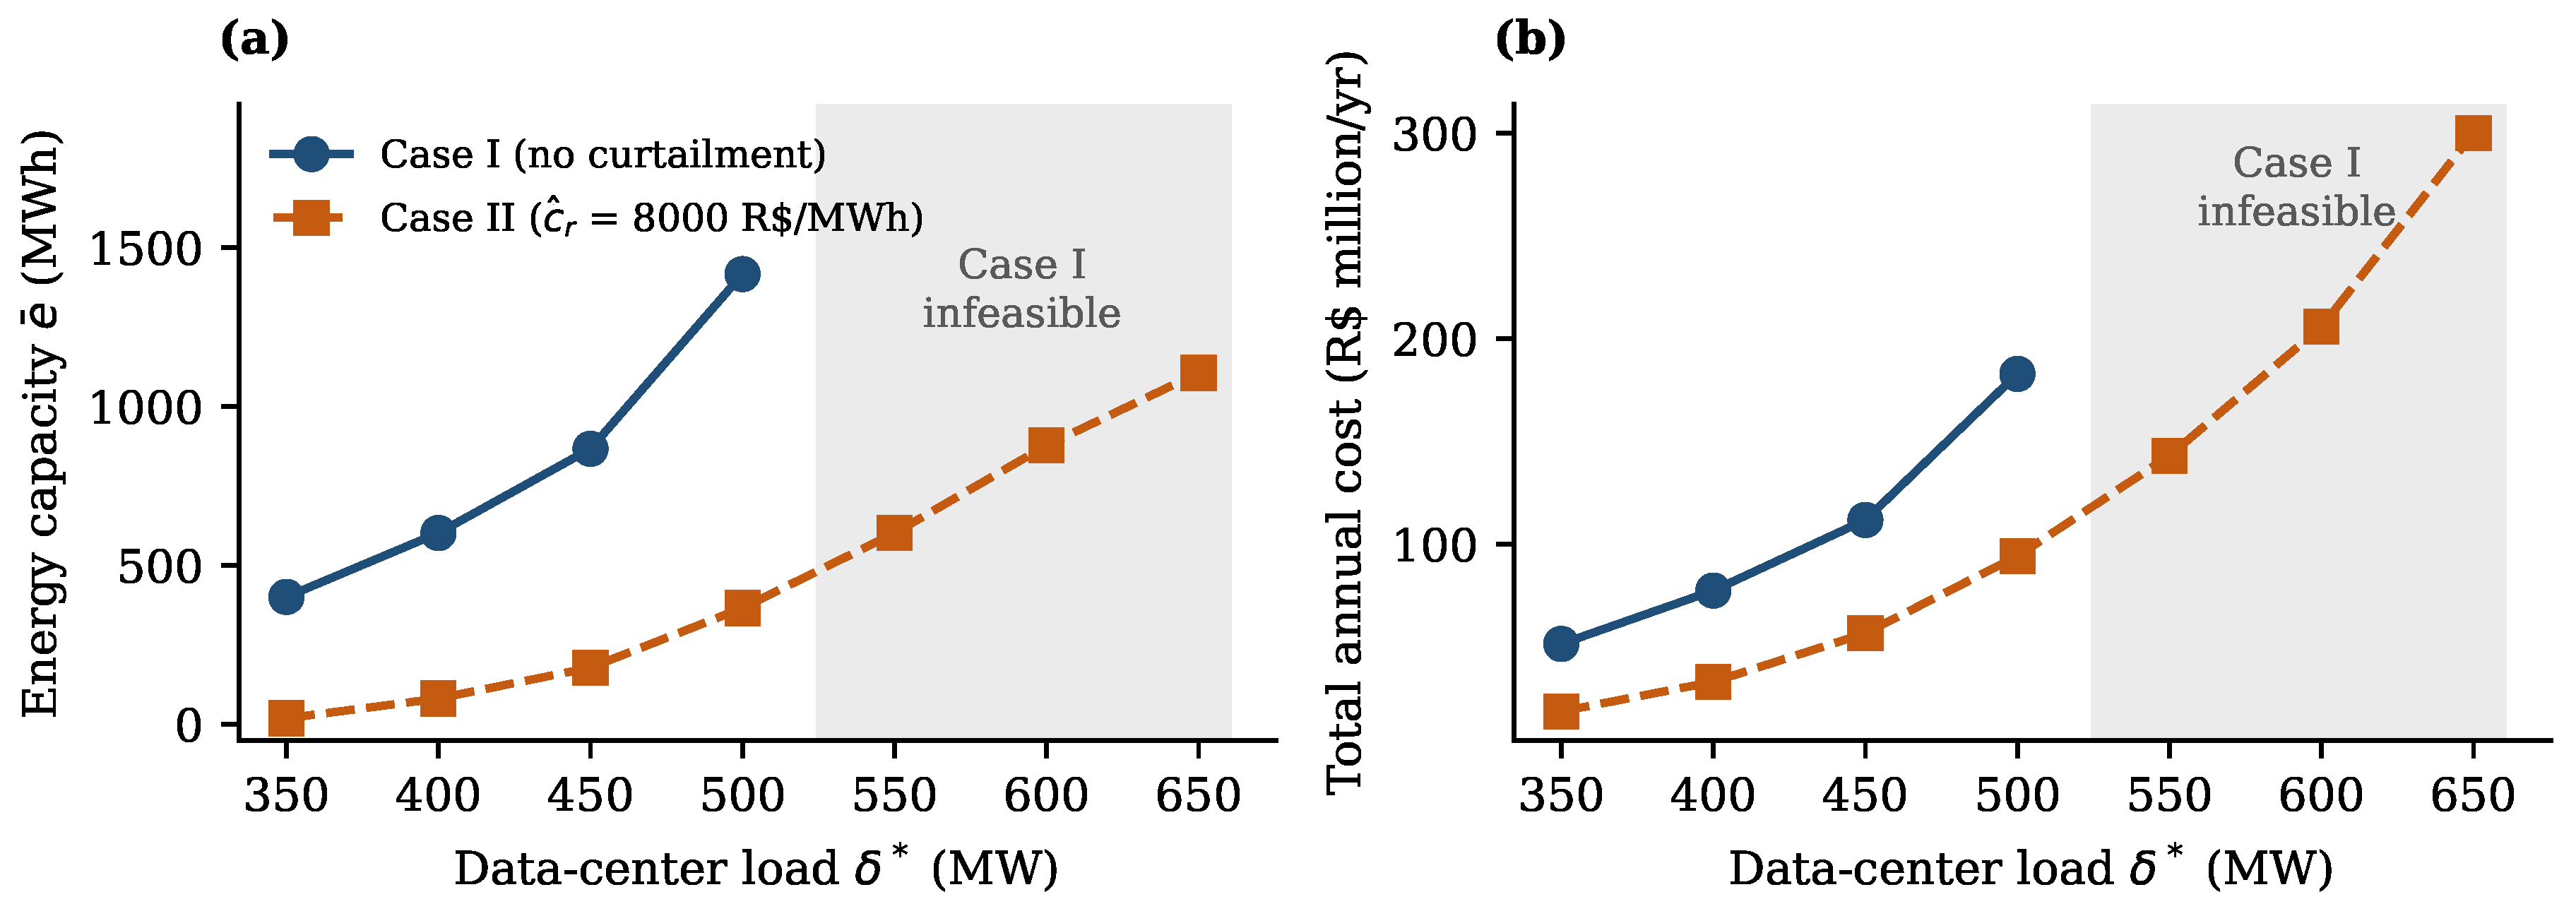
Figure 5.
Annual cost structure of Case I and Case II at MW.
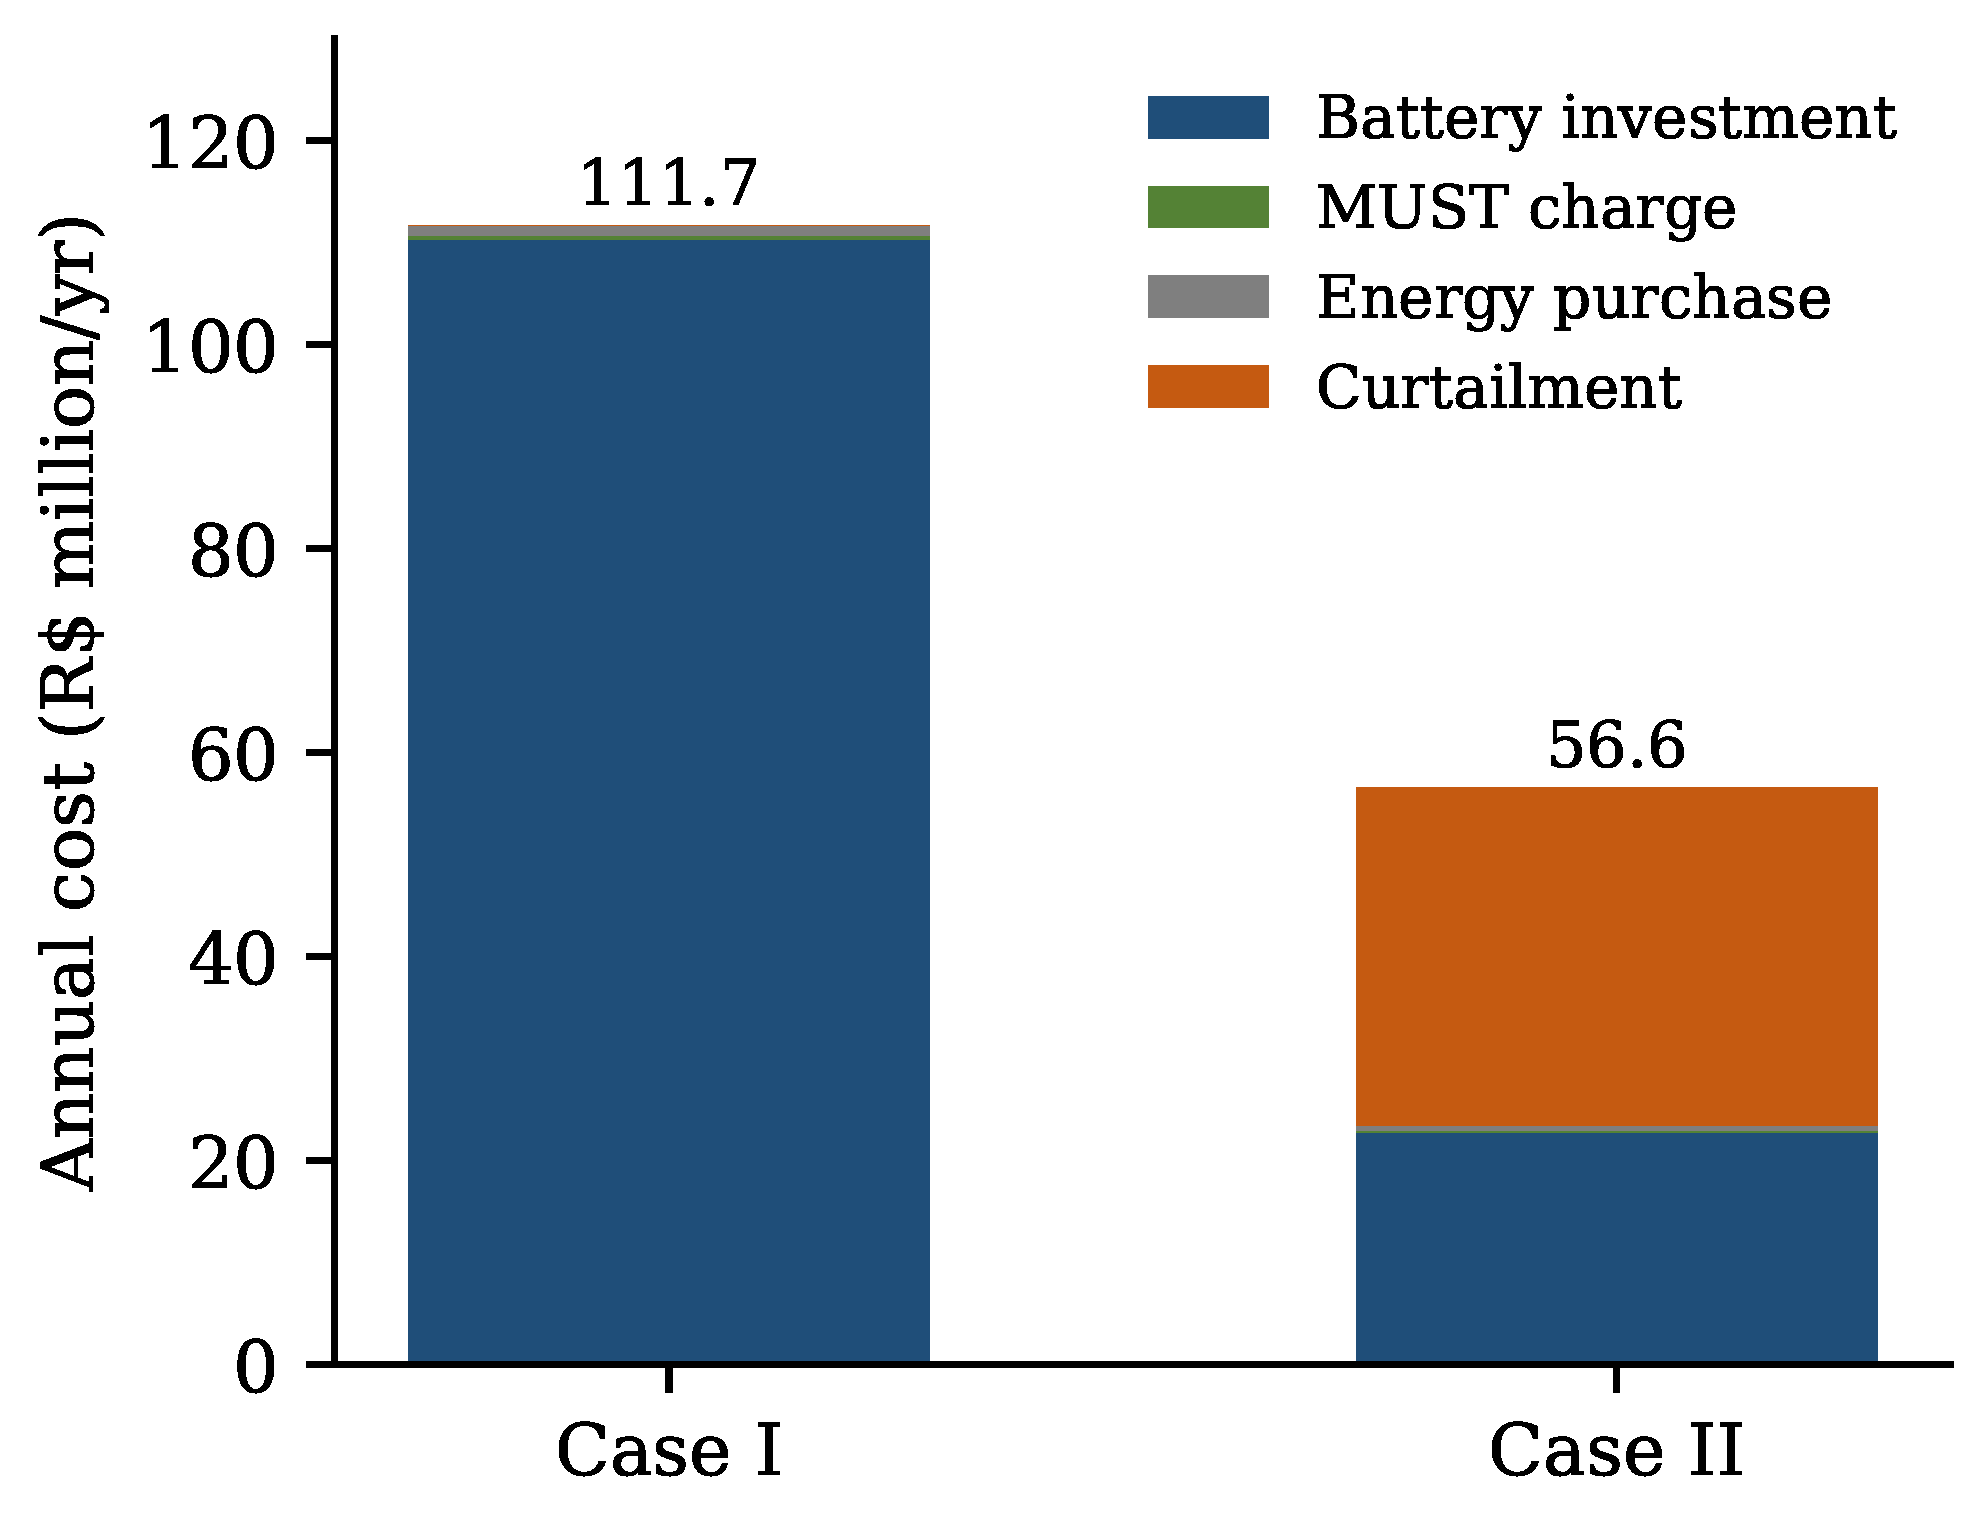
Figure 6.
Sensitivity of Case II to the curtailment cost at MW. (a) Optimal battery energy and power capacities; (b) curtailed energy. The dashed line marks the break-even value below which no battery is built.
Figure 6.
Sensitivity of Case II to the curtailment cost at MW. (a) Optimal battery energy and power capacities; (b) curtailed energy. The dashed line marks the break-even value below which no battery is built.
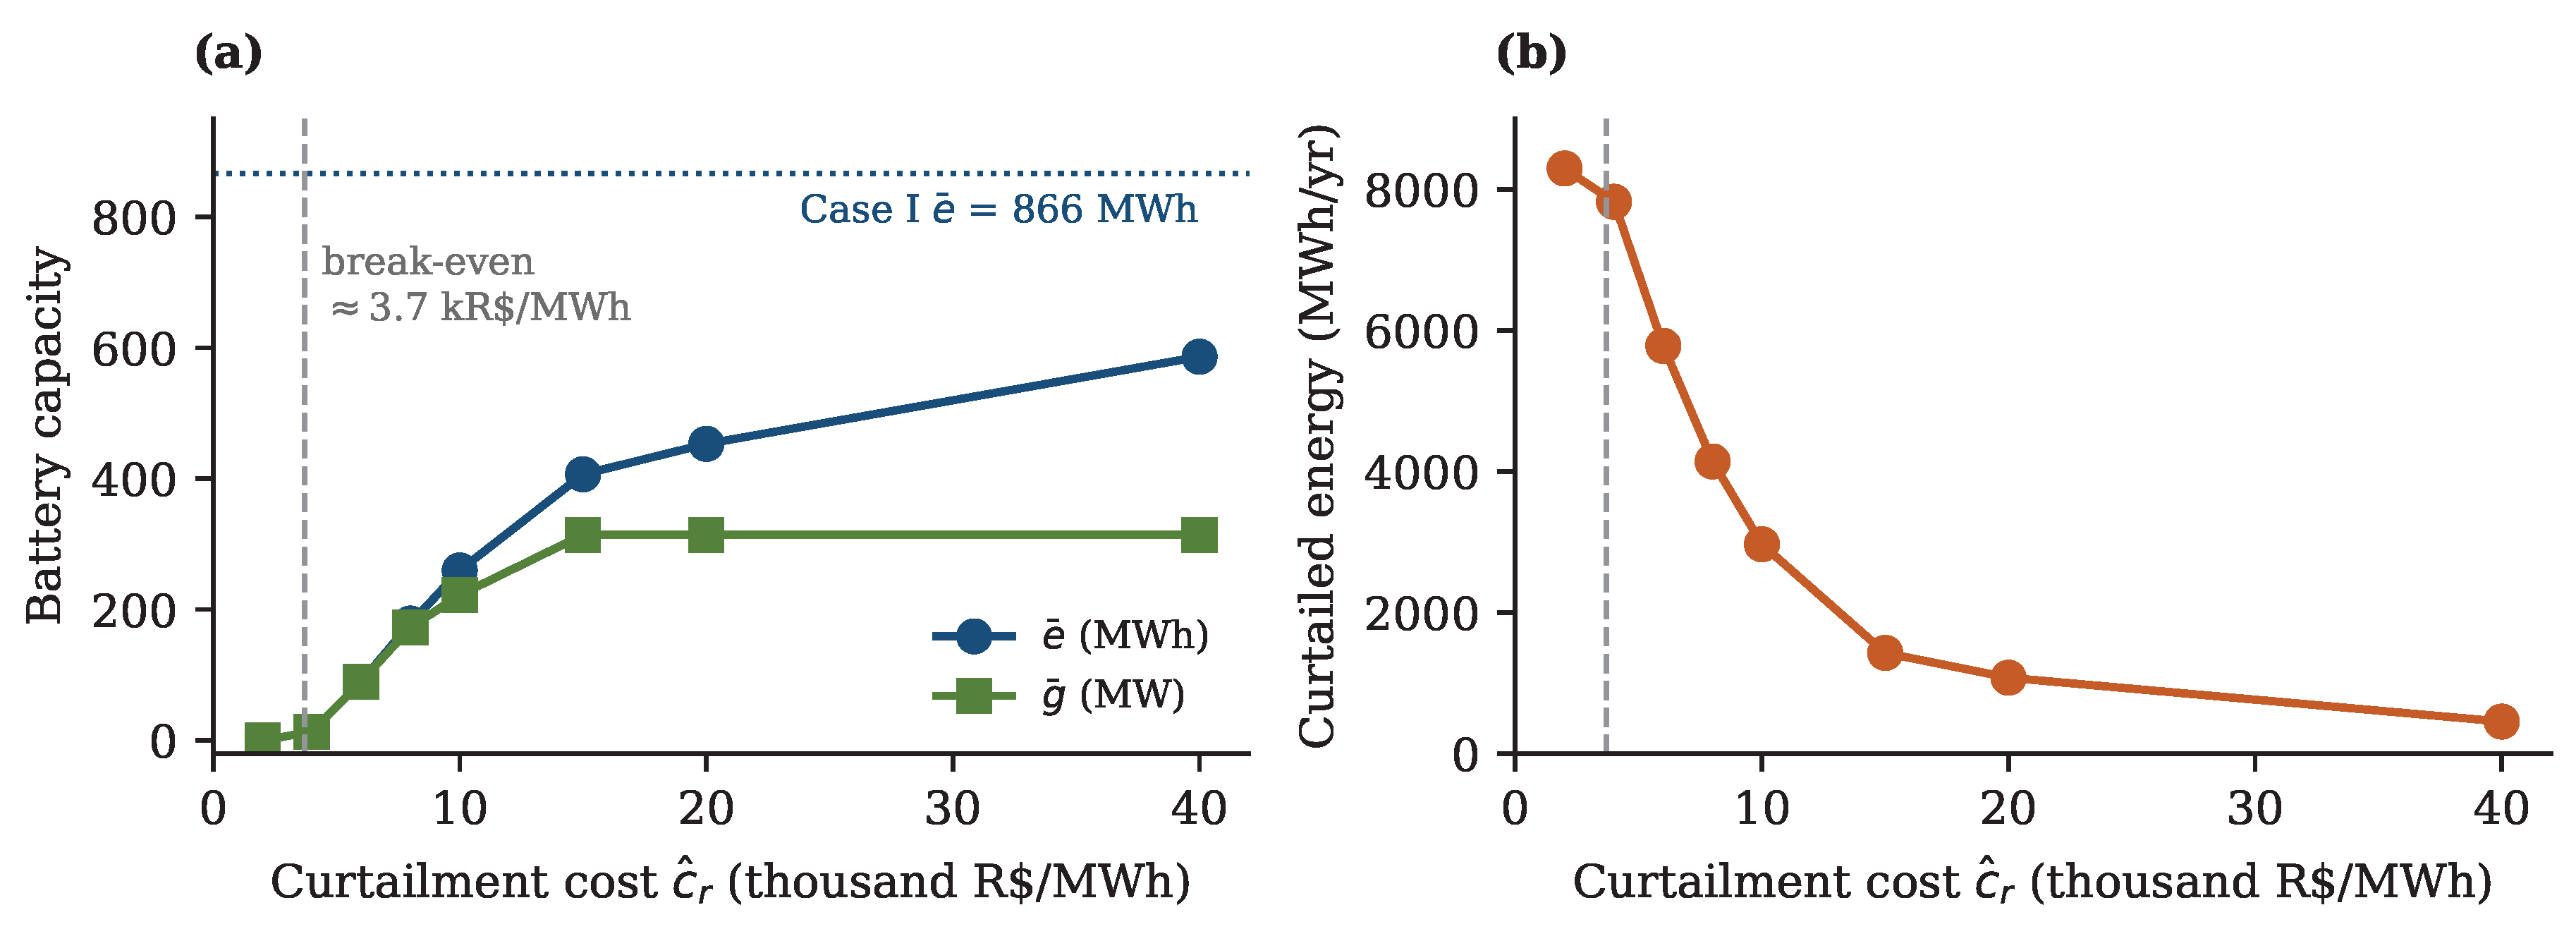
Table 1.
Notation.
| Symbol | Meaning |
|---|---|
| Hour of a typical day (), typical day (), month (), scenario (S) | |
| Calendar days in month m represented by typical day d | |
| Constant DC load (MW) | |
| , | Hosting capacity at the DC bus (MW); bus spot price (R$/MWh) |
| , | Gap and surplus, Equation (1) (MW) |
| Transmission-usage tariff (R$/MW/month) | |
| , | Annualized battery investment cost per unit of energy (R$/MWh/year) and of power (R$/MW/year) |
| Discharge efficiency | |
| Unit cost of DC load curtailment (R$/MWh), Case II only | |
| , | Battery energy (MWh) and power (MW) capacities |
| State of charge at the beginning of hour t (MWh) | |
| , | Power drawn from the grid to charge the battery; power withdrawn from storage, of which reaches the DC (MW) |
| Peak charging power drawn from the grid in month m, scenario s (MW) | |
| DC load curtailment (MW), Case II only |
Table 2.
Model parameters.
| Parameter | Symbol | Value | Comment |
|---|---|---|---|
| DC load | 450 MW | Constant; 350–650 MW in sensitivity runs | |
| Discharge efficiency | 0.95 | ||
| Battery capital cost | – | 1250 R$/kWh | Energy-based, including power conversion |
| Discount rate / lifetime | – | 8% / 20 years | Capital recovery factor 0.1019 |
| Annualized battery cost | 127,315 R$/MWh/yr | ||
| Annualized power cost | 0 | Included in the energy-based cost | |
| MUST tariff | 16,460 R$/MW/month | Levied on the battery’s monthly peak recharge, expected over scenarios | |
| Curtailment cost | 8000 R$/MWh | Case II; 2000–40,000 R$/MWh in sensitivity runs | |
| Scenarios | S | 100 | Equiprobable |
Table 3.
Calendar days represented by each typical day ().
| Jan | Feb | Mar | Apr | May | Jun | Jul | Aug | Sep | Oct | Nov | Dec | |
|---|---|---|---|---|---|---|---|---|---|---|---|---|
| Typical day 1 | 22 | 20 | 23 | 20 | 23 | 22 | 21 | 23 | 21 | 23 | 20 | 22 |
| Typical day 2 | 9 | 8 | 8 | 10 | 8 | 8 | 10 | 8 | 9 | 8 | 10 | 9 |
Table 4.
Case I: optimal battery sizing and annual costs as a function of the DC load.
| DC Load (MW) | 350 | 400 | 450 | 500 | 550 |
|---|---|---|---|---|---|
| Battery energy (MWh) | 400.83 | 601.81 | 866.45 | 1415.85 | – |
| Battery power (MW) | 240.19 | 292.83 | 345.46 | 398.09 | – |
| Duration (h) | 1.67 | 2.06 | 2.51 | 3.56 | – |
| Investment (R$ million/yr) | 51.03 | 76.62 | 110.31 | 180.26 | – |
| MUST (R$ million/yr) | 0.10 | 0.20 | 0.39 | 0.73 | – |
| Energy (R$ million/yr) | 0.25 | 0.52 | 0.96 | 1.77 | – |
| Total (R$ million/yr) | 51.38 | 77.33 | 111.66 | 182.76 | – |
| Cost (R$ thousand/MW/yr) | 146.8 | 193.3 | 248.1 | 365.5 | – |
Note: The optimization is infeasible for a DC load of 550 MW.
Table 6.
Case II: how the 734 gap hours are covered at MW and R$/MWh (one of the optimal operations).
Table 6.
Case II: how the 734 gap hours are covered at MW and R$/MWh (one of the optimal operations).
| Battery only | Battery and curtailment | Curtailment only | |
|---|---|---|---|
| Gap hours | 374 (51.0%) | 162 (22.1%) | 198 (27.0%) |
| Average gap (MW) | 48.1 | 153.0 | 85.4 |
Table 7.
Case II: optimal battery, curtailed energy and annual cost as a function of the curtailment cost at MW.
Table 7.
Case II: optimal battery, curtailed energy and annual cost as a function of the curtailment cost at MW.
| (R$/MWh) | (MWh) | (MW) | Duration (h) | Curtailed (MWh/yr) | Total (R$ M/yr) |
|---|---|---|---|---|---|
| 2000 | 0 | 0 | – | 8294 | 16.6 |
| 4000 | 13.33 | 13.33 | 1.00 | 7822 | 33.1 |
| 6000 | 89.94 | 89.94 | 1.00 | 5779 | 46.6 |
| 8000 | 178.51 | 172.51 | 1.03 | 4140 | 56.6 |
| 10,000 | 259.73 | 222.05 | 1.17 | 2966 | 63.6 |
| 15,000 | 406.59 | 314.20 | 1.29 | 1426 | 74.3 |
| 20,000 | 453.13 | 314.20 | 1.44 | 1074 | 80.4 |
| 40,000 | 586.28 | 314.20 | 1.87 | 452 | 94.0 |
| No curtailment (Case I) | 866.45 | 345.46 | 2.51 | 0 | 111.7 |
Disclaimer/Publisher’s Note: The statements, opinions and data contained in all publications are solely those of the individual author(s) and contributor(s) and not of MDPI and/or the editor(s). MDPI and/or the editor(s) disclaim responsibility for any injury to people or property resulting from any ideas, methods, instructions or products referred to in the content. |
© 2026 by the authors. Licensee MDPI, Basel, Switzerland. This article is an open access article distributed under the terms and conditions of the Creative Commons Attribution (CC BY) license (http://creativecommons.org/licenses/by/4.0/).
Copyright: This open access article is published under a Creative Commons CC BY 4.0 license, which permit the free download, distribution, and reuse, provided that the author and preprint are cited in any reuse.