

Submitted:
04 November 2026
Posted:
05 November 2026
You are already at the latest version
Abstract
Background: Flexible ureteroscope procurement must reconcile procedural reliability, expenditure, and environmental burden. Published comparisons support selective device use, but provide limited guidance on allocating a constrained reusable inventory. Methods: We developed a deterministic decision model spanning 27 weighted combinations of anatomical complexity, device wear, and handling exposure. Separate equations represented procedural interruption and repair. Six policies were compared using explicitly hypothetical costs and carbon inputs, an illustrative 8% reusable interruption ceiling, and 80% reusable capacity. Training was represented by an assumed log-odds reduction and examined against a null effect. Results: The reliability and capacity constrained policy cost USD 679.46 per procedure, generated 7.09 kg carbon dioxide equivalent, and produced 3.33 expected interruptions per 100 procedures. Conditional training reduced these values to USD 667.25, 6.99 kg, and 2.75 interruptions. Training ceased saving money above USD 32.22 per procedure. Environmental rankings reversed under alternative carbon assumptions. Conclusions: Explicit reliability constraints expose trade-offs concealed by cost minimisation. Training benefits and environmental preferences remain conditional modelling results requiring local measurement and prospective validation.
Keywords:
ureteroscopy
; device allocation
; surgical education
; decision analysis
; environmental sustainability
1. Introduction
Flexible ureteroscopy places a recurring operational decision inside a clinically demanding procedure: whether to use a reusable or single-use instrument. The choice affects expenditure, reprocessing workload, waste, and equipment availability during difficult access, deflection, or vision. Contemporary stone management requires attention to infection, anatomy, stone characteristics, and procedural suitability [1]. A procurement rule based only on purchase price cannot represent these clinical conditions. Equally, an environmental preference cannot justify deploying an instrument that fails inspection or lacks the functionality needed for the planned procedure.
The economic literature does not identify one universally preferable device. Cost comparisons vary with annual procedure volume, acquisition arrangements, repair frequency, and the accounting boundary. Historical institutional evaluations established the importance of repair and utilisation [2], [3]. More recent micro-costing demonstrates that reusable instruments can remain economical in a sufficiently active service [4]. However, an average institutional cost cannot show whether using a particular instrument for a difficult case is preferable to preserving it for another procedure. The CROES global study illustrates the breadth of clinical variation across international ureteroscopy practice [5]. This distinction becomes material when a department has limited functional instruments or inadequate reprocessing capacity.
Environmental comparisons are similarly dependent on their inventories and assumptions. A ureteroscope carbon-footprint analysis estimated almost identical emissions for single-use and reusable pathways [6]. A subsequent ecological analysis favoured reusable instruments by a relatively small absolute margin [7]. Manufacturing allocation, repair transport, lifetime, reprocessing energy, and disposal can change this comparison. Local decisions therefore require transparent boundaries and identifiable switching conditions.
Instrument handling adds a potentially modifiable component. Training may change how operators negotiate difficult anatomy, insert accessories, inspect equipment, or recognise excessive mechanical stress. A mandatory training programme has been associated with longer reusable ureteroscope durability [8]. Such findings justify studying education within procurement, although a before-and-after association cannot establish an independent causal effect. Training also consumes staff time and educational resources. Its economic value depends on the size and persistence of the resulting change, rather than on the existence of a curriculum alone.
The decision architecture needs to be distinguished from the prediction model that might eventually support it. An allocation system can be evaluated formally before sufficient device-linked data exist to estimate dependable clinical risks. This study takes that approach through an explicitly specified computational experiment. Its risk equations and intervention effects are hypothetical, and no clinical dataset is analysed. The formulation exposes conditions that should be measured before a learned model is deployed, while avoiding claims of predictive performance from simulated outcomes.
We ask whether separating procedural interruption from repair, imposing a reliability ceiling before financial optimisation, and incorporating limited reusable capacity changes the apparent value of hybrid allocation. A second question concerns the conditions under which an assumed handling intervention would offset its cost. The contribution is a reproducible allocation formulation and a set of switching conditions. Selective device use has already been proposed for high-risk procedures [9], [10]; its invention is not claimed here. Instead, the analysis makes eligibility, opportunity cost, and environmental uncertainty inspectable. The resulting hypotheses concern operational decisions in endourology and require empirical testing before implementation.
2. Literature Review
2.1. Comparative Clinical Performance and Device Reliability
Comparative evidence supports evaluating instruments within specific procedures rather than assuming that disposable construction guarantees superior clinical performance. Prospective randomised comparisons have assessed single-use and reusable digital instruments during stone treatment [11], [12]. The relevant outcomes include stone clearance, procedural time, visibility, complications, and instrument malfunction. These outcomes cannot be interchanged: a device swap may interrupt a procedure without causing a complication, whereas postoperative sepsis may occur without any instrument failure. Our operational interruption endpoint therefore supports no inference about stone-free status or patient safety. Another multicentre randomised comparison reported clinical and infection outcomes, but those results remain dependent on its devices and local reprocessing context [13].
Single-use devices also require a realistic failure pathway. In a randomised study of endoscopic combined intrarenal surgery, single-use ureteroscope breakage occurred in four of 89 procedures [14]. That proportion should not be transferred directly to routine flexible ureteroscopy because the procedure, device, and setting differ. An earlier prospective case-control comparison also reported single-use failures [15]. Together these findings argue against assigning every single-use device a zero malfunction probability. An empirical model should estimate device-specific risks and distinguish pre-insertion failure, intraoperative malfunction, reprocessing discoveries, and repair following cumulative deterioration.
Durability studies show why these distinctions matter. Prospective evaluations have linked damage to instrument use and handling circumstances [16], [17]. Comparisons between hospital and ambulatory settings identify handling between procedures as another plausible source of damage [18]. Such evidence supports measuring exposure, but does not establish a universal numerical failure equation. Lower-pole evidence further shows why anatomy needs careful interpretation. A secondary analysis of the Qi trial examined that subgroup [19], while a retrospective comparison examined infundibulopelvic angle [20]. The secondary analysis is not an independent randomised population, and neither study validates a universal device-selection angle. Our assumed coefficients encode directional hypotheses. Device-linked observations are needed to estimate them and establish whether wear adds information beyond instrument model and procedure type.
2.2. Economic and Environmental Boundaries
Economic studies use different amortisation rules, repair contracts, staff costs, and case volumes. Early assessments found that reusable expenditure can rise substantially with repair requirements [2], [3]. Other institutional evaluations projected the budget consequences of adopting disposable digital ureteroscopes [2]. Zekraoui and colleagues’ Canadian analysis reported reusable costs within a high-volume service and examined the procedure volume at which reusable use becomes competitive [4]. These local results cannot become transferable tariffs through unadjusted currency conversion or combination across years.
Economic comparison must also distinguish marginal scheduling decisions from long-run procurement. Once an instrument has been purchased, its historical acquisition cost is not an immediately avoidable expense. Over a replacement horizon, however, capital recovery and expected service life matter. Our primary perspective is the latter. It excludes costs common to both pathways and includes device acquisition, reprocessing, repair, and a limited rescue pathway. It therefore estimates device-related operational expenditure, not the total cost of stone surgery or a complete cost-effectiveness ratio.
Life-cycle work reinforces the need to disclose environmental boundaries. Davis and colleagues reported 4.43 and 4.47 kg carbon dioxide emissions per case for single-use and reusable approaches, respectively [6]. Schwinger and colleagues reported a different direction and magnitude under another inventory [7]. These results should not be averaged into an apparently precise universal footprint. ISO 14040 and ISO 14044 require explicit goals, functional units, inventories, and interpretation [21], [22]. Our assumed carbon burdens do not constitute ISO-compliant life-cycle assessment. Equal-burden and reversed-burden scenarios test whether the base assumptions predetermine environmental conclusions.
2.3. Education and Accountable Decision Support
The handling literature offers a practical reason to include education, but its endpoint is usually equipment durability rather than independently adjudicated patient benefit. Porto and colleagues observed improved instrument durability after introducing mandatory training [8]. A real-world reprocessing assessment also found residual contamination, supporting workflow verification without establishing a device-specific patient infection probability [23]. That durability improvement could also reflect changes in supervision, instrument mix, case selection, or reporting. We therefore examine uncertain training effects, including no effect, without attributing an established benefit to a particular curriculum.
The digital component requires similar restraint. TRIPOD+AI addresses transparent reporting of prediction models, and PROBAST+AI addresses bias and applicability [24], [25]. Calibration is necessary when a predicted probability controls eligibility [26], while DECIDE-AI emphasises evaluation of actual clinical use [27]. Future interventional studies would also need suitable protocol and trial reporting [28], [29]. Decision-curve methodology likewise emphasises consequences beyond discrimination, although no decision-curve analysis is claimed here [30]. These standards motivate inspectable risk limits, prices, and allocation reasons. We examine their interaction without claiming that artificial intelligence itself improves ureteroscopy.
3. Methodology
3.1. Study Design and Evidence Boundary
We performed a deterministic factorial decision analysis, reporting the economic framework with reference to CHEERS 2022 and established modelling guidance [31], [32]. Investigator-specified inputs and their provenance are documented in the supplement. Targeted PubMed, publisher, and official-source searches informed the model through 3 November 2026. This focused narrative synthesis involved neither exhaustive screening nor pooled effects. No patient records were analysed or generated. Probabilities, case-mix weights, and intervention effects are hypothetical; the empirical results report executed computations.
The functional unit was one scheduled flexible ureteroscopy within an illustrative service. The model represented 27 combinations of complexity, reusable-device wear, and handling exposure, each taking values zero, one, or two. Marginal weights were (0.45, 0.35, 0.20), (0.50, 0.35, 0.15), and (0.50, 0.35, 0.15), respectively. Their products define an independent hypothetical case mix. Wear varies only among instruments passing mandatory inspection; failed instruments are excluded before allocation.
3.2. Separate Risk Equations
For archetype i, let c denote complexity, w wear, h handling exposure, and T the training indicator. The assumed training intensity is θ, and δ shifts baseline log-odds during sensitivity analysis. The logistic operator and training term are
Distinct marginal probabilities represent reusable interruption pR, reusable repair qR, and single-use interruption pS:
The assumed coefficients allow complexity to amplify wear-associated risk. Training reduces handling-related risk in both pathways, with no effect when h equals zero. Mitigation is capped at each equation’s handling coefficient, so greater exposure cannot become protective. The subscript Q identifies mitigation in the repair equation. Repair and interruption may coexist. Marginal probabilities suffice for additive expenditure; modelling correlated sequences or downtime would require their joint distribution. No infection probability, stone-free rate, quality-adjusted life-year, or complication reduction is simulated.
3.3. Expenditure and Environmental Accounting
Let A be reusable acquisition, L lifetime uses, R reprocessing cost, K repair cost, S single-use purchase plus disposal, D interruption-related delay, and k training cost per scheduled procedure. Expected expenditure is
Each interruption incurs one functional single-use rescue instrument and one delay charge. Recursive rescue failure, additional admissions, and cancellations are excluded. Repair and rescue are charged separately through qR and pR. Table 1 prices are illustrative US dollars, without a claimed price year or market quotation. Service-level training costs apply across all procedures, including those without handling exposure.
For assumed base environmental burdens BR and BS, repair burden BK, and training overhead BT per procedure, expected emissions are
Base burdens cover stipulated acquisition, routine processing, and disposal, excluding separately charged repair and rescue. Training adds an assumed aggregate overhead of 0.05 kg per procedure, varied separately. Delay energy and shared theatre emissions are excluded; no local inventories were supplied. Accordingly, the results compare a restricted carbon boundary and cannot establish the environmental footprint of complete care.
All values are hypothetical. USD amounts are illustrative accounting units without a market price year. Carbon values are kg CO₂e within the restricted device boundary. Risk coefficients and case-mix weights are specified in the text.
3.4. Reliability Constrained Allocation
Let xi be the fraction of archetype i allocated a reusable instrument, ωi its weight, b the available reusable share, τ an operational interruption ceiling, and λ a carbon shadow price in USD per kg carbon dioxide equivalent. The service objective is
Allocation must satisfy
The operational ceiling supplements clinical suitability, approved reprocessing, and inspection; it is not an acceptable patient-risk threshold. Single-use options are assumed feasible throughout the tested range, although future services should specify their device-specific limits. Fractional allocation denotes proportions of repeated equivalent cases. Equal reusable resource requirements mean that ranking eligible archetypes by incremental objective saving solves the allocation exactly.
The six comparators were universal reusable use, universal single-use, an unconstrained economically optimised hybrid, a hybrid with the reliability ceiling, a hybrid with both ceiling and capacity, and the latter with assumed training. Universal benchmarks ignore inventory limits. Training changes event probabilities and reusable eligibility. We used τ = 0.08, b = 0.80, θ = 0.60, and λ = 0.10 as transparent illustrative settings.
Two decision thresholds improve interpretation. If Δp denotes pR minus pS, reusable use is economically preferable before the reliability restriction when
For a trained policy, its maximum expenditure-neutral programme charge is
These equations preserve the currency and probability units. They avoid an unexplained weighted sum in which dollars, emissions, and clinical outcomes receive arbitrary dimensionless coefficients.
3.5. Sensitivity Analysis and Verification
One-way analyses varied training intensity from zero to 1.2, programme cost from USD 0 to 80, reusable capacity from 40% to 100%, and the reliability ceiling from 3% to 15%. Further analyses varied single-use prices, reusable lifetime, common log-odds shifts, and carbon valuation. Equal-base and reversed-base carbon scenarios tested the environmental preference. These scenarios were motivated by heterogeneous life-cycle findings, without importing any published whole-procedure inventory as a component estimate.
A six-factor, three-level stress grid enumerated 729 combinations. Its axes were training intensity, single-use expenditure, reusable lifetime, capacity, baseline risk shift, and single-use environmental burden. Scenario frequencies are counts within this declared design, not probabilities of cost-effectiveness. Because expectations were calculated directly, random seeds, Monte Carlo error, hypothesis tests, and confidence intervals are inapplicable. This separation follows simulation-reporting and uncertainty guidance [33], [34]. Algebraic checks and comparison with a linear-programming solver assessed implementation correctness. Such verification is distinct from external validation [32]. Implementation used Python 3.12.14, NumPy 2.3.5, pandas 2.2.3, and SciPy 1.17.0. All 54 solver comparisons passed, with maximum objective discrepancy 4.55 × 10⁻¹³ USD; 351 additional comparisons confirmed nondecreasing risk with handling exposure. Code, complete archetype outputs, and sensitivity results accompany the manuscript.
4. Empirical Results and Interpretation
4.1. Executed Base Scenario
The universal reusable policy produced the lowest carbon burden in the base scenario, at 5.27 kg carbon dioxide equivalent per procedure, and cost USD 596.70. Its expected interruption rate was 6.18 per 100 procedures. However, 19.60% of the assumed case mix received a reusable instrument despite exceeding the illustrative 8% interruption ceiling. It also required a reusable share above available capacity. Its attractive expenditure therefore does not represent an admissible solution to the constrained decision. The universal single-use reference cost USD 1443.07, produced 16.54 kg, and yielded 1.47 expected interruptions per 100 procedures. This interruption difference follows from assumptions, not observed clinical effects.
Unconstrained hybrid allocation selected reusable instruments for 98.50% of procedures. It reduced expenditure modestly to USD 590.53 while yielding 5.65 expected interruptions per 100 procedures. Nevertheless, 18.10% of procedures still received a reusable instrument above the ceiling. Only the most expensive reusable assignments switched, leaving many above-ceiling assignments economically attractive. Financial penalties therefore cannot silently substitute for an explicit eligibility decision.
Adding the reliability restriction reduced reusable allocation to 80.40%. Expenditure increased to USD 676.46 and carbon burden to 7.04 kg, while expected interruptions fell to 3.35 per 100 procedures. Enforcing the 80% capacity limit made a further small adjustment: expenditure reached USD 679.46, carbon burden 7.09 kg, and interruption expectation 3.33 per 100 procedures. Eligible reusable demand happened to approach capacity in this scenario; inventory constraints need not be minor elsewhere. Figure 1 and Table 2 show the policy outcomes.
RU denotes reusable. Above-ceiling exposure is the percentage of all procedures assigned reusable when its interruption probability exceeds 8%. Universal benchmarks and the unconstrained policy are not all feasible under the stated restrictions. Training includes USD 20 and 0.05 kg per procedure. Values are analytic expectations, not observed events; no sampling intervals apply.
4.2. Conditional Contribution of Training
With the stipulated training effect and USD 20 programme charge, the constrained trained policy cost USD 667.25, produced 6.99 kg, and yielded 2.75 expected interruptions per 100 procedures. Relative to the same constrained policy without training, this represented USD 12.22 lower expenditure, 0.10 kg lower emissions, and 0.57 fewer interruptions per 100 procedures. The reusable share remained 80%, although the share eligible for reusable use increased from 80.40% to 84.75%. Training therefore improved the allocation opportunity set without increasing the number of available reusable instruments. Some of its potential capacity benefit remained unrealised. At 40% reusable capacity, training increased expenditure from USD 1030.07 to USD 1040.46. At capacity of at least 85%, training enabled more reusable assignments and reduced expenditure from USD 676.46 to USD 627.33. Thus educational value depends on whether newly eligible cases can actually access reusable equipment.
Expected reusable repairs decreased from 4.06 to 3.40 per 100 procedures. These quantities include only reusable repair events, whereas interruption expectations include both device pathways. These endpoints can overlap. Training also affects assumed single-use interruption, but the analysis cannot identify device-specific educational effects or contributions from individual exercises.
Equation 8 gave a training expenditure threshold of USD 32.22 per scheduled procedure. Below that charge, assumed failure and repair reductions offset training expenditure. This is a threshold for local investigation, not a recommended tariff. The null-effect scenario was particularly informative: training then added its entire USD 20 charge and 0.05 kg overhead without changing interruptions or repairs. Figure 2 displays how the expenditure result depends on assumed intensity and programme cost. Carbon overhead had a separate break-even value of 0.146 kg per procedure; at 0.25 kg, trained emissions exceeded the untrained reference.
4.3. Carbon Rankings and Switching Conditions
The base environmental contrast strongly favoured reusable instruments before repair and rescue were added. Consequently, reliability restrictions increased emissions by directing some procedures toward the higher-burden single-use route. This hypothetical inventory establishes neither reconciliation of published assessments nor a hospital-specific procurement effect. The equal-base scenario reverses the comparison between universal policies because reusable repairs and their associated burdens become influential. A larger reusable base burden makes the direction more pronounced.
All three are hypothetical component inventories; none reproduces a published LCA. Policies are untrained; constrained includes the reliability ceiling and 80% capacity. Added repair and rescue burdens follow Equation 4.
Figure 3.
Untrained policy carbon burdens under three illustrative component inventories. Labels give reusable then single-use base kg CO₂e per procedure, before repair and rescue. Shapes distinguish policies in grayscale. The constrained hybrid applies the reliability ceiling and 80% capacity. These deterministic scenarios are not reanalyses of published life-cycle inventories.
Figure 3.
Untrained policy carbon burdens under three illustrative component inventories. Labels give reusable then single-use base kg CO₂e per procedure, before repair and rescue. Shapes distinguish policies in grayscale. The constrained hybrid applies the reliability ceiling and 80% capacity. These deterministic scenarios are not reanalyses of published life-cycle inventories.
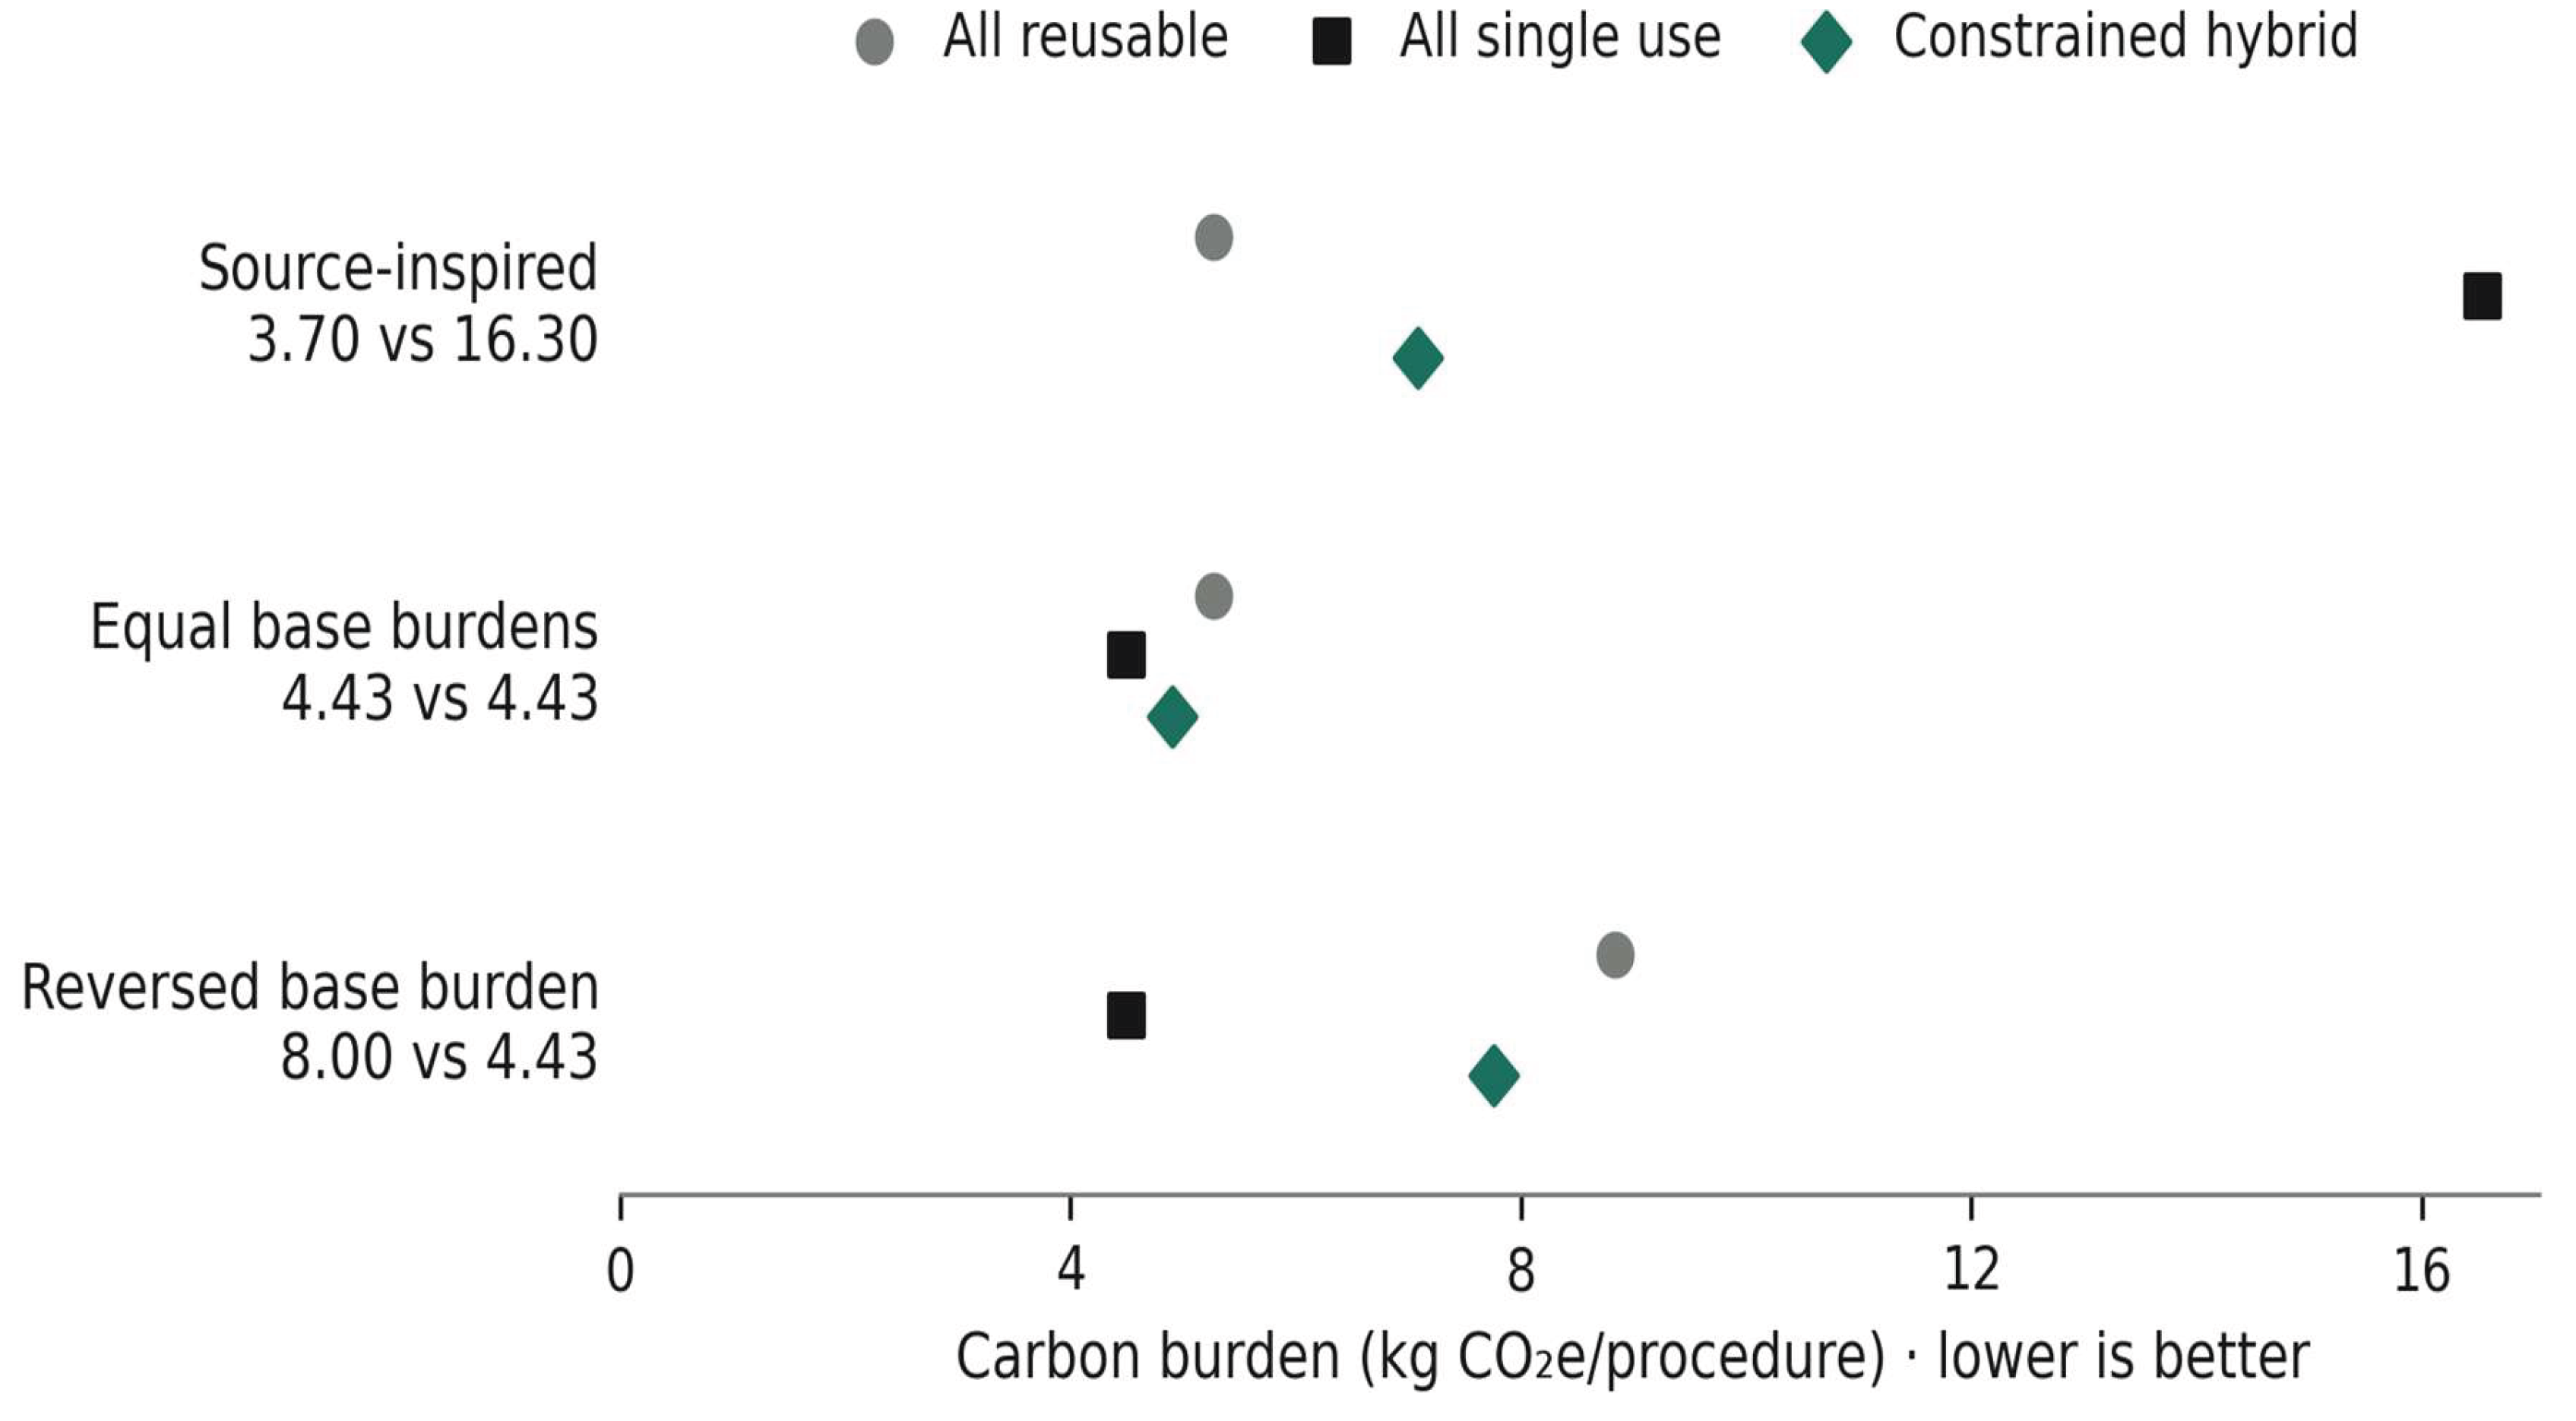
Environmental assessment must precede a sustainability claim. Measuring electricity alone is insufficient when instrument lifetime, repair logistics, or manufacturing allocation can dominate the difference. Adding repairs already included in a published whole-device footprint would double count them. Table 3 uses constructed component burdens to explore structural sensitivity, not recreate published inventories.
The carbon shadow price also requires interpretation. At USD 0.10 per kg, a difference of approximately ten kg changes the objective by about one dollar, which is small beside the assumed device expenditure. The base allocation is therefore driven chiefly by expenditure and eligibility. An institution that wishes to impose a separate emissions budget could add a carbon constraint, but doing so requires an agreed resource target and consideration of feasibility. Enlarging a carbon weight until it produces a desired allocation would conceal the normative choice. Reporting the budget or valuation explicitly makes the decision reviewable.
4.4. Multivariable Stress Testing

Table 4.
Prespecified multivariable stress design and conditional training results.
| Axis or outcome | Levels or result |
|---|---|
| Training intensity θ | 0, 0.60, 1.20 |
| Single-use expenditure S | 900, 1,415, 1,900 USD |
| Reusable lifetime L | 60, 120, 240 uses |
| Reusable capacity b | 60%, 80%, 100% |
| Common log-odds shift δ | −0.40, 0, +0.40 |
| Single-use base carbon Bₛ | 4.43, 10.00, 16.30 kg |
| Lower training expenditure | 414 / 729 settings |
| Lower training carbon | 450 / 729 settings |
| Cost difference range | −250.95 to +20.00 USD/use |
| Carbon difference range | −2.029 to +0.050 kg/use |
The full factorial design contains 3⁶ = 729 equally enumerated settings. Differences are trained minus untrained constrained allocation; negative values favour training. Training cost and carbon overhead remain USD 20 and 0.05 kg per procedure. Counts describe grid coverage, not probabilities or confidence levels.
Training saved expenditure in 414 of 729 grid settings and lowered emissions in 450. Cost differences ranged from −USD 250.95 to +USD 20.00 per procedure; carbon differences ranged from −2.029 to +0.050 kg. The upper endpoint was the full USD 20 charge under no training effect. Their magnitude depends on prices, lifetime, capacity, and baseline risk. Favourable-scenario counts describe this grid, not a hospital’s probability of saving money.
Training increased carbon burden in some settings, including those with no handling effect, because the programme overhead remained. Although event probabilities necessarily improve when a positive training coefficient is applied, net resource benefits do not follow automatically. A fuller assessment would measure travel, simulator production, consumables, and time displaced from other activities instead of using an aggregate assumed overhead. The grid likewise excludes correlations among high complexity, device wear, and handling exposure. Such correlations could change which cases receive scarce reusable capacity even when the marginal distributions remain unchanged.
4.5. Interpretation for Endourology Services
The model’s main finding is the separation between an economical policy and a policy satisfying an explicit reliability rule. Under the base assumptions, accepting the reliability and capacity constraints increased expenditure relative to unconstrained allocation while reducing interruption expectations. That trade-off is relevant to theatre planning, but its clinical importance cannot be inferred without observing the duration, consequences, and rescue success of interruptions. A single short image failure and a prolonged device-related delay should not automatically receive the same operational weight in an empirical implementation.
The proposed data architecture should therefore link a procedure identifier, instrument serial identifier, preoperative inspection, actual usage, repair reports, and reprocessing records. Stone burden must retain its physical definition: surface area is measured in square millimetres and volume in cubic millimetres. A device-life log should distinguish routine use, repair, and retirement rather than treating every reprocessing cycle as equivalent wear. Operator measures should record supervision and handling exposure, with safeguards against discouraging appropriate trainee participation. Device choice can itself influence outcomes; an observational prediction model cannot remove that allocation bias merely by including an experience variable.
A prospective programme would first observe local outcomes without changing allocation, then evaluate calibrated predictions in another time period and centre. Validation sample size should target precision of clinically relevant performance measures and event prevalence, rather than a convenient total record count [35]. Missing device identifiers should trigger data-quality review rather than a reassuring default probability. Eligibility should incorporate approved indications and reprocessing instructions. FDA communications illustrate that approved sterilisation requirements can be model-specific [36]. Neither this framework nor a sustainability objective authorises changing validated infection-prevention procedures. The allocation system should preserve clinician override and record its rationale, including unmodelled anatomy or equipment concerns.
The educational and allocation components should subsequently be evaluated separately or within a design that can estimate their joint and individual contributions. A combined before-and-after deployment would make it difficult to determine which component caused a change. Cluster or stepped-wedge designs may address operational rollout, but require allowance for calendar time, contamination, and the limited information available from few clusters [37]. A defensible power calculation must specify event rates, cluster correlation, rollout periods, and the effect to be estimated. Patient-centred outcomes, resource measurement, and independent event adjudication would be specified before recruitment.
Several limitations define the present contribution. The risk functions and case mix are assumptions; devices do not evolve through sequential wear states; capital recovery is simplified; and capacity is represented as a service share rather than an actual daily schedule. The model does not quantify treatment efficacy, infection, complications, complete theatre emissions, or long-term procurement contracts. Its novelty is accordingly methodological and conditional. It provides a testable framework for investigating whether locally measured risk, education, and environmental data change device allocation, while exposing exactly where stronger evidence is required.
5. Conclusion
Reusable and single-use ureteroscopes cannot be ranked meaningfully without specifying reliability requirements, available inventory, and the accounting boundary. This computational analysis demonstrates how those conditions alter allocation across an explicitly hypothetical case mix. An unconstrained policy favoured reusable instruments for nearly all procedures, yet exposed 18.10% of the assumed workload to reusable interruption probabilities above the illustrative ceiling. Reliability and capacity restrictions changed the preferred allocation and made its operational trade-offs visible.
Training improved modelled outcomes only under the stipulated effect. In the base scenario, its expenditure-neutral threshold was USD 32.22 per procedure; with no effect, the programme simply added cost. Environmental rankings changed when component carbon burdens changed, precluding a universal sustainability claim. These results support local measurement and threshold analysis rather than immediate clinical deployment.
The next empirical step is prospective linkage of procedure, device, repair, and reprocessing records, followed by external validation and evaluation of the allocation and educational components. The reproducible formulation supplies a practical basis for that work. It establishes conditional decision rules, not clinical effectiveness, a validated artificial-intelligence system, or an acceptable patient-risk threshold.
Supplementary Materials
The following supporting information can be downloaded at the website of this paper posted on Preprints.org.
Ethics and Consent
This computational study uses hypothetical aggregate archetypes and public literature, with no human participants, individual records, or animal experiments. No institutional approval is claimed.
Data and Code Availability
The accompanying reproducibility package contains the complete model, parameters, archetype tables, sensitivity outputs, and evidence notes. There are no patient data.
Generative Artificial Intelligence Disclosure
AI assisted with study formulation, literature synthesis, code development, analysis and language Editing. Numerical outputs were calculated by the supplied Python model. The authors take responsibility for all the information in the research.
Funding and Conflicts of Interest
To be confirmed by the authors before submission; no funding or competing-interest declaration has been inferred.
References
- European Association of Urology. “EAU Guidelines on Urolithiasis,” 2026. Available online: https://uroweb.org/guidelines/urolithiasis/chapter/guidelines (accessed on Nov. 3 2026).
- Martin, C. J.; et al. The Economic Implications of a Reusable Flexible Digital Ureteroscope: A Cost-Benefit Analysis. J. Urol. 2017, vol. 197(no. 3 Pt1), 730–735. [Google Scholar] [CrossRef]
- Taguchi, K.; et al. Micro-Costing Analysis Demonstrates Comparable Costs for LithoVue Compared to Reusable Flexible Fiberoptic Ureteroscopes. J. Endourol. 2018, vol. 32(no. 4), 267–273. [Google Scholar] [CrossRef]
- Zekraoui, et al. Micro-cost analysis of reusable compared to affordable single-use flexible ureteroscopes. Can. Urol. Assoc. J. 2026, vol. 20(no. 2), 31–36. [Google Scholar] [CrossRef]
- de la Rosette, J.; et al. The Clinical Research Office of the Endourological Society Ureteroscopy Global Study: Indications, Complications, and Outcomes in 11,885 Patients. J. Endourol. 2014, vol. 28(no. 2), 131–139. [Google Scholar] [CrossRef]
- Davis, N. F.; McGrath, S.; Quinlan, M.; Jack, G.; Lawrentschuk, N.; Bolton, D. M. Carbon Footprint in Flexible Ureteroscopy: A Comparative Study on the Environmental Impact of Reusable and Single-Use Ureteroscopes. J. Endourol. 2018, vol. 32(no. 3), 214–217. [Google Scholar] [CrossRef]
- Schwinger, M.; Kalogirou, C. Green endoscopy: Economic and ecological evaluation of single-use versus reusable ureterorenoscopes. BJUI Compass 2025, vol. 6(no. 10), Art. no. e70100. [Google Scholar] [CrossRef]
- Porto, J. G.; et al. Digital Flexible Ureteroscope: Evaluating Factors Responsible for Damage and Implementing a Mandatory Certification Program for Usage. J. Endourol. 2024, vol. 38(no. 12), 1372–1379. [Google Scholar] [CrossRef]
- Ozimek, T.; et al. Retrospective Cost Analysis of a Single-Center Reusable Flexible Ureterorenoscopy Program: A Comparative Cost Simulation of Disposable fURS as an Alternative. J. Endourol. 2017, vol. 31(no. 12), 1226–1230. [Google Scholar] [CrossRef]
- Hennessey, D. B.; Fojecki, G. L.; Papa, N. P.; Lawrentschuk, N.; Bolton, D. Single-use disposable digital flexible ureteroscopes: an ex vivo assessment and cost analysis. BJU Int. 2018, vol. 121, no. Suppl3, 55–61. [Google Scholar] [CrossRef]
- Qi, S.; et al. Single-Use Versus Reusable Digital Flexible Ureteroscopes for the Treatment of Renal Calculi: A Prospective Multicenter Randomized Controlled Trial. J. Endourol. 2020, vol. 34(no. 1), 18–24. [Google Scholar] [CrossRef]
- Ali; Eldakhakhny, A.; Abdelfadel, A.; Rohiem, M. F.; Elbadry, M.; Hassan, A. WiScope single use digital flexible ureteroscope versus reusable flexible ureteroscope for management of renal stones: a prospective randomized study. World J. Urol. 2022, vol. 40(no. 9), 2323–2330. [Google Scholar] [CrossRef]
- Bozzini, G.; et al. Disposable versus Reusable Ureteroscopes: A Prospective Multicenter Randomized Comparison. Res. Rep. Urol. 2021, vol. 13, 63–71. [Google Scholar] [CrossRef]
- Unno, R.; et al. Cost of reusable vs. single-use ureteroscopes in complex renal surgeries: a randomized cohort study. World J. Urol. 2025, vol. 43(no. 1, Art. no. 680). [Google Scholar] [CrossRef]
- Usawachintachit, M.; et al. A Prospective Case-Control Study Comparing LithoVue, a Single-Use, Flexible Disposable Ureteroscope, with Flexible, Reusable Fiber-Optic Ureteroscopes. J. Endourol. 2017, vol. 31(no. 5), 468–475. [Google Scholar] [CrossRef]
- Legemate, J. D.; et al. Durability of Flexible Ureteroscopes: A Prospective Evaluation of Longevity, the Factors that Affect it, and Damage Mechanisms. Eur. Urol. Focus 2019, vol. 5(no. 6), 1105–1111. [Google Scholar] [CrossRef]
- Taguchi, K.; et al. Identifying factors associated with need for flexible ureteroscope repair: a Western Endourology STone (WEST) research consortium prospective cohort study. Urolithiasis 2018, vol. 46(no. 6), 559–566. [Google Scholar] [CrossRef]
- Banerjee, et al. Durability of Digital Flexible Ureteroscope in University Hospital and Ambulatory Surgical Center: Is It Time to Rethink? J. Endourol. 2021, vol. 35(no. 3), 289–295. [Google Scholar] [CrossRef]
- Yang, E.; et al. Single-Use Digital Flexible Ureteroscopes as a Safe and Effective Choice for the Treatment of Lower Pole Renal Stones: Secondary Analysis of a Randomized-Controlled Trial. J. Endourol. 2021, vol. 35(no. 12), 1773–1778. [Google Scholar] [CrossRef]
- Jing, Q.; Liu, F.; Yuan, X.; Zhang, X.; Cao, X. Clinical comparative study of single-use and reusable digital flexible ureteroscopy for the treatment of lower pole stones: a retrospective case-controlled study. BMC Urol. 2024, vol. 24, Art.(no. 149). [Google Scholar] [CrossRef]
- International Organization for Standardization. “ISO 14040:2006 Environmental management—Life cycle assessment—Principles and framework,” 2006. Available online: https://committee.iso.org/standard/37456.html (accessed on Nov. 3 2026).
- International Organization for Standardization. “ISO 14044:2006 Environmental management—Life cycle assessment—Requirements and guidelines,” 2006. Available online: https://committee.iso.org/standard/38498.html (accessed on Nov. 3 2026).
- Ofstead, C. L.; Heymann, O. L.; Quick, M. R.; Johnson, E. A.; Eiland, J. E.; Wetzler, H. P. The effectiveness of sterilization for flexible ureteroscopes: A real-world study. Am. J. Infect. Control 2017, vol. 45(no. 8), 888–895. [Google Scholar] [CrossRef]
- Collins, G. S.; et al. TRIPOD+AI statement: updated guidance for reporting clinical prediction models that use regression or machine learning methods. BMJ 2024, vol. 385, Art.(no. e078378). [Google Scholar] [CrossRef]
- Moons, G. M.; et al. PROBAST+AI: an updated quality, risk of bias, and applicability assessment tool for prediction models using regression or artificial intelligence methods. BMJ 2025, vol. 388, Art.(no. e082505). [Google Scholar] [CrossRef]
- Van Calster, B.; McLernon, D. J.; van Smeden, M.; Wynants, L.; Steyerberg, E. W. Calibration: the Achilles heel of predictive analytics. BMC Med. 2019, vol. 17, Art.(no. 230). [Google Scholar] [CrossRef]
- Vasey, B.; et al. Reporting guideline for the early-stage clinical evaluation of decision support systems driven by artificial intelligence: DECIDE-AI. Nat. Med. 2022, vol. 28(no. 5), 924–933. [Google Scholar] [CrossRef]
- Cruz Rivera, S.; Liu, X.; Chan, A.-W.; Denniston, A. K.; Calvert, M. J. Guidelines for clinical trial protocols for interventions involving artificial intelligence: the SPIRIT-AI extension. Nat. Med. 2020, vol. 26(no. 9), 1351–1363. [Google Scholar] [CrossRef]
- Liu, X.; Cruz Rivera, S.; Moher, D.; Calvert, M. J.; Denniston, A. K. Reporting guidelines for clinical trial reports for interventions involving artificial intelligence: the CONSORT-AI extension. Lancet Digit. Health 2020, vol. 2(no. 10), e537–e548. [Google Scholar] [CrossRef]
- Vickers, J.; Elkin, E. B. Decision curve analysis: a novel method for evaluating prediction models. Med. Decis. Mak. 2006, vol. 26(no. 6), 565–574. [Google Scholar] [CrossRef]
- Husereau, D.; et al. Consolidated Health Economic Evaluation Reporting Standards 2022 (CHEERS 2022) statement: updated reporting guidance for health economic evaluations. BMJ 2022, vol. 376, Art. no. e067975. [Google Scholar] [CrossRef]
- Eddy, D. M.; Hollingworth, W.; Caro, J. J.; Tsevat, J.; McDonald, K. M.; Wong, J. B. Model transparency and validation: a report of the ISPOR-SMDM Modeling Good Research Practices Task Force–7. Value Health 2012, vol. 15(no. 6), 843–850. [Google Scholar] [CrossRef]
- Morris, T. P.; White, I. R.; Crowther, M. J. Using simulation studies to evaluate statistical methods. Stat. Med. 2019, vol. 38(no. 11), 2074–2102. [Google Scholar] [CrossRef]
- Briggs, H.; Weinstein, M. C.; Fenwick, E. A. L.; Karnon, J.; Sculpher, M. J.; Paltiel, A. D. Model parameter estimation and uncertainty: a report of the ISPOR-SMDM Modeling Good Research Practices Task Force–6. Value Health 2012, vol. 15(no. 6), 835–842. [Google Scholar] [CrossRef]
- Riley, R. D.; et al. Minimum sample size for external validation of a clinical prediction model with a binary outcome. Stat. Med. 2021, vol. 40(no. 19), 4230–4251. [Google Scholar] [CrossRef]
- U.S. Food and Drug Administration. “UPDATE Change in Reprocessing Methods with Certain Karl Storz Urological Endoscopes—Letter to Health Care Providers,” 2022. Available online: https://content.govdelivery.com/accounts/USFDA/bulletins/311a59b (accessed on Nov. 3 2026).
- Hemming; Haines, T. P.; Chilton, P. J.; Girling, A. J.; Lilford, R. J. The stepped wedge cluster randomised trial: rationale, design, analysis, and reporting. BMJ 2015, vol. 350, Art.(no. h391). [Google Scholar] [CrossRef]
Figure 1.
Expected device-related expenditure, restricted carbon burden, and interruptions under six policies across the 27 weighted archetypes. Dots are deterministic conditional expectations; no sampling uncertainty is implied. Universal and unconstrained comparators are not all feasible. Exact values and ceiling exposure appear in Table 2.
Figure 1.
Expected device-related expenditure, restricted carbon burden, and interruptions under six policies across the 27 weighted archetypes. Dots are deterministic conditional expectations; no sampling uncertainty is implied. Universal and unconstrained comparators are not all feasible. Exact values and ceiling exposure appear in Table 2.
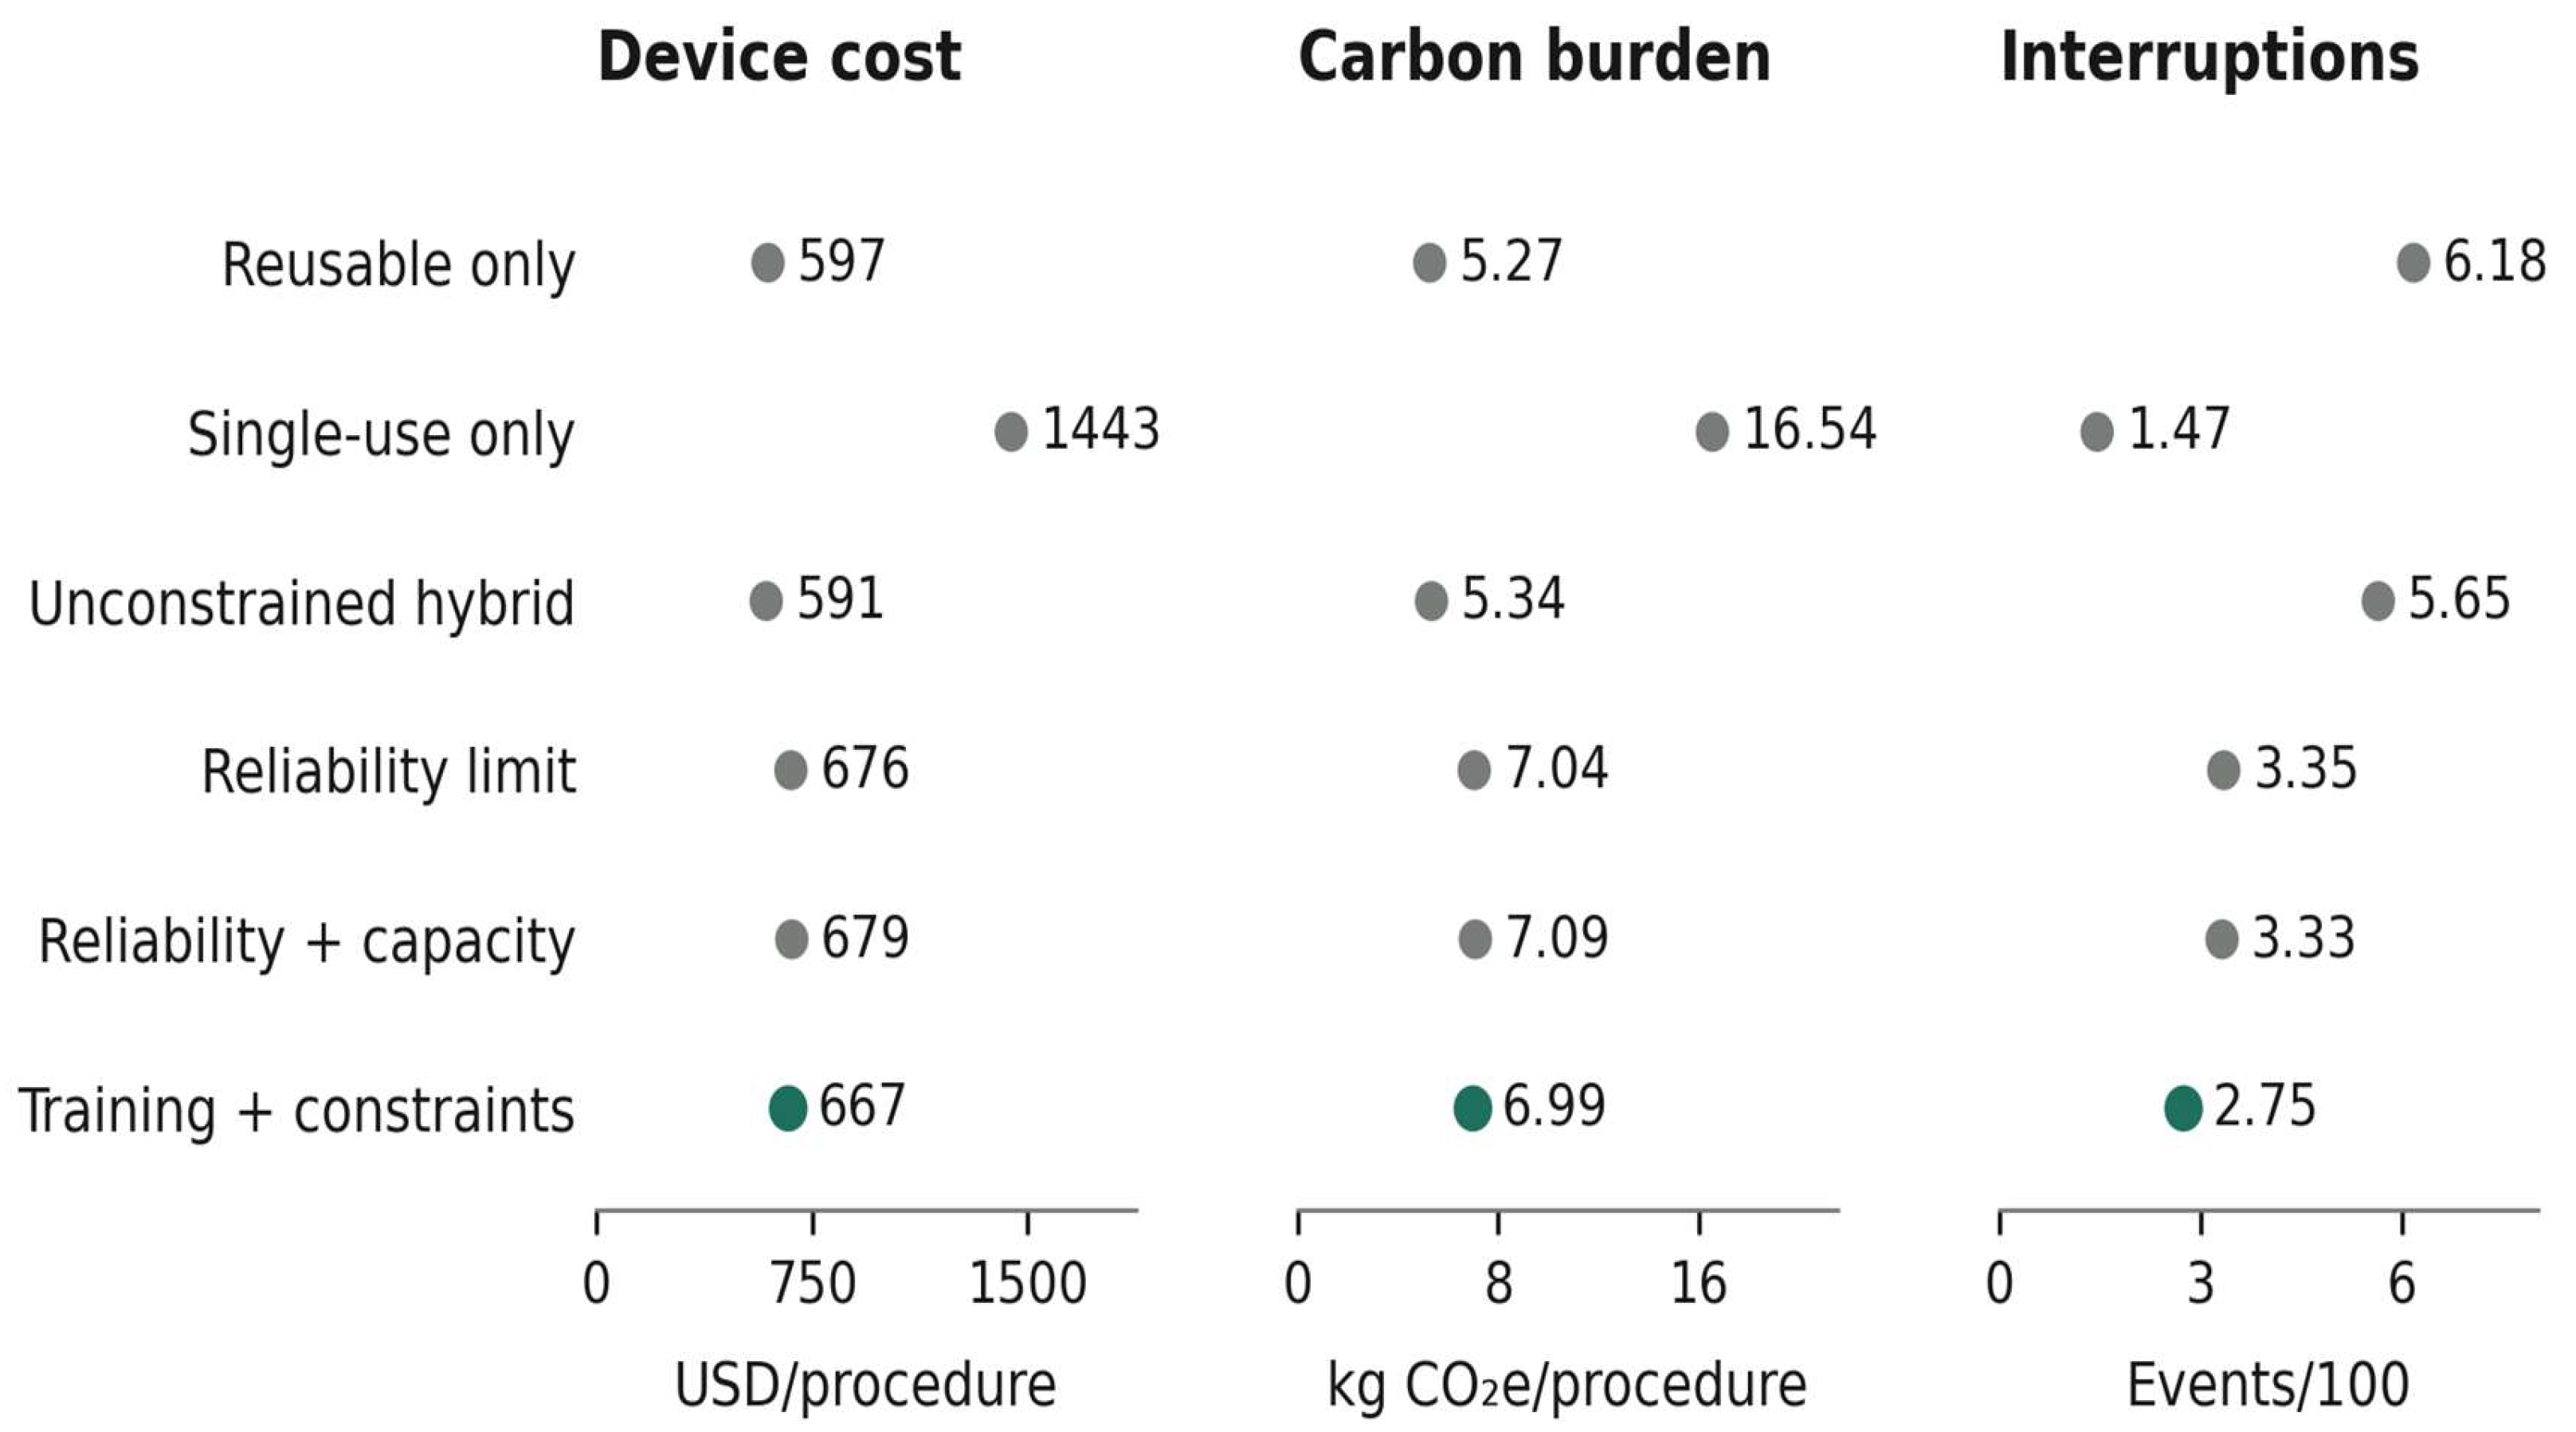
Figure 2.
One-way sensitivity of training minus untrained constrained expenditure. Panel a varies the assumed handling mitigation intensity with a USD 20 programme charge. Panel b varies programme charge at intensity 0.60. Other base inputs are fixed. The horizontal line denotes expenditure neutrality; lines connect evaluated settings and do not indicate empirical treatment effects.
Figure 2.
One-way sensitivity of training minus untrained constrained expenditure. Panel a varies the assumed handling mitigation intensity with a USD 20 programme charge. Panel b varies programme charge at intensity 0.60. Other base inputs are fixed. The horizontal line denotes expenditure neutrality; lines connect evaluated settings and do not indicate empirical treatment effects.
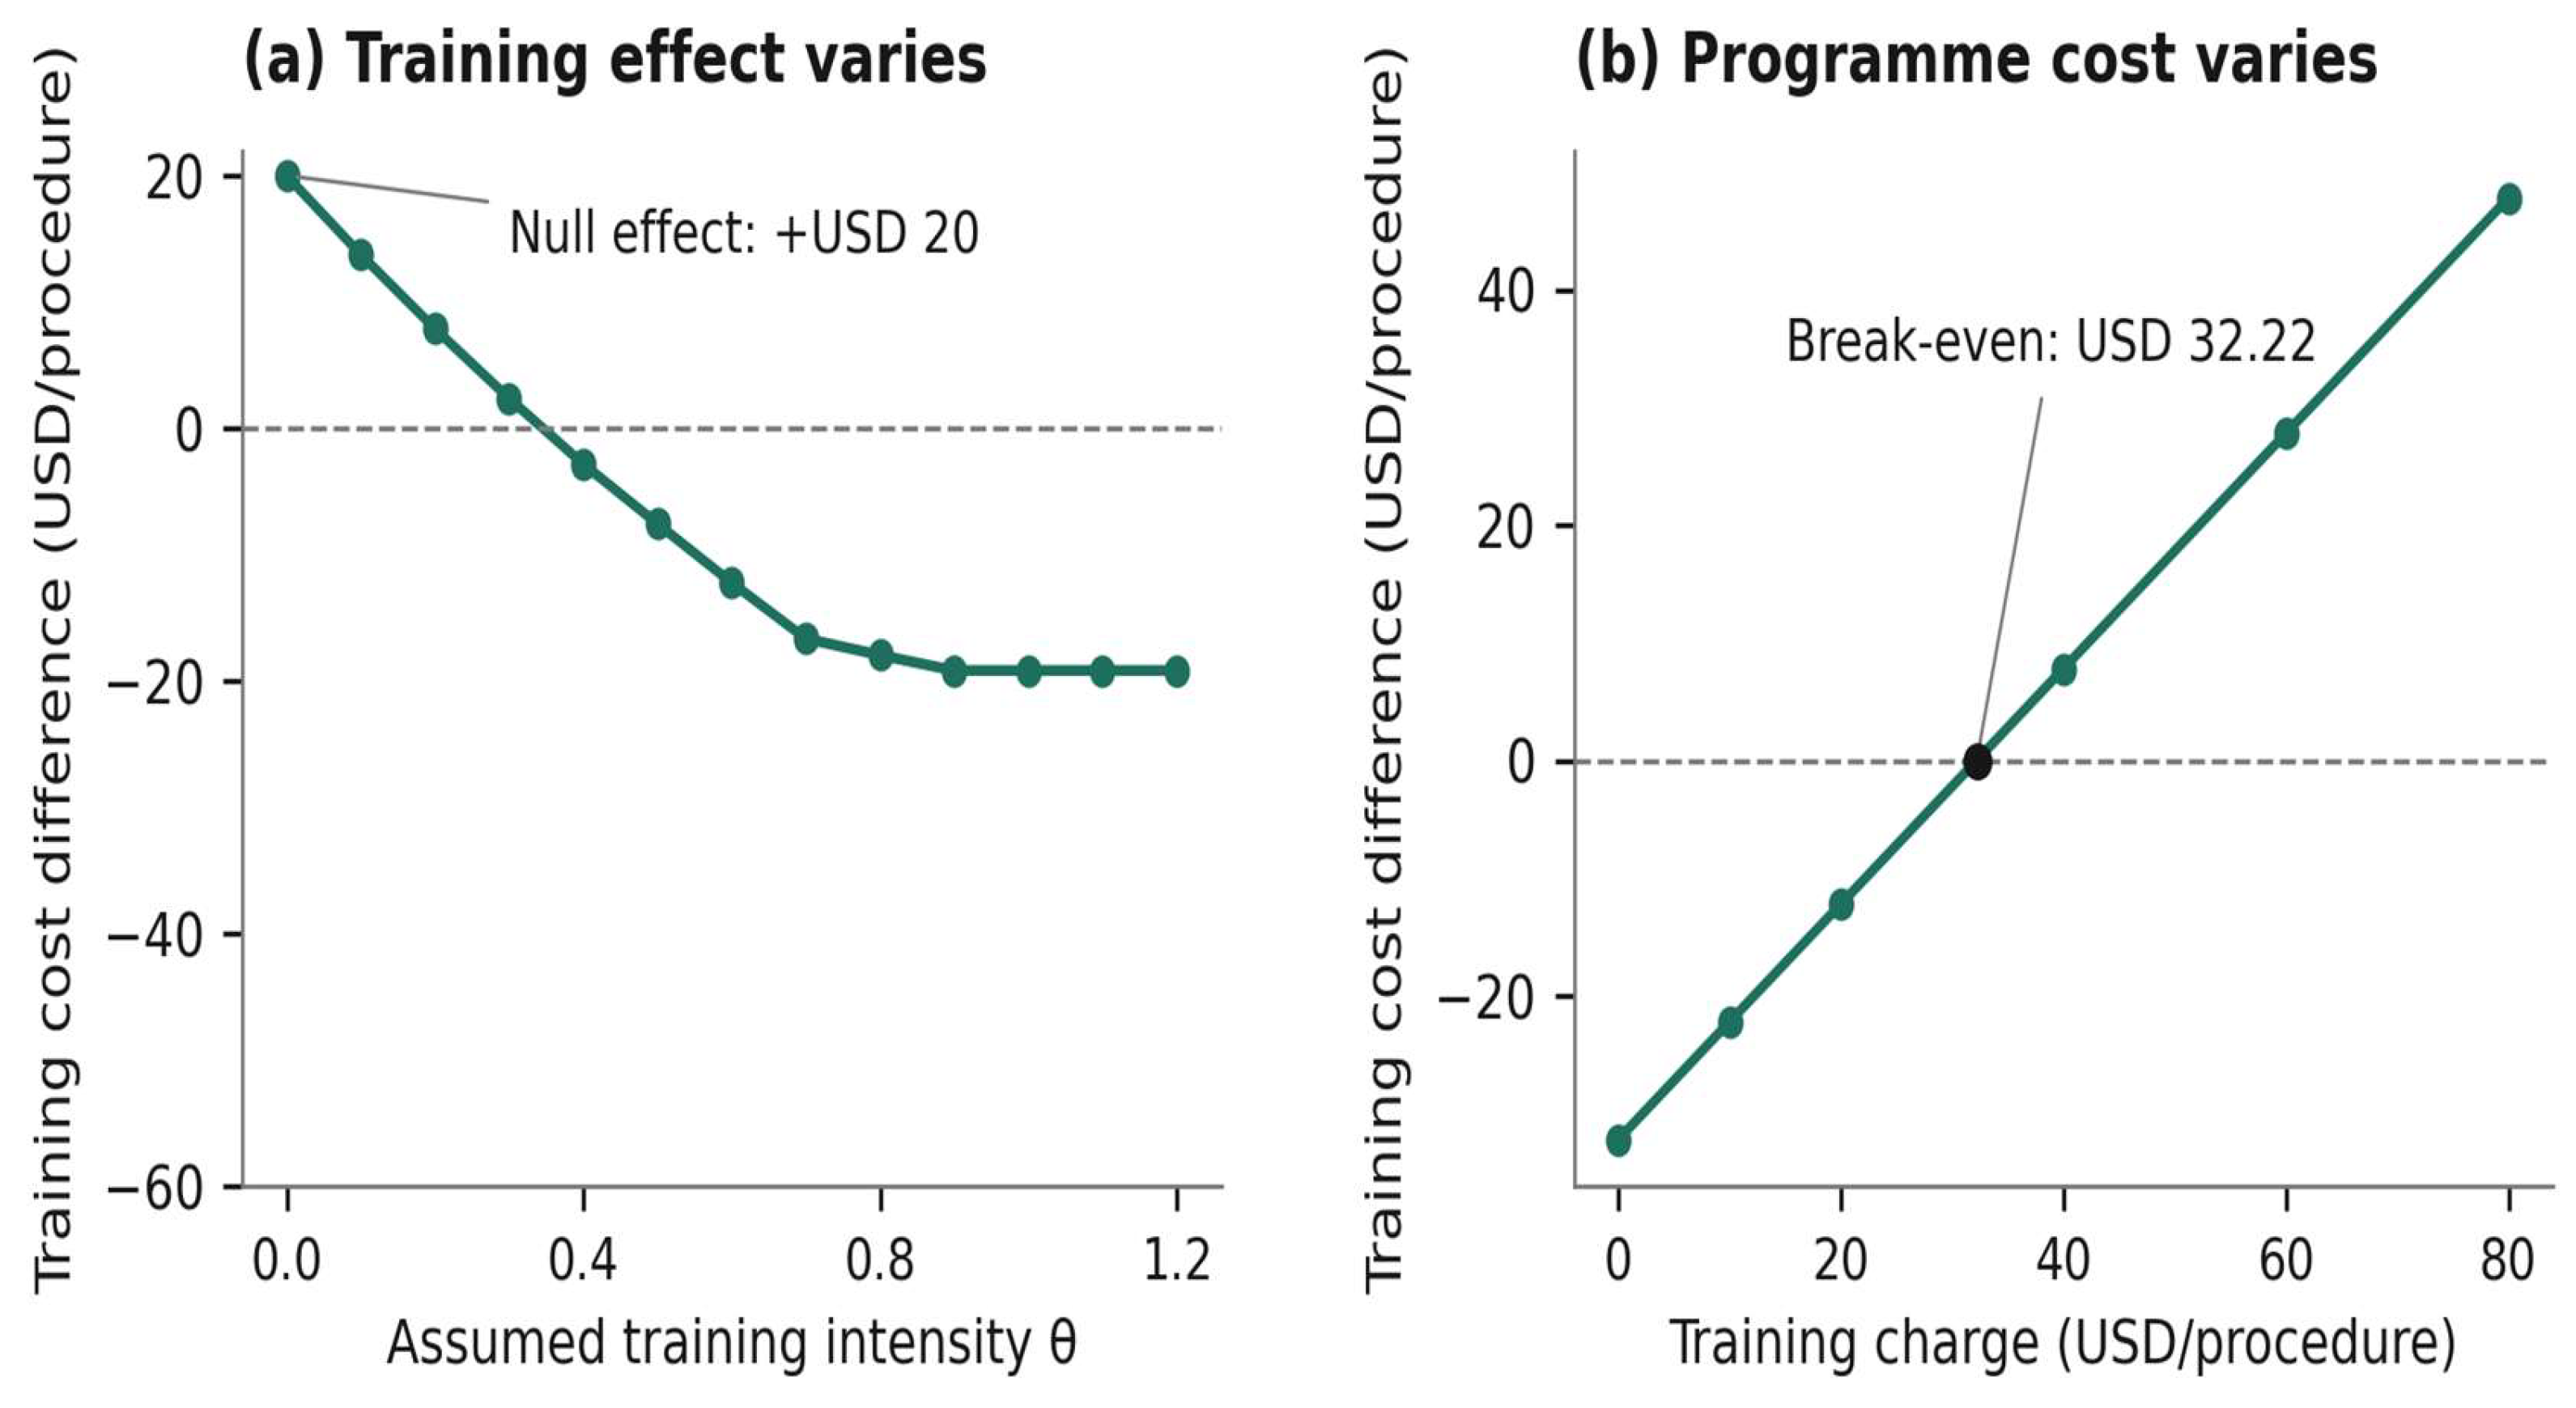
Table 1.
Explicit base assumptions for the decision analysis.
| Input | Base value | Provenance |
|---|---|---|
| Reusable acquisition A | 25,000 USD | Concept scenario |
| Reusable lifetime L | 120 uses | Concept scenario |
| Reprocessing R | 45 USD/use | Concept scenario |
| Repair K | 3,200 USD/event | Concept scenario |
| Single-use purchase and disposal S | 1,415 USD/use | Concept scenario |
| Rescue delay D | 500 USD/event | Concept scenario |
| Base carbon Bᵣ and Bₛ | 3.70 and 16.30 kg/use | Concept scenario |
| Repair carbon Bₖ | 8.00 kg/event | Assumed |
| Training cost k | 20 USD/use | Assumed |
| Training carbon Bₜ | 0.05 kg/use | Assumed |
| Training intensity θ | 0.60 | Assumed |
| Reusable interruption ceiling τ | 8% per archetype | Illustrative restriction |
| Reusable capacity b | 80% of procedures | Assumed |
| Carbon shadow price λ | 0.10 USD/kg | Assumed |
Table 2.
Deterministic expected outcomes in the base scenario.
| Policy | Reuse % | USD/use | kg/use | Interruptions /100 | RU repairs /100 | Above ceiling % |
|---|---|---|---|---|---|---|
| Reusable only | 100.0 | 596.70 | 5.27 | 6.18 | 7.03 | 19.60 |
| Single-use only | 0.0 | 1,443.07 | 16.54 | 1.47 | 0.00 | 0.00 |
| Unconstrained hybrid | 98.5 | 590.53 | 5.34 | 5.65 | 6.61 | 18.10 |
| Reliability limit | 80.4 | 676.46 | 7.04 | 3.35 | 4.10 | 0.00 |
| Reliability + capacity | 80.0 | 679.46 | 7.09 | 3.33 | 4.06 | 0.00 |
| Training + constraints | 80.0 | 667.25 | 6.99 | 2.75 | 3.40 | 0.00 |
Table 3.
Alternative carbon scenarios reverse the universal-policy ranking.
| Scenario | Bᵣ / Bₛ kg | Reusable kg/use | Single-use kg/use | Constrained kg/use |
|---|---|---|---|---|
| Base contrast | 3.70 / 16.30 | 5.27 | 16.54 | 7.09 |
| Equal burdens | 4.43 / 4.43 | 5.27 | 4.49 | 4.90 |
| Reversed burdens | 8.00 / 4.43 | 8.84 | 4.49 | 7.76 |
Disclaimer/Publisher’s Note: The statements, opinions and data contained in all publications are solely those of the individual author(s) and contributor(s) and not of MDPI and/or the editor(s). MDPI and/or the editor(s) disclaim responsibility for any injury to people or property resulting from any ideas, methods, instructions or products referred to in the content. |
© 2026 by the authors. Licensee MDPI, Basel, Switzerland. This article is an open access article distributed under the terms and conditions of the Creative Commons Attribution (CC BY) license (http://creativecommons.org/licenses/by/4.0/).
Copyright: This open access article is published under a Creative Commons CC BY 4.0 license, which permit the free download, distribution, and reuse, provided that the author and preprint are cited in any reuse.