

Submitted:
03 November 2026
Posted:
05 November 2026
You are already at the latest version
Abstract
Background: Metabolic reprogramming of tumor-associated macrophages (TAMs) drives tumor immune evasion, yet the spatial and subtype-level organization of TAM metabolism remains under-characterized. Methods: We re-analyzed public spatial metabolomics, spatial transcriptomics, and single-cell datasets using autocorrelation-corrected spatial statistics, patient-level testing, and replication across breast, lung, colorectal, liver, and brain tumor data. Results: TAMs formed the most spatially clustered transcriptional module in breast tumor sections. TAM-dense regions were robustly coupled to iron handling (ρ = 0.568), surviving gene-overlap, cell-abundance, and erythrocyte/vascular-exposure controls, whereas apparent glycolysis and lipid-uptake links did not survive spatial or abundance correction. In lung adenocarcinoma, subtype comparisons were confounded by tissue origin; within tumor tissue, two differences persisted across patients (higher lipid uptake in C1QC⁺ and higher iron handling in FOLR2⁺ TAMs). A reported SPP1⁺-versus-C1QC⁺ polarity recurred at cell level across cancer types but not at patient level. Mitochondrial DNA tracing detected clonally expanded, metabolically hyperactive TAMs in two of four evaluable samples. Conclusions: TAM metabolism is spatially organized and subtype-specific, with iron handling as the most robust territorial coupling, supporting spatially stratified, subtype-aware design of metabolism-targeting trials.
Keywords:
tumor-associated macrophages
; spatial metabolomics
; mass spectrometry imaging
; spatial transcriptomics
; single-cell RNA sequencing
; immunometabolism
; tumor microenvironment
; public data reanalysis
1. Background
1.1. TAMs and the Immunometabolic Basis of Tumor Immune Evasion
Tumor-associated macrophages (TAMs) are among the most abundant immune populations in solid tumors, and high TAM infiltration is associated with poor prognosis and impaired immunotherapy responses [1]. Their behavior is inseparable from their metabolic wiring [2,8]: M1-like macrophages undergo a Warburg-like glycolytic shift in which succinate stabilizes HIF-1α and induces IL-1β [3,4], whereas M2-like macrophages rely on oxidative phosphorylation (OXPHOS) and fatty-acid oxidation (FAO) under STAT6–PGC-1β control [5,6] (a dichotomy whose foundations are contested; [7]). In the tumor microenvironment (TME), nutrient use is cell-programmed—tumor-associated myeloid cells show the highest per-cell glucose uptake while tumor cells preferentially consume glutamine [8]—and tumor-derived lactic acid polarizes macrophages toward ARG1⁺/VEGF⁺ states ([9]; Supplementary Note 1).
1.2. From the M1/M2 Dichotomy to Spatially Resolved Metabolic States
The M1/M2 framework has been formally criticized as inadequate [10]: myeloid phenotypes form a continuum [11], and pan-cancer atlases have replaced the binary with functionally anchored TAM subsets—lipid-associated SPP1⁺ and complement-associated C1QC⁺ [12]—and a prognostic CXCL9:SPP1 polarity axis [13]. TAM states are also organized by geography: hypoxia and lactate gradients arrange macrophages into predictable spatial stripes [14,15,125], and spatial multi-omics has revealed regional segregation of tumor and host metabolic programs [16,17,124]. Integrated spatial-omics designs exist (e.g., tri-modal spatial metabolomic/transcriptomic profiling of pancreatic cancer; [18]), but no study has centered such coupling on TAM immunometabolism across independent public resources.
1.3. The Public Spatial Multi-Omics Opportunity and the Translational Gap
The prerequisites are now public: open mass spectrometry imaging (MSI) platforms (METASPACE, MetaboLights; [19]), 10x Visium sections, and TAM-resolved scRNA-seq atlases. Published spatial multi-omics studies [16,20,21] combine these layers but have centered on malignant-cell states rather than macrophage immunometabolism. The clinical need is pressing: macrophage-directed therapies—magrolimab (failed phase 3 ENHANCE), CB-1158 (target engagement but limited activity), and pexidartinib (modest monotherapy activity)—confirm TAMs as tractable yet have struggled to deliver efficacy, plausibly because bulk-level targeting ignores spatially heterogeneous TAM metabolic states.
1.4. Contributions
We present an integrative, fully scripted re-analysis of public spatial metabolomics, spatial transcriptomics, and single-cell resources organized around macrophage metabolic reprogramming. Because the layers derive from different cohorts and platforms, integration is conceptual convergence, not same-sample co-registration. Four contributions concern the framework and primary layers (full statement in Supplementary Note 2): (1) a multi-layer public-data re-analysis framework whose rigor apparatus—spin-permutation and effective-sample-size (ESS)-corrected spatial statistics, patient-level pseudobulk re-testing, and leave-one-gene-out (LOO) robustness—enabled the confound dissections reported here; (2) spatial imaging of lipid-mediator metabolism in breast tumor desorption electrospray ionization MSI (DESI-MSI; arachidonate × PI 38:4, ρ = 0.90); (3) the TAM signature as the most spatially aggregated of 13 Visium modules (Moran’s I autocorrelation statistic, 0–1 scale, = 0.638), with robust iron-handling coupling (ρ = 0.568) and a lipid-uptake coupling shown to be largely compositional; and (4) subset-resolved single-cell metabolic differentiation—re-testing the previously reported SPP1⁺-glycolytic versus C1QC⁺-lipid polarity [22]—with the tissue-origin confound measured and removed (80.2% of C1QC⁺ cells are normal-lung alveolar macrophages), reporting patient-level survivors and non-survivors explicitly. Three further contributions extend the framework outward: (5) three-patient Visium HD niche validation and structured cross-tumor replication in hepatocellular carcinoma (HCC) and glioblastoma (GBM), delimiting a conserved core from a context-dependent periphery; (6) perturbation models nominating CPT1A (−89.6%) and G6PD (−12.0%), with LDHA blockade predicted futile through LDHB compensation; and (7) mtDNA lineage tracing detecting clonal expansions of hypermetabolic TAMs in 2 of 4 samples (detection being chemistry-dependent—5′ ≫ 3′ coverage—so 2/4 is a detection-weighted rate, not a prevalence), extending macrophage-biased tumor clones [23] with metabolic phenotypes from public alignment files.
2. Methods
This study is an integrative re-analysis framework built exclusively on publicly downloadable data and free or open-source software. It comprises three core layers: Layer 1 re-analyzes tumor DESI-MSI data to obtain directly measured spatial lipid distributions; Layer 2 maps TAM signatures and metabolic-enzyme gene modules onto a 10x Visium spatial transcriptomics section; and Layer 3 infers metabolic pathway activity in TAM subsets from scRNA-seq. Four further layers complete the framework: a high-resolution validation layer re-analyzing three colorectal cancer 10x Visium HD sections (8-µm bins; GSE280318) to test TAM niche complementarity at near-single-cell scale, a cross-tumor replication layer re-analyzing hepatocellular carcinoma scRNA-seq (GSE140228) and a glioblastoma 10x Visium section, an in silico perturbation layer, and a mitochondrial clonality layer. Because these layers rest on independent measurement principles, convergence on the same TAM metabolic programs constitutes internal cross-validation. All layers were executed in full during this study, and all parameters below are reported exactly as run. All steps are specified so that the workflow can be re-executed from this section alone.
Figure 1 provides a schematic overview of the framework. Layer 1 treats the tumor as a measurable metabolic landscape: raw MSI pixel spectra are normalized, target lipid ions are extracted, and spatial statistics (Moran’s I autocorrelation, regional contrasts, and pixel-wise co-variation) localize the substrate environment in which macrophages operate. Layer 2 asks where TAMs sit within that landscape by scoring cell-type and metabolic gene modules on a Visium section and testing their spatial aggregation and co-localization. Layer 3 then resolves compartment-level signals into cell-intrinsic programs by re-clustering annotated myeloid cells from a TAM-resolved scRNA-seq atlas and scoring pathway activity per cell. The design is deliberately asymmetric in resolution—tissue-level metabolites, spot-level transcripts, single-cell pathway scores—so that each layer compensates for the inference limits of the others, and agreement across layers is interpreted as cross-validated signal rather than assumed. This figure is a workflow schematic and contains no measured data.
2.1. Data Resources and Eligibility Criteria
Public repositories were searched through 16 August 2026: MetaboLights (web-services API), METASPACE (GraphQL API), the Metabolomics Workbench, the Gene Expression Omnibus (GEO), the 10x Genomics dataset portal, Zenodo, and Dryad. Search terms combined modality keywords (“mass spectrometry imaging”, “DESI”, “MALDI”, “spatial transcriptomics”, “Visium”, “single-cell”) with biology keywords (“tumor”, “macrophage”, “myeloid”). Datasets were eligible if they (i) are publicly downloadable without controlled-access negotiation, (ii) contain spatial coordinates (imaging pixels or barcoded spots) for Layers 1–2 or a per-cell count matrix for Layer 3, and (iii) profile tumor tissue or tumor-relevant macrophage biology. Every accession was re-queried at its repository at the time of analysis and assigned a tier: HIGH (record inspected directly), MED (verified via the linked publication plus repository listing), or unverified (excluded). GNPS/MassIVE yielded no verifiable dedicated tumor MSI collection and was not used as a primary source; the BioImage Archive accession S-BIAD14260 did not resolve and was excluded. No public dataset is explicitly annotated for TAM metabolism, so TAM immunometabolic signals are extracted by re-analysis of tumor-centric resources—this gap motivates the present framework. Supplementary Table S14 (Supplementary Note 3) lists the core datasets underlying each layer.
Supplementary Table S14 was assembled to balance depth and breadth. Each layer is anchored by one primary dataset that was re-analyzed end-to-end—MTBLS273 for spatial metabolomics, the adjacent-section pair of the 10x breast-cancer Visium tumor block (processed identically) for spatial transcriptomics, and GSE131907 for single-cell inference—while the remaining entries serve as independent comparators or references. Notably, the anchor datasets span three cancer types (breast, colorectal/gastric/bladder, lung), so any TAM metabolic program recovered across layers is unlikely to be an artifact of one tumor type, acquisition platform, or laboratory. All accessions and dataset contents in Supplementary Table S14 were verified directly at the host repositories during the search window.
2.2. Layer 1: Spatial Metabolomics Re-Analysis
Data acquisition and integrity. Centroid imzML/ibd files for MTBLS273 [24] were downloaded from the EBI MetaboLights FTP server via parallel HTTP range requests; file integrity was verified by matching ibd SHA-1 checksums against the imzML metadata. Two sections of the same tumor block were analyzed: BRB01C (tumor-center; 2,856 pixels; 51 × 56 grid) and BRB01S (tumor-south; 3,721 pixels; 61 × 61 grid). The acquisition was negative-ion mode over m/z 204.59–975.29 and is therefore lipid-focused. Parsing used pyimzML 1.5.x [25] in Python 3.12 with numpy 2.2.5 and scipy 1.16.2; pyimzML was chosen over GUI platforms because it exposes raw per-pixel spectra for exact, scripted, reproducible extraction.
Normalization and ion extraction. Each pixel spectrum was total-ion-current (TIC) normalized (ion intensity / TIC × 10⁴), the standard correction for pixel-wise ion-yield variation in MSI. Target ions were extracted within ±0.01 Da of the theoretical [M−H]− m/z of a literature-curated lipid panel (Section 2.8); this window corresponds to roughly ±40 ppm at m/z 255 and was chosen to match the unit-mass-to-modest-resolution acquisition of the source instrument while isolating the target isotopologue. Consistent with metabolomics reporting standards, all annotations are treated as putative (level 3) accurate-mass assignments unless corroborated by the source publication or FDR-controlled database annotation [19].
Spatial statistics. Spatial autocorrelation of each ion image was quantified by Moran’s I using 4-neighbor (rook) grid adjacency, appropriate for the regular MSI pixel lattice. Regional contrast between the two sections was tested per ion with the two-sided Mann–Whitney U (MWU) test on TIC-normalized intensities, chosen because MSI pixel intensities are non-normal and zero-inflated. Pairwise ion co-variation was quantified by Spearman’s ρ on log1p-transformed intensities with all pixels pooled (n = 6,577). The acquisition m/z floor (≈204.6) renders small polar metabolites (e.g., lactate, succinate, glutamate) unmeasurable in this dataset, and the BRB01C-versus-BRB01S contrast is an intra-tumoral regional comparison, not tumor-versus-normal.
2.3. Layer 2: Spatial Transcriptomics
Data and quality control. The 10x Genomics Visium v1 fresh-frozen human breast cancer section (invasive ductal carcinoma; V1_Breast_Cancer_Block_A_Section_1) was downloaded from the 10x portal (filtered feature–barcode matrix plus spatial images) and read with scanpy.read_visium [26]. The raw object contained 3,798 spots (all under tissue) × 36,601 genes (pre-filtering medians: 20,761.5 counts and 6,026.5 genes per spot). Spots were retained when n_genes_by_counts ≥ 500 and total_counts ≥ 1,000; genes were retained when detected in ≥ 10 spots, yielding 3,795 spots × 19,690 genes. Counts were normalized with sc.pp.normalize_total(target_sum = 1e4) followed by sc.pp.log1p.
Module scoring. Thirteen predefined gene modules (four cell-type modules—TAM signature, SPP1+ TAM, cytotoxic T, tumor epithelial—and nine metabolic/hypoxia modules, Section 2.8) were scored per spot with scanpy.tl.score_genes (ctrl_size = 50, random_state = 42). We chose expression-based module scoring over flux-balance or graph-neural-network flux inference because Compass [27] and scFEA [28] are designed for single-cell rather than spot-level mixtures and, in the case of Compass, have not been validated in TAMs; gene-set scoring with matched control genes is the calibrated approach for shallow-capture spatial data [26,29].
Spatial statistics. Spatial autocorrelation of module scores was computed with a numpy implementation of Moran’s I. The adjacency graph was built from spot pixel coordinates with a cKDTree 6-nearest-neighbor query, a distance threshold of 1.3 × the nominal grid spacing (273 px), and symmetrized binary weights (22,032 edges; mean degree 5.81, range 2–6); significance was assessed by 199 permutations (seed 42), giving a p-value resolution floor of 0.005. Module–module associations across all 3,795 spots used Spearman’s ρ. For regional analysis, spots were split into TAM-score top 20% (n = 759) versus bottom 20% (n = 759) and compared per metabolic module by two-sided MWU with Benjamini–Hochberg (BH) correction. Software: Python 3.12.12, scanpy 1.12.3, anndata 0.13.2, numpy 2.2.5, pandas 2.3.2, scipy 1.16.2, matplotlib 3.10.3, seaborn 0.13.2, leidenalg 0.12.0.
2.4. Layer 3: Single-Cell Metabolic Inference
Layer 3 was executed on GSE131907 (lung adenocarcinoma (LUAD); 208,506 cells from 58 samples of 44 patients; [30]), whose raw UMI matrix (29,634 gene rows) and author cell annotations were downloaded from GEO.
Data-integrity check. Stream-level validation of the decompressed UMI matrix (zlib integrity check, per-row field-count validation, and numeric plausibility screening) flagged 326 gene rows with aberrant field counts and 202 rows with non-finite or physically impossible values (single-cell single-gene counts > 20,000 UMI from digit-concatenation artifacts); the two lists overlap by 199 rows, giving 329 unique excluded genes (1.1% of 29,634). The pattern is consistent with truncation/corruption in the source deposit—ranged byte comparisons against the live GEO file returned byte-identical content, so the anomaly is intrinsic to the deposit rather than to our download—but the cause could not be determined, and all 329 rows were excluded row-wise before any analysis. Every lineage marker and every gene in the Layer 3 pathway sets (Supplementary Table S17) was individually verified to lie outside the exclusion list and to carry plausible expression values (e.g., SPP1 maximum 2,966 UMI; FTH1 maximum 10,206 UMI). First, the archived Layer 2 lipid-uptake spot score did not correspond to its stated five-gene set (CD36, LPL, FABP4, FABP5, MSR1) but was dominated by APOE/APOC1/FTL/CD74/CTSD, so the entire Layer 2 result set was recomputed from the raw matrix (the corrected values are reported in Section 3.3 and Supplementary Table S8). Second, the archived Layer 3 scores for lipid uptake (Supplementary Table S17 set plus APOE/APOC1), iron handling (LCN2 in, HMOX1 out), OXPHOS, and FAO used gene lists diverging from Supplementary Table S17, so all Layer 3 module values were scored with the exact Supplementary Table S17 sets (Supplementary Table S2 and Table S5). The HCC layer was verified at gene-set level.
Myeloid extraction and quality control. Myeloid cells were extracted by the authors’ refined cell-type annotation (Cell_type.refined == “Myeloid cells”), yielding 42,245 cells (mast cells are a separate top-level category in this annotation, n = 3,396, and are therefore excluded); canonical markers were used only for post hoc validation of this compartment (fraction of cells expressing LYZ 91.3%, CD68 87.5%, FCGR3A 71.1%, PTPRC 65.3%, CD14 64.2%, MRC1 55.5%, CD163 51.6%, versus epithelial EPCAM 5.0%/KRT19 8.9% and T-cell CD3D 10.1%/CD8A 2.0%). Quality control (minimum 200 detected genes per cell; mitochondrial fraction < 20%) retained 42,237 cells (zero cells failed the gene-count threshold; eight failed the mitochondrial threshold; median 7,840 UMIs and 4.43% mitochondrial fraction per cell). A further 462 residual epithelial/T-cell contaminants (EPCAM, KRT19, CD3D, or CD8A log-normalized expression > 2) were removed, yielding 41,775 cells. To permit analysis within a 4-GB memory envelope while preserving subtype proportions, 20,000 cells were then stratified-randomly sampled by author cell subtype (seed = 42; sampling fraction ≈ 0.479; floor of 50 cells for small subtypes).
Clustering and subset annotation. The downsampled matrix was processed with scanpy: normalize_total(target_sum = 1e4), log1p, 2,000 highly variable genes (seurat flavor), scale(max_value = 10), PCA (50 components), nearest-neighbor graph (k = 15, 50 PCs), Leiden clustering (resolution 0.6; leidenalg), and UMAP (umap-learn), yielding 22 clusters. Clusters were annotated into seven subsets by mean marker-signature z-scores—SPP1+ TAM, C1QC+ TAM, FOLR2+ TRM-like (tissue-resident-macrophage-like) cells, inflammatory monocytes, conventional and plasmacytoid dendritic cells, and a mixed-signal remainder—following the pan-cancer myeloid framework of Cheng et al. [12] rather than the M1/M2 dichotomy, in line with the nomenclature guidelines of Murray et al. [10] and the spectrum model of human macrophage activation [31]. Annotations were validated by cross-tabulation against the authors’ subtype labels.
Pathway scoring and statistics. The nine Layer 3 metabolic gene sets defined in Section 2.8 (Supplementary Table S17) were scored per cell with score_genes (ctrl_size = 50); between-subset differences were tested with the two-sided Wilcoxon rank-sum test at BH FDR < 0.05 (27 tests among the three TAM subsets), and pathway–marker co-variation was quantified by Spearman’s ρ across all 20,000 myeloid cells and within the three TAM subsets. Because the TAM subsets differ sharply in tissue-origin composition (80.2% of C1QC+ cells derive from normal lung; 96.8% of SPP1+ cells from tumor or metastatic sites; Supplementary Table S3), all subset contrasts are reported both all-origin and restricted to tumor-lung (tLung) cells, with the tLung patient-level pseudobulk analysis (11 fully paired patients) taken as the inference standard (Supplementary Table S4 and Table S5). Dedicated single-cell flux tools (Compass; scFEA) and metabolite-mediated communication inference (MEBOCOST; [32]) were not run, because their TAM-specific validation is limited; they remain corroborative extensions from which concordant, not novel, conclusions would be drawn.
2.5. High-Resolution Validation Layer: Colorectal Cancer (CRC) Visium HD (GSE280318)
Data and memory-optimized reading. Three CRC tumor sections profiled with 10x Visium HD (8-µm bins)—P1CRC, P2CRC, and P5CRC (GSM8594567–GSM8594569; [21])—were downloaded from the GEO supplementary files of GSE280318 (per-section filtered feature–barcode matrix h5, tissue-positions parquet, and scale-factors JSON; bin size verified as 8.0 µm from the scale factors). Because the HD matrices (122–297 MB compressed) exceed the 4-GB memory envelope when loaded whole, the h5 files were read in chunks with h5py, extracting only module genes plus expression-matched control genes to build a sparse matrix. Quality control retained bins with total_counts ≥ max(20, 0.1 × the section median), yielding 430,168 (P1CRC), 486,821 (P2CRC), and 502,282 (P5CRC) bins (median UMIs per bin 147, 380, 232). Counts were processed with normalize_total (target_sum = 1e4) followed by log1p, and module scores were computed with a score_genes-equivalent implementation (ctrl_size = 50, control genes sampled from 25 average-expression bins). The metabolic and epithelial modules were those defined in Section 2.8 (Supplementary Table S17); in addition, TAM subset modules were scored as SPP1+ TAM (SPP1, APOE, TREM2, CTSD, LGALS3), SELENOP+ TAM (SELENOP, C1QA, C1QB, C1QC, APOE, FOLR2, MRC1, LYVE1), and pan-myeloid (LYZ, CD68, CD14, FCGR3A), following the subset definitions of Oliveira et al. [21].
Probe-panel coverage. Visium HD is probe-based, and ALDOA, GAPDH, KRT18, LDHA, MT-CO1, and PFKL are absent from the panel; affected modules were automatically reduced—glycolysis to 7 of 10 genes, the lactate shuttle to LDHB/SLC16A1/SLC16A3 only, and OXPHOS to 7 of 8 genes—and are interpreted accordingly (Supplementary Note 8).
Spatial statistics. Spatial autocorrelation was quantified by Moran’s I with 8-neighbor grid adjacency (numpy/scipy implementation, 99 permutations). The tumor domain was defined as bins whose epithelial-module score (EPCAM/KRT19/KRT8), after 15-bin mean smoothing, reached the 60th percentile; a signed Euclidean distance transform (EDT) assigned each bin its distance (µm) to the tumor boundary (negative = stromal/outside, positive = tumor/inside). Boundary differentiation was quantified as mean(inside)—mean(outside) within a ±200-µm band (two-sided Wilcoxon with BH correction), and distance-resolved profiles were computed in 50-µm bins. TAM × metabolism co-localization used Spearman’s ρ on raw scores and on 5-bin neighborhood-smoothed scores (local correlations).
2.6. Cross-Tumor Replication Analyses
Generalizability was tested with two replication layers in cancer types disjoint from the primary layers, using structured direction-of-effect hypotheses for each primary finding, recorded by the authors before the replication analyses and evaluated post hoc against the replication outcomes; no formal pre-registration was filed.
HCC scRNA-seq replication (GSE140228). The droplet-based (10x) UMI count matrix of the HCC immune-cell atlas of Zhang et al. [33]—262,151,136 bytes compressed; 54,574 genes × 66,187 cells—was downloaded from the GEO supplementary files via parallel HTTP range requests with per-chunk md5 verification and a gzip integrity test. Because the full matrix exceeds the 4-GB memory envelope, myeloid cells were extracted by streaming row filtering guided by the authors’ annotation (celltype_global == “Myeloid”), yielding 10,150 cells (Myeloid-Mast and Myeloid-Liver-doublet labels excluded, matching the myeloid-only scope of Layer 3). Quality control identical to Layer 3 (≥ 200 detected genes; mitochondrial fraction < 20%; removal of residual EPCAM/KRT19/CD3D/CD8A contaminants at log-normalized expression > 2) retained 10,091 cells, which were analyzed in full without downsampling. The identical scanpy pipeline as Layer 3 (normalize_total(1e4), log1p, 2,000 HVGs, PCA 50, k = 15 neighbors, Leiden resolution 0.6, seed 42) yielded 13 clusters, annotated by the same marker-signature z-score procedure and cross-checked against the authors’ celltype_sub labels; in addition to the three TAM subsets, a liver-resident Kupffer subset was annotated (driven by MARCO/VSIG4/LYVE1; TIMD4/CD5L are near-absent under this gene annotation). The same nine metabolic pathway gene sets (Supplementary Table S17) were scored with score_genes (ctrl_size = 50, seed 42), and the same statistics were applied: two-sided Wilcoxon rank-sum tests with BH correction across the three TAM subsets (27 tests) and Spearman’s ρ for pathway × subset-marker co-variation. Gene-detection caveats specific to this dataset (SPP1 detection rate 4.9%; SELENOP absent from the annotation) are reported in Supplementary Note 9.
GBM Visium replication (Parent_Visium_Human_Glioblastoma). The 10x Genomics Visium fresh-frozen human GBM section (Slide V10A13-167, Area C1; Space Ranger 1.2.0) was downloaded from the 10x portal and processed with the identical Layer 2 pipeline: 3,468 spots (all under tissue); QC at n_genes_by_counts ≥ 500, total_counts ≥ 1,000, and genes detected in ≥ 10 spots yielded 3,461 spots × 19,300 genes; normalize_total(1e4) and log1p; module scoring with score_genes (ctrl_size = 50, seed 42). The thirteen Layer 2 modules were carried over unchanged except that the tumor-epithelial module was replaced by a glioblastoma tumor/stemness module (SOX2, GFAP, OLIG2, NES). The GBM layer was scored from the raw matrix with the breast-layer gene sets used verbatim after gene-set verification showed that an earlier archived run had used rebuilt, non-identical gene sets; all GBM values reported in this manuscript come from that identical-gene-set analysis (Supplementary Table S7). One detection caveat applies: ARG1 (Arginine module) was not detected above the ≥10-spot filter in the GBM matrix (1 UMI in 1 spot) and was scored from the remaining 4 genes; the other 82 of 83 module genes (98.8%) were detected. Spatial statistics were identical to Layer 2: Moran’s I on a 6-nearest-neighbor cKDTree graph (distance threshold 1.3 × grid spacing, symmetrized binary weights; 199 permutations, seed 42), spot-level Spearman correlations across all 3,461 spots, and TAM-score top-20%-versus-bottom-20% regional contrasts by two-sided MWU with BH correction.
Generalizability assessment. Replication was scored per primary finding as direction concordance of within-study contrasts—per-pathway subset-mean differences for the single-cell layer and correlation signs for the spatial layer—with significance assessed by the same Wilcoxon + BH and Spearman tests as in the primary layers. Replication claims rest on direction and effect size (subset-mean differences; Spearman’s ρ) rather than on p-values alone, because large-n p-values carry little discriminative information; absolute score values are never compared across studies, because score_genes control-gene backgrounds are dataset-specific (Section 4.4).
2.7. In Silico Metabolic Perturbation: Subset-Specific Genome-Scale Models
To convert expression phenotypes into testable dependency predictions, we built subset-specific genome-scale metabolic models. Pseudobulk expression of 2,621 metabolic genes (Human1 gene panel) for the three LUAD TAM subsets was computed from the GSE131907 matrix after per-cell normalization (normalize_total to 10⁴, log1p) and exclusion of the 329 corrupted gene rows identified in Section 2.4 (union of the field-count and impossible-value lists, which overlap by 199 rows). Models were built on Human-GEM (SysBioChalmers, main branch commit 635f533; Systems Biology Markup Language (SBML) format; 12,931 reactions, 8,461 metabolites, 2,848 genes) with COBRApy 0.32.1 (GLPK solver). Gene–protein–reaction (GPR) rules were evaluated exactly (and→min, or→max), and reaction capacities were scaled by fac = 0.001 + 0.999 × clip(score/Smax, 0, 1) with Smax = 5.8367 fixed across subsets to preserve absolute inter-subset differences. A defined medium (63 open exchanges: glucose, glutamine, 20 amino acids, four fatty acids, cholesterol, vitamins, ions, and gases) was capped to tumor-like levels (glucose ≤ 0.5× and O₂ ≤ 0.3× of the unrestricted parsimonious flux-balance analysis (pFBA) baseline uptake; other nutrients ≤ max(0.5× baseline, 1.0)). Two vitamin-family uptakes (aquacob(III)alamin, γ-tocotrienol) identified by a greedy feasibility search were additionally opened because the whitelist medium was otherwise biomass-infeasible. Knockouts set the target gene’s expression to zero and re-evaluated all affected GPRs, allowing isozyme compensation where transcripts remained (correct KO semantics; naive cobra knock_out() alone masked all effects in preliminary runs). Readouts per subset × {WT, LDHA-KO, G6PD-KO, CPT1A-KO} were pathway-specific capacity maxima: lactate secretion (glucose-only carbon), ATP hydrolysis (glucose-only), ATP on palmitate, CPT1 flux on palmitate, cytosolic NADPH production (TME medium), and biomass (TME medium), plus pFBA (fraction_of_optimum = 1.0) reference fluxes. A 41-gene single-knockout essentiality scan (ATP/NADPH/biomass capacity) complemented the targeted knockouts. All media, caps, and scaling parameters are frozen in machine-readable form (Supplementary Data: v5_params.json, tme_caps_v3.json, medium_defined.json); all scripts are in Supplementary Data.
2.8. Mitochondrial Clonality Analysis
For clonal inference we used publicly downloadable Cell Ranger BAMs from two 10x Genomics datasets: the 5′ v2 melanoma dissociated-tumor-cell (DTC) sample (sc5p_v2_hs_melanoma_10k; 27.1 GB possorted BAM) and three donors of the 3′ HT v3.1 40k NSCLC DTC mixture (per-donor sample alignments). For each BAM, the chrM byte range was located by parsing the .bai index (contig 22, GRCh38), and only that compressed segment was retrieved via parallel HTTP range requests. Decompressed records were parsed with a custom streaming BAM reader; mismatches against the rCRS reference were counted per position (bulk pileup), and per-cell four-base counts were collected at candidate sites (bulk minor-allele frequency ≥ 1%, minor count ≥ 10, depth ≥ 500) for cells passing expression QC. Clonal markers were called by bimodality: sites with ≥ 50 evaluable cells (depth ≥ 5), ≥ 3 cells with variant allele fraction (VAF) ≥ 0.8, and ≥ 10 cells with VAF ≤ 0.2, with clone cells defined as depth ≥ 5 and VAF ≥ 0.8. Sites showing uniform intermediate VAF across all cells (the signature of nuclear mitochondrial pseudogene (NUMT) mapping artifacts, exemplified by 2617 A>T) were excluded from clone calling. Clone enrichment across compartments was tested with Fisher’s exact test on evaluable cells (depth ≥ 5 at the variant site); metabolic phenotypes of clone versus non-clone cells were compared by Mann–Whitney U on the module scores of Section 2.9 (gene-set definitions). Clone calling relied on per-cell heteroplasmy bimodality at individual mtDNA sites (depth ≥ 5, alt-allele fraction ≥ 0.8). Multi-site concordance was available for the donor-5 clone (2069 T>C co-segregating with 11176 G>A, p = 6.3 × 10⁻¹⁷) but was sparse for the melanoma clone (supported by D-loop site 214 A>G in 7/7 evaluable carriers, p = 1.4 × 10⁻¹⁴, with only 7 of 23 carriers evaluable at that site; site 214 itself shows significant strand bias, p = 7.5 × 10⁻⁴, and is therefore corroborative only). Strand-bias filtering was of limited power because coverage at the clone-defining sites was near-single-strand (94–99.8%), which is intrinsic to 5′/3′ scRNA-seq libraries; no alt-specific strand enrichment was detected at the clone-defining sites (p = 0.22 and p = 0.61). Clone sizes should therefore be considered approximate (Supplementary Table S10–S12). The melanoma expression matrix (filtered feature–barcode matrix) was downloaded from the same 10x page; NSCLC donor matrices and multiplexing tag calls from the 40k NSCLC dataset page (both CC BY 4.0).
2.9. Metabolite and Gene-Set Definitions
The Layer 1 target panel comprised eight deprotonated lipid ions ([M−H]−): palmitate (FA16:0, m/z 255.2332), oleate (FA18:1, 281.2486), linoleate (FA18:2, 279.2329), stearate (FA18:0, 283.2643), arachidonate (FA20:4, 303.2329), FA20:3 (297.2395), a phosphatidylethanolamine-class phospholipid (744.5589), and phosphatidylinositol 38:4 (885.5499); prostaglandin E2 (351.2177) was queried as an a priori eicosanoid candidate. Gene modules for Layers 2–3 are defined in Supplementary Table S17; the four cell-type modules use established markers (TAM signature: CD68, CD163, MSR1, MRC1, C1QA, C1QB, C1QC, APOE, TREM2, LGMN, CTSD, LYZ; SPP1+ TAM: SPP1, APOE, TREM2, CD9, GPNMB; cytotoxic T: CD3D, CD3E, CD8A, GZMB, NKG7; tumor epithelial: EPCAM, KRT8, KRT18, KRT19).
Supplementary Table S17 defines the complete, closed-form gene sets so that scoring can be reproduced exactly. The module panels of the two transcriptomic layers overlap but are not identical, by design: Layer 2 scored 13 modules per spot—the four cell-type modules and nine metabolic/hypoxia modules including hypoxia—whereas Layer 3 scored nine metabolic pathways per cell, replacing the hypoxia module (a spot-level environmental program) with the tryptophan–kynurenine pathway (a macrophage-intrinsic immunosuppressive program; Supplementary Note 7). The two layers thus share eight metabolic modules, with hypoxia unique to Layer 2 and tryptophan–kynurenine unique to Layer 3. In addition, Layer 3 scored glycolysis and OXPHOS as 12-gene extended versions of the Layer 2 sets (additions listed in Supplementary Table S17) to broaden coverage of terminal glycolysis and respiratory-chain/ATP-synthase subunits. PKM, ATP5F1A, ATP5F1B, and ATP5MC1 are not annotated in the GSE131907 gene universe, giving 11/12 and 9/12 detected genes, respectively. Three genes failed the Layer 2 detection filter (expression in ≥ 10 spots): ACADL, ARG1, and NOS2—all known to be lowly expressed in bulk-like spatial capture—so the effective arginine module in Layer 2 comprised ARG2, ASS1, and ASL; all three genes were detected in the Layer 3 single-cell data. This behavior is itself informative: the classical M2-associated ARG1 axis is poorly captured at spot resolution, whereas arginine-biosynthetic enzymes are detectable, illustrating why detection-sensitive interpretation is required at each layer. The FAO and lipid-uptake modules deliberately separate oxidation of internalized lipids from uptake machinery, consistent with evidence that TAM lipid accumulation and oxidation can be decoupled. The high-resolution CRC Visium HD layer (Section 2.5) scored the same gene sets, but its probe panel lacks ALDOA, GAPDH, KRT18, LDHA, MT-CO1, and PFKL, so the effective Layer HD modules were glycolysis 7/10, lactate shuttle 3/4 (LDHB, SLC16A1, SLC16A3), OXPHOS 7/8, and tumor epithelial 3/4 (EPCAM, KRT8, KRT19). All other modules (including SPP1+ TAM, SELENOP+ TAM, lipid uptake, and iron handling) were fully covered.
2.10. Statistics and Reproducibility
Unless stated otherwise, group comparisons used two-sided Mann–Whitney U / Wilcoxon rank-sum tests, correlations used Spearman’s ρ, and spatial significance used permutation testing (199 permutations, seed 42; resolution floor p = 0.005). All multiple comparisons were controlled with the BH procedure at FDR < 0.05, and nominal p-values are reported only alongside adjusted values; effect sizes accompany all primary claims. Four additional rigor measures were implemented and reported (Supplementary Table S1–S16). First, to counter spatial pseudoreplication in the spot-level correlations, correlations were re-tested with (i) a 199-permutation spatial rotation (“spin”) test [34] that preserves each variable’s autocorrelation while breaking cross-variable linkage, and (ii) a Clifford–Richardson effective-sample-size (ESS) correction [35] using each module’s Moran’s I, ESS = n(1−I_x)(1−I_y)/[(1−I_x)(1−I_y) + I_x·I_y], with corrected p from t = ρ√((ESS−2)/(1−ρ²)) at df = ESS−2. The same convention was applied to the CRC Visium HD layer (Supplementary Table S9). To counter compositional confounding of the spot-level couplings, modules were additionally scored after removal of shared genes (de-overlap). Partial Spearman correlations (rank-residual OLS, cross-checked against pingouin) were computed controlling a pan-myeloid abundance score (CSF1R, CD14, FCGR3A, ITGAM, HLA-DRA—none of which occurs in any metabolic module or in the TAM signature) and library size (Supplementary Table S8). Second, to counter single-cell pseudoreplication [36], all TAM subset contrasts were re-tested at the patient level: cells were aggregated into patient-by-subset pseudobulks (164 all-origin combinations with ≥ 20 cells; 11 fully paired tumor-lung patients) and subsets were compared across patients by Mann–Whitney U (all-origin) or paired Wilcoxon signed-rank (tLung) with BH correction, with Cliff’s δ reported as the effect size. Third, leave-one-gene-out (LOO) analysis quantified the dependence of subset rankings on individual genes, using the exact Supplementary Table S17 gene sets (Supplementary Table S2). Fourth, the HCC replication layer was additionally tested at donor level (paired Wilcoxon across donors; Supplementary Table S6). All random seeds were fixed (42) and all software is free or open-source, with versions pinned as listed in Section 2.2, Section 2.3, Section 2.4, Section 2.5 and Section 2.6 (Python 3.12.12; scanpy 1.12.3; anndata 0.13.2; numpy 2.2.5; pandas 2.3.2; scipy 1.16.2; leidenalg 0.12.0; igraph 1.0.0; umap-learn 0.5.12; pyimzML 1.5.x; h5py 3.16.0; fastparquet 2026.5.0; matplotlib 3.10.3; seaborn 0.13.2). No commercial software is required at any step. Analysis scripts, environment manifests, and per-run output tables accompany this submission as Supplementary Data (70 CSV/JSON files plus the pipeline scripts) accompanying this submission. The workflow is fully scripted, uses public data only, and can be re-executed end-to-end from the raw public downloads with the deposited scripts.
3. Results
3.1. A Verified Public Data Landscape for TAM Spatial Immunometabolism
Every dataset considered was re-queried against its host repository; only records resolving at check time were retained (Section 2.1). The verified catalog (>20 datasets; Supplementary Table S14) spans tumor MSI records on MetaboLights and METASPACE, an isotope-tracing MSI study, seven Visium/Visium HD tumor datasets, and TAM-annotated scRNA-seq atlases, including three multi-modal paired resources. Negative verification results delimit the framework: no dedicated tumor MSI collection could be verified on GNPS/MassIVE, accession S-BIAD14260 returned HTTP 404, the sun-2022 project carries an UNDER_REVIEW flag, and no public MSI dataset is explicitly annotated for TAMs—the gap motivating the multi-layer design (Supplementary Note 3).
3.2. Layer 1—Spatially Structured Lipid Mediators in Breast Tumor DESI-MSI
We re-analyzed MTBLS273 [24]—two regional sections of one breast tumor block, BRB01C (center; 2,856 pixels) and BRB01S (south; 3,721 pixels) (Section 2.2). The acquisition is negative-ion and lipid-focused (m/z 204.59–975.29): small polar metabolites (lactate, succinate, glutamate) are unmeasurable, and the C-versus-S contrast is intra-tumoral, not tumor-versus-normal (Section 2.2). Eight lipid ions were quantified in both sections (Figure 2). All eight were strongly spatially structured (Moran’s I 0.664–0.962; Supplementary Table S13), with directionally consistent regional contrasts: oleate, palmitate, and linoleate concentrated in the tumor-center section, stearate and PI 38:4 in the southern section, and free arachidonate detected in 44.7% versus 59.1% of pixels. The lipid architecture of this tumor is thus regionalized and lipid-class-specific, consistent with spatially organized tumor metabolism [14,16,20]. DESI-MSI is cell-type-agnostic: these ion images localize the substrate environment in which TAMs operate but do not prove macrophage-intrinsic metabolism (Supplementary Note 4).
Pooling all 6,577 pixels, the arachidonic-acid (AA) cascade was specifically coupled to membrane phospholipid remodeling (Figure 2): arachidonate correlated with PI 38:4 at ρ = 0.90 and with the m/z 744.56 phospholipid at ρ = 0.87 (all other pairs ≤ 0.75), persisting within each section (BRB01C ρ = 0.944; BRB01S ρ = 0.917), ruling out section identity as the sole driver. Because PI 38:4 is the canonical arachidonoyl-phosphatidylinositol, this co-localization—extending known stromal-interface arachidonoyl-PI enrichment [37]—marks eicosanoid-competent niches of greatest prostaglandin E2 (PGE2) substrate supply—a spatial proxy for the COX/PGE2 axis that sustains suppressive myeloid phenotypes [38,39,40]. The PGE2 [M−H]− ion (m/z 351.2177) was detected above background in only ~1% of pixels, so we make no claim on its spatial distribution (Supplementary Note 4).
3.3. Layer 2: TAM–tumor Metabolic Complementarity in Visium Spatial Transcriptomics
In Visium Section 1 (3,795 quality-controlled spots; Section 2.3), 11 of 13 modules recovered all genes; FAO and arginine were partially recovered (Supplementary Note 5).
All 13 modules showed significant positive spatial autocorrelation (12 at the p = 0.005 permutation floor; arginine p = 0.01), and the TAM signature was the most strongly aggregated module (Moran’s I = 0.6384, z = 65.6); the recomputed lipid-uptake module (an earlier archived score was contaminated) is only weakly aggregated (I = 0.1765; Supplementary Table S8). The maps corroborate this (Figure 3): TAM and SPP1⁺ TAM scores concentrate in contiguous stromal bands, while glycolysis and hypoxia highlight largely non-overlapping territories (H&E overlay: Figure 3a).
Across all 3,795 spots (Supplementary Table S18), the strongest TAM association was iron handling (ρ = 0.568), followed by cytotoxic T cells (ρ = 0.447) and lipid uptake (ρ = 0.352); OXPHOS, tumor-epithelial content, hypoxia, and glycolysis were negative (ρ = −0.096 to −0.382).
Under both pseudoreplication corrections (spin test; ESS), every Supplementary Table S18 row was re-tested: the iron-handling, lipid-uptake, cytotoxic-T, PPP, hypoxia, tumor-epithelial, and OXPHOS couplings survive. Because iron programs could mark microscopic hemorrhage rather than TAM-intrinsic biology [41], we re-extracted erythrocyte, heme-scavenging, and endothelial spot counts from the raw section: the coupling (raw ρ = 0.568, corrected-gene-set pipeline) was unchanged by partialing out each axis (partial ρ = 0.567–0.570), and iron scores did not co-localize with erythrocyte counts (ρ = +0.016), rejecting hemorrhage geography as the driver (Supplementary Note 14). Selection on the maximum was likewise excluded: against 500 expression-matched random modules the empirical null was centered at zero (maximum ρ = 0.437), so the coupling (ρ = 0.568) exceeds the 100th percentile (empirical p < 0.002; Supplementary Note 15). An abundance-level non-negative-least-squares deconvolution against the LUAD myeloid reference left most of the coupling intact after partialling out the deconvolved myeloid weight (partial ρ = 0.488), consistent with a TAM-intrinsic program rather than abundance alone (Supplementary Note 15). Critically, the TAM × glycolysis anticorrelation does not survive the spin test (p = 0.060; seed check 0.070), although it survives ESS correction (p = 3.1 × 10⁻⁵). The lactate-shuttle, arginine, FAO (null throughout), and SPP1⁺ TAM × glycolysis rows likewise fail spatial permutation; we therefore report the TAM–glycolysis complementarity as nominal-only (Figure 3f). Because MSR1 is shared between the TAM signature and the lipid-uptake module, we decomposed the positive couplings (Supplementary Table S8). Removing MSR1 halved the lipid-uptake correlation (ρ = 0.173), and a partial Spearman controlling pan-myeloid abundance and library size reduced it further (partial ρ = 0.11): the lipid-uptake coupling is thus largely compositional—a cautionary methodological finding, not a headline coupling. The iron-handling coupling, by contrast, is robust to the same controls (partial ρ = 0.37).
Comparing top and bottom TAM-score quintiles (n = 759 each), eight of nine metabolic/hypoxia modules differed significantly after BH correction: TAM-high regions were enriched for iron handling (Δ = +0.316), lipid uptake (Δ = +0.140; same abundance caveat), and PPP (Δ = +0.064), and depleted for OXPHOS (Δ = −0.215), hypoxia, and glycolysis, with FAO null and lactate-shuttle/arginine effects marginal.
Same-block replication. On the adjacent same-block section (Section 2; 3,982 spots, identical pipeline), all headline patterns replicated: the TAM signature was again the most aggregated module (Moran’s I = 0.677 versus 0.638), with the iron (ρ = 0.512, spin p = 0.005), compositional lipid (ρ = 0.324; controlled partial 0.145), negative OXPHOS/hypoxia, and cytotoxic-T couplings recurring, both null results remaining null, and 10 of 12 regional contrasts matching in direction (Supplementary Note 13, Supplementary Table S20, Figure 3g).
3.4. Layer 3—Divergent Metabolic Programs Across TAM Subsets
We scored nine metabolic pathways (exact Supplementary Table S17 gene sets) in 20,000 myeloid cells from the LUAD atlas GSE131907 ([30]; Section 2.4). A data-integrity caveat applies: 329 corrupted gene rows (1.1%) in the source deposit were excluded (all marker and pathway genes verified unaffected), and archived scores for four modules had diverged from the curated gene sets; every value here uses the exact Supplementary Table S17 sets (Supplementary Table S2 and Table S5; Supplementary Note 6).
Clustering resolved seven annotated subsets (Figure 4), validated against the authors’ labels and the pan-cancer framework of Cheng et al. [12]. This defines the central confound: 80.2% of C1QC⁺ cells (5,069 of 6,318) derive from normal lung and only 9.6% from tumor lung, whereas 96.8% of SPP1⁺ cells derive from tumor or metastatic sites (Supplementary Table S3). All contrasts are therefore reported all-origin (descriptive) and tumor-lung (tLung)-restricted, with tLung patient-level pseudobulk as the inference standard.
All-origin averages (Figure 5; Supplementary Table S19) showed three mutually distinct programs: glycolysis and lactate transport highest in SPP1⁺ TAMs (0.827, versus 0.535 in C1QC⁺), lipid-uptake/scavenging, OXPHOS, and PPP highest in C1QC⁺ TAMs (Δ = +0.645 over SPP1⁺, p < 10⁻³⁰⁰), and iron handling highest in FOLR2⁺ TRM-like cells (2.306; [42]). This SPP1⁺-glycolytic versus C1QC⁺-lipid/oxidative polarity direction was reported previously in NSCLC [22]; our increment is the origin-controlled, patient-level re-testing that weakens it.
In tLung cells (n = 4,154; Supplementary Table S19, Panel B; Supplementary Table S4), glycolysis SPP1⁺ > C1QC⁺ survived but attenuated (Δ = +0.092, adjusted p = 0.0023, all-27 BH family; within-module BH 0.0017), lipid uptake C1QC⁺ > FOLR2⁺ (Δ = +0.430, p = 5.7 × 10⁻⁵⁴), and FOLR2⁺ iron handling remained highest (2.450). The decisive patient-level test (11 tLung patients; Supplementary Table S5; within-module BH families) confirmed the FOLR2⁺-comparator contrasts (glycolysis, lactate transport, PPP; adjusted p = 0.0029–0.021, with SPP1⁺ > FOLR2⁺ PPP nominal-only at 0.081), lipid uptake C1QC⁺ > FOLR2⁺ (Δ = +0.310, adjusted p = 0.029), and iron handling FOLR2⁺ > C1QC⁺ (adjusted p = 0.0088). The tryptophan–kynurenine (Trp–Kyn) SPP1⁺ > C1QC⁺ contrast is nominal-only under the corrected scoring (raw p = 0.032, adjusted p = 0.097) and scoring-variant-sensitive (archived: adjusted p = 0.038); it is excluded from the patient-level survivors.
By contrast, the all-origin headline contrasts did not survive patient-level testing—glycolysis SPP1⁺ versus C1QC⁺ (p = 0.83, direction reversed), lipid uptake SPP1⁺ versus C1QC⁺ (p = 0.24), lactate transport (p = 0.21–0.47), and FAO (p = 0.175)—and with n = 11 pairs, some nulls reflect limited power. Leave-one-gene-out analysis showed the glycolysis, OXPHOS, and FAO rankings 100% robust but the lactate shuttle fragile (50% retention; not claimed as a subset hallmark; Supplementary Table S2).
The C1QC⁺ lipid program is expressed as uptake/scavenging (tLung 0.497) far more than as FAO (0.095), suggesting accumulation rather than catabolism [43]. Gene-level correlations confirm a continuous program rather than a clustering artifact: glycolysis score correlated with SPP1 expression across the TAM compartment (ρ = 0.513; 12,139 TAM-subset cells) and most strongly within tumor-lung SPP1⁺ TAMs (ρ = 0.651; gene-set variants 0.466, 0.619) (Figure 5c). FAO score, in contrast, correlated only weakly with C1QC expression (ρ = 0.108), reinforcing the uptake-and-storage reading of the C1QC⁺ lipid signature [7].
3.5. Mechanistic Modules Linking the Layers: Amino-Acid Axes and Lipid/iron Programs
Three amino-acid modules (arginine; glutamine; tryptophan–kynurenine) and two lipid/iron programs carry the strongest remaining mechanistic evidence; we confronted each with Layers 1–3 (full grading in Supplementary Note 7). The ARG1/iNOS axis illustrates the detectability problem: ARG1 biology is functionally established [9,14], yet ARG1/NOS2 transcripts failed the Visium detection filter, the residual ARG2/ASS1/ASL module had weak spatial autocorrelation and a non-robust TAM association, and free arginine lies below the MTBLS273 acquisition floor: absence of signal reflects assay limits, not biological absence. The glutamine–αKG/Jmjd3 and Trp–Kyn–AHR axes [44,45] rest on literature evidence—the relevant metabolites fall outside our Layer 1 window and Trp–Kyn scores varied only marginally across subsets (Supplementary Table S19)—and the negative phase III epacadostat trial [46] exposes the redundancy of this axis without subset stratification. The strongest cross-layer signals are the lipid and iron programs [47,48]. Layer 1 maps the PGE2 precursor pool in situ (arachidonate × PI 38:4, ρ = 0.90), and Layer 3 establishes the C1QC⁺ lipid-uptake contrast with uptake/storage dominating FAO (tLung C1QC⁺ > FOLR2⁺, adjusted p = 0.029). The iron-handling coupling (ρ = 0.568; controlled partial ρ = 0.37; TAM-high Δ = +0.316) is the dominant robust spatial signal, consistent with polarization-dictated iron handling and iron-recycling TAM phenotypes [49,50,51,52], whereas the Layer 2 lipid-uptake coupling is largely compositional (Section 3.3). Measured Layer 3 module activity: Figure 5d (predictions graded in Supplementary Note 7).
3.6. High-Resolution Validation of TAM Metabolic Niches in Colorectal Cancer Visium HD
To test whether niche complementarity persists at near-single-cell resolution, we re-analyzed the three CRC Visium HD (8-µm) sections of GSE280318 [21], in which SELENOP⁺ and SPP1⁺ macrophages occupy distinct niches along the colorectal tumor boundary. Probe-panel absences reduce glycolysis to 7 of 10 genes and the lactate shuttle to an LDHB/SLC16A1/SLC16A3 module reporting lactate oxidation and transport rather than production (Section 2.5). All modules were significantly spatially aggregated in every section (p ≤ 0.01; maps: Figure 3a).
Within a ±200-µm boundary band, SPP1⁺ TAM scores were elevated inside the tumor (+0.143, +0.074, +0.084) and SELENOP⁺ TAM scores outside in all three sections, reproducing Oliveira et al. [21]; extending this to metabolism, glycolysis, lactate shuttle, PPP, OXPHOS, and iron handling were all higher inside the tumor (3/3; iron handling most strongly, +0.353 to +0.560) and lipid uptake higher outside (3/3)—gradients near-parallel across patients (Figure 3b).
Section-wide correlations quantified the co-localization (Figure 3; Supplementary Table S15): the strongest association paired SELENOP⁺ TAM with lipid uptake (smoothed ρ = 0.748, 0.779, 0.662); SPP1⁺ TAM scores co-localized with iron handling (ρ = 0.663, 0.636, 0.611) and, critically, positively with glycolysis (ρ = 0.398, 0.450, 0.405), opposite in sign to the 55-µm spot-level correlation, while SELENOP⁺ TAM scores were segregated from glycolysis-, PPP-, and lactate-high regions. Although spatial autocorrelation reduced effective sample sizes to 0.04–1.22% of nominal, all nine headline correlations remained significant after ESS correction (corrected p ≤ 2.6 × 10⁻²¹; Supplementary Table S9). Every key association replicates in direction across all three patients with rank ordering preserved; the correlation matrices split into two blocks (SPP1⁺/glycolysis/iron versus SELENOP⁺/lipid uptake; Supplementary Note 8). Co-localization at 8 µm remains regional rather than demonstrably same-cell; we therefore rely on three-patient directional replication.
3.7. Cross-Tumor Generalizability: Conserved Core Polarity, Context-Dependent Periphery
We re-ran the frozen pipeline on two public stringency-test cohorts, with direction-of-effect hypotheses recorded prior to the replication analyses but after the primary results were known: HCC scRNA-seq (GSE140228), the strongest resident-macrophage control, and a GBM Visium section, the most extreme necrosis–hypoxia geometry. The HCC cohort yielded 10,091 quality-controlled myeloid cells (13 clusters, including 2,566 Kupffer cells) and the GBM section 3,461 spots; since absolute module scores are not transportable across datasets (Section 2.6), cross-tumor statistics compare within-study contrasts and correlation signs.
The central single-cell finding of Section 3.4 replicated directionally in HCC (Figure 6d): SPP1⁺ TAMs outscored C1QC⁺ TAMs for glycolysis (Δ = +0.093, BH p = 2.3 × 10⁻¹⁴; LUAD: +0.292) and lactate transport, and C1QC⁺ TAMs led lipid uptake/scavenging among TAM subsets (versus SPP1⁺ Δ = +0.176, p = 6.8 × 10⁻³³). Donor-level pseudobulk testing was power-limited (five donors; n = 3–4 evaluable per contrast; minimum two-sided p = 0.125): 13 of 27 contrasts were direction-consistent in ≥3/4 of evaluable donors, none individually significant (Supplementary Table S6). Gene-level correlations were direction-consistent but attenuated (glycolysis × SPP1 ρ = 0.106; SPP1 detected in only 4.9% of cells). In GBM, scored with gene sets identical to the breast discovery layer (an earlier archived run had used non-identical sets; Supplementary Table S7), the negative pan-TAM couplings to glycolysis and hypoxia recurred with strengthened magnitude (ρ = −0.249 and −0.317 versus −0.096 [nominal-only] and −0.194 in breast), with negative lactate-shuttle and OXPHOS couplings (ρ = −0.214 and −0.138).
Several findings did not transfer, and these negative results are equally informative (Figure 6; Supplementary Note 9). In HCC, iron handling—anchored to FOLR2⁺ TRM-like cells in LUAD (2.306)—peaked instead in C1QC⁺ TAMs (1.894), with Kupffer cells next (1.801); the glycolysis SPP1⁺ > FOLR2⁺ contrast likewise reversed (HCC Δ = −0.068, p = 6.1 × 10⁻¹⁰; LUAD Δ = +0.393). In GBM, the breast TAM × lipid-uptake coupling was null (ρ = −0.013, p = 0.46; the sign reversal seen with the earlier archived scores was an artifact of their non-identical gene sets) and the iron-handling coupling was likewise null (ρ = −0.005, p = 0.76). Critically, SPP1⁺ TAM scores correlated positively with glycolysis (ρ = +0.242) and hypoxia (ρ = +0.199)—consistent with perinecrotic, pseudopalisading accumulation of SPP1⁺ macrophages in GBM ([13,16,53]; Supplementary Note 9).
All contrasts are tabulated regardless of outcome (Table 1): 12 of 27 HCC contrasts were direction-consistent with LUAD. Against our evidence ladder, the results support L1 (replication in one new tumor type) for the core contrasts but not L2 (cross-tumor conservation), and L3 (homogeneous magnitude) is explicitly falsified (glycolysis Δ = +0.292 in LUAD versus +0.093 in HCC). TAM metabolic organization thus decomposes into a conserved core—glycolytic/lactate-handling SPP1⁺ versus lipid-scavenging C1QC⁺ TAMs—and a context-dependent periphery that reverses, attenuates, or vanishes with the tissue background. Because the GBM evidence derives from a single section and the HCC evidence from five donors, these inferences remain hypothesis-generating.
3.8. In Silico Metabolic Perturbation Predicts Subset-Specific Vulnerabilities
Atlas-level correlations cannot nominate causal dependencies, so we appended a perturbation layer implementing the computational analogue of atlas-to-intervention designs [54]: expression-constrained Human-GEM models of the three LUAD TAM subsets under tumor-like nutrient restriction, reporting within-model relative changes as hypothesis-generating (Section 2.7; Supplementary Note 10). Three structured a priori questions were tested (Figure 5; Supplementary Table S16). Are glycolysis-high SPP1⁺ TAMs uniquely sensitive to LDHA loss? No: LDHB, appreciably expressed in all subsets, fully compensates, and the glycolytic bottleneck lies upstream at GAPDH/PGK1; expression evidence identifies SPP1⁺ TAMs as the most LDHA-committed subset (LDHA transcript fraction 78.3%; SLC2A1 ~15-fold higher), so the prediction is conditional on LDHB protein insufficiency. Is the lipid-laden C1QC⁺ subset most dependent on CPT1A, an experimentally established TAM target [47]? Yes: wild-type maximum CPT1 flux is highest in C1QC⁺ models (tracking CPT1A expression), CPT1B/C are essentially silent in myeloid cells, and knockout collapses mitochondrial fatty-acid uptake in all subsets (−83.5% to −89.6%, largest in C1QC⁺); because that compartment is predominantly normal-lung alveolar macrophages (Section 3.4), the conclusion describes this alveolar-macrophage-dominated program. G6PD loss costs the most NADPH in SPP1⁺ TAMs (−12.0% maximum cytosolic NADPH capacity, versus −9.7% in FOLR2⁺ and −7.9% in C1QC⁺), whose alternative NADPH sources (ME1, IDH1, NNT) are weakest. A 41-gene essentiality scan corroborated the shared GAPDH/PGK1 bottleneck (−59–60% ATP/biomass capacity in every subset) and revealed a C1QC⁺-restricted ENO1 dependency (−36.6% versus −11.7%/0%). Steady-state flux-balance analysis (FBA) cannot predict kinetics, the zero-effect LDHA prediction is a model statement about isozyme redundancy, and etomoxir-class CPT1 inhibitors have off-target CoA depletion [7].
3.9. Clonal Expansion of Hypermetabolic TAMs Marked by Mitochondrial DNA Variants
Adapting established mtDNA clone-tracing logic [55,56,57,58] to public tumor alignment files (Section 2.8), we asked whether SPP1⁺ and C1QC⁺ TAMs partition into separate mtDNA-marked clones or share clones (plastic states), across four tumor samples.
In the melanoma sample, a 20-cell clone marked by homoplasmic 5262 G>A (MT-ND2) was myeloid-restricted (19/20 cells; 11 of 69 evaluable myeloid versus 0 of 94 evaluable T cells, Fisher p = 4.8 × 10⁻⁵; Supplementary Table S10) and hypermetabolic—glycolysis (p = 4.1 × 10⁻¹³), lipid-uptake (p = 1.1 × 10⁻⁶⁴), iron-handling (p = 5.3 × 10⁻⁴) all elevated—sitting almost exclusively in the SPP1⁺/C1QC⁺ TAM compartment (Figure 6). Two controls validate the logic: the 2617 A>T site showed the continuous allele-fraction distribution of NUMT mapping artifacts (Figure 6a), and a second 13-cell clone (13710 A>G) showed no TAM enrichment or metabolic phenotype. After module de-overlap (Supplementary Table S12), the SPP1-core program remained elevated (p = 1.4 × 10⁻⁵) whereas the C1QC-core did not—an SPP1-program-high clone with lipid/iron elevation.
Cross-sample validation showed the finding recurrent but not universal. Donor 5 replicated it: a 59-cell clone marked by 2069 T>C (MT-RNR2; 1.8% of 3,289 myeloid cells) was strongly enriched in myeloid cells among evaluable cells (59 of 2,129 evaluable myeloid cells versus 1 of 290 evaluable T cells, Fisher p = 7.6 × 10⁻³; 62.9% of the T-cell pool). The clone was lipid-uptake-high (p = 1.7 × 10⁻⁵) and iron-high (p = 3.0 × 10⁻⁵) with borderline glycolysis elevation (p = 0.049), and is supported by a second independent site (11176 G>A co-segregating, p = 6.3 × 10⁻¹⁷; Supplementary Table S11); unlike in melanoma, both de-overlapped SPP1-core and C1QC-core programs remained elevated (Supplementary Table S12). Donors 6 and 7 showed no reliable TAM-enriched clone; the only nominally myeloid-associated site (2617 A>T) failed replication and was excluded as artifact-prone. Thus, across four samples, hypermetabolic TAM clonal expansion was detected in two (50%) (Figure 6e).
Two conclusions follow (Supplementary Note 11). The methods are established [55,56,57], and macrophage-biased tumor clones were resolved by Mitotrek [23]; not previously shown is the combination recovered here—TAM-restricted clonal expansion with a defined metabolic phenotype, detected from unenriched public scRNA alignment files. First, SPP1⁺ and C1QC⁺ TAMs can share a clonal origin—in donor 5 one clone carries both metabolic programs after de-overlap—favoring shared progenitors over separate fixed lineages. Second, clonal expansion of metabolically activated TAMs occurs in a subset of tumors rather than universally. The near-absence of the 5262 variant from evaluable T cells argues against pan-hematopoietic (CHIP-like) expansion only within evaluable-fraction bounds (5.8% of melanoma T cells evaluable, 0/94 carriers; 62.9% in donor 5, 1/290 carriers). Clone cells showed no elevated MKI67/TOP2A expression (both p > 0.3), arguing against ongoing in situ proliferation. The expanded clone is a minor fraction of the TAM pool in both positive samples (20/264 and 59/3,289 myeloid cells), a contributor to, not the dominant source of, the compartment. Finally, mtDNA variants are neutral marks rather than proven drivers, clone sizes are small (20–59 cells), per-cell mitochondrial coverage is chemistry-dependent (5′ ≫ 3′ HT), and the analysis covers four samples.
4. Discussion
4.1. Spatial Immunometabolism Reframes TAM Biology
Three orthogonal public-data layers converge on a picture no single layer could deliver: tumor lipid chemistry is regionally organized, TAM-dense territories form iron-high, lipid-high, OXPHOS-low compartments, and single-cell analysis assigns these programs to subsets (glycolytic SPP1⁺, lipid-loaded C1QC⁺, iron-recycling FOLR2⁺) once the tissue-origin confound is removed (Section 3.4). This assignment converges with the pan-cancer SPP1⁺/C1QC⁺ taxonomy, the CXCL9:SPP1 polarity axis, the glycolytic-SPP1⁺ direction in NSCLC, and boundary-resolved SELENOP⁺/SPP1⁺ niches [12,13,21,22], arguing for spatially resolved, subset-specific metabolic states over the M1/M2 dichotomy ([10,11]; Supplementary Note 12). It also offers a parsimonious explanation for the disappointing record of macrophage-targeted therapies [59]: niche-confined programs are diluted in bulk measurements and evaded by unselected enrollment.
4.2. A Conserved Core with a Context-Dependent Periphery
The replication layer partitions findings into a conserved core—SPP1⁺ glycolysis/lactate versus C1QC⁺ lipid uptake (a direction previously reported in NSCLC; [22]), directionally replicated in HCC and echoed spatially in GBM—and a context-dependent periphery that did not transfer (iron-handling anchor changed in HCC; lipid and iron spatial couplings null in GBM, both n.s.). The core tracks the two dominant pan-cancer TAM states [12,13], whereas the periphery is anchored to organ-resident compartments and TME geometry; HCC matched the expectation of a boundary case (Supplementary Note 12). Translationally, core-directed interventions are the most portable; we propose the spatial SELENOP:SPP1 ratio—extending the CXCL9:SPP1 axis [13] and the SELENOP⁺/SPP1⁺ prognostic opposition shown in ovarian cancer [60] into the spatial domain—as a (prospective-validation-requiring) response biomarker for checkpoint blockade (noting that SELENOP is a liver-secreted selenium transporter, so protein-level assays may capture plasma deposition rather than local synthesis), and predict that TAM-directed metabolism trials will need cancer-type-specific stratification.
4.3. Cross-Layer Tensions as Biological Signal
A cross-layer inconsistency is instructive: single-cell data show SPP1⁺ TAMs as the most glycolytic subset (ρ = 0.513–0.651), yet 55-µm spots show a weak negative TAM–glycolysis correlation (ρ = −0.096, nominal-only). Two established facts resolve it—myeloid cells take up the most glucose per cell in the TME [8], and TAMs are segregated from the most glycolytic tumor regions (ρ = −0.221)—so spot averaging turns a positive cell-intrinsic program into a negative aggregate correlation (modifiable areal unit problem; [61]). The three-patient CRC Visium HD layer adjudicates the tension directly: at 8-µm resolution, SPP1⁺ TAM × glycolysis correlations are positive in all three sections (ρ = 0.398–0.450); the GBM section adds a within-section sign flip (pan-TAM ρ = −0.249 versus SPP1⁺ ρ = +0.242). Cross-layer sign reversals are therefore candidate scale-dependent signal; whether they represent genuine scale biology rather than failed replication requires pre-registered prospective testing. Three live controversies are likewise presented from both sides (Supplementary Note 12): FAO necessity for suppressive macrophage states, redundant lactate sensing, and ARG1-axis detectability [14].
4.4. Limitations
Several limitations bound our inferences (full enumeration in Supplementary Note 12): the layers derive from different cancer types, patients, and platforms (conceptual convergence, not co-registration); MSI lacked small polar metabolites; Visium spots mix cells; scRNA-seq scores quantify potential, not flux; and the CRC Visium HD layer is region-level with a reduced probe panel. Most consequentially, autocorrelated spatial units and donor-pooled cells are not independent observations: we applied corrections directly (spin test and ESS for all spatial rows, origin-controlled patient-level pseudobulk, LOO robustness), reporting corrected verdicts throughout (Section 3.3, Section 3.4 and Section 3.6). Residual caveats: the modifiable areal unit problem, single-section GBM replication, the five-donor HCC cohort, and p-values demonstrating existence more precisely than magnitude. Future priorities: pixel-level integration on matched sections, ¹³C-glucose tracing with MSI, and tumor–macrophage co-culture organoids with tunable nutrient supply [54,62].
5. Conclusions
Public data can thus be integrated to spatially resolve TAM metabolic programs across orthogonal modalities (seven contributions: Section 1.4; Supplementary Note 12). TAM metabolic reprogramming is spatially structured, subset-specific, and resolvable into conceptually convergent public-evidence layers: a subset-level core polarity (previously reported in single-cancer data; [22]) recurs across the cancer types tested, within a periphery that each tumor’s organ context re-specifies. The most robust territorial signal—iron-handling coupling, which within the breast block survived every compositional, abundance, and exposure control applied (and was null in the single GBM section)—identifies iron-recycling TAM states as a plausible, organ-context-dependent stratification or intervention entry point, consistent with the recently defined iron-rich iTAM subset [63].
Supplementary Materials
The following supporting information can be downloaded at the website of this paper posted on Preprints.org, Supplementary Table S1. All-origin patient-level pseudobulk re-testing of all 27 TAM-subset × pathway contrasts (164 patient-by-subset combinations with ≥ 20 cells): Cliff’s δ effect sizes, Mann–Whitney p values across patients, and BH-adjusted p values. Underlying file: pseudobulk_patient_level_full.csv. This table supersedes the archived all-origin cell-level p values (Supplementary Data) for inference about patient-invariant subset differences; because it pools tissue origins, tumor-lung-restricted inference (Table S5) is the primary standard. Supplementary Table S2. Leave-one-gene-out robustness analysis with the exact Supplementary Table S17 Layer 3 gene sets: for each pathway, the fraction of single-gene deletions that exactly preserve the TAM-subset ranking (glycolysis, OXPHOS, and fatty-acid oxidation 100%; lactate shuttle 50%). Underlying file: r1_loo_table2.csv; scoring validation in r1_rescore_validation.csv. Supplementary Table S3. TAM-subset composition by tissue origin (counts and within-subset percentages for nLung, tLung, tL/B, mLN, mBrain, PE, nLN), demonstrating that 80.2% of C1QC+ cells are normal-lung alveolar macrophages. Underlying file: r1_composition_by_origin.csv. Supplementary Table S4. Tumor-lung (tLung)-restricted cell-level contrasts: all 27 subset × pathway Wilcoxon tests on tLung cells only (n = 4,154), with Cliff’s δ and BH-adjusted p values. Underlying file: r1_tlung_contrasts.csv (archived scanpy scoring; the variant scored with the exact Supplementary Table S17 gene sets is provided in r6b_luad_corrected_contrasts.csv, and main-text tLung values use the corrected scoring). Supplementary Table S5. Tumor-lung patient-level pseudobulk contrasts: 27 subset × pathway paired Wilcoxon signed-rank tests across the 11 tLung patients with all three TAM subsets (paired Cliff’s δ, BH-adjusted p values). Underlying files: r1_tlung_pseudobulk.csv and, with the corrected Supplementary Table S17 module scores, r6b_luad_corrected_contrasts.csv. This table is the primary inference standard for subset differences; adjusted p values use within-module Benjamini–Hochberg families (the all-27-contrast family is reported alongside in the underlying file). Supplementary Table S6. HCC donor-level pseudobulk analysis (GSE140228): all 27 contrasts at ≥30- and ≥10-cells-per-subset thresholds, paired Wilcoxon across donors, with the five-donor power analysis. Underlying file: r3_hcc_donor_pseudobulk.csv; gene-set-verified HCC contrasts in r6b_hcc_corrected_contrasts.csv. Supplementary Table S7. GBM Visium replication with the breast-identical gene sets: 13 × 13 spot-level Spearman correlations, Moran’s I, and TAM-high versus TAM-low regional contrasts, with the old-versus-new comparison. Underlying files: r2_gbm_rerun_spearman.csv, r2_gbm_rerun_moransI.csv, r2_gbm_rerun_region.csv, r2_gbm_gene_hits.csv, r2_old_vs_new_comparison.csv. Supplementary Table S8. Breast Visium macrophage-abundance and gene-overlap control analysis: MSR1 de-overlapped correlations, partial Spearman controlling pan-myeloid abundance and library size, and within-TAM-high stratification, together with the corrected Supplementary Table S18 values. Underlying files: r4_visium_confound.csv, r6a_table3_replacement.csv. Supplementary Table S9. CRC Visium HD effective-sample-size (ESS) correction: raw and smoothed correlations for the three headline pairs in all three patients with Moran’s I, ESS, and ESS-corrected p values. Underlying file: r4_crc_ess.csv. Supplementary Table S10. mtDNA clonality evaluable-cell counts: per-sample, per-compartment numbers of cells with depth ≥ 5 at the clone-defining sites, carrier counts, and Fisher statistics. Underlying file: r5_evaluable_cells.csv. Supplementary Table S11. mtDNA strand-bias and multi-site concordance quality control: alt-versus-ref strand association at clone-defining and control sites, and co-segregation of the donor-5 2069 T>C clone with 11176 G>A. Underlying file: r5_strand_multisite.md. Supplementary Table S12. Dual-program de-overlap analysis: SPP1-core and C1QC-core module scores (APOE/TREM2 removed) in clone versus non-clone myeloid cells for the melanoma and NSCLC donor-5 clones. Underlying file: r5_dualprogram_deoverlap.csv. Supplementary Table S13. MSI Moran’s I verification: independent recomputation of all 16 ion × section Moran’s I values for MTBLS273, resolving the flagged duplicate 0.712 as a rounding coincidence (unrounded I = 0.71187 and 0.71168). Underlying file: r4_msi_moran_check.csv. Supplementary Table S14. Core verified public datasets used in the multi-layer re-analysis framework. See Supplementary Note 3. Supplementary Table S15. Three-patient consistency summary of key spatial statistics in the CRC Visium HD sections (GSE280318). See Supplementary Note 8. Supplementary Table S16. In silico perturbation summary: subset-specific metabolic vulnerabilities (percent change versus wild type). See Supplementary Note 10. Supplementary Table S17. Metabolic gene modules scored in Layers 2 and 3, with gene detection in each layer (the closed-form gene sets used for all module scoring). Supplementary Table S18. Spot-level Spearman correlations between TAM (or SPP1⁺ TAM) module scores and metabolic/cell-type module scores in the Visium breast cancer section (n = 3,795 spots), computed from the corrected module scores, with naive, spin-permutation, and ESS-corrected p values (the values supersede the archived contaminated-score statistics). Supplementary Table S19. Mean metabolic-pathway scores by myeloid subset (score_genes, exact Supplementary Table S17 gene sets), all tissue origins (Panel A) and tumor-lung cells (Panel B); bold marks the highest-scoring subset per pathway. Supplementary Notes. Supplementary Notes 1–12 (contained in the Supplementary Materials document): expanded background, methods, results, and discussion, with Supplementary Table S14–S16 in context. Supplementary Note 13 hosts the same-block Section 2 robustness check (panel version: Figure 3g; Supplementary Table S20). Supplementary Note 14 hosts the erythrocyte/vascular-exposure control for the iron-handling coupling. Supplementary Note 15 hosts the empirical-null (random-module) control for the same coupling. Supplementary Table S20. Same-block Section 2 replication statistics (Moran’s I, spot-level correlations, and regional contrasts for the adjacent V1_Breast_Cancer_Block_A_Section_2; underlying files: section2_*.csv/json). References [64]–[123] are cited in the Supplementary Materials.
Funding
This work was supported by the Beijing Science and Technology Nova Program Interdisciplinary Project (20230484439) and the Beijing High-Level Public Health Technical Talents Project (2023-02-33). The funders had no role in study design, data collection, data analysis, data interpretation, or writing of the report.
Authors Contributions
C.S. conceived and supervised the study, curated the data, performed all analyses, and wrote the manuscript.
Ethics Approval and Consent to Participate. Not applicable
this study re-analyzed only publicly available, de-identified datasets; no new human material was collected, and institutional review-board approval and informed consent were not required.
Consent: for Publication
Not applicable.
Availability of Data and Materials
All datasets analyzed in this study are publicly available and were accessed under their original repository terms. The primary spatial metabolomics dataset is deposited at EBI MetaboLights under accession MTBLS273 [24]; the primary spatial transcriptomics dataset, V1_Breast_Cancer_Block_A_Section_1, is distributed by 10x Genomics under a Creative Commons Attribution 4.0 license; and the primary single-cell RNA sequencing dataset is available at the Gene Expression Omnibus (GEO) under accession GSE131907 [30]. The high-resolution validation layer re-analyzes three colorectal cancer 10x Visium HD sections (P1CRC/GSM8594567, P2CRC/GSM8594568, P5CRC/GSM8594569) deposited at GEO under accession GSE280318 ([21], Nature Genetics; doi:10.1038/s41588-025-02193-3). The cross-tumor replication layers re-analyze the hepatocellular carcinoma single-cell RNA sequencing dataset deposited at GEO under accession GSE140228 (droplet-based 10x UMI counts; [33], Cell; doi:10.1016/j.cell.2019.10.003) and the 10x Genomics Visium dataset Parent_Visium_Human_Glioblastoma (fresh-frozen human glioblastoma, whole-transcriptome analysis; distributed by 10x Genomics under its public dataset terms). The mitochondrial clonality analysis used publicly downloadable alignment files from the 10x Genomics melanoma dissociated-tumor-cell (DTC) dataset (sc5p_v2_hs_melanoma_10k, 5′ v2 chemistry) and three donors of the 10x Genomics 40k non-small-cell lung cancer (NSCLC) DTC mixture dataset (3′ HT v3.1, donor-level sample alignments). All secondary datasets used for cross-validation are listed with their accessions and host repositories in Supplementary Table S14. This study is a computational re-analysis of these public resources and generated no new experimental data. All analysis scripts, environment specifications, and intermediate results (per-pixel ion intensities, module scores, and test statistics as CSV/JSON files) are included as Supplementary Data accompanying this submission. Software names and versions required to re-execute every analysis are specified in Section 2 (Methods), and all tools used are freely available. The framework is fully scripted and uses public data only; end-to-end re-execution from the raw public downloads is possible with the deposited scripts and the pinned versions listed in Section 2.
Competing Interests
The author declares no competing interests.
References
- Cassetta, L.; Pollard, J.W. A timeline of tumour-associated macrophage biology. Nat. Rev. Cancer 2023, 23(4), 238–257. [Google Scholar] [CrossRef] [PubMed]
- Zhang, X.; Ji, L.; Li, M.O. Control of tumor-associated macrophage responses by nutrient acquisition and metabolism. Immunity 2023, 56(1), 14–31. [Google Scholar] [CrossRef] [PubMed]
- Tannahill, G.M.; Curtis, A.M.; Adamik, J.; et al. Succinate is an inflammatory signal that induces IL-1β through HIF-1α. Nature 2013, 496(7444), 238–242. [Google Scholar] [CrossRef] [PubMed]
- Mills, E.L.; Kelly, B.; Logan, A.; et al. Succinate Dehydrogenase Supports Metabolic Repurposing of Mitochondria to Drive Inflammatory Macrophages. Cell 2016, 167(2), 457–470.e13. [Google Scholar] [CrossRef] [PubMed]
- Vats, D.; Mukundan, L.; Odegaard, J.I.; et al. Oxidative metabolism and PGC-1beta attenuate macrophage-mediated inflammation. Cell Metab. 2006, 4(1), 13–24. [Google Scholar] [CrossRef] [PubMed]
- Huang, S.C.; Everts, B.; Ivanova, Y.; et al. Cell-intrinsic lysosomal lipolysis is essential for alternative activation of macrophages. Nat. Immunol. 2014, 15(9), 846–855. [Google Scholar] [CrossRef] [PubMed]
- Divakaruni, A.S.; Hsieh, W.Y.; Minarrieta, L.; et al. Etomoxir Inhibits Macrophage Polarization by Disrupting CoA Homeostasis. Cell Metab. 2018, 28(3), 490–503.e7. [Google Scholar] [CrossRef] [PubMed]
- Reinfeld, B.I.; Madden, M.Z.; Wolf, M.M.; et al. Cell-programmed nutrient partitioning in the tumour microenvironment. Nature 2021, 593(7858), 282–288. [Google Scholar] [CrossRef] [PubMed]
- Colegio, O.R.; Chu, N.Q.; Szabo, A.L.; et al. Functional polarization of tumour-associated macrophages by tumour-derived lactic acid. Nature 2014, 513(7519), 559–563. [Google Scholar] [CrossRef] [PubMed]
- Murray, P.J.; Allen, J.E.; Biswas, S.K.; et al. Macrophage activation and polarization: nomenclature and experimental guidelines. Immunity 2014, 41(1), 14–20. [Google Scholar] [CrossRef] [PubMed]
- Christofides, A.; Strauss, L.; Yeo, A.; Cao, C.; Charest, A.; Boussiotis, V.A. The complex role of tumor-infiltrating macrophages. Nat. Immunol. 2022, 23(8), 1148–1156. [Google Scholar] [CrossRef] [PubMed]
- Cheng, S.; Li, Z.; Gao, R.; et al. A pan-cancer single-cell transcriptional atlas of tumor infiltrating myeloid cells. Cell 2021, 184(3), 792–809.e23. [Google Scholar] [CrossRef] [PubMed]
- Bill, R.; Wirapati, P.; Messemaker, M.; et al. CXCL9:SPP1 macrophage polarity identifies a network of cellular programs that control human cancers. Science 2023, 381(6657), 515–524. [Google Scholar] [CrossRef] [PubMed]
- Carmona-Fontaine, C.; Deforet, M.; Akkari, L.; Thompson, C.B.; Joyce, J.A.; Xavier, J.B. Metabolic origins of spatial organization in the tumor microenvironment. Proc. Natl. Acad. Sci. U S A 2017, 114(11), 2934–2939. [Google Scholar] [CrossRef] [PubMed]
- Ma, X.; Fernández, F.M. Advances in mass spectrometry imaging for spatial cancer metabolomics. Mass Spectrom. Rev. 2024, 43(2), 235–268. [Google Scholar] [CrossRef] [PubMed]
- Ravi, V.M.; Will, P.; Kueckelhaus, J.; Sun, N.; Joseph, K.; Salié, H.; et al. Spatially resolved multi-omics deciphers bidirectional tumor-host interdependence in glioblastoma. Cancer Cell 2022, 40(6), 639–655.e13. [Google Scholar] [CrossRef] [PubMed]
- Han, R.; Chi, G.; Sun, D.; et al. Single-cell and spatial transcriptomics reveal lactylation-associated tumor cell clusters and define a prognostic risk model in glioblastoma. BMC Cancer 2025, 25(1), 1901. [Google Scholar] [CrossRef] [PubMed]
- Wu, H.; et al. Integrated spatial omics of metabolic reprogramming and the tumor microenvironment in pancreatic cancer. iScience 2025, 28(6), 112681. [Google Scholar] [CrossRef] [PubMed]
- Palmer, A.; Phapale, P.; Chernyavsky, I.; et al. FDR-controlled metabolite annotation for high-resolution imaging mass spectrometry. Nat. Methods 2017, 14, 57–60. [Google Scholar] [CrossRef] [PubMed]
- Sun, C.; et al. Spatially resolved multi-omics highlights cell-specific metabolic remodeling and interactions in gastric cancer. Nat. Commun. 2023, 14, 2692. [Google Scholar] [CrossRef] [PubMed]
- Oliveira, M.F.; Romero, J.P.; Chung, M.; Williams, S.R.; Gottscho, A.D.; Gupta, A.; Visium, HD Development; Team; Taylor, S.E.B.; et al. High-definition spatial transcriptomic profiling of immune cell populations in colorectal cancer. Nat. Genet. 2025, 57(6), 1512–1523. [Google Scholar] [CrossRef] [PubMed]
- Yang, Q.; Zhang, H.; Wei, T.; et al. Single-cell RNA sequencing reveals the heterogeneity of tumor-associated macrophage in non-small cell lung cancer and differences between sexes. Front Immunol. 2021, 12, 756722. [Google Scholar] [CrossRef] [PubMed]
- Liu, V.; et al. Clonal lineage tracing of innate immune cells in human cancer. Cancer Cell 2026, 44(7), 1509–1521.e4. [Google Scholar] [CrossRef] [PubMed]
- Guenther, S.; Muirhead, L.J.; Speller, A.V.M.; et al. Spatially resolved metabolic phenotyping of breast cancer by desorption electrospray ionization mass spectrometry. Cancer Res. 2015, 75(9), 1828–1837. [Google Scholar] [CrossRef] [PubMed]
- Mamedov, S. pyimzML (version 1.5.x). GitHub. 2024. Available online: https://github.com/alexandrovteam/pyimzML (accessed on August 2026).
- Wolf, F.A.; Angerer, P.; Theis, F.J. SCANPY: large-scale single-cell gene expression data analysis. Genome Biol. 2018, 19, 15. [Google Scholar] [CrossRef] [PubMed]
- Wagner, A.; Wang, C.; Fessler, J.; et al. Metabolic modeling of single Th17 cells reveals regulators of autoimmunity. Cell 2021, 184(16), 4168–4185.e21. [Google Scholar] [CrossRef] [PubMed]
- Alghamdi, N.; Chang, W.; Dang, P.; et al. A graph neural network model to estimate cell-wise metabolic flux using single-cell RNA-seq data. Genome Res. 2021, 31(10), 1867–1884. [Google Scholar] [CrossRef] [PubMed]
- Andreatta, M.; Carmona, S.J. UCell: robust and scalable single-cell gene signature scoring. Comput Struct. Biotechnol. J. 2021, 19, 3796–3798. [Google Scholar] [CrossRef] [PubMed]
- Kim, N.; Kim, H.K.; Lee, K.; et al. Single-cell RNA sequencing demonstrates the molecular and cellular reprogramming of metastatic lung adenocarcinoma. Nat. Commun. 2020, 11, 2285. [Google Scholar] [CrossRef] [PubMed]
- Xue, J.; Schmidt, S.V.; Sander, J.; et al. Transcriptome-based network analysis reveals a spectrum model of human macrophage activation. Immunity 2014, 40(2), 274–288. [Google Scholar] [CrossRef] [PubMed]
- Zheng, R.; Zhang, Y.; Tsuji, T.; et al. MEBOCOST maps metabolite-mediated intercellular communications using single-cell RNA-seq. Nucleic Acids Res. 2025, 53(12), gkaf569. [Google Scholar] [CrossRef] [PubMed]
- Zhang, Q.; He, Y.; Luo, N.; et al. Landscape and dynamics of single immune cells in hepatocellular carcinoma. Cell 2019, 179(4), 829–845.e20. [Google Scholar] [CrossRef] [PubMed]
- Alexander-Bloch, A.F.; Shou, H.; Liu, S.; et al. On testing for spatial correspondence between maps of human brain structure and function. Neuroimage 2018, 178, 540–551. [Google Scholar] [CrossRef] [PubMed]
- Clifford, P.; Richardson, S.; Hémon, D. Assessing the significance of the correlation between two spatial processes. Biometrics 1989, 45(1), 123–134. [Google Scholar] [CrossRef]
- Zimmerman, K.D.; Espeland, M.A.; Langefeld, C.D. A practical solution to pseudoreplication bias in single-cell studies. Nat. Commun. 2021, 12(1), 738. [Google Scholar] [CrossRef] [PubMed]
- Kawashima, M.; Tokiwa, M.; Nishimura, T.; et al. High-resolution imaging mass spectrometry combined with transcriptomic analysis identified a link between fatty acid composition of phosphatidylinositols and the immune checkpoint pathway at the primary tumour site of breast cancer. Br. J. Cancer 2020, 122(2), 245–257. [Google Scholar] [CrossRef] [PubMed]
- Zelenay, S.; et al. Cyclooxygenase-dependent tumor growth through evasion of immunity. Cell 2015, 162(6), 1257–1270. [Google Scholar] [CrossRef] [PubMed]
- Santiso, A.; Heinemann, A.; Kargl, J. Prostaglandin E2 in the tumor microenvironment, a convoluted affair mediated by EP receptors 2 and 4. Pharmacol. Rev. 2024, 76(3), 388–413. [Google Scholar] [CrossRef] [PubMed]
- Morotti, M.; et al. PGE2 inhibits TIL expansion by disrupting IL-2 signalling and mitochondrial function. Nature 2024, 629, 426–434. [Google Scholar] [CrossRef] [PubMed]
- Schaer, D.J.; Schulthess-Lutz, N.; Baselgia, L.; et al. Hemorrhage-activated NRF2 in tumor-associated macrophages drives cancer growth, invasion, and immunotherapy resistance. J. Clin. Invest. 2023, 134(3), e174528. [Google Scholar] [CrossRef] [PubMed]
- Nalio Ramos, R.; Missolo-Koussou, Y.; Gerber-Ferder, Y.; et al. Tissue-resident FOLR2+ macrophages associate with CD8+ T cell infiltration in human breast cancer. Cell 2022, 185(7), 1189–1207.e25. [Google Scholar] [CrossRef] [PubMed]
- Siddiqui, S.; Glauben, R. Fatty acid metabolism in myeloid-derived suppressor cells and tumor-associated macrophages: key factor in cancer immune evasion. Cancers 2022, 14(1), 250. [Google Scholar] [CrossRef] [PubMed]
- Leone, R.D.; Zhao, L.; Englert, J.M.; et al. Glutamine blockade induces divergent metabolic programs to overcome tumor immune evasion. Science 2019, 366(6468), 1013–1021. [Google Scholar] [CrossRef] [PubMed]
- Hezaveh, K.; Shinde, R.S.; Klötgen, A.; et al. Tryptophan-derived microbial metabolites activate the aryl hydrocarbon receptor in tumor-associated macrophages to suppress anti-tumor immunity. Immunity 2022, 55(2), 324–340.e8. [Google Scholar] [CrossRef] [PubMed]
- Kim, M.; Tomek, P. Tryptophan: a rheostat of cancer immune escape mediated by immunosuppressive enzymes IDO1 and TDO. Front Immunol. 2021, 12, 636081. [Google Scholar] [CrossRef] [PubMed]
- Su, P.; Wang, Q.; Bi, E.; et al. Enhanced Lipid Accumulation and Metabolism Are Required for the Differentiation and Activation of Tumor-Associated Macrophages. Cancer Res. 2020, 80(7), 1438–1450. [Google Scholar] [CrossRef] [PubMed]
- Wang, Y.; Chen, W.; Qiao, S.; Zou, H.; Yu, X.J.; Yang, Y.; et al. Lipid droplet accumulation mediates macrophage survival and Treg recruitment via the CCL20/CCR6 axis in human hepatocellular carcinoma. Cell Mol. Immunol. 2024, 21(10), 1120–1130. [Google Scholar] [CrossRef] [PubMed]
- Corna, G.; Campana, L.; Pignatti, E.; et al. Polarization dictates iron handling by inflammatory and alternatively activated macrophages. Haematologica 2010, 95(11), 1814–1822. [Google Scholar] [CrossRef] [PubMed]
- Vinchi, F.; Vance, S.Z. Reshaping erythrophagocytosis and iron recycling by reticuloendothelial macrophages. HemaSphere 2021, 5(2), e525. [Google Scholar] [CrossRef] [PubMed]
- DeRosa, A.; et al. The Iron Curtain: Macrophages at the Interface of Systemic and Microenvironmental Iron Metabolism and Immune Response in Cancer. Front Immunol. 2021, 12, 614294. [Google Scholar] [CrossRef] [PubMed]
- Duan, X.; He, K.; Li, J.; et al. Tumor associated macrophages deliver iron to tumor cells via Lcn2. Int. J. Physiol. Pathophysiol. Pharmacol. 2018, 10(2), 105–114. [Google Scholar] [PubMed]
- Sattiraju, A.; et al. Hypoxic niches attract and sequester tumor-associated macrophages and cytotoxic T cells and reprogram them for immunosuppression. Immunity 2023, 56(8), 1825–1843.e6. [Google Scholar] [CrossRef] [PubMed]
- Mil, J.; Soto, J.A.; Krall, A.S.; et al. Metabolic atlas of early human cortex reveals glycolytic remodeling and pentose phosphate pathway control of cell fate transitions. Cell 2026. [Google Scholar] [CrossRef] [PubMed]
- Ludwig, L.S.; Lareau, C.A.; Ulirsch, J.C.; et al. Lineage tracing in humans enabled by mitochondrial mutations and single-cell genomics. Cell 2019, 176(6), 1325–1339.e22. [Google Scholar] [CrossRef] [PubMed]
- Lareau, C.A.; Ludwig, L.S.; Muus, C.; et al. Massively parallel single-cell mitochondrial DNA genotyping and chromatin profiling. Nat. Biotechnol. 2021, 39(4), 451–461. [Google Scholar] [CrossRef] [PubMed]
- Miller, T.E.; Lareau, C.A.; Verga, J.A.; et al. Mitochondrial variant enrichment from high-throughput single-cell RNA sequencing resolves clonal populations. Nat. Biotechnol. 2022, 40(7), 1030–1034. [Google Scholar] [CrossRef] [PubMed]
- Belk, J.A.; et al. Somatic mutations reveal the ontogeny of microglia in human aging. Nature Epub ahead of print. 2026. [Google Scholar] [CrossRef] [PubMed]
- Mantovani, A.; Allavena, P.; Marchesi, F.; Garlanda, C. Macrophages as tools and targets in cancer therapy. Nat. Rev. Drug Discov. 2022, 21(11), 799–820. [Google Scholar] [CrossRef] [PubMed]
- Liu, Q.; Feng, C.; et al. Hypoxia-driven remodeling of SELENOP+ macrophages shapes T cell dynamics and promotes ovarian cancer metastasis. Nat. Commun. 2026, 17, 1097. [Google Scholar] [CrossRef] [PubMed]
- Openshaw, S. The modifiable areal unit problem. In Concepts and Techniques in Modern Geography No. 38.; Geo Books: Norwich, 1984. [Google Scholar]
- Neal, J.T.; Li, X.; Zhu, J.; et al. Organoid modeling of the tumor immune microenvironment. Cell 2018, 175(7), 1972–1988.e16. [Google Scholar] [CrossRef] [PubMed]
- Folkert, I.W.; Molina Arocho, W.A.; To, T.K.J.; et al. An iron-rich subset of macrophages promotes tumor growth through a Bach1-Ednrb axis. J. Exp. Med. 2024, 221(10), e20230420. [Google Scholar] [CrossRef] [PubMed]
- Mills, E.L.; Ryan, D.G.; Prag, H.A.; et al. Itaconate is an anti-inflammatory metabolite that activates Nrf2 via alkylation of KEAP1. Nature 2018, 556(7699), 113–117. [Google Scholar] [CrossRef] [PubMed]
- Chang, C.H.; Qiu, J.; O’Sullivan, D.; et al. Metabolic Competition in the Tumor Microenvironment Is a Driver of Cancer Progression. Cell 2015, 162(6), 1229–1241. [Google Scholar] [CrossRef] [PubMed]
- Chen, P.; Zuo, H.; Xiong, H.; Kolar, M.J.; Chu, Q.; Saghatelian, A.; et al. Gpr132 sensing of lactate mediates tumor-macrophage interplay to promote breast cancer metastasis. Proc. Natl. Acad. Sci. U S A 2017, 114(3), 580–585. [Google Scholar] [CrossRef] [PubMed]
- Zhang, D.; Tang, Z.; Huang, H.; Zhou, G.; Cui, C.; Weng, Y.; et al. Metabolic regulation of gene expression by histone lactylation. Nature 2019, 574(7779), 575–580. [Google Scholar] [CrossRef] [PubMed]
- Zilionis, R.; Engblom, C.; Pfirschke, C.; et al. Single-cell transcriptomics of human and mouse lung cancers reveals conserved myeloid populations across individuals and species. Immunity 2019, 50(5), 1317–1334.e10. [Google Scholar] [CrossRef] [PubMed]
- Oetjen, J.; Veselkov, K.; Watrous, J.; et al. Benchmark datasets for 3D MALDI- and DESI-imaging mass spectrometry. GigaScience 2015, 4, 20. [Google Scholar] [CrossRef] [PubMed]
- Inglese, P.; McKenzie, J.S.; Mroz, A.; et al. Deep learning and 3D-DESI imaging reveal the hidden metabolic heterogeneity of cancer. Chem. Sci. 2017, 8(5), 3500–3511. [Google Scholar] [CrossRef] [PubMed]
- Tu, A.; Said, N.; Muddiman, D.C. Spatially resolved metabolomic characterization of muscle invasive bladder cancer by mass spectrometry imaging. Metabolomics 2021, 17(8), 70. [Google Scholar] [CrossRef] [PubMed]
- Schwaiger-Haber, M.; Stancliffe, E.; Anbukumar, D.S.; et al. Using mass spectrometry imaging to map fluxes quantitatively in the tumor ecosystem. Nat. Commun. 2023, 14(1), 2876. [Google Scholar] [CrossRef] [PubMed]
- Liu, G.; Yao, X.; Hou, Y.; et al. Metabolomic and transcriptomic profiling of HNSCC identifies AMIGO2 as a therapeutic target modulating tumor microenvironment. npj Precis Oncol. 2025, 9(1), 358. [Google Scholar] [CrossRef] [PubMed]
- Ji, A.L.; Rubin, A.J.; Thrane, K.; et al. Multimodal analysis of composition and spatial architecture in human squamous cell carcinoma. Cell 2020, 182(2), 497–514.e22. [Google Scholar] [CrossRef] [PubMed]
- Wu, S.Z.; Al-Eryani, G.; Roden, D.L.; et al. A single-cell and spatially resolved atlas of human breast cancers. Nat. Genet. 2021, 53(9), 1334–1347. [Google Scholar] [CrossRef] [PubMed]
- Pelka, K.; Hofree, M.; Chen, J.H.; et al. Spatially organized multicellular immune hubs in human colorectal cancer. Cell 2021, 184(18), 4734–4752.e20. [Google Scholar] [CrossRef] [PubMed]
- Yang, P.; Qin, H.; Li, Y.; Xiao, A.; Zheng, E.; Zeng, H.; et al. CD36-mediated metabolic crosstalk between tumor cells and macrophages affects liver metastasis. Nat. Commun. 2022, 13, 5782. [Google Scholar] [CrossRef] [PubMed]
- Margulis, K.; Chiou, A.S.; Aasi, S.Z.; Tibshirani, R.J.; Tang, J.Y.; Zare, R.N. Distinguishing malignant from benign microscopic skin lesions using desorption electrospray ionization mass spectrometry imaging. Proc. Natl. Acad. Sci. USA 2018, 115(25), 6347–6352. [Google Scholar] [CrossRef] [PubMed]
- Prima, V.; Kaliberova, L.N.; Kaliberov, S.; Curiel, D.T.; Kusmartsev, S. COX2/mPGES1/PGE2 pathway regulates PD-L1 expression in tumor-associated macrophages and myeloid-derived suppressor cells. Proc. Natl. Acad. Sci. USA 2017, 114(5), 1117–1122. [Google Scholar] [CrossRef] [PubMed]
- Kersten, K.; Hu, K.H.; Combes, A.J.; et al. Spatiotemporal co-dependency between macrophages and exhausted CD8+ T cells in cancer. Cancer Cell 2022, 40(6), 624–638.e9. [Google Scholar] [CrossRef] [PubMed]
- Masetti, M.; Carriero, R.; Portale, F.; Marelli, G.; Morina, N.; Pandini, M.; et al. Lipid-loaded tumor-associated macrophages sustain tumor growth and invasiveness in prostate cancer. J. Exp. Med. 2022, 219(2), e20210564. [Google Scholar] [CrossRef] [PubMed]
- Mills, C.D.; Kincaid, K.; Alt, J.M.; Heilman, M.J.; Hill, A.M. M-1/M-2 macrophages and the Th1/Th2 paradigm. J. Immunol. 2000, 164(12), 6166–6173. [Google Scholar] [CrossRef] [PubMed]
- Halaby, M.J.; McGaha, T.L. Amino acid transport and metabolism in myeloid function. Front Immunol. 2021, 12, 695238. [Google Scholar] [CrossRef] [PubMed]
- Rodriguez, P.C.; Quiceno, D.G.; Zabaleta, J.; et al. Arginase I production in the tumor microenvironment by mature myeloid cells inhibits T-cell receptor expression and antigen-specific T-cell responses. Cancer Res. 2004, 64(16), 5839–5849. [Google Scholar] [CrossRef] [PubMed]
- Bronte, V.; Serafini, P.; De Santo, C.; et al. IL-4-induced arginase 1 suppresses alloreactive T cells in tumor-bearing mice. J. Immunol. 2003, 170(1), 270–278. [Google Scholar] [CrossRef] [PubMed]
- Zea, A.H.; Rodriguez, P.C.; Atkins, M.B.; et al. Arginase-producing myeloid suppressor cells in renal cell carcinoma patients: a mechanism of tumor evasion. Cancer Res. 2005, 65(8), 3044–3048. [Google Scholar] [CrossRef] [PubMed]
- Geiger, R.; Rieckmann, J.C.; Wolf, T.; et al. L-Arginine modulates T cell metabolism and enhances survival and anti-tumor activity. Cell 2016, 167(3), 829–842.e13. [Google Scholar] [CrossRef] [PubMed]
- Jha, A.K.; Huang, S.C.; Sergushichev, A.; et al. Network integration of parallel metabolic and transcriptional data reveals metabolic modules that regulate macrophage polarization. Immunity 2015, 42(3), 419–430. [Google Scholar] [CrossRef] [PubMed]
- Liu, P.S.; Wang, H.; Li, X.; et al. α-ketoglutarate orchestrates macrophage activation through metabolic and epigenetic reprogramming. Nat. Immunol. 2017, 18(9), 985–994. [Google Scholar] [CrossRef] [PubMed]
- Palmieri, E.M.; Menga, A.; Martín-Pérez, R.; et al. Pharmacologic or genetic targeting of glutamine synthetase skews macrophages toward an M1-like phenotype and inhibits tumor metastasis. Cell Rep. 2017, 20(7), 1654–1666. [Google Scholar] [CrossRef] [PubMed]
- Oh, M.H.; Sun, I.H.; Zhao, L.; et al. Targeting glutamine metabolism enhances tumor-specific immunity by modulating suppressive myeloid cells. J. Clin. Invest. 2020, 130(7), 3865–3884. [Google Scholar] [CrossRef] [PubMed]
- Pan, M.; Reid, M.A.; Lowman, X.H.; et al. Regional glutamine deficiency in tumours promotes dedifferentiation through inhibition of histone demethylation. Nat. Cell Biol. 2016, 18(10), 1090–1101. [Google Scholar] [CrossRef] [PubMed]
- Munn, D.H.; Shafizadeh, E.; Attwood, J.T.; Bondarev, I.; Pashine, A.; Mellor, A.L. Inhibition of T cell proliferation by macrophage tryptophan catabolism. J. Exp. Med. 1999, 189(9), 1363–1372. [Google Scholar] [CrossRef] [PubMed]
- Munn, D.H.; Sharma, M.D.; Baban, B.; et al. GCN2 kinase in T cells mediates proliferative arrest and anergy induction in response to indoleamine 2,3-dioxygenase. Immunity 2005, 22(5), 633–642. [Google Scholar] [CrossRef] [PubMed]
- Frumento, G.; Rotondo, R.; Tonetti, M.; Damonte, G.; Benatti, U.; Ferrara, G.B. Tryptophan-derived catabolites are responsible for inhibition of T and natural killer cell proliferation induced by indoleamine 2,3-dioxygenase. J. Exp. Med. 2002, 196(4), 459–468. [Google Scholar] [CrossRef] [PubMed]
- Opitz, C.A.; Litzenburger, U.M.; Sahm, F.; et al. An endogenous tumour-promoting ligand of the human aryl hydrocarbon receptor. Nature 2011, 478(7368), 197–203. [Google Scholar] [CrossRef] [PubMed]
- Campesato, L.F.; Budhu, S.; Tchaicha, J.; et al. Blockade of the AHR restricts a Treg-macrophage suppressive axis induced by L-kynurenine. Nat. Commun. 2020, 11(1), 4011. [Google Scholar] [CrossRef] [PubMed]
- Takenaka, M.C.; Gabriely, G.; Rothhammer, V.; et al. Control of tumor-associated macrophages and T cells in glioblastoma via AHR and CD39. Nat. Neurosci. 2019, 22(5), 729–740. [Google Scholar] [CrossRef] [PubMed]
- Friedrich, M.; Sankowski, R.; Bunse, L.; et al. Tryptophan metabolism drives dynamic immunosuppressive myeloid states in IDH-mutant gliomas. Nat. Cancer 2021, 2(7), 723–740. [Google Scholar] [CrossRef] [PubMed]
- Sadik, A.; Somarribas Patterson, L.F.; Öztürk, S.; et al. IL4I1 is a metabolic immune checkpoint that activates the AHR and promotes tumor progression. Cell 2020, 182(5), 1252–1270.e34. [Google Scholar] [CrossRef] [PubMed]
- Rodriguez, A.E.; Ducker, G.S.; Billingham, L.K.; et al. Serine metabolism supports macrophage IL-1β production. Cell Metab. 2019, 29(4), 1003–1011.e4. [Google Scholar] [CrossRef] [PubMed]
- Yu, W.; Wang, Z.; Zhang, K.; et al. One-carbon metabolism supports S-adenosylmethionine and histone methylation to drive inflammatory macrophages. Mol. Cell 2019, 75(6), 1147–1160.e5. [Google Scholar] [CrossRef] [PubMed]
- Bian, Y.; Li, W.; Kremer, D.M.; et al. Cancer SLC43A2 alters T cell methionine metabolism and histone methylation. Nature 2020, 585(7824), 277–282. [Google Scholar] [CrossRef] [PubMed]
- Thumkeo, D.; et al. PGE2-EP2/EP4 signaling elicits immunosuppression by driving the mregDC-Treg axis in inflammatory tumor microenvironment. Cell Rep. 2022, 39(10), 110914. [Google Scholar] [CrossRef] [PubMed]
- Hong, D.S.; et al. First-in-human phase I study of immunomodulatory E7046, an antagonist of PGE2-receptor E-type 4 (EP4), in patients with advanced cancers. J. Immunother. Cancer 2020, 8(1), e000222. [Google Scholar] [CrossRef] [PubMed]
- Goossens, P.; Rodriguez-Vita, J.; Etzerodt, A.; Masse, M.; Rastoin, O.; Gouirand, V.; et al. Membrane cholesterol efflux drives tumor-associated macrophage reprogramming and tumor progression. Cell Metab. 2019, 29(6), 1376–1389.e4. [Google Scholar] [CrossRef] [PubMed]
- Wang, S.; Yan, W.; Kong, L.; Zuo, S.; Wu, J.; Zhu, C.; et al. Oncolytic viruses engineered to enforce cholesterol efflux restore tumor-associated macrophage phagocytosis and anti-tumor immunity in glioblastoma. Nat. Commun. 2023, 14, 4367. [Google Scholar] [CrossRef] [PubMed]
- Xiao, J.; et al. 25-Hydroxycholesterol regulates lysosome AMP kinase activation and metabolic reprogramming to educate immunosuppressive macrophages. Immunity 2024, 57(5), 1087–1104.e7. [Google Scholar] [CrossRef] [PubMed]
- Mertens, C.; Akam, E.A.; Rehwald, C.; Brüne, B.; Tomat, E.; Jung, M. Intracellular iron chelation modulates the macrophage iron phenotype with consequences on tumor progression. PLoS ONE 2016, 11(11), e0166164. [Google Scholar] [CrossRef] [PubMed]
- Costa da Silva, M.; et al. Iron induces anti-tumor activity in tumor-associated macrophages. Front Immunol. 2017, 8, 1479. [Google Scholar] [CrossRef] [PubMed]
- Kim, R.; Hashimoto, A.; Markosyan, N.; Tyurin, V.A.; Tyurina, Y.Y.; Kar, G.; et al. Ferroptosis of tumour neutrophils causes immune suppression in cancer. Nature 2022, 612(7939), 338–346. [Google Scholar] [CrossRef] [PubMed]
- Liu, T.; et al. Ferroptosis, as the most enriched programmed cell death process in glioma, induces immunosuppression and immunotherapy resistance. Neuro Oncol. 2022, 24(7), 1113–1125. [Google Scholar] [CrossRef] [PubMed]
- Wu, Y.; Yang, S.; Ma, J.; et al. Spatiotemporal Immune Landscape of Colorectal Cancer Liver Metastasis at Single-Cell Level. Cancer Discov. 2022, 12(1), 134–153. [Google Scholar] [CrossRef] [PubMed]
- Casanova-Acebes, M.; Dalla, E.; Leader, A.M.; et al. Tissue-resident macrophages provide a pro-tumorigenic niche to early NSCLC cells. Nature 2021, 595(7868), 578–584. [Google Scholar] [CrossRef] [PubMed]
- Wenes, M.; Shang, M.; Di Matteo, M.; et al. Macrophage Metabolism Controls Tumor Blood Vessel Morphogenesis and Metastasis. Cell Metab. 2016, 24(5), 701–715. [Google Scholar] [CrossRef] [PubMed]
- Jeong, H.; Kim, S.; Hong, B.J.; et al. Tumor-Associated Macrophages Enhance Tumor Hypoxia and Aerobic Glycolysis. Cancer Res. 2019, 79(4), 795–806. [Google Scholar] [CrossRef] [PubMed]
- Vadevoo, S.M.P.; et al. The macrophage odorant receptor Olfr78 mediates the lactate-induced M2 phenotype of tumor-associated macrophages. Proc. Natl. Acad. Sci. U S A 2021, 118(37), e2102434118. [Google Scholar] [CrossRef] [PubMed]
- Yang, K.; Xu, J.; Fan, M.; Tu, F.; Wang, X.; Ha, T.; et al. Lactate Suppresses Macrophage Pro-Inflammatory Response to LPS Stimulation by Inhibition of YAP and NF-κB Activation via GPR81-Mediated Signaling. Front Immunol. 2020, 11, 587913. [Google Scholar] [CrossRef] [PubMed]
- Errea, A.; Cayet, D.; Marchetti, P.; Tang, C.; Kluza, J.; Offermanns, S.; et al. Lactate inhibits the pro-inflammatory response and metabolic reprogramming in murine macrophages in a GPR81-independent manner. PLoS ONE 2016, 11(11), e0163694. [Google Scholar] [CrossRef] [PubMed]
- Apostolova, P.; Pearce, E.L. Lactic acid and lactate: revisiting the physiological roles in the tumor microenvironment. Trends Immunol. 2022, 43(12), 969–977. [Google Scholar] [CrossRef] [PubMed]
- Clifton, K.; Anant, M.; Aihara, G.; et al. STalign: Alignment of spatial transcriptomics data using diffeomorphic metric mapping. Nat. Commun. 2023, 14, 8123. [Google Scholar] [CrossRef] [PubMed]
- Deng, H.; Ning, X.; Lin, X.; et al. SMIntegration: A web tool for comprehensive spatial metabolomics and transcriptomics integrated analysis and visualization. GigaScience 2026, 15, giag033. [Google Scholar] [CrossRef] [PubMed]
- Causer, A.; Lu, T.; Kriel, J.; et al. SpaMTP: integrative statistical analysis and visualization of spatial metabolomics and transcriptomics data. Nat. Methods 2026, 23(8), 1501–1506. [Google Scholar] [CrossRef] [PubMed]
- Vandereyken, K.; Sifrim, A.; Thienpont, B.; Voet, T. Methods and applications for single-cell and spatial multi-omics. Nat. Rev. Genet. 2023, 24(8), 494–515. [Google Scholar] [CrossRef] [PubMed]
- Li, X.; Yang, Y.; Zhang, B.; et al. Lactate metabolism in human health and disease. Signal Transduct. Target Ther. 2022, 7(1), 305. [Google Scholar] [CrossRef] [PubMed]
- Chen, L.; Huang, L.; Gu, Y.; et al. Lactate-lactylation hands between metabolic reprogramming and immunosuppression. Int. J. Mol. Sci. 2022, 23(19), 11943. [Google Scholar] [CrossRef] [PubMed]
Figure 1.
Schematic overview of the multi-layer public-data re-analysis framework. Layer 1 (spatial metabolomics): DESI-MSI re-analysis of MetaboLights MTBLS273 yields per-pixel lipid distributions and spatial statistics. Layer 2 (spatial transcriptomics): TAM and metabolic gene modules are scored on a 10x Visium breast cancer section and tested for spatial autocorrelation, spot-level correlation, and regional divergence. Layer 3 (single-cell inference): myeloid cells of GSE131907 are re-clustered into TAM subsets and scored for nine metabolic pathways. Arrows denote the cross-validation logic: convergent signals across independent modalities and cohorts are taken as validated TAM metabolic programs. This panel is a workflow schematic; it contains no measured data. All datasets are publicly downloadable and all tools are free and open-source; every accession carries a recorded verification tier.
Figure 1.
Schematic overview of the multi-layer public-data re-analysis framework. Layer 1 (spatial metabolomics): DESI-MSI re-analysis of MetaboLights MTBLS273 yields per-pixel lipid distributions and spatial statistics. Layer 2 (spatial transcriptomics): TAM and metabolic gene modules are scored on a 10x Visium breast cancer section and tested for spatial autocorrelation, spot-level correlation, and regional divergence. Layer 3 (single-cell inference): myeloid cells of GSE131907 are re-clustered into TAM subsets and scored for nine metabolic pathways. Arrows denote the cross-validation logic: convergent signals across independent modalities and cohorts are taken as validated TAM metabolic programs. This panel is a workflow schematic; it contains no measured data. All datasets are publicly downloadable and all tools are free and open-source; every accession carries a recorded verification tier.
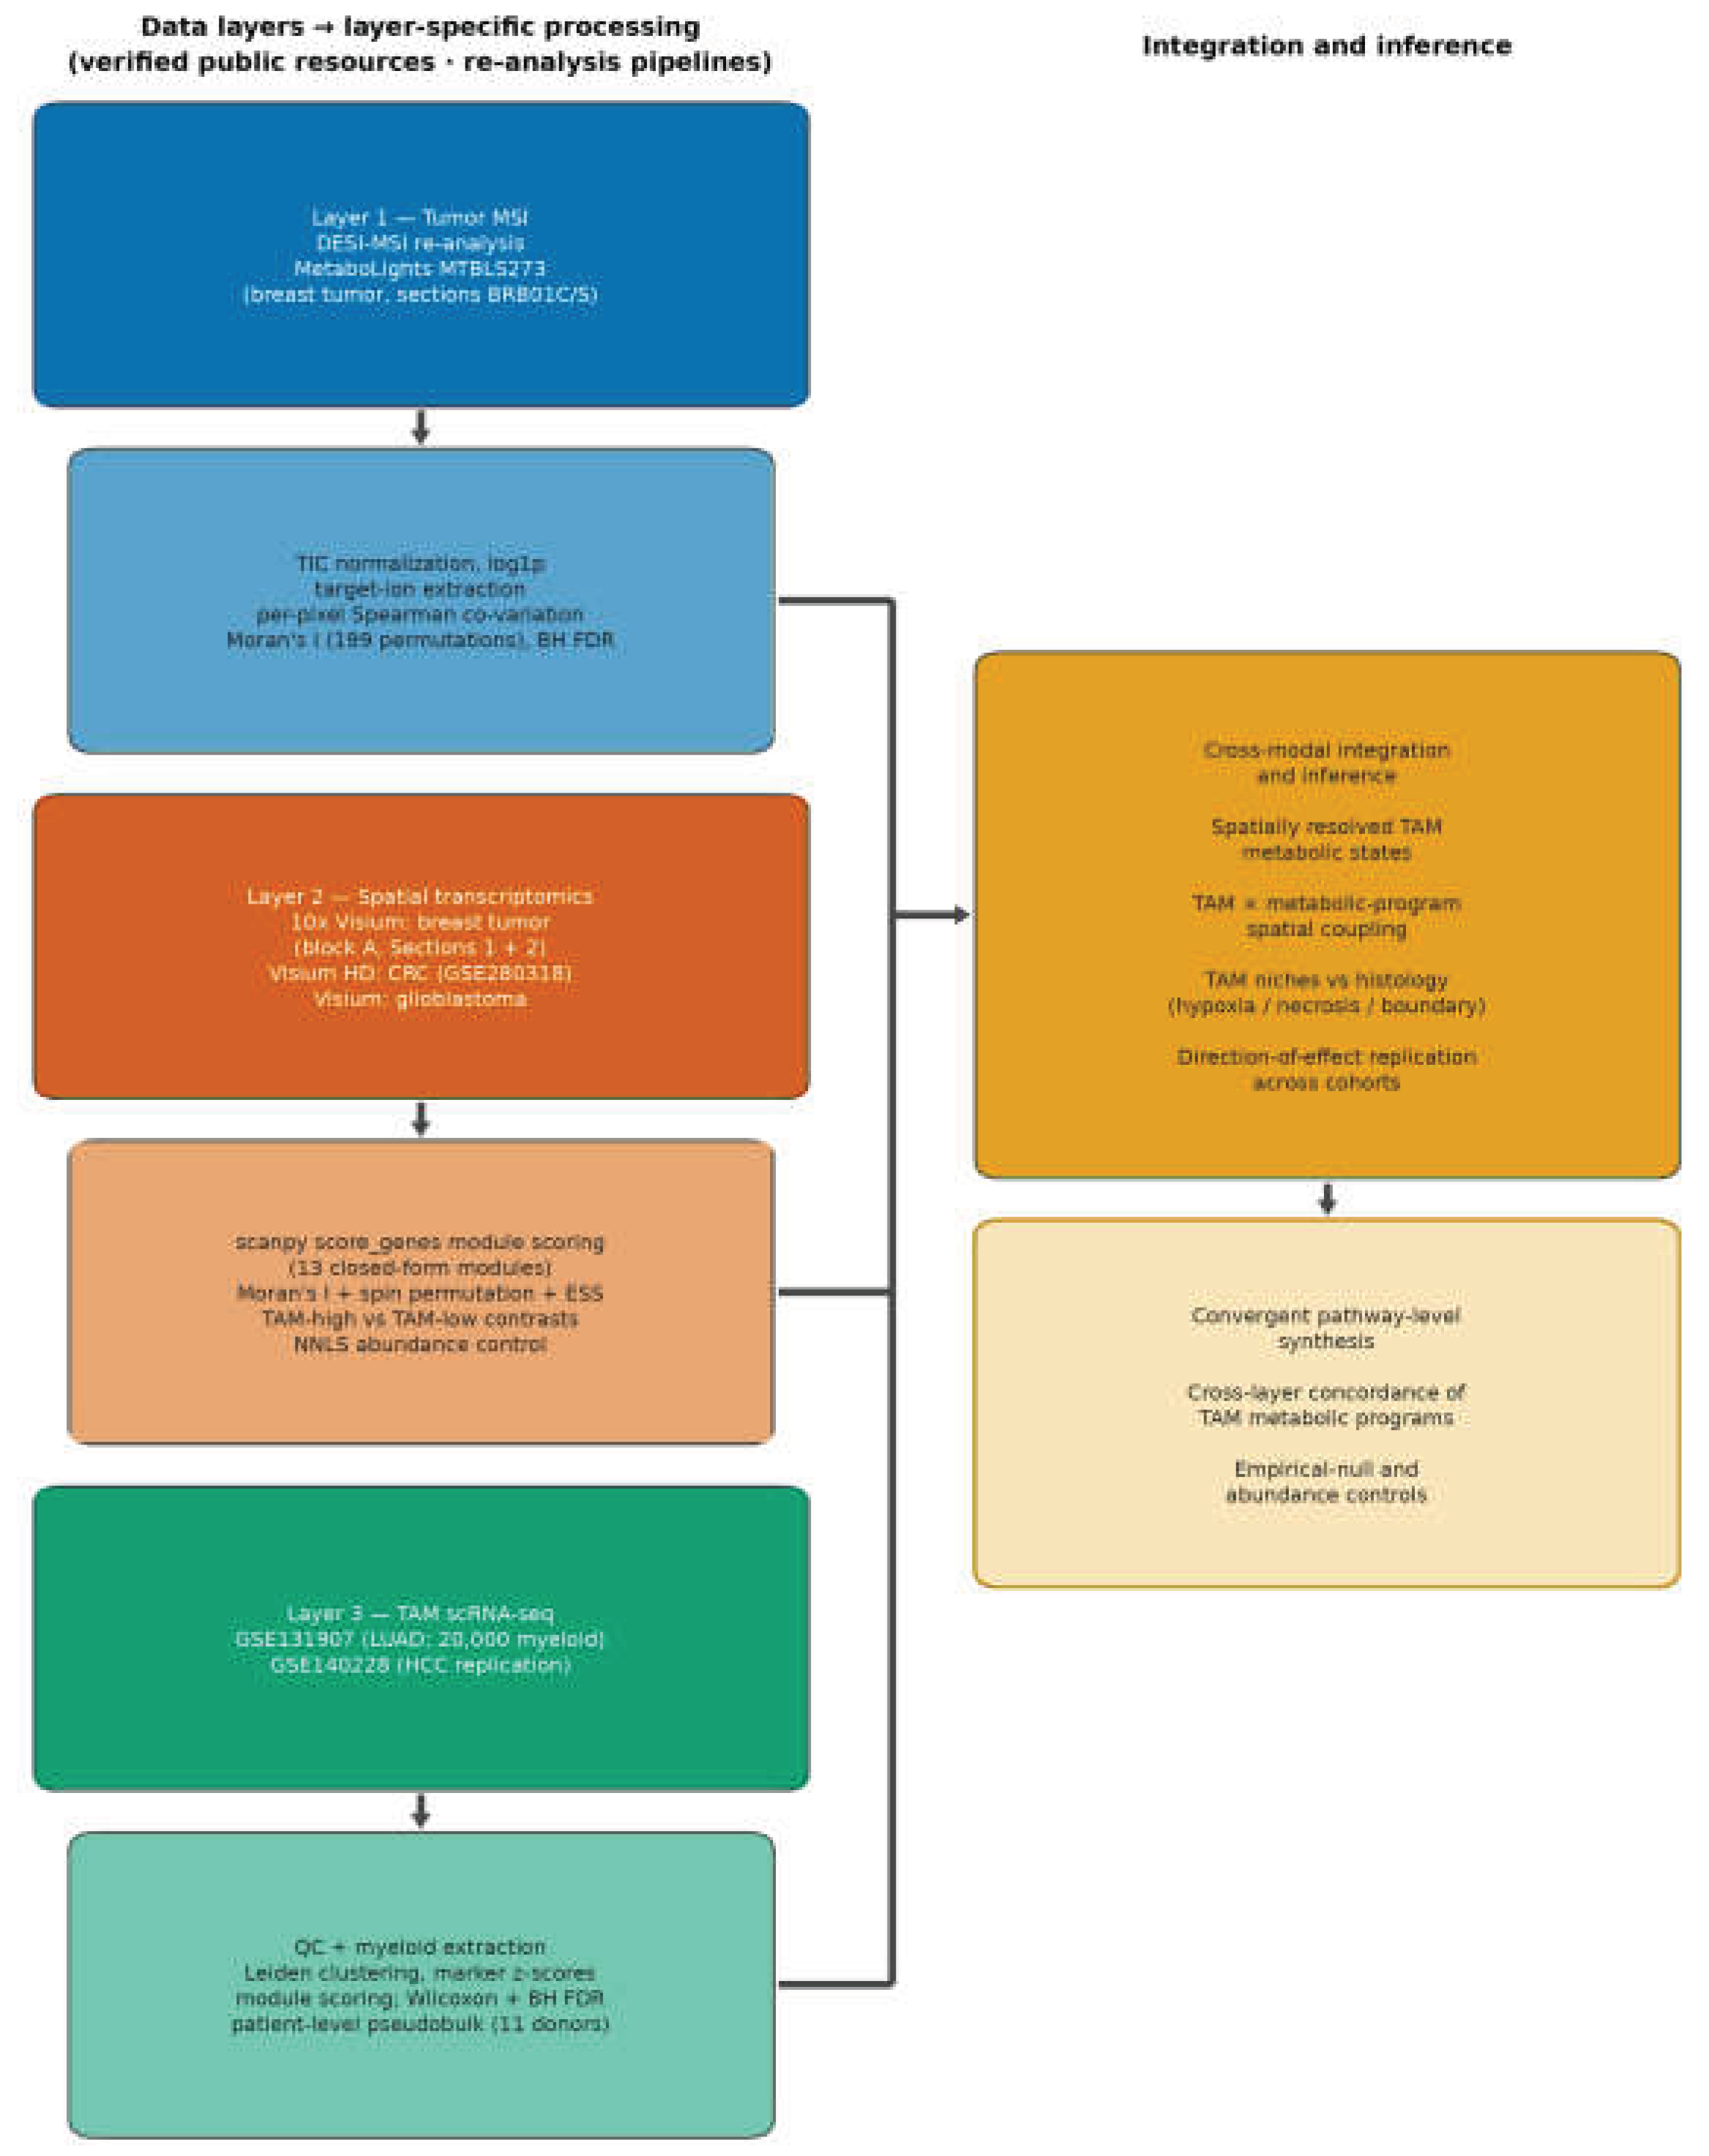
Figure 2.
Spatial metabolomics of breast tumor MTBLS273 (DESI-MSI). (a–d) Ion images of four lipid mediators in section BRB01S: (a) arachidonate (FA20:4, m/z 303.23), the prostaglandin precursor; (b) phosphatidylinositol PI 38:4 (m/z 885.55), its membrane reservoir; (c) the m/z 744.56 phospholipid; (d) palmitate (FA16:0, m/z 255.23). (e) Per-pixel Spearman co-variation of arachidonate and PI 38:4 across sections BRB01C and BRB01S (log1p TIC-normalized intensities, points colored by section; pooled ρ = 0.90). (f) Moran’s I of the eight-ion lipid panel in both sections (all p ≤ 0.005, 199 permutations). (g) Stratified robustness of the arachidonate × PI 38:4 correlation across sections and detection strata (ρ = 0.764–0.944; panel statistics in Supplementary Table S13).
Figure 2.
Spatial metabolomics of breast tumor MTBLS273 (DESI-MSI). (a–d) Ion images of four lipid mediators in section BRB01S: (a) arachidonate (FA20:4, m/z 303.23), the prostaglandin precursor; (b) phosphatidylinositol PI 38:4 (m/z 885.55), its membrane reservoir; (c) the m/z 744.56 phospholipid; (d) palmitate (FA16:0, m/z 255.23). (e) Per-pixel Spearman co-variation of arachidonate and PI 38:4 across sections BRB01C and BRB01S (log1p TIC-normalized intensities, points colored by section; pooled ρ = 0.90). (f) Moran’s I of the eight-ion lipid panel in both sections (all p ≤ 0.005, 199 permutations). (g) Stratified robustness of the arachidonate × PI 38:4 correlation across sections and detection strata (ρ = 0.764–0.944; panel statistics in Supplementary Table S13).
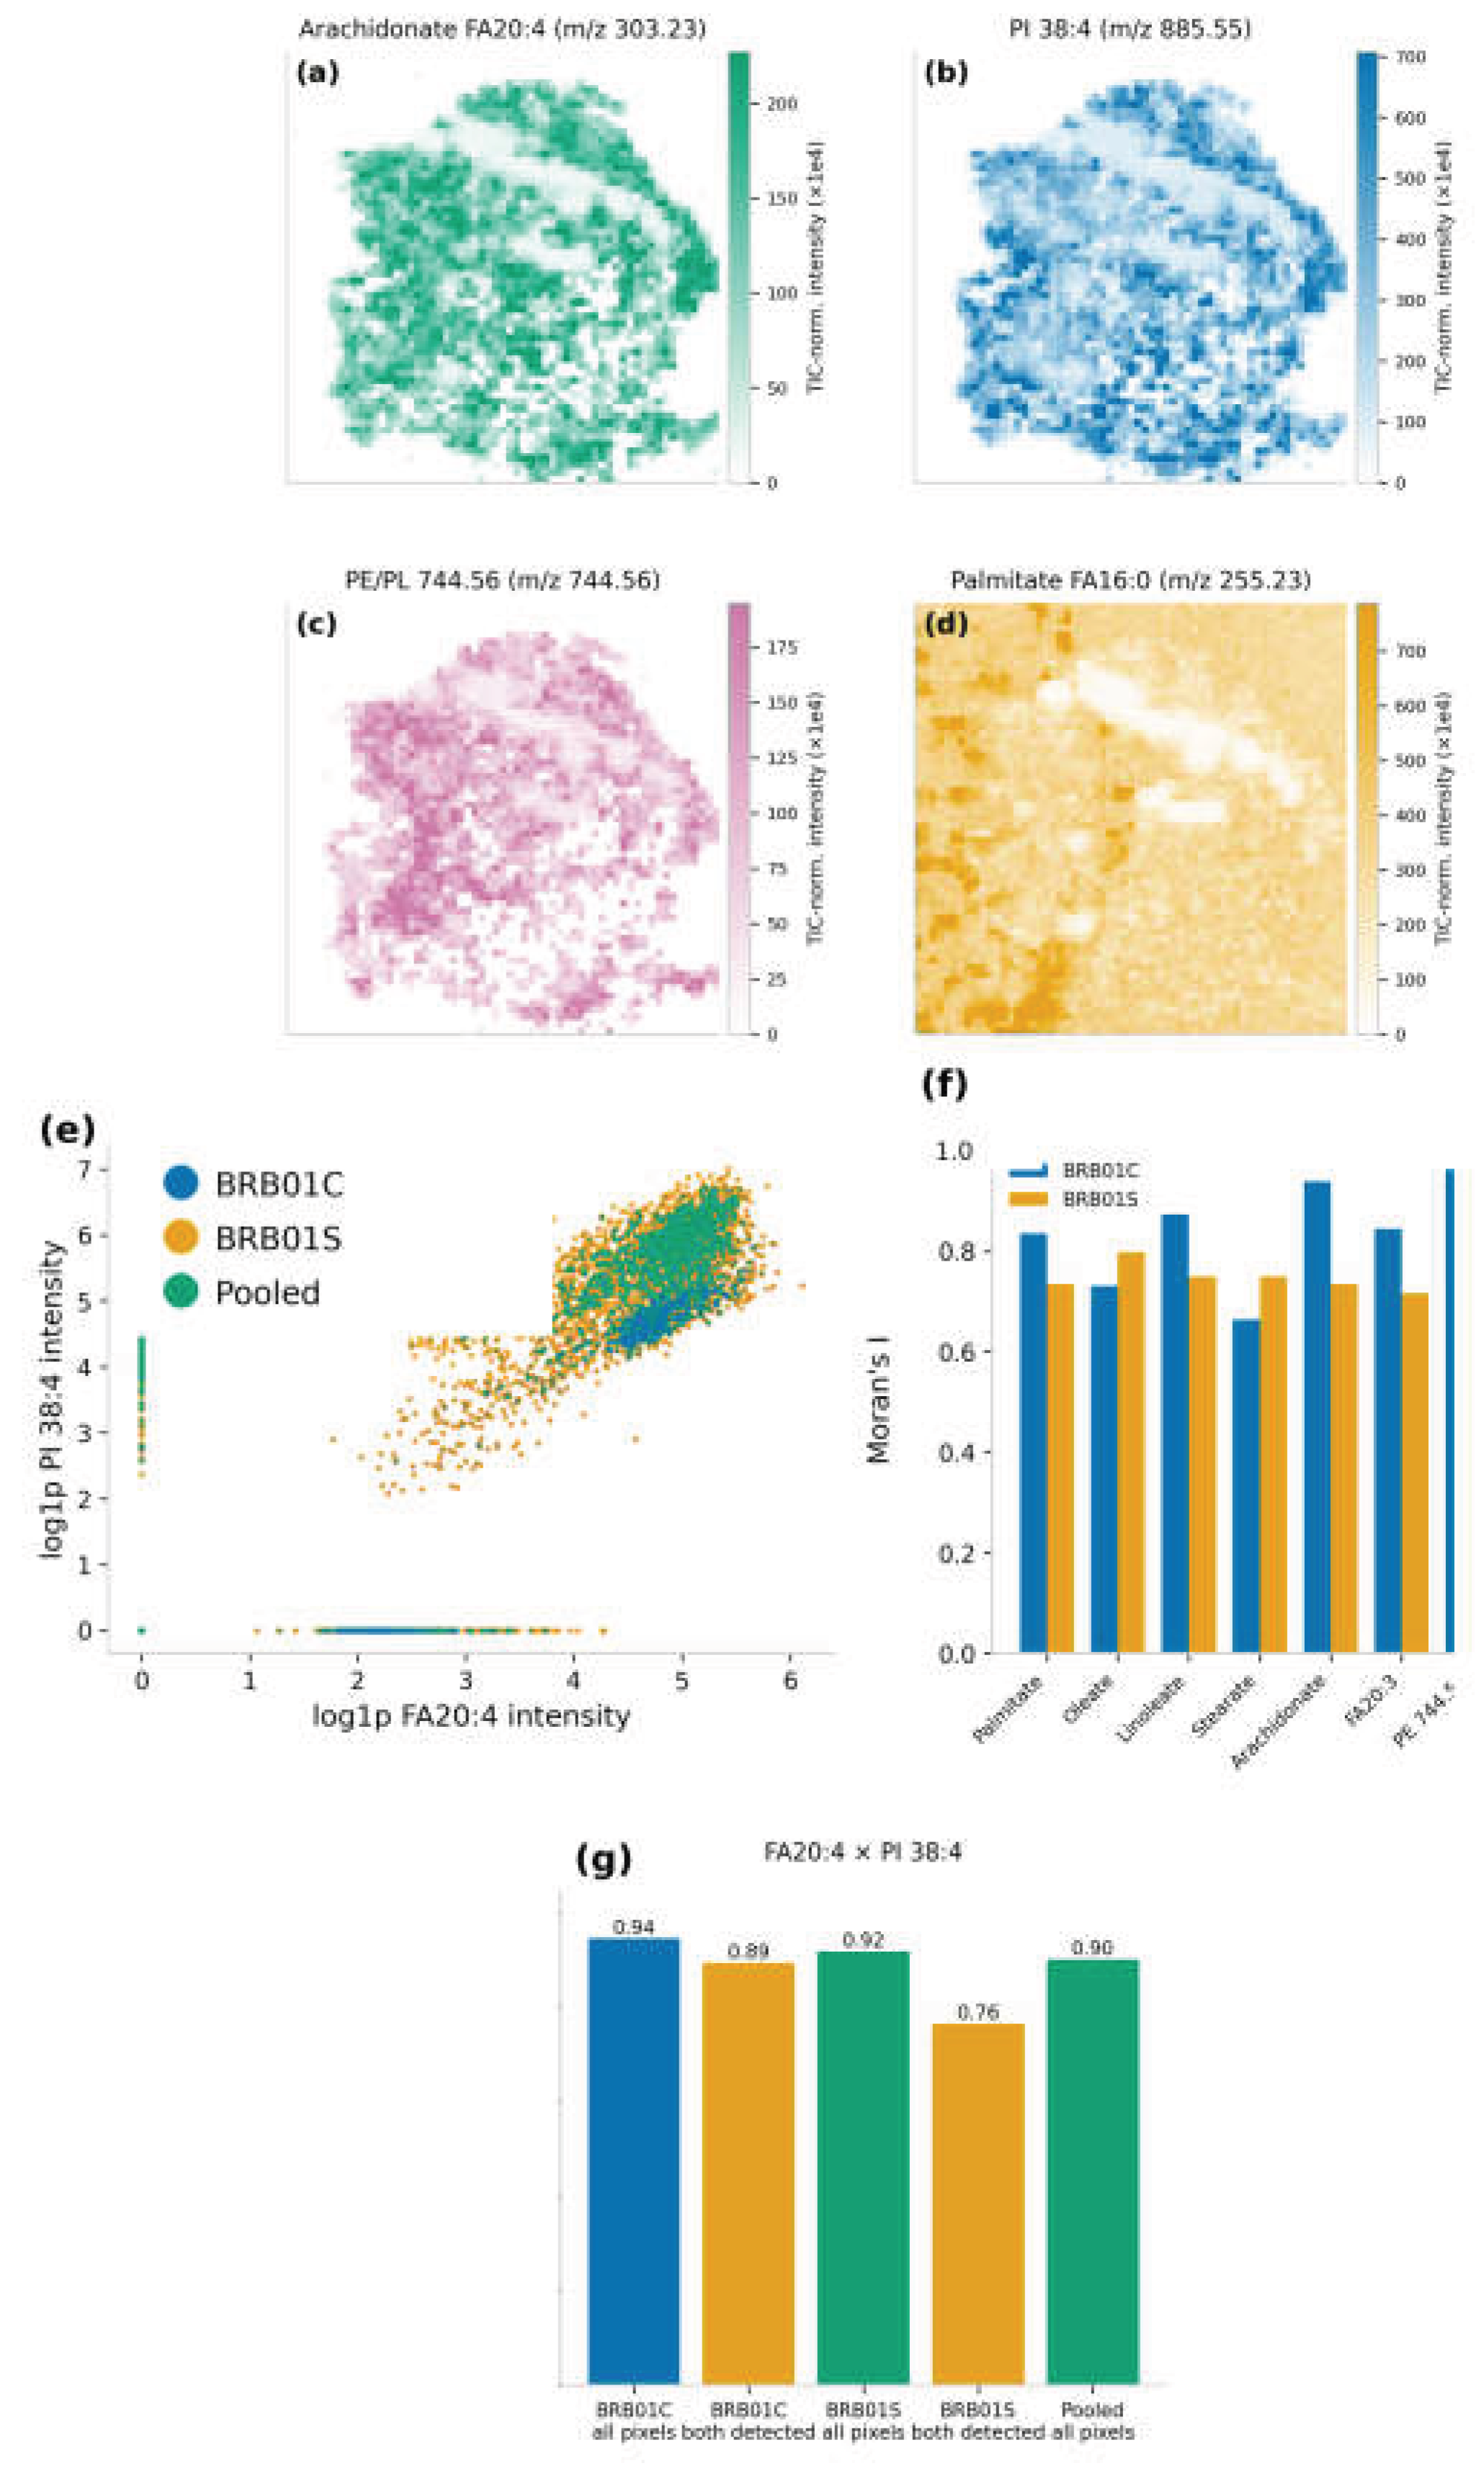
Figure 3.
Spatial validation of TAM metabolic programs in breast and colorectal tumors. (a) TAM signature score overlaid on the registered H&E image of the breast cancer Visium section (3,795 quality-controlled spots); (b) glycolysis and (c) iron-handling module scores. (d) TAM-high versus TAM-low regional contrasts (quintile split) for the nine metabolic/hypoxia modules (BH-adjusted). (e) Full 13 × 13 spot-level Spearman correlation matrix of all Layer 2 modules. (f) Spot-level TAM × glycolysis anticorrelation (nominal-only after the spin test). (g) Block A Section 2 robustness check reproducing the same correlation structure. (h–k) SPP1⁺ TAM, SELENOP⁺ TAM, glycolysis, and lipid-uptake module maps in colorectal cancer Visium HD section P1CRC (8-µm bins; GSE280318). (l) Module-score gradients across the tumor boundary in all three CRC patients (P1CRC, P2CRC, P5CRC). (m) Boundary-region module-score heatmaps by TAM-strata and section (SPP1⁺, SELENOP⁺, pan-myeloid). (n) Effective-sample-size-corrected −log10 p of the boundary contrasts (raw and smoothed).
Figure 3.
Spatial validation of TAM metabolic programs in breast and colorectal tumors. (a) TAM signature score overlaid on the registered H&E image of the breast cancer Visium section (3,795 quality-controlled spots); (b) glycolysis and (c) iron-handling module scores. (d) TAM-high versus TAM-low regional contrasts (quintile split) for the nine metabolic/hypoxia modules (BH-adjusted). (e) Full 13 × 13 spot-level Spearman correlation matrix of all Layer 2 modules. (f) Spot-level TAM × glycolysis anticorrelation (nominal-only after the spin test). (g) Block A Section 2 robustness check reproducing the same correlation structure. (h–k) SPP1⁺ TAM, SELENOP⁺ TAM, glycolysis, and lipid-uptake module maps in colorectal cancer Visium HD section P1CRC (8-µm bins; GSE280318). (l) Module-score gradients across the tumor boundary in all three CRC patients (P1CRC, P2CRC, P5CRC). (m) Boundary-region module-score heatmaps by TAM-strata and section (SPP1⁺, SELENOP⁺, pan-myeloid). (n) Effective-sample-size-corrected −log10 p of the boundary contrasts (raw and smoothed).
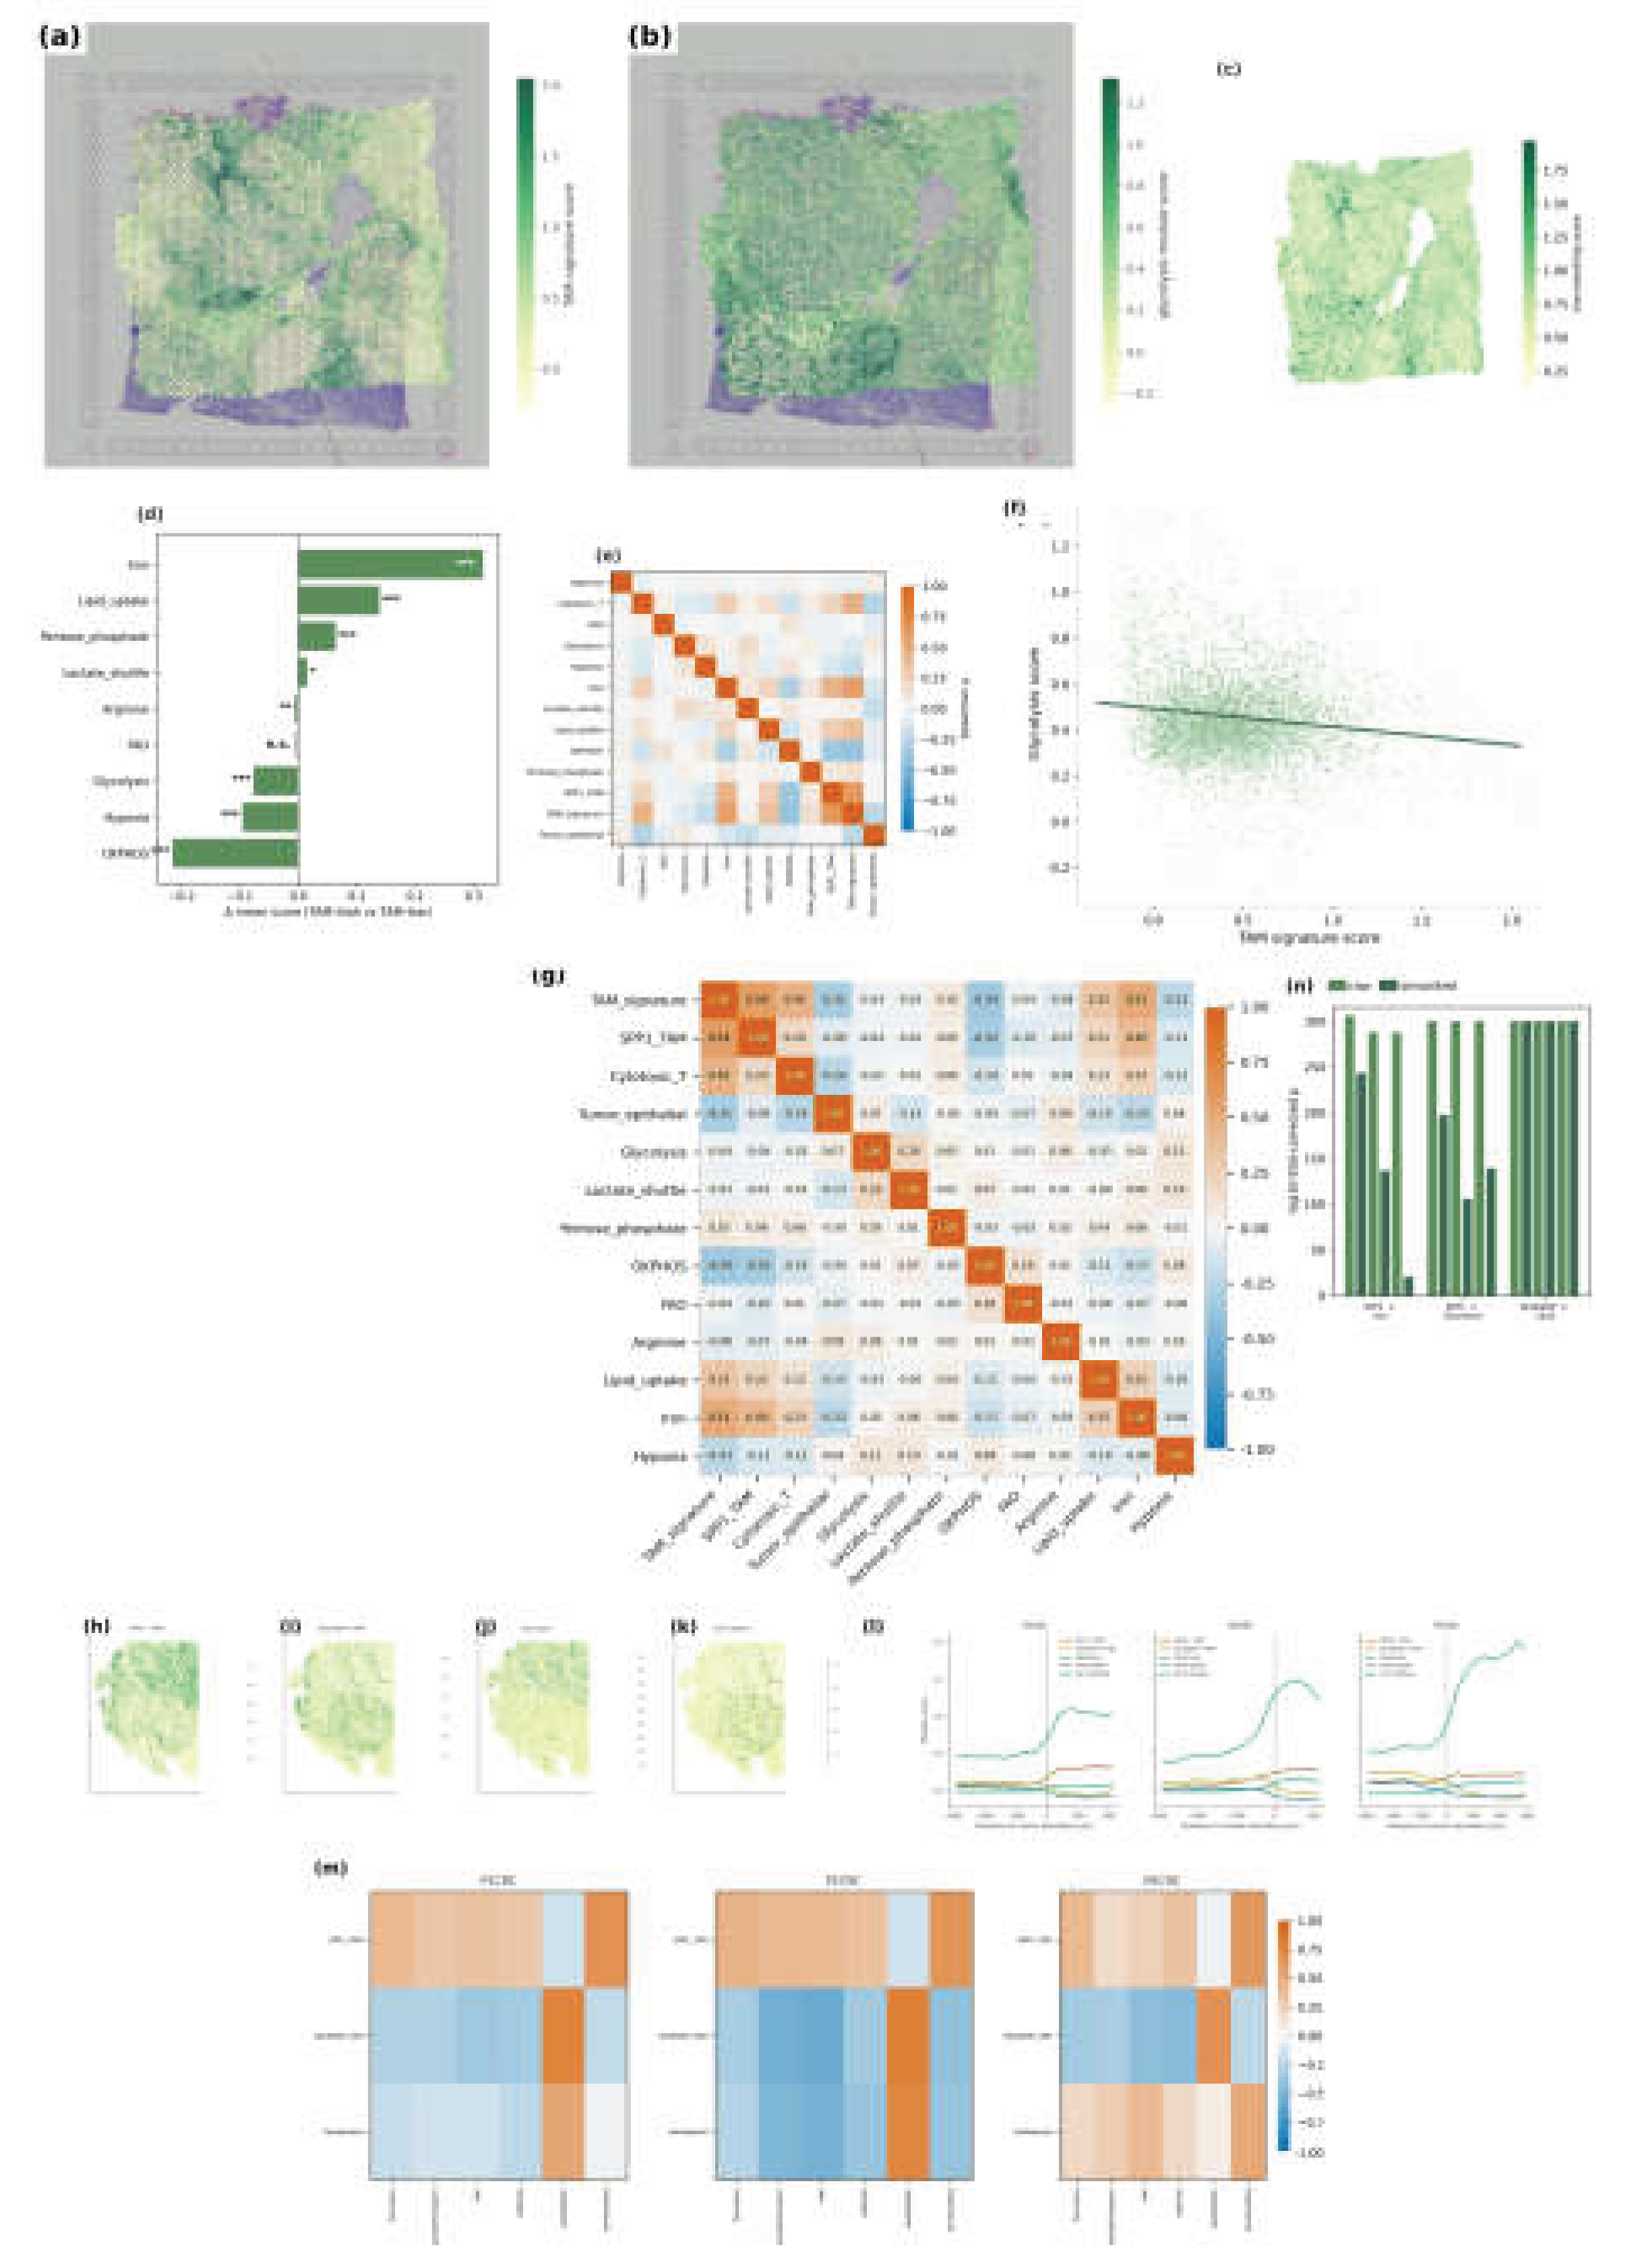
Figure 4.
Single-cell atlas of 20,000 stratified-downsampled myeloid cells from the LUAD resource GSE131907. (a) UMAP colored by the seven annotated subsets (SPP1⁺ TAM, C1QC⁺ TAM, FOLR2⁺ TRM-like, inflammatory monocytes, cDC, pDC, other myeloid). (b) The same embedding colored by tissue origin (nLung, tLung, tL/B, mLN, mBrain, PE, nLN), showing origin-dominated clustering. (c) Within-subset tissue-origin composition: 80.2% of C1QC⁺ cells are normal-lung alveolar macrophages, whereas 96.8% of SPP1⁺ TAM cells are tumor/metastatic. (d) Subset × key-marker dotplot (point size = expressing fraction; color = mean expression). (e) Full 19-marker dotplot across the seven myeloid subsets (dot size = % expressing; color = mean log-normalized expression). Underlying data in Supplementary Table S3.
Figure 4.
Single-cell atlas of 20,000 stratified-downsampled myeloid cells from the LUAD resource GSE131907. (a) UMAP colored by the seven annotated subsets (SPP1⁺ TAM, C1QC⁺ TAM, FOLR2⁺ TRM-like, inflammatory monocytes, cDC, pDC, other myeloid). (b) The same embedding colored by tissue origin (nLung, tLung, tL/B, mLN, mBrain, PE, nLN), showing origin-dominated clustering. (c) Within-subset tissue-origin composition: 80.2% of C1QC⁺ cells are normal-lung alveolar macrophages, whereas 96.8% of SPP1⁺ TAM cells are tumor/metastatic. (d) Subset × key-marker dotplot (point size = expressing fraction; color = mean expression). (e) Full 19-marker dotplot across the seven myeloid subsets (dot size = % expressing; color = mean log-normalized expression). Underlying data in Supplementary Table S3.
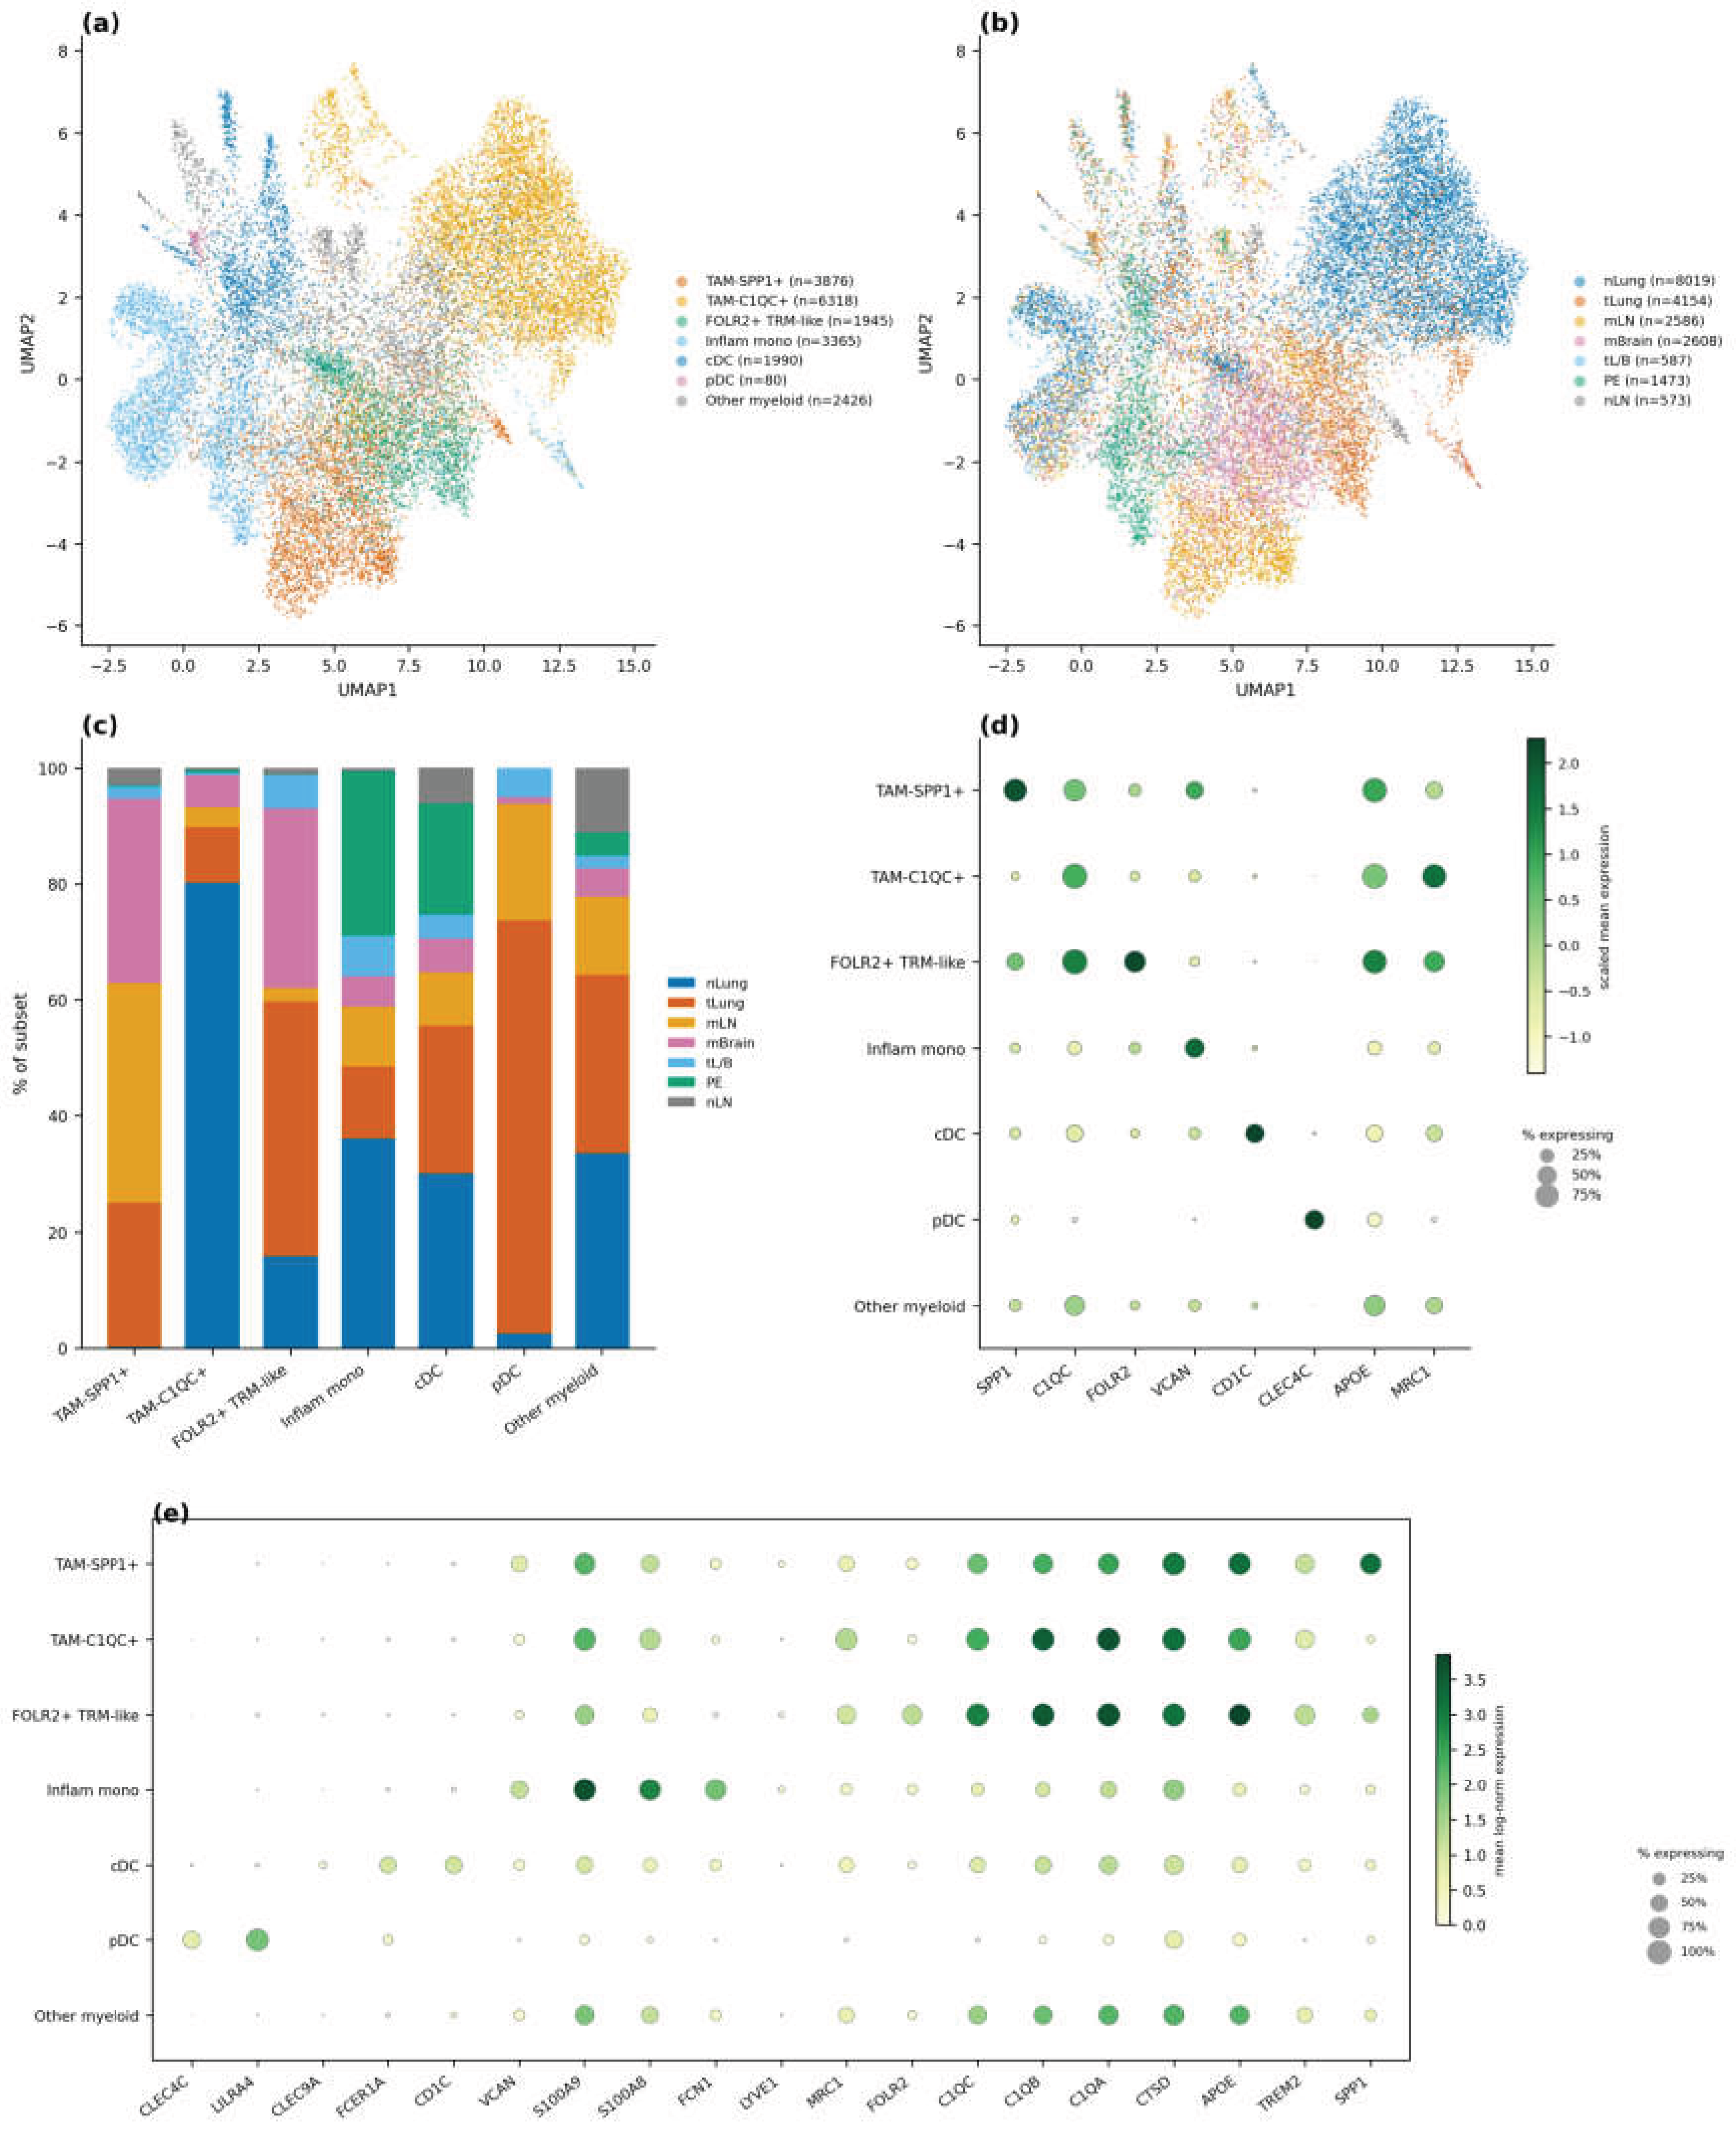
Figure 5.
Metabolic pathway programs and in silico perturbation across myeloid subsets (exact Supplementary Table S17 gene sets; scanpy score_genes). (a) Nine-pathway score distributions across the seven subsets (all origins, n = 20,000 cells; Kruskal–Wallis BH-corrected p per panel). (b) Tumor-lung (tLung)-restricted subset means (n = 4,154), the origin-controlled view. (c) Gene-level coupling: glycolysis score versus SPP1 expression across TAM-compartment cells (ρ = 0.513; within tumor-lung SPP1⁺ TAMs, ρ = 0.651). (d) All-origin subset × module mean heatmap. (e) Single-gene knockout effects (mean percent change across seven metabolic-capacity readouts versus wild type) for LDHA, G6PD, and CPT1A across the three LUAD TAM subset models. (f) ATP-capacity impact of the shared glycolytic/respiratory nodes (ENO1, GAPDH, PGK1, SDHA; essentiality scan). (g) LDHA/LDHB compensation: lactate-export change upon LDHA knockout (near zero) and LDHA share of LDH-subunit expression per subset. Statistics in Supplementary Tables S4, S5, S16, and S19.
Figure 5.
Metabolic pathway programs and in silico perturbation across myeloid subsets (exact Supplementary Table S17 gene sets; scanpy score_genes). (a) Nine-pathway score distributions across the seven subsets (all origins, n = 20,000 cells; Kruskal–Wallis BH-corrected p per panel). (b) Tumor-lung (tLung)-restricted subset means (n = 4,154), the origin-controlled view. (c) Gene-level coupling: glycolysis score versus SPP1 expression across TAM-compartment cells (ρ = 0.513; within tumor-lung SPP1⁺ TAMs, ρ = 0.651). (d) All-origin subset × module mean heatmap. (e) Single-gene knockout effects (mean percent change across seven metabolic-capacity readouts versus wild type) for LDHA, G6PD, and CPT1A across the three LUAD TAM subset models. (f) ATP-capacity impact of the shared glycolytic/respiratory nodes (ENO1, GAPDH, PGK1, SDHA; essentiality scan). (g) LDHA/LDHB compensation: lactate-export change upon LDHA knockout (near zero) and LDHA share of LDH-subunit expression per subset. Statistics in Supplementary Tables S4, S5, S16, and S19.
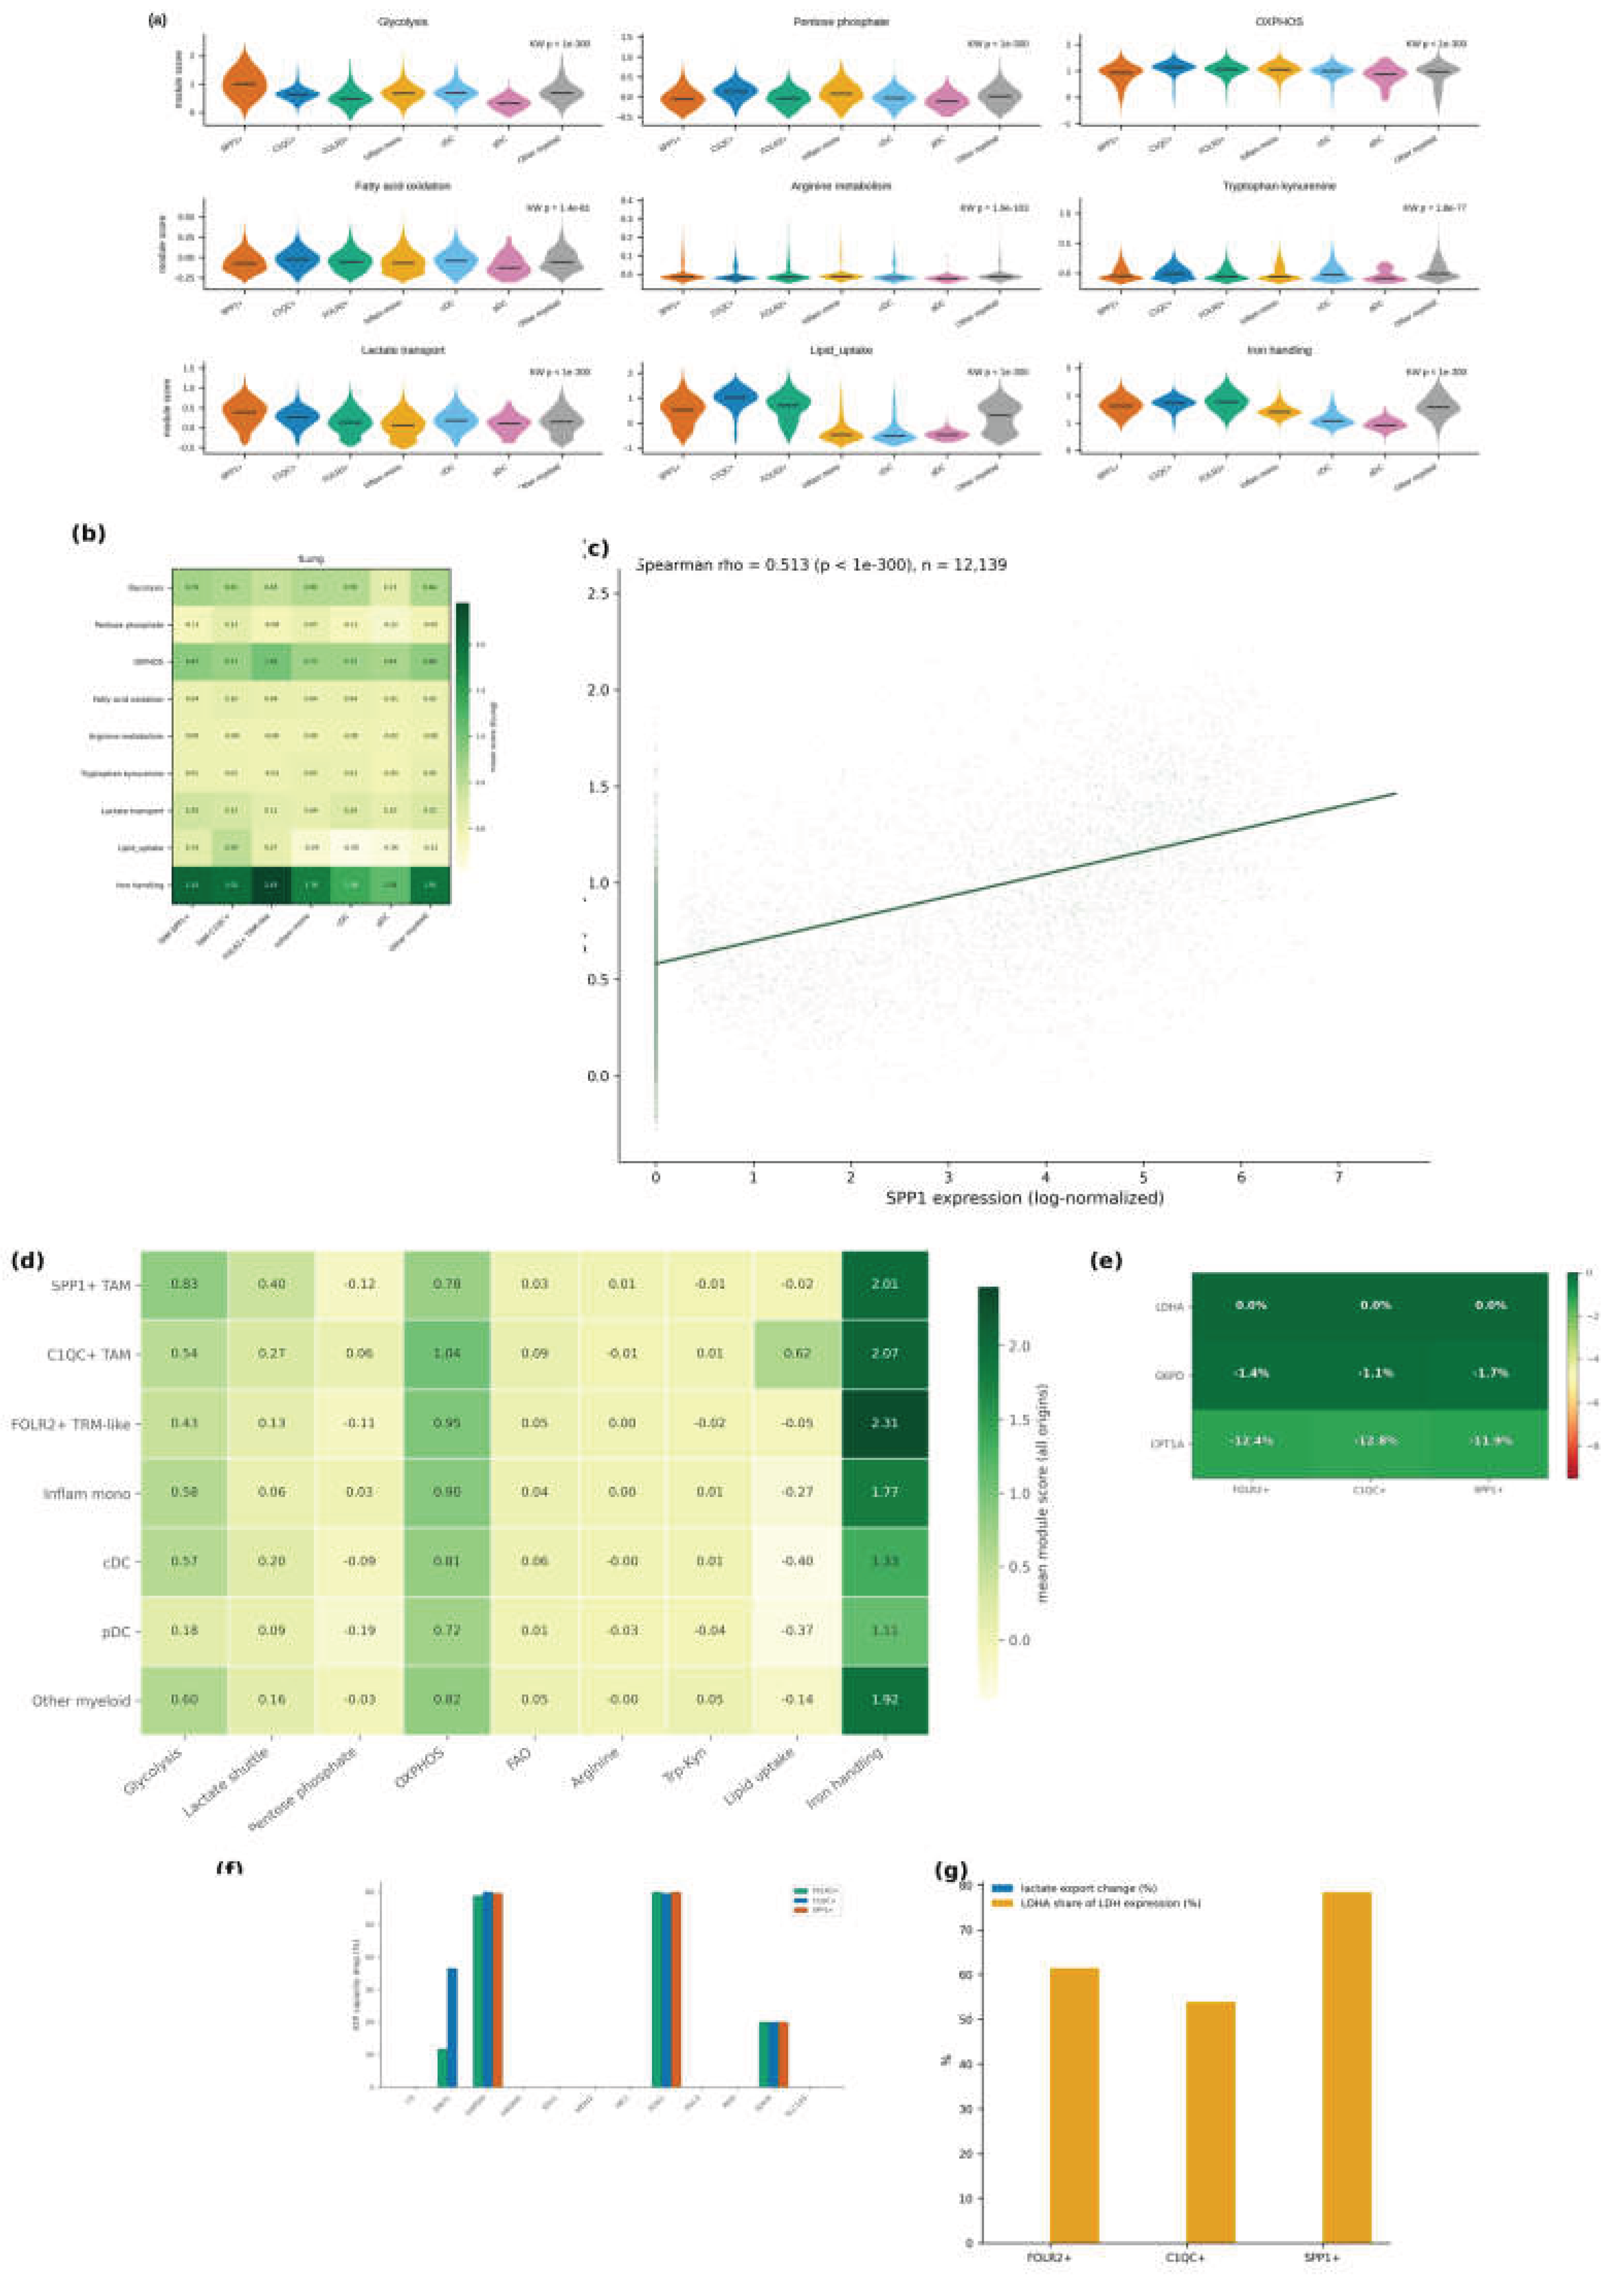
Figure 6.
Cross-tumor replication and mtDNA-marked clonality of TAMs. (a) TAM signature map in the GBM Visium section (3,461 spots). (b) Moran’s I of all 13 modules (199 permutations; all p = 0.005). (c) 13 × 13 spot-level Spearman correlations with breast-identical gene sets: TAM × glycolysis/hypoxia/lactate/OXPHOS couplings recur as negative, whereas lipid-uptake and iron couplings attenuate to null. (d) HCC (GSE140228) group × pathway mean-score heatmap (seven annotated myeloid groups). (e) Per-cell variant-allele-fraction histograms for three mtDNA sites (2617 A>T NUMT artifact; 5262 G>A TAM clone; 13710 A>G background clone). (f) Module scores of the 5262 G>A clone (n = 59) versus remaining cells (p values per module). (g) Evaluable cells (depth ≥ 5) versus variant carriers (AF ≥ 0.8) for the melanoma DTC 5262 G>A and NSCLC donor-5 2069 T>C sites. (h) Homoplasmic-alt fraction of 2069 T>C in the 8-cell clone (8/8) versus background (0/394; Fisher p = 6.3 × 10⁻¹⁷). (i) TAM-enriched clone sizes across the NSCLC donor-5 (3′ HT) and other donors. (j) −log10 p of clone-versus-rest metabolic-program elevation per donor.
Figure 6.
Cross-tumor replication and mtDNA-marked clonality of TAMs. (a) TAM signature map in the GBM Visium section (3,461 spots). (b) Moran’s I of all 13 modules (199 permutations; all p = 0.005). (c) 13 × 13 spot-level Spearman correlations with breast-identical gene sets: TAM × glycolysis/hypoxia/lactate/OXPHOS couplings recur as negative, whereas lipid-uptake and iron couplings attenuate to null. (d) HCC (GSE140228) group × pathway mean-score heatmap (seven annotated myeloid groups). (e) Per-cell variant-allele-fraction histograms for three mtDNA sites (2617 A>T NUMT artifact; 5262 G>A TAM clone; 13710 A>G background clone). (f) Module scores of the 5262 G>A clone (n = 59) versus remaining cells (p values per module). (g) Evaluable cells (depth ≥ 5) versus variant carriers (AF ≥ 0.8) for the melanoma DTC 5262 G>A and NSCLC donor-5 2069 T>C sites. (h) Homoplasmic-alt fraction of 2069 T>C in the 8-cell clone (8/8) versus background (0/394; Fisher p = 6.3 × 10⁻¹⁷). (i) TAM-enriched clone sizes across the NSCLC donor-5 (3′ HT) and other donors. (j) −log10 p of clone-versus-rest metabolic-program elevation per donor.
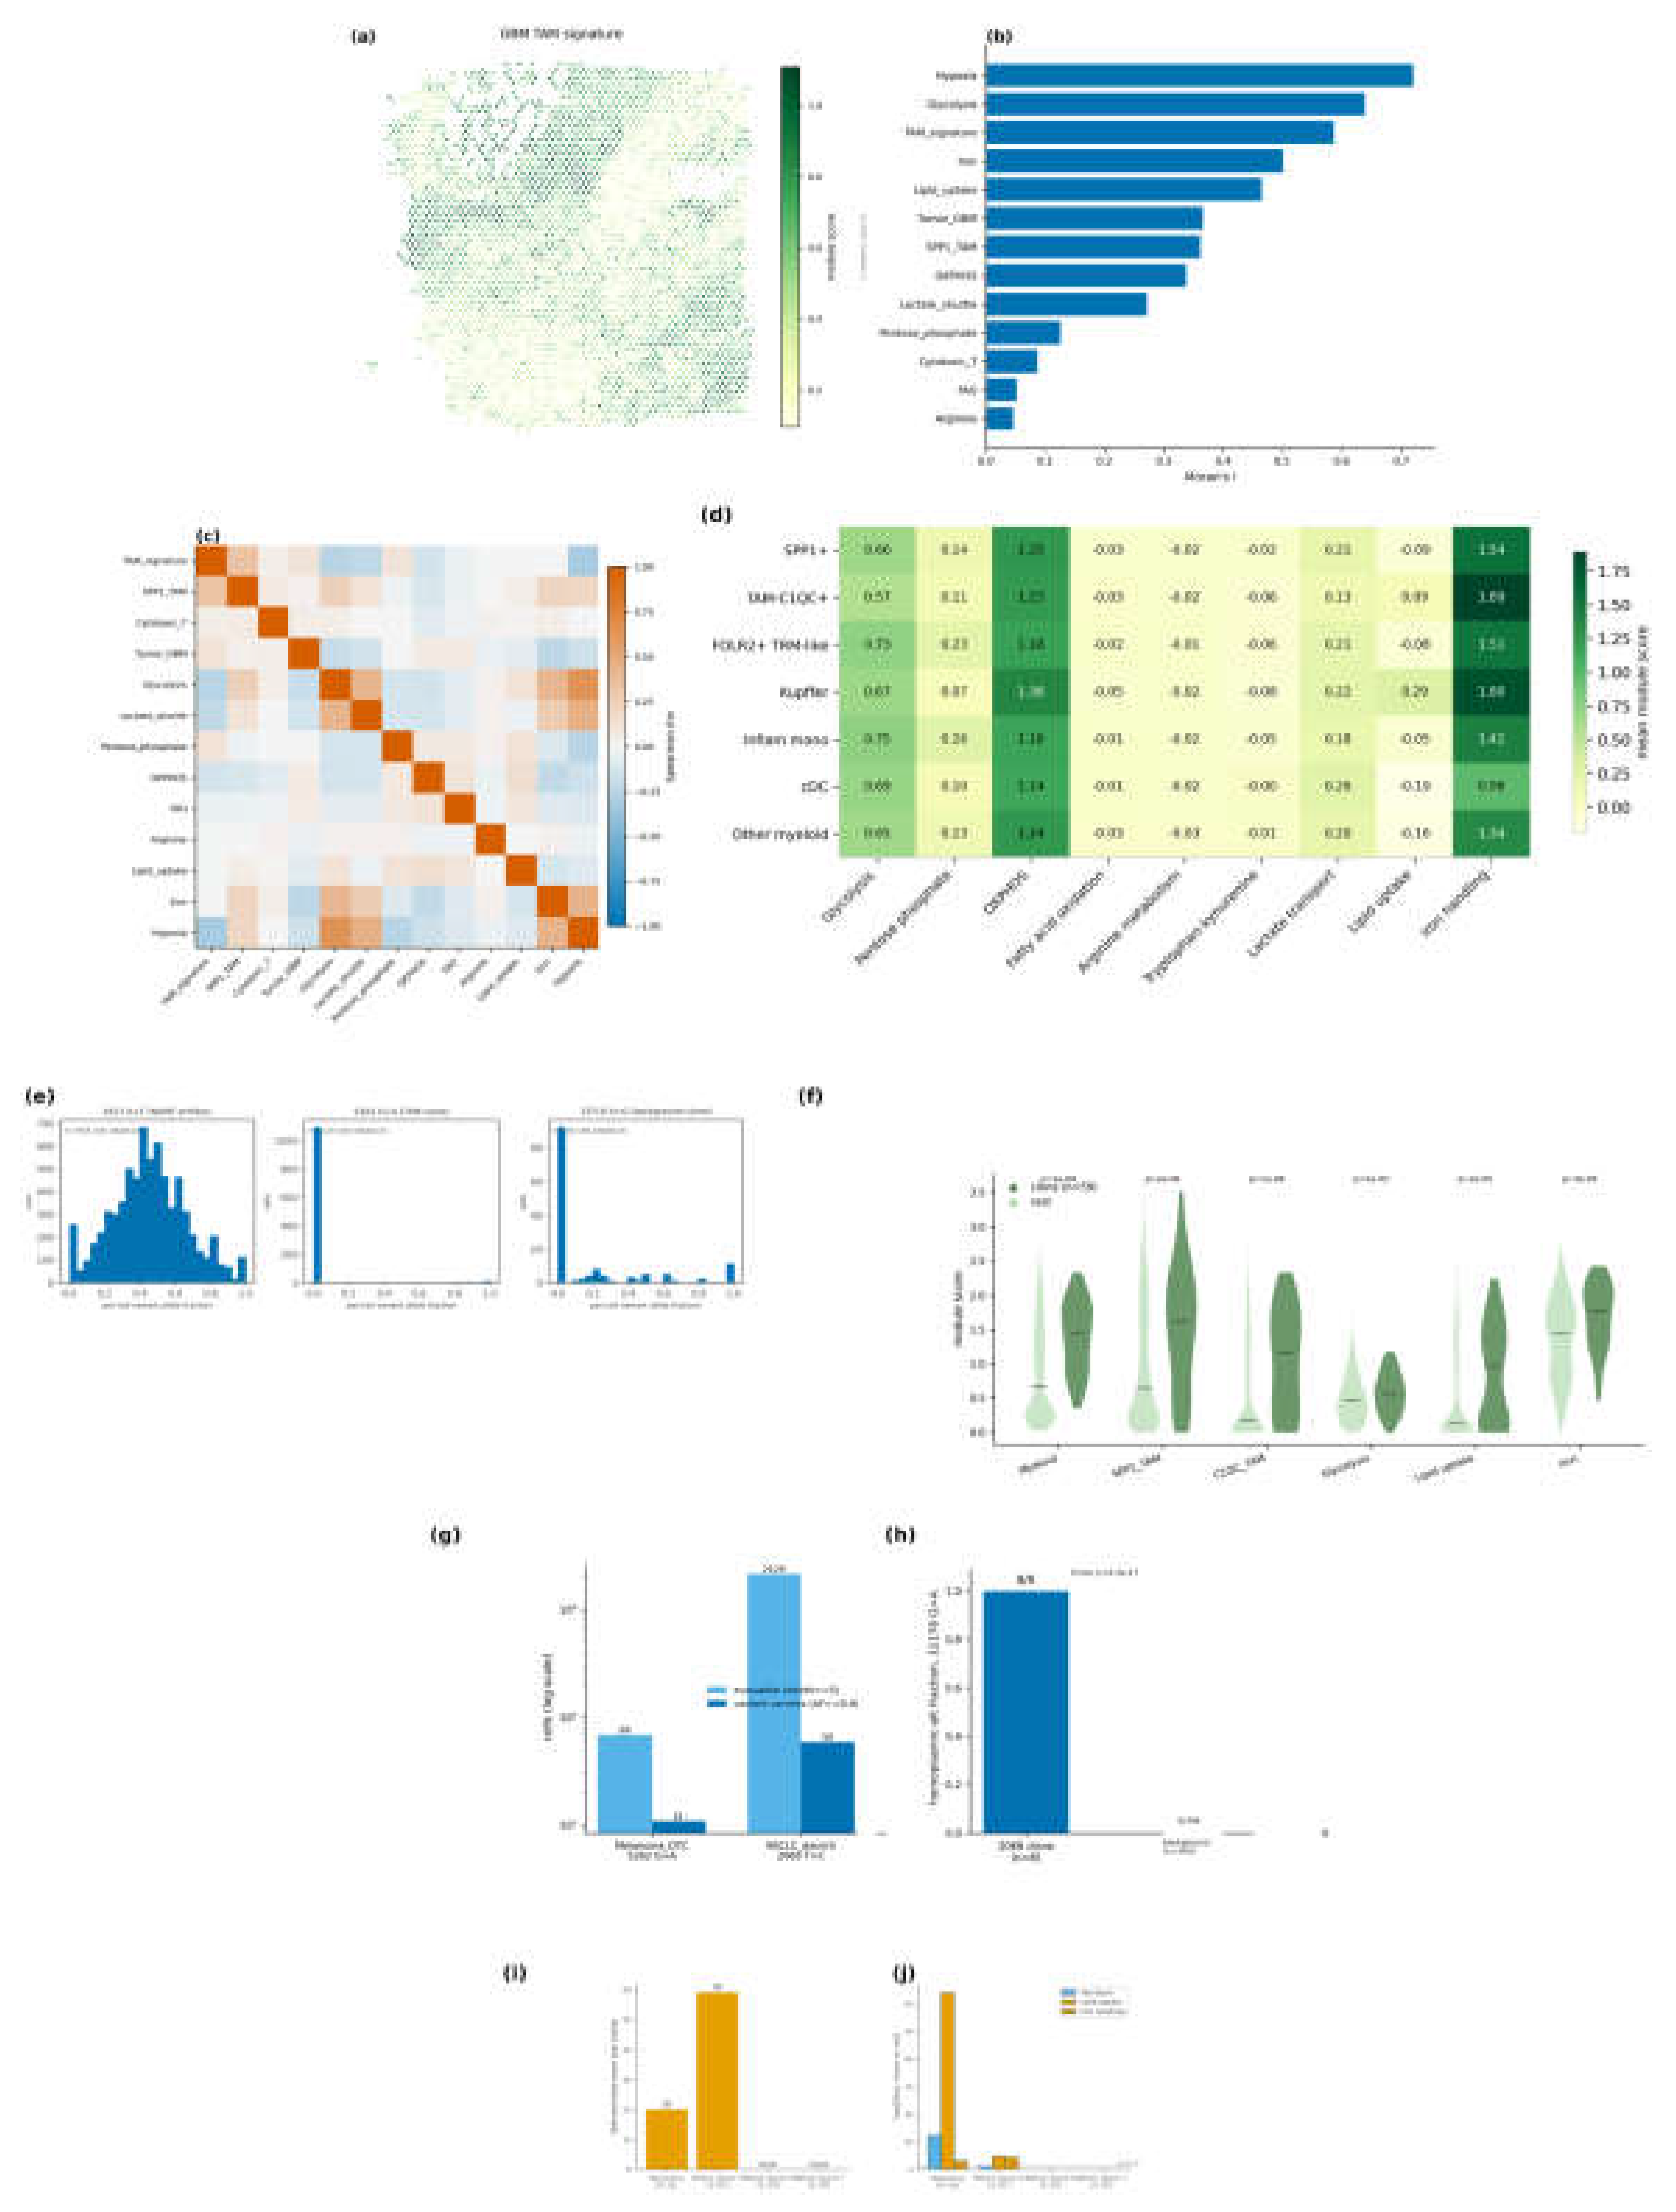

Table 1.
Cross-tumor direction-consistency summary for TAM × metabolism contrasts (direction-of-effect hypotheses recorded prior to the replication analyses) (discovery: LUAD scRNA-seq and breast Visium; replication: HCC scRNA-seq and GBM Visium). Δ = group mean difference; ρ = section-wide Spearman correlation; BH = Benjamini–Hochberg adjusted p; ns = not significant.
Table 1.
Cross-tumor direction-consistency summary for TAM × metabolism contrasts (direction-of-effect hypotheses recorded prior to the replication analyses) (discovery: LUAD scRNA-seq and breast Visium; replication: HCC scRNA-seq and GBM Visium). Δ = group mean difference; ρ = section-wide Spearman correlation; BH = Benjamini–Hochberg adjusted p; ns = not significant.
| Contrast | Discovery cohort | Replication cohort | Direction consistent? | Interpretation |
| Glycolysis: SPP1⁺ > C1QC⁺ | LUAD Δ = +0.292 (cell level; tLung patient-level n.s.) | HCC Δ = +0.093 (BH p = 2.3 × 10⁻¹⁴) | Yes (cell level) | Direction-conserved core; origin-structured |
| Lactate transport: SPP1⁺ > C1QC⁺ | LUAD Δ = +0.133 | HCC Δ = +0.075 (p = 4.9 × 10⁻⁶) | Yes | Conserved core (LOO-fragile ranking in LUAD) |
| Lipid uptake: C1QC⁺ highest among TAMs | LUAD Δ = +0.645 (vs SPP1⁺), +0.677 (vs FOLR2⁺) | HCC Δ = +0.176 (p = 6.8 × 10⁻³³), +0.166 (p = 1.3 × 10⁻²⁹) | Yes | Conserved core |
| Iron handling: FOLR2⁺ highest | LUAD FOLR2⁺ = 2.306 (highest) | HCC C1QC⁺ = 1.894; Kupffer = 1.801 | No (reversed anchor) | Context-dependent (liver resident background) |
| Glycolysis: SPP1⁺ > FOLR2⁺ | LUAD Δ = +0.393 | HCC Δ = −0.068 (p = 6.1 × 10⁻¹⁰) | No (reversed) | FOLR2⁺ group non-equivalent in HCC |
| TAM × glycolysis (spatial ρ) | Breast ρ = −0.096 (nominal-only; spin n.s.) | GBM ρ = −0.249 (p = 6.3 × 10⁻⁵⁰) | Yes, stronger | Conserved niche complementarity |
| TAM × hypoxia (spatial ρ) | Breast ρ = −0.194 | GBM ρ = −0.317 (p = 1.0 × 10⁻⁸¹) | Yes, stronger | Conserved; amplified by necrosis |
| TAM × lactate shuttle (spatial ρ) | Breast ρ = +0.047 (n.s.) | GBM ρ = −0.214 (p = 3.3 × 10⁻³⁷) | Discovery null; GBM negative | Context-dependent periphery |
| TAM × OXPHOS (spatial ρ) | Breast ρ = −0.382 | GBM ρ = −0.138 (p = 3.5 × 10⁻¹⁶) | Yes, attenuated | Conserved direction, weaker magnitude |
| TAM × lipid uptake (spatial ρ) | Breast ρ = +0.352 (largely compositional) | GBM ρ = −0.013 (p = 0.46, n.s.) | Null in GBM (no reversal) | Context-dependent periphery |
| TAM × iron handling (spatial ρ) | Breast ρ = +0.568 | GBM ρ = −0.005 (p = 0.76, n.s.) | Null in GBM | Context-dependent periphery |
| TAM × cytotoxic T cells (spatial ρ) | Breast ρ = +0.447 | GBM ρ = +0.040 (p = 0.020) | Attenuated to near-null | Context-dependent periphery |
| SPP1⁺ TAM × glycolysis (spatial ρ) | Breast ρ = −0.032 (n.s.) | GBM ρ = +0.242 (p = 1.7 × 10⁻⁴⁷) | No (sign differs; breast null) | GBM-specific pseudopalisading SPP1⁺ enrichment |
| All 27 scRNA contrasts | LUAD reference | HCC 12/27 same direction (13/27 direction-consistent in ≥3/4 of evaluable donors at donor level) | Partial | Core conserved, periphery not portable |
Disclaimer/Publisher’s Note: The statements, opinions and data contained in all publications are solely those of the individual author(s) and contributor(s) and not of MDPI and/or the editor(s). MDPI and/or the editor(s) disclaim responsibility for any injury to people or property resulting from any ideas, methods, instructions or products referred to in the content. |
© 2026 by the authors. Licensee MDPI, Basel, Switzerland. This article is an open access article distributed under the terms and conditions of the Creative Commons Attribution (CC BY) license (http://creativecommons.org/licenses/by/4.0/).
Copyright: This open access article is published under a Creative Commons CC BY 4.0 license, which permit the free download, distribution, and reuse, provided that the author and preprint are cited in any reuse.