

Submitted:
03 November 2026
Posted:
05 November 2026
You are already at the latest version
Abstract
Optimizing the operating modes of hydrotreating units is difficult because process parameters are numerous and interdependent, and product-quality indicators are often available only as fuzzy expert assessments. This study integrates fuzzy mathematical modeling, a heuristic decision-making method, and machine learning into a unified framework for controlling a hydrotreating unit. A system of models was developed for the reactor, three columns, and the furnace, combining nonlinear regression equations for measurable parameters, fuzzy regression equations for quality indicators, and a heat balance equation. The reactor control problem with fuzzy quality constraints was solved using the heuristic AorRA+PO method (absolute or relative allowance with Pareto optimality), which takes the decision-maker’s priorities into account. In parallel, eight regression algorithms were compared on a synthetic dataset, and the best gradient-boosting models (R² = 0.989–0.992) were used as surrogates in a two-stage optimization. The fuzzy approach increased the hydrotreated product volume to 78.0 m³/h, which is 2.0% higher than the deterministic method and 0.6% higher than the production mode; the machine learning approach yielded 79.6 m³/h with the quality constraints satisfied to a degree of 0.96–1.00. The lower reactor temperature in the recommended mode also reduces the furnace heat duty by about 2.5%. Because the machine learning models were trained on synthetic data, the recommended mode requires experimental verification at the unit.
Keywords:
hydrotreating
; fuzzy regression
; heuristic method
; machine learning
; surrogate model
; operating mode optimization
1. Introduction
The tightening of environmental requirements for motor fuels, combined with the multi-parameter, difficult-to-formalize nature of the hydrotreating process makes the optimization of hydrotreating unit operating conditions a pressing task. Effectively addressing this challenge under uncertainty in the input data requires integrating fuzzy modeling and machine learning (ML) methods into a unified decision-making procedure. Hydrotreating is essential for meeting stricter fuel quality requirements: it removes sulfur, nitrogen, oxygen, organometallic compounds, and resins from fuel distillates and saturates olefins [1]. The importance of hydrotreating continues to grow with the increasing share of sour crude oils in refining and the tightening of motor fuel quality standards [1].
A hydrotreating unit comprises a multitude of interconnected components, the performance of which is evaluated based on a combination of economic and environmental criteria [2]. In practice, the management of process parameters often relies heavily on the experience and subjective judgment of process engineers, while certain input data—such as product quality indicators—can only be described in qualitative, fuzzy terms [3]. Consequently, determining an operating mode that simultaneously meets requirements for both product volume and quality is challenging when performed manually, so formalized optimization methods are needed.
The objective of this study is to increase the hydrotreated product volume of a hydrotreating unit under fuzzy product-quality constraints by integrating mathematical modeling, heuristic decision-making, and machine learning. To this end, a system of mathematical models for the unit’s primary components was developed, drawing on heterogeneous data (statistical data and fuzzy expert judgments). A decision-making problem regarding the management of unit operating modes in a fuzzy environment was formulated and addressed using a heuristic method based on the principles of absolute or relative allowance and Pareto optimality. Furthermore, the unit’s operating mode was optimized using machine learning models, and the results obtained from both approaches were compared.
The methodological framework of this research encompasses systems analysis [4], mathematical modeling, optimization and decision-making [5], the processing of experimental and statistical data [6], as well as the theory of fuzzy sets and expert assessment [7,8]. The results of the fuzzy approach were compared with production data; the ML-based results were obtained on synthetic data and require experimental verification at the unit.
2. Related Works
In contemporary literature, the modeling and optimization of hydrotreating processes are addressed through several complementary approaches, ranging from general overviews of the field and the use of fuzzy logic to describe uncertainty, to data-driven modeling, the application of artificial intelligence specifically to desulfurization, and multi-objective process optimization based on trained models.
The first area comprises comprehensive reviews. Achieving deeper desulfurization and higher-quality motor fuels while simultaneously reducing operational costs remains a key objective in hydroprocessing, a point highlighted in a number of recent reviews [9,10,11]. These reviews note that traditional deterministic hydrotreating models—based on reaction kinetics and material balances—are labor-intensive to configure and lack flexibility when it comes to changes in feedstock composition. In contrast, machine learning and data mining techniques are increasingly becoming preferred tools for modeling and optimizing desulfurization processes [9,11].
The second area comprises studies that address the uncertainty inherent in input data and expert assessments by employing fuzzy set theory. In [12], interval type-2 fuzzy logic is applied to predict the performance indicators of catalytic hydrodesulfurization, resulting in a transparent and interpretable process model. Other studies [13,14] use fuzzy neural network models for risk assessment and decision-making regarding the maintenance of petrochemical units. Most closely related to the present work is study [15], which addresses the control of a gasoline fraction hydrotreating process within a fuzzy environment. These studies confirm the effectiveness of a fuzzy logic approach for describing quality indicators that are difficult to formalize; however, in such works, fuzzy modeling and machine learning are typically applied separately rather than within a unified optimization framework.
The third area focuses on data-driven and surrogate modeling of hydrotreating and hydroprocessing units. Studies [16,17] use industrial data to develop neural network and regression models for hydroprocessing operations; [18] employs a surrogate model based on a multivariate Gaussian process for the multi-objective optimization of an industrial hydrotreater, while [19] uses a recurrent neural network with an attention mechanism. For scenarios with limited data, researchers have proposed hybrid models that combine machine learning with mechanistic relationships [20], as well as physics-informed neural networks [21]. These results demonstrate that data-driven models can accurately replicate the input–output relationships of an industrial process and serve as computationally efficient alternatives to deterministic models during optimization.
The fourth area encompasses research specifically focused on the desulfurization of petroleum products using artificial intelligence. In a series of studies [22,23,24], various machine learning algorithms—supported by experimental verification—are applied to the modeling and optimization of catalytic desulfurization. Other works include the use of machine learning for selecting catalyst grading systems for diesel hydrodesulfurization [25], optimizing oxidative desulfurization [26], predicting parameters for extraction-based desulfurization [27], and implementing real-time product monitoring through a combination of spectroscopy and machine learning [28]. These studies demonstrate the applicability of machine learning to quality parameters similar to those considered in the present research (such as sulfur content and the concentration of unsaturated hydrocarbons).
The fifth area involves the multi-objective optimization of plant operating modes, based on trained models and metaheuristic algorithms. In [23,29], multi-objective optimization of hydroprocessing units is performed using machine learning; in [30], a combination of AI-based models and a genetic algorithm is employed to determine the optimal operating conditions for the desulfurization of vacuum residue; and in [31,32], optimization problems related to hydroprocessing and hydrogen networks are addressed under conditions of uncertainty. More recent approaches include models based on large language models [33] and integrated management systems for refinery hydrogen balances [34]. While these studies confirm the potential of combining an ML-based process surrogate model with an optimization algorithm, most of them fail to explicitly incorporate expert-derived fuzzy information regarding the relative priorities of different quality parameters.
Unlike previous studies that apply fuzzy modeling [12,15], ML surrogates [18,19], or metaheuristic optimization [30] in isolation, this work integrates them into a unified control framework for a hydrotreating unit. The main contributions of this paper are as follows:
- A system of unit-level models (reactor R-1, columns K-1–K-3, and furnace P-101), comprising nonlinear regression equations for measurable parameters and fuzzy regression equations for quality indicators;
- The AorRA+PO (Absolute/Relative Allowance + Pareto Optimality) heuristic method, which incorporates the decision-maker’s priorities within a fuzzy environment;
- The use of machine learning models as process surrogates for operational optimization, with a comparative analysis of ML-based and fuzzy-based approaches within a common framework.
To the best of the authors’ knowledge, the combination of a fuzzy heuristic method and machine learning for the optimization of a hydrotreating unit has not been explored previously.
The structure of the paper is as follows: Section 3.1 presents the unit-level models—nonlinear regression equations for product volumes, fuzzy regression equations for quality indicators, and a heat balance equation for the furnace—with model identification performed via a sequential regressor-inclusion method and a modified least-squares method on α-level sets. Section 3.2 addresses the reactor control problem as a trade-off optimization task in a fuzzy environment, solved using the AorRA+PO method. Section 3.3 tackles the same problem using machine learning: this involves generating a synthetic dataset with a simplified generator calibrated on reference operating modes, comparing various regression algorithms, performing surrogate-based operational optimization, and benchmarking the results against heuristic and deterministic approaches, as well as actual industrial data.
3. Materials and Methods
3.1. Mathematical Models of the Main Equipment of the Hydrotreating Unit
The models of reactor R-1 were developed on the basis of experimental–statistical data and expert information. The quality indicators of the hydrotreated product are not always measured and are largely assessed by experts; therefore, they were described using a fuzzy modeling method [35]. As a result of structural identification, the models describing the quality of the hydrotreated product were obtained in the form of fuzzy multiple regression equations:
where − content of unsaturated hydrocarbons in the hydrotreated product (no more than 1%); − sulfur content in the hydrotreated product (0.00005%); − content of water-soluble acids and alkalis in the hydrotreated product (feed (straight-run gasoline) flow rate (45–80 m³/h); x2− reactor pressure (20–35 kgf/cm²); x3−reactor temperature (300–343 °C); x4−liquid hourly space velocity of the feed (0.5–5 h⁻¹); x5−circulation ratio of the hydrogen-containing gas (HCG), i.e., the hydrogen-to-hydrocarbon ratio (200–500 Nm³/m³); ,,, i, k = ; j = 2, 3, 4 are the fuzzy coefficients to be identified.
The fuzzy coefficients of model (1) were identified using the procedure described in [35,36]. The membership functions of the quality indicators are considered on the α-level sets α = 0.5, 0.85, and 1; for each α-level, the fuzzy model reduces to a set of crisp multiple regression equations, whose structure is determined by the sequential regressor inclusion method and whose coefficients are estimated by a modified least-squares method. The α-level estimates are then combined into fuzzy coefficients via the resolution identity of fuzzy set theory. Regressors with no or only a weak effect on the quality indicators were excluded. The α-level equations and the composition formula are given in Appendix A (Equations (A1)–(A4)).
Analysis of the experimental–statistical data showed that the volume of the hydrotreated product at the outlet of reactor R-1 (y1) can be described by a statistical model in the form of a nonlinear regression equation relating y1 (m³/h) to the input and operating parameters . After identification of the structure and parameters using the procedure described above, the model of the hydrotreated product volume at the outlet of reactor R-1 takes the form:
y1 = 7.00 + 0.233x1 + 0.130x2 + 0.011x3 + 2.333x4 − 0.0175x5 +
+0.0017x1x2 + 0.00015x1x3 + 0.03111x1x4 + 0.00023x1x5 +
+0.08642x2x4 − 0.00065x2x5 + 0.00730x3x4
Next, mathematical models are developed for columns K-1, K-2, and K-3, which are also part of the main equipment of the hydrotreating unit.
Stripping column K-1 is designed to remove water vapor and hydrogen sulfide from the hydrotreated product; the content of sulfur compounds in the product must not exceed 0.00005 wt.%. Absorber K-2 is designed to recover hydrogen from hydrocarbon gases, while in absorber K-3 the hydrocarbon gases are purified of hydrogen sulfide.
A study of the column operating modes and an analysis of the available data showed that part of the information is fuzzy in nature and is provided by experts. Therefore, the column models were developed using a hybrid method [36] that combines statistical data processing with the formalization of expert information.
Based on the study of the operation of columns K-1, K-2, and K-3 and on expert assessment, the input () and output () parameters characterizing their operating modes were identified: x1−feed flow rate at the column inlet; x2−inlet temperature; x3− column pressure; x4− reflux flow rate of column K-1; y1−volume of the hydrotreated product at the outlet of column K-1; y2−volume of HCG at the outlet of column K-2; y3−volume of hydrocarbon gas at the outlet of column K-3; content of sulfur compounds in the hydrotreated product (quality of the K-1 product); HCG composition (quality of the K-2 product); hydrocarbon gas composition (quality of the K-3 product).
The input parameters x1,x2,x3,x4 (feed flow rate, inlet temperature, column pressure, and K-1 reflux flow rate) and the output parameters y1,y2,y3, which characterize the column product volumes, are measurable, which makes it possible to collect statistical data on them. The quality indicators of the column products are described in fuzzy terms: they are assessed by experts and formalized using fuzzy set theory.
The model structures of stripping column K-1 and absorbers K-2 and K-3 were identified by the sequential regressor inclusion method and its modification; the models take the form of nonlinear regression equations (3) and fuzzy regression equations (4):
The coefficients of the crisp models (3) were estimated by the least-squares method from plant statistical data, and the fuzzy parameters of models (4), which evaluate the quality of the products of columns K-1, K-2, and K-3, were identified using the same α-level procedure as for model (1) [35,36]. The identified models of the column product volumes are given in Appendices B and C (Equations (B1) and (C1)).
Model of furnace P-101. The cylindrical furnace P-101 is designed to heat the gas–feed mixture to the temperature specified by the process regulations. The study identified the main parameters affecting the furnace operation and the hydrotreating process:
– x1−feed flow rate at the inlet of furnace P-101, 60–80 m³/h;
– x2−inlet temperature of furnace P-101, 170–190 °C;
– x3− pressure in furnace P-101, 40–43 kgf/cm².
Furnace P-101 does not directly affect the quality indicators of the hydrotreated product: its function is to heat the gas–feed mixture from the inlet temperature to the temperature set for reactor R-1. Therefore, the furnace is modeled by a heat balance equation relating the reactor operating mode to the furnace heat duty Q and the fuel consumption B:
where Gf = ρf · x1 and Gg are the mass flow rates of the feed and HCG, kg/h; cf, cg are their mean specific heat capacities over the heating range, kJ/(kg·°C); Tin is the mixture temperature at the furnace inlet, °C (170–190 °C); Tr is the reactor inlet temperature, which coincides with the operating parameter x3 of the reactor model, °C; is the lower heating value of the fuel (as-received basis), kJ/kg; ηfur is the furnace efficiency. The furnace pressure (40–43 kgf/cm²) exceeds the reactor pressure (20–35 kgf/cm²) by the hydraulic losses in the furnace coil, heat exchangers, and pipelines; it does not appear in the heat balance equation and acts as an operating constraint. The model shows that lowering the reactor temperature reduces the furnace heat duty and fuel consumption. The heat capacities and furnace efficiency are refined using the equipment specifications and plant operating data.
3.2. Solution of the Decision-Making Problem for Controlling the Operating Modes of the Hydrotreating Unit by the Heuristic AorRA+PO Method
The goal of optimal control of a chemical process system (CPS) is to maximize the output of target products, minimize costs, improve product quality, and enhance the environmental performance of production. However, these criteria are generally conflicting, and it is impossible to improve all of them simultaneously [37].
Therefore, the problem of controlling the operating modes of a CPS reduces to finding a compromise solution that depends on the production situation and the preferences of the decision-maker (DM) and must satisfy the DM. To formalize the problem in a fuzzy environment, we introduce the following notation:
– is the normalized criterion of the hydrotreated product volume, taking values in the interval [0, 1];
– are the fuzzy constraints on the quality indicators of the hydrotreated product: the content of unsaturated hydrocarbons, sulfur, and water-soluble acids and alkalis.
For the fuzzy constraints , membership functions are constructed to evaluate the degree to which these constraints are satisfied. For the constraints, a priority order IR = {1,…,3} and a weight vector are specified.
The vector of operating parameters is x = (x1,x2,x3,x4,x5): x1− feed flow rate to the reactor; x2− reactor pressure; x3− reactor temperature; x4− liquid hourly space velocity of the feed; x5− H₂/hydrocarbon ratio (HCG circulation ratio). The dependence of the criterion and constraints on x = (x1,x2,x3,x4,x5) is described by the developed models of the hydrotreating reactor.
Then, the decision-making problem of controlling the operating modes of reactor R-1 with fuzzy constraints, based on the modified Pareto optimality principle, is formalized as follows:
Since the problem under consideration has a single criterion, it is simplified: the principle of absolute or relative allowance for the criteria is not required.
The solution of the problem is the vector of operating parameters which provides the maximum value of the criterion at the highest values of the membership functions characterizing the degree of satisfaction of the fuzzy constraints, taking into account the DM’s preferences [15].
To solve the problem, a version of the heuristic AorRA+PO method simplified for the single-criterion case is used.
Step 1. Since there is only one criterion, its weight is equal to 1, and there is no need to specify the weight vector reflecting the relative importance of the partial criteria.
Step 2. If the criterion μ0(x) and/or the vector γ = (γ1,…,γm) are specified fuzzily, the terms of the term set are defined for them and membership functions are constructed. In the problem under consideration, the normalized criterion of the hydrotreated product volume μ0(x) is determined by measurement, i.e., it is crisp and unique; therefore, no term set is defined for it, and the vector γ = (γ1,…,γm) is not required.
Step 3. The DM and experts select the terms of the term set T(X,Y) that describe the linguistic parameters of the object. The linguistic parameters are the constraints, which, in accordance with the standards, are described by the terms “less than”, “no more than”, and “about”, as well as “much”, “slightly”, etc.
Step 4. With the participation of the DM and experts, membership functions were constructed to evaluate the degree of satisfaction of the fuzzy constraints :
where y2,y3,y4− numerical values of the hydrotreated product quality indicators obtained from the fuzzy models on the α-level sets, %. The centers of the functions correspond to the preferred values of the indicators, and the coefficients of the absolute-value terms are chosen so that, when the standard value is exceeded twofold (1% for unsaturated hydrocarbons, 0.00005% for sulfur, and 0.00001% for acids and alkalis), the degree of constraint satisfaction decreases to approximately 0.4–0.5 for unsaturated hydrocarbons and sulfur, and to approximately 0.8 for acids and alkalis.
Step 5. The DM specified the weights reflecting the relative importance of the fuzzy constraints: β1 = 0.3; β2 = 0.5; β3 = 0.2, i.e., .
Step 6. Using the mathematical model, the problem of maximizing the criterion μ0(x) on the feasible set X, defined on the basis of the Pareto optimality principle, is solved. The resulting solutions depend on the vector and provide the current values of the criterion and of the degrees of satisfaction of the fuzzy constraints
Step 7. The results obtained are presented to the DM for analysis and final decision-making. In the case under consideration, during the first four cycles, the current solutions did not satisfy the DM in terms of the regulatory requirements for the quality indicators; the DM adjusted the weight vector , and the search for a better solution was repeated from Step 6. In the fifth cycle, at , results satisfying the DM were obtained, and control was passed to Step 8.
Step 8. The best results selected by the DM are output: the vector of operating parameters that provides the maximum value of the criterion and the highest degrees of satisfaction of the fuzzy constraints , ,, where . The resulting values of the criterion, the degrees of constraint satisfaction, and the operating parameters are given in Table 1.
3.3. Solution of the Operating Mode Control Problem for the Hydrotreating Unit Using Machine Learning Models
Data-driven models are widely used for modeling and optimizing industrial processes. Rebuilding them requires less time and fewer resources than developing deterministic models, and they can be retrained as new data become available. Such models are also applicable to controlling the operating modes of a hydrotreating unit, where the relationship between the input and output process parameters is defined by a training dataset [38].
Since the amount of industrial data is insufficient for training machine learning models, the training dataset was generated using a synthetic data generator. The generator is a simplified closed-form description of reactor R-1 and is not derived from models (1), (2), and (8)–(10): its volume relation is calibrated on three reference operating modes, and its membership functions are constructed from expert knowledge of the process and centered at the AorRA+PO solution. The generator describes the dependence of the outputs of reactor R-1—the hydrotreated product volume y1 and the degrees of satisfaction of the fuzzy constraints on its quality μ1, μ2, μ3—on the vector of operating parameters x = (x1, x2, x3, x4, x5) within the admissible ranges established in Section 3.1: x1 ∈ [45, 80] m³/h, x2 ∈ [20, 35] kgf/cm², x3 ∈ [300, 343] °C, x4 ∈ [0.5, 5] h⁻¹, x5 ∈ [200, 500] Nm³/m³.
The hydrotreated product volume is defined as
where η is the fraction of the feed retained in the liquid product:
y1 = x1 · η(x2, x3)
η = 1 − L0 − L1(x3 − 330) − L3(x2 − 28), 0.85 ≤ η ≤ 0.995
The coefficients L0 = −0.0404, L1 = 0.00934, L3 = −0.01089 were determined from the condition that the calculated hydrotreated product volume matches the actual volume in three reference modes (Table 1): the deterministic method, the AorRA+PO method, and production data. Since three coefficients are fitted to three modes, the fit is exact and provides no independent validation; relation (12) is therefore reliable only within the calibration range (x₃ = 337–345 °C, x₂ = 28–31 kgf/cm²), and the upper bound η ≤ 0.995 is an assumption.
The degrees of satisfaction of the fuzzy constraints on hydrotreated product quality are specified by Gaussian membership functions centered at the mode x° = (80, 28, 337, 3, 400) found by the AorRA+PO method (for which μ = (1.0, 1.0, 0.98)):
The choice of function arguments reflects expert knowledge of the process: the hydrogenation of unsaturated hydrocarbons is governed by pressure and the HCG circulation ratio; the depth of desulfurization, by temperature, contact time (via space velocity), and HCG; and the removal of water-soluble acids and alkalis, by temperature and HCG.
To simulate measurement and laboratory analysis errors, noise was added to the output variables: multiplicative log-normal noise (σ = 0.4) to the volume loss fraction (1 − η) and additive normal noise N(0, 0.02) to the μ values. This form of noise preserves the physical condition y1 < x1.
A total of 3000 samples were generated, with the input parameters uniformly distributed within the admissible ranges. The dataset was split into training (2400 samples) and test (600 samples) subsets in an 80:20 ratio. A fragment of the generated dataset is shown in Figure 1.
Eight regression algorithms were considered: linear regression, ridge regression, k-nearest neighbors (k = 7), random forest, gradient boosting, XGBoost, LightGBM, and a multilayer perceptron (MLP, two hidden layers of 64 and 32 neurons) [16]. The models were compared by 5-fold cross-validation in terms of the coefficient of determination R² and the mean absolute error (MAE) (Figure 2).
For the hydrotreated product volume, all models achieved R² > 0.96, since y1 depends almost linearly on the feed flow rate. Linear models are not applicable to the quality indicators: R² = 0.40 for μ1, 0.66 for μ2, and 0.70 for μ3, which is explained by the nonlinear, bell-shaped nature of the dependencies. Gradient-boosting ensembles showed the best results. LightGBM was selected for further work for y1, μ2, and μ3, and XGBoost for μ1. The mean cross-validation R² values were 0.990, 0.988, 0.990, and 0.992 for y1, μ1, μ2, and μ3, respectively, with a standard deviation across folds not exceeding 0.002.
The obtained R² values are close to the theoretical limit set by the noise level in the data: R²max ≈ 1 − σ²/D(μ), where D(μ) is the variance of the output variable. For example, for μ2 with σ = 0.02, the limiting value is R² ≈ 0.993. This means that the models reproduce the patterns embedded in the generator and do not fit the noise.
The following values were obtained on the 600 held-out samples: y1: R² = 0.990, MAE = 0.46 m³/h, MAPE = 0.8%; μ1: R² = 0.989, MAE = 0.018, MAPE = 3.4%; μ2: R² = 0.989, MAE = 0.020, MAPE = 8.2%; μ3: R² = 0.992, MAE = 0.018, MAPE = 4.8%. MAPE for μ was calculated over values exceeding 0.05. Parity plots of actual versus predicted values are shown in Figure 3.
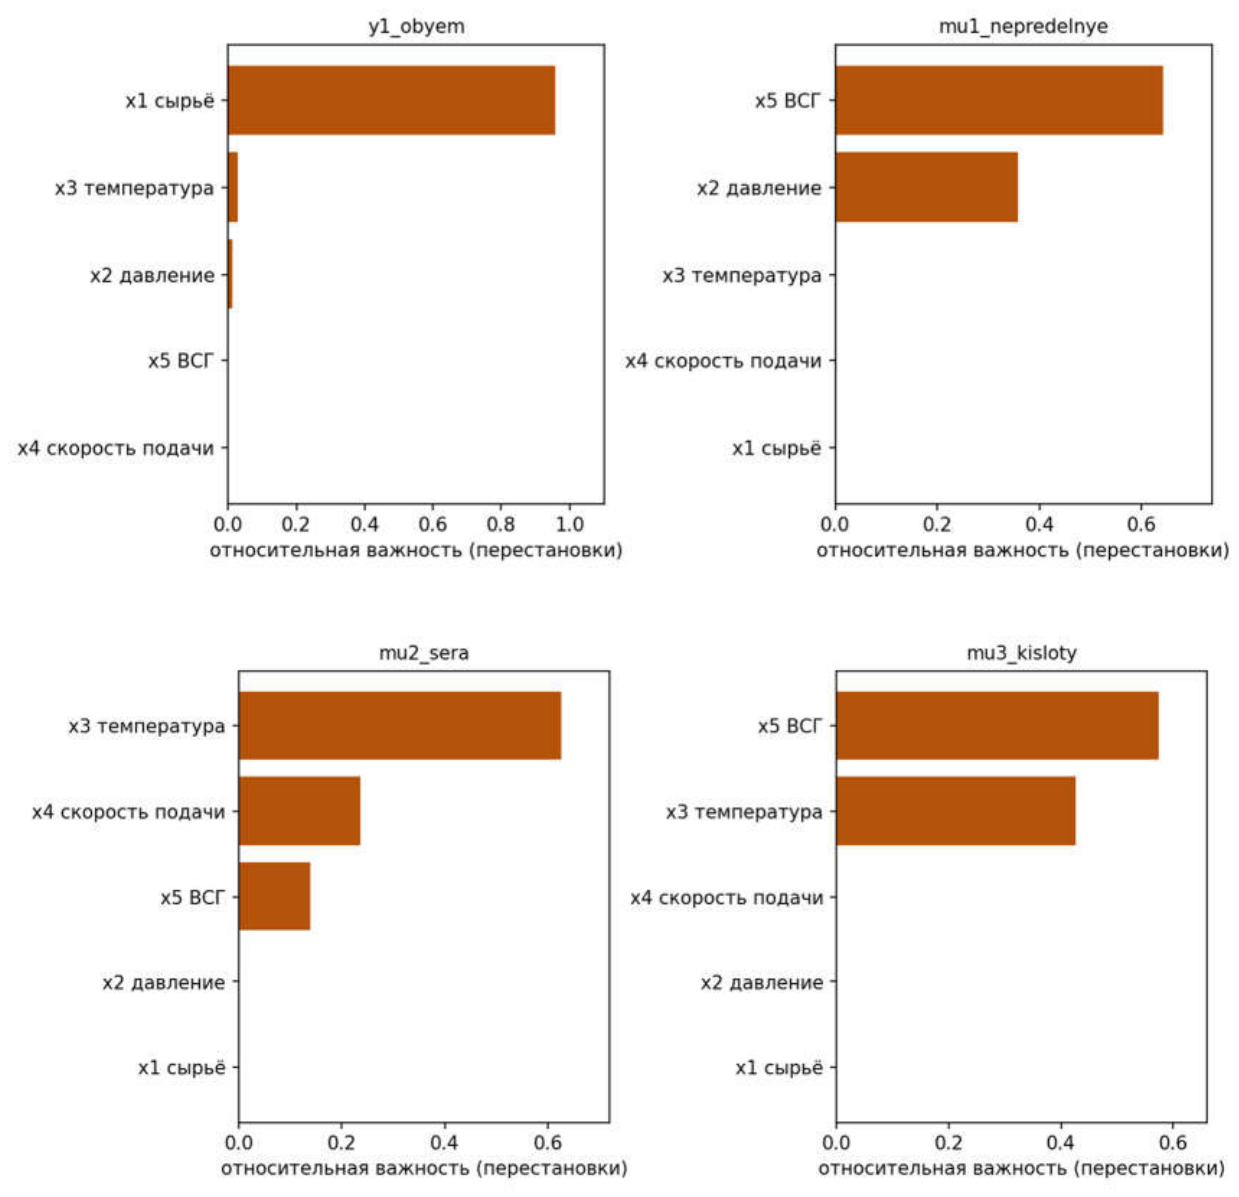
The importance of the input parameters was assessed by the permutation method on the test set (Figure 4). The hydrotreated product volume is determined mainly by the feed flow rate (0.96); the contribution of temperature and pressure (0.03 and 0.01) is associated with volume losses under more severe operating conditions. For μ1, the significant parameters are the HCG circulation ratio (0.64) and pressure (0.36); for μ2, temperature (0.63), space velocity (0.24), and HCG (0.14); and for μ3, HCG (0.57) and temperature (0.43).
The importance distribution matches the dependency structure embedded in generator (13)–(15). This confirms that the models correctly recovered these dependencies from the data without access to the formulas themselves.
The trained models were used as a surrogate process model in the problem
where β = (0.35, 0.40, 0.25) is the final weight vector assigned by the DM in the AorRA+PO method, and X is the feasible set of operating modes. The constraint y1 ≤ x1 is introduced explicitly: without it, the optimizer found modes in which the surrogate model, near the boundaries of the training data domain, produced a physically infeasible prediction y1 > x1.
Since the hydrotreated product volume is the criterion and the quality indicators are constraints, the problem is solved in two stages (lexicographic optimization). In the first stage, the maximum volume is found from (16). In the second stage, the mode with the best quality is selected among the modes that provide this volume:
where Δ ≈ 0.2 m³/h is the volume tolerance, about half the surrogate model error (MAE = 0.46 m³/h). The second stage is necessary because, in the vicinity of the optimum, the objective function plateaus with respect to pressure, so optimization by volume alone determines the pressure ambiguously.
Both problems were solved by differential evolution with nonlinear constraints (two independent runs at each stage). In the first stage, the maximum volume predicted by the surrogate model was 79.79 m³/h; however, the mode found (pressure 26.1 kgf/cm², space velocity 2.6 h⁻¹) yielded Score = 0.94, with a degree of satisfaction of the sulfur constraint of 0.92. The second stage, at practically the same volume, increased Score to 0.97, mainly by increasing the space velocity to 3.0 h⁻¹. The final recommended mode, obtained from the second-stage solution by an additional pressure-refinement step (see below) rather than directly from problem (17), is x1 = 80.0 m³/h, x2 = 28.0 kgf/cm², x3 = 333 °C, x4 = 3.0 h⁻¹, x5 = 392 Nm³/m³.
Near the optimal mode, the hydrotreated product volume is determined by the feed flow rate and temperature, whereas the objective function plateaus with respect to pressure: at x3 ≈ 333 °C, the yield fraction η reaches its limit of 0.995 already at x2 ≈ 26.4 kgf/cm², and a further increase in pressure does not change the volume (79.6 m³/h for x2 from 26.4 to 34 kgf/cm²). The second stage brought the pressure to 26.2 kgf/cm², i.e., to the edge of the plateau: at 28 kgf/cm², the surrogate model slightly underestimates the volume (79.3 m³/h versus 79.6 m³/h from the generator), and such a mode did not satisfy the volume constraint. Therefore, the pressure at the optimum is fixed not by volume but by the quality requirement: the value x2 ≈ 28 kgf/cm² provides the maximum degree of hydrogenation of unsaturated hydrocarbons (μ1 ≈ 1.0), whereas at 26 and 30 kgf/cm², μ1 = 0.95, and at 32 kgf/cm², it is 0.82. This eliminates the ambiguity in pressure selection observed when optimizing by volume alone.
The surrogate model prediction for the final mode is as follows: volume 79.3 m³/h, μ = (0.98, 0.98, 0.96), Score = 0.97. Verification using the original generator, Equations (11)–(15), gives y1 = 79.6 m³/h, μ = (1.00, 0.97, 0.96), Score = 0.98. The surrogate error is 0.28 m³/h (0.35%) for volume and no more than 0.02 for the membership degrees. Thus, the mode recommended by the ML model satisfies the quality constraints.
4. Results and Comparison
Comparative results of solving the problem of optimizing the operating modes of the hydrotreating unit reactor by different methods are presented in Table 1.

Table 1.
Comparative results of solving the decision-making problem of optimizing hydrotreating unit operating modes based on the deterministic approach, the fuzzy approach (AorRA+PO), experimental and production data, and machine learning.
Table 1.
Comparative results of solving the decision-making problem of optimizing hydrotreating unit operating modes based on the deterministic approach, the fuzzy approach (AorRA+PO), experimental and production data, and machine learning.
| Values of the criterion and membership functions of fuzzy constraints |
Deterministic method (literature data) |
Fuzzy approach (AorRA+PO) | Experimental and production data | Machine learning |
| Hydrotreated product volume – criterion y1, m³/h | 76.5 | 78 | 77.5 | 79.6 |
| Membership function of fuzzy constraint satisfaction y2 - | - | 1.0 | - | 1.00 |
| Membership function of fuzzy constraint satisfaction y3 - | - | 1.0 | - | 0.97 |
| Membership function of fuzzy constraint satisfaction y4 - | - | 0.98 | - | 0.96 |
| Optimal values of input (operating) parameters - feed flow rate, straight-run gasoline volume at the R-1 inlet, m³/h |
82 |
80 |
80 |
80.0 |
| - pressure in reactor R-1, kgf/cm² | 31.0 | 28.0 | 30.0 | 28.0 |
| - temperature in reactor R-1, °C | 345 | 337 | 340 | 333 |
| - liquid hourly space velocity of the feed, h⁻¹ | 3 | 3 | 3 | 3.0 |
| - H2/hydrocarbon ratio (HCG circulation ratio), Nm³/m³ | 400 | 400 | 400 | 392 |
| Notes: 1. (-) means that these indicators are not determined or measured under production conditions 2. For machine learning, the values of the criterion and membership functions calculated using the synthetic data generator according to Equations (11)–(15) in the recommended mode are given, rather than the prediction of the surrogate model. |
||||
Table 1 shows that all modes obtained with fuzzy quality constraints taken into account provide a larger hydrotreated product volume than the deterministic method (76.5 m³/h). The AorRA+PO method gives 78.0 m³/h with practically full satisfaction of the quality requirements (μ = (1.0, 1.0, 0.98)), which is 1.5 m³/h (2.0%) more than the deterministic method and 0.5 m³/h (0.6%) more than the actual production mode (77.5 m³/h). At the same time, the deterministic mode falls outside the permissible ranges for the feed flow rate (82 m³/h) and temperature (345 °C), whereas the solutions of the fuzzy approach and machine learning remain within them.
The mode found using machine learning models provides the largest hydrotreated product volume, 79.6 m³/h, which is 1.6 m³/h (2.1%) more than with the AorRA+PO method, 2.1 m³/h (2.7%) more than the actual production mode, and 3.1 m³/h (4.1%) more than the deterministic solution. The requirement for unsaturated hydrocarbons is fully met (μ1 = 1.00), and the requirements for sulfur and acids are met to a high degree, although somewhat lower than with the AorRA+PO method (μ2 = 0.97, μ3 = 0.96; Score = 0.98).
The feed flow rate, pressure, and space velocity in the solutions of the AorRA+PO method and machine learning are practically the same (80 m³/h, 28 kgf/cm², 3 h⁻¹); they differ in the reactor temperature (337 and 333 °C) and the HCG circulation ratio (400 and 392 Nm³/m³). The increase in volume is due to the lower temperature, which reduces volume losses in the reactor. According to the heat balance equation for furnace P-101, lowering the reactor inlet temperature by 4 °C at a furnace inlet mixture temperature of 180 °C reduces the furnace heat duty by approximately 2.5%; that is, the recommended mode is also advantageous from an energy standpoint.
5. Discussion
A comparison of the two approaches reveals that they are complementary rather than competitive. The AorRA+PO method operates directly with fuzzy unit models, explicitly incorporates expert knowledge and the DM’s preferences—via a vector of weighting coefficients and an interactive procedure—and yields an interpretable solution; however, it requires multiple rounds of interaction with the DM, with a nonlinear programming problem solved at each stage. In contrast, machine learning models, once trained, provide predictions at negligible computational cost, enabling a global search across the entire feasible set of operating modes and an analysis of the solution’s sensitivity to operating parameters.
These findings align with existing literature, in which data-driven models serve as surrogates for industrial processes within optimization frameworks [16,18,23,29,30]. Consistent with these studies, gradient-boosting ensembles reached R² values close to the theoretical limit set by the data noise, while linear models proved inadequate for capturing nonlinear quality metrics. Unlike these studies, this work explicitly incorporates fuzzy expert information on product quality: the membership functions and the DM’s weight vector—derived via the AorRA+PO method—are integrated as constraints into the machine learning-based optimization problem.
These results have several limitations. First, the machine learning models were trained on synthetic data; thus, the high R² values (0.989–0.992) reflect the accuracy with which the models replicate the data generator, rather than the actual physical system. Second, the generator itself is not derived from the unit models presented in Section 3.1; specifically, the dependence of the yield fraction on temperature and pressure is estimated based on only three reference operating points (337–345 °C), even though this relationship is a key determinant of the volume increase in the identified operating mode. The operating mode at a temperature of 333 °C lies outside the calibration range; for this condition, a volume of 79.6 m³/h is specified based on an adopted upper limit of η = 0.995. Furthermore, the generator’s membership functions are centered on the solution obtained via the AorRA+PO method; consequently, the high μ values in the ML-based mode partly reflect proximity to this specific solution rather than serving as an independent validation of quality. Finally, the identified operating point is situated at the upper boundary of the feed flow rate range—a region where the density of training data is lower—which necessitated the explicit inclusion of the constraint y₁ ≤ x₁.
The optimization analysis also revealed a feature of the process that is significant for practical application: in the vicinity of the optimum, the volume of the hydrotreated product is virtually independent of pressure. Therefore, the pressure should be selected based on the requirements for the content of unsaturated hydrocarbons. This conclusion is physically sound and can be verified experimentally on the actual unit, regardless of the accuracy of the surrogate model.
6. Conclusions
We optimized the operating conditions of a hydrotreating unit by integrating fuzzy mathematical models, a heuristic decision-making method, and machine learning models.
A system of mathematical models was developed for the unit’s primary components—reactor R-1, columns K-1, K-2, and K-3, and furnace P-101—using nonlinear and fuzzy regression equations, as well as heat balance equations. These models incorporate both experimental–statistical data and fuzzy expert information regarding quality parameters.
A decision-making problem for controlling reactor operating conditions in a fuzzy environment was formulated and solved using the AorRA+PO heuristic method. The resulting operating mode yields a hydrotreated product volume of 78.0 m³/h while meeting quality requirements almost entirely; this represents a 2.0% increase over the deterministic method and a 0.6% increase over the actual production mode.
Eight regression algorithms were trained and compared using a synthetic dataset. The best-performing algorithms—LightGBM and XGBoost—replicated the original model with R² values of 0.989–0.992 and a volume estimation error of less than 1%. A two-stage optimization process, using these models as surrogates for the actual unit, yielded an operating mode with a hydrotreated product volume of 79.6 m³/h (2.1% higher than with the AorRA+PO method) and Score = 0.98. The optimal pressure is determined by the requirements for unsaturated hydrocarbon content, while the increase in volume is achieved by lowering the reactor temperature to 333 °C, which simultaneously reduces the thermal load on the furnace. The reliability of the results obtained for an actual facility is limited by the accuracy of the underlying model; therefore, the recommended operating mode should be viewed as a basis for experimental verification on the equipment itself. Future research will involve retraining the models using historical operational data—with the dataset partitioned by time—and extending the problem formulation to a multi-objective framework that accounts for the furnace’s energy consumption.
Author Contributions
Conceptualization, A.Ta. and N.A.; methodology, A.Ta. and G.O.; software, A.Te. and N.A.; validation, K.B. and G.O.; formal analysis, G.O. and Z.K.; investigation, Z.K. and A.Te.; resources, K.B.; data curation, Z.K.; writing—original draft preparation, N.A.; writing—review and editing, N.A. and A.Ta.; visualization, N.A. and A.Te.; supervision, A.Ta.; project administration, A.Ta. All authors have read and agreed to the published version of the manuscript.
Funding
This research received no external funding.
Data Availability Statement
The data presented in this study are openly available in GitHub at https://github.com/NurzadaEnu/test_ml_optimize.
Conflicts of Interest
The authors declare no conflicts of interest.
Appendix: A.
This appendix gives the α-level equations and the composition formula for the fuzzy quality models (1) of reactor R-1, identified as described in Section 3.1.
As a result of parametric identification, models were obtained that describe the effect of the input (operating) parameters on the quality indicators of the hydrotreated product: the content of unsaturated hydrocarbons (), sulfur (), and water-soluble acids and alkalis (). For each α-level, they take the following form:
The values of the coefficients , identified at the α-levels, are combined into fuzzy coefficients using the resolution identity (decomposition theorem) of fuzzy set theory:
where
Appendix B
After parametric identification of model (3) for j=1, the following model was obtained for the volume of the target product of column K-1 (the hydrotreated product):
Appendix C
Similarly, the sequential regressor inclusion and least-squares methods were used to identify the structure and parameters of models (3) for absorbers K-2 and K-3, namely the volume of HCG at the outlet of K-2 (y2) and the volume of hydrocarbon gas at the outlet of K-3 (y3):
References
- Tanirbergenova, A.A.; Orazbayev, B.B. Technology of Hydrotreating of Catalytic Reforming Gasoline. In Proceedings of the 57th Scientific Conference of Postgraduate, Master’s and Undergraduate Students, BSUIR, Minsk, Belarus, 2021. (In Russian).
- Orazbayev; Tanirbergenova, A.A.; Tanirbergenova, A.A.; Berikbayeva, M.A.; Kaliyeva, S.A.; Sadykova, K.K. Development of a Heuristic Method for Decision-Making on Controlling the Operating Modes of a Hydrotreating Unit. NIA RK 2025, 3(97), 212–223. (In Russian).
- Canellas, M.C.; Feigh, K.M.; Chua, Z.K. Accuracy and Effort of Decision-Making Strategies With Incomplete Information: Implications for Decision Support System Design. IEEE Trans. Hum.-Mach. Syst. 2015, 45, 686–701.
- Pavlov, S.Y.; Kulov, N.N.; Kerimov, R.M. Improvement of Chemical Engineering Processes Using Systems Analysis. Theor. Found. Chem. Eng. 2016, 53, 117–133.
- Graetskaya, O.V.; Chusova, Y.S.; Ksenz, N.S. Mathematical and Instrumental Methods of Decision-Making: Textbook; Southern Federal University: Rostov-on-Don, Taganrog, Russia, 2020; 146 p. (In Russian).
- Orazbayev, B.B.; Kozhakhmetova, D.O.; Orazbayeva, K.N.; Berikkhanova, G.Y. Development of System of Model Columns K-1, K-2 and K-3 for Fluid Catalytic Cracking Unit Based on Varying Information. In Proceedings of the 2nd International Conference on Information Management and Processing, 2019; pp. 122–125. [CrossRef]
- Sladkova, L.A. Fuzzy Set Theory: Textbook; RUT (MIIT): Moscow, Russia, 2021; 130 p. (In Russian).
- Orlov, A.I. Expert Assessments: Textbook; IPR Media: Moscow, Russia, 2022; 57 p. (In Russian).
- Al-Jamimi, H.A.; et al. Supervised machine learning techniques in the desulfurization of oil products for environmental protection: A review. Process Saf. Environ. Prot. 2018, 120, 57–71.
- Nguyen, D.L.T.; et al. Recent advances in catalytic hydroprocessing of heavy oil. Fuel 2027, 428, 140397.
- Nayak, A.; et al. Performance assessment of hydrodesulphurization and adsorptive desulphurization with respect to sustainable development goals: Challenges and recent advancements. Next Sustain. 2026, 7, 100265.
- Al-Jamimi, H.A.; et al. Transparent predictive modelling of catalytic hydrodesulfurization using an interval type-2 fuzzy logic. J. Clean. Prod. 2019, 231, 1079–1088.
- Zhao, B.; et al. Risk assessment of refinery unit maintenance based on fuzzy second generation curvelet neural network. Alex. Eng. J. 2020, 59, 1823–1831.
- Zhao, B.; et al. Maintenance decision methodology of petrochemical plant based on fuzzy curvelet neural network. Appl. Soft Comput. 2018, 69, 203–212.
- Orazbayev, B.; et al. Decision Making for Control of the Gasoline Fraction Hydrotreating Process in a Fuzzy Environment. Processes 2024, 12, 669. [CrossRef]
- Muhsin, W.; Zhang, J. Multi-Objective Optimization of a Crude Oil Hydrotreating Process with a Crude Distillation Unit Based on Bootstrap Aggregated Neural Network Models. Processes 2022, 10, 1438.
- Ghosh, D.; et al. Application of data-driven modeling approaches to industrial hydroprocessing units. Chem. Eng. Res. Des. 2022, 177, 123–135.
- Ta, S.; et al. Data-Driven Multi-Objective Optimization of an Industrial Hydrotreater Using a Multi-Output Gaussian Process Surrogate. Ind. Eng. Chem. Res. 2026, 65, 12743–12760.
- Yang, S.B.; et al. Bioinspired Encoder-Decoder Recurrent Neural Network with Attention for Hydroprocessing Unit Modeling. Ind. Eng. Chem. Res. 2023, 62, 18526–18540.
- Li, Z.M.; et al. PSO-Optimized Data-Driven and Mechanism Hybrid Model to Enhance Prediction of Industrial Hydrocracking Product Yields Under Data Constraints. Processes 2025, 13, 1118.
- Ta, S.; et al. A physics-informed modular neural network for yield prediction and operational optimization in industrial hydrocracking. Fuel 2027, 429, 140956.
- Al-Jamimi, H.A.; et al. Artificial intelligence approach for modeling petroleum refinery catalytic desulfurization process. Neural Comput. Appl. 2022, 34, 17809–17820.
- Al-Jamimi, H.A.; et al. Multiobjectives optimization in petroleum refinery catalytic desulfurization using Machine learning approach. Fuel 2022, 322, 124088.
- Al-Jamimi, H.A.; et al. An intelligent approach for the modeling and experimental optimization of molecular hydrodesulfurization over AlMoCoBi catalyst. J. Mol. Liq. 2019, 278, 376–384.
- Kurogi, T.; et al. Development of Catalyst Grading System for Diesel Hydrodesulfurization Using Machine Learning Techniques. J. Jpn. Pet. Inst. 2022, 65, 150–155.
- Xing, X.X.; et al. Biphasic interface engineering: A machine learning-guided strategy for optimizing selective oxidative desulfurization of FCC slurry oil. Chin. J. Catal. 2026, 84, 375–389.
- Faridi, F.; et al. Prediction of Nernst coefficient of S-containing compounds between fuel and ionic liquid phases in the extractive desulfurization using linear and SVM methods: QSPR-based machine learning. J. Taiwan Inst. Chem. Eng. 2024, 165, 105773.
- Barea-Sepúlveda, M.; et al. Integration of Vis-NIR spectroscopy and Machine learning for precise hydrotreating classification and monitoring in paraffin wax samples. Fuel 2027, 430, 141073.
- Yang, J.W.; et al. Multi-objective optimization and evaluation framework for coupled delayed coking and hydrocracking processes based on machine learning. Appl. Therm. Eng. 2026, 284, 129015.
- Jeong, Y.; et al. Optimal operation decision for atmospheric residue desulfurization using AI models and a genetic algorithm. Fuel 2027, 427, 139945.
- Zhou, Y.Q.; et al. A data-driven stochastic optimization framework for oil uncertainty: oil-centric hydroprocessing and hydrogen management. Chem. Eng. Sci. 2026, 332, 124107.
- Chen, S.Z.; et al. A synchronous data-driven hybrid framework for optimizing hydrotreating units and hydrogen networks under uncertainty. Comput. Chem. Eng. 2025, 198, 109050.
- Pang, Z.Y.; et al. Large language model-based multi-objective modeling framework for vacuum gas oil hydrotreating. Chin. J. Chem. Eng. 2025, 84, 133–145.
- Zhou, Y.Q.; et al. Modeling and optimization of refinery hydrogen management system considering hydroprocessing mechanisms and constraints. Chem. Eng. Sci. 2026, 321, 122861.
- Tanirbergenova, A.; Orazbayev, B.; Ospanov, Y. Hydrotreating unit models based on statistical and fuzzy information. Period. Eng. Nat. Sci. 2021, 9, 242–258.
- Orazbayev, B.B.; Ospanov, E.A.; Orazbayeva, K.N.; et al. Hybrid Method for the Development of Mathematical Models of a Chemical Engineering System in Ambiguous Conditions. Math. Models Comput. Simul. 2018, 10, 748–758.
- Attetkov, A.V.; Zarubin, V.S.; Kanatnikov, A.N. Optimization Methods: Textbook; RIOR, INFRA-M: Moscow, Russia, 2023; 270 p. (In Russian).
- Ma, Q. Machine learning-based optimization for catalytic sulfur removal: Computational modeling and analysis of fuel purification for reduction of environmental impacts. Case Stud. Therm. Eng. 2024, 53, 103835.
Figure 1.
First and last five rows of the generated dataset.

Figure 2.
Comparison of machine learning models based on 5-fold cross-validation results (R²).
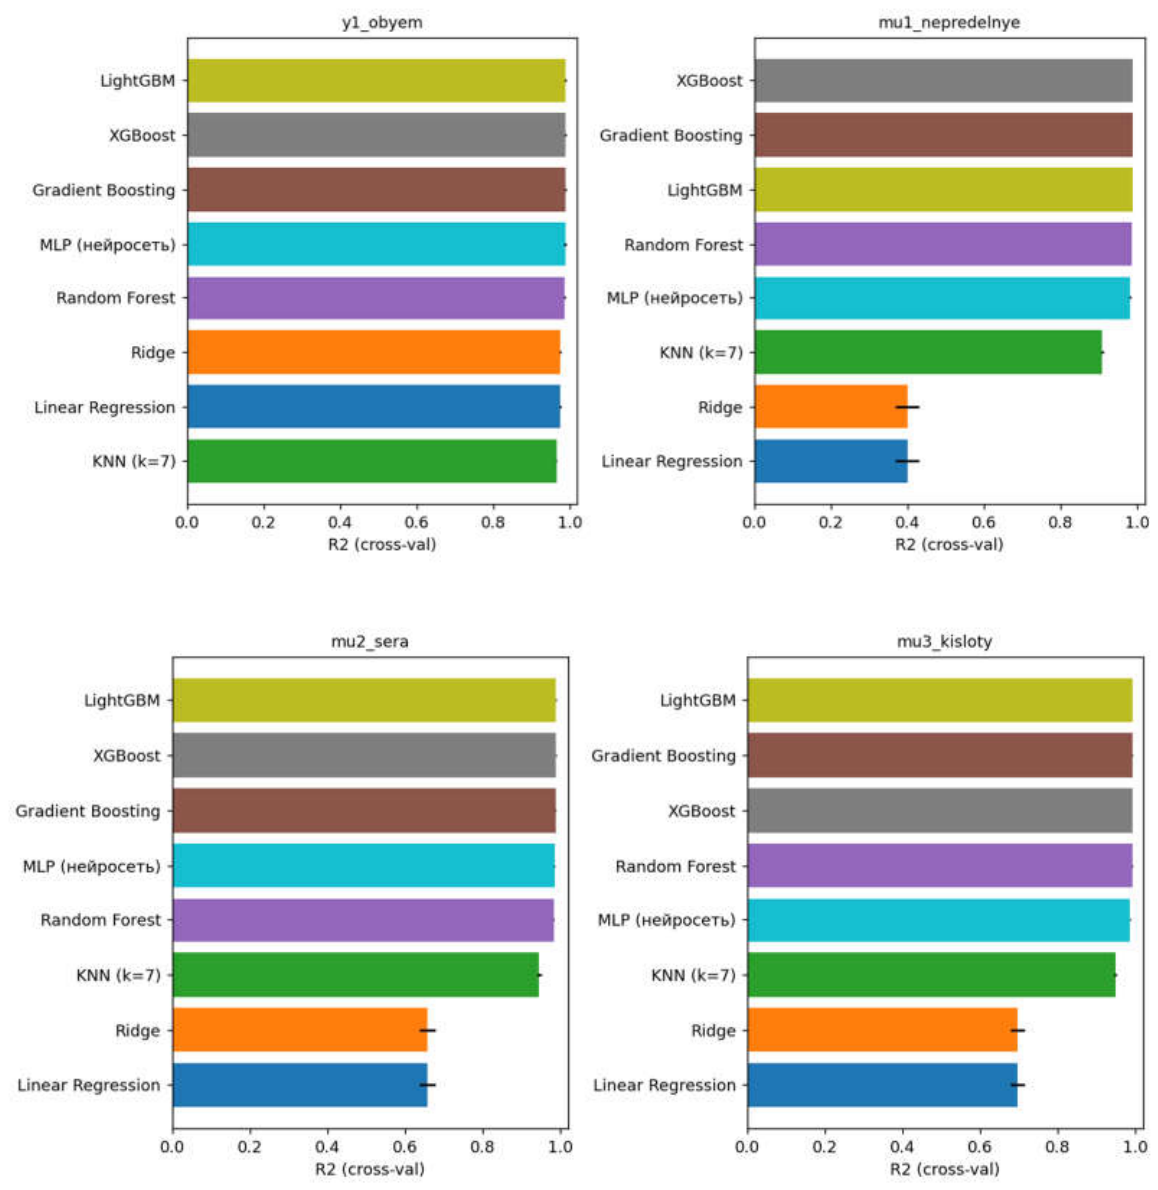
Figure 3.
Parity plots of actual (synthetic) versus predicted values of the reactor R-1 outputs on the test set.
Figure 3.
Parity plots of actual (synthetic) versus predicted values of the reactor R-1 outputs on the test set.
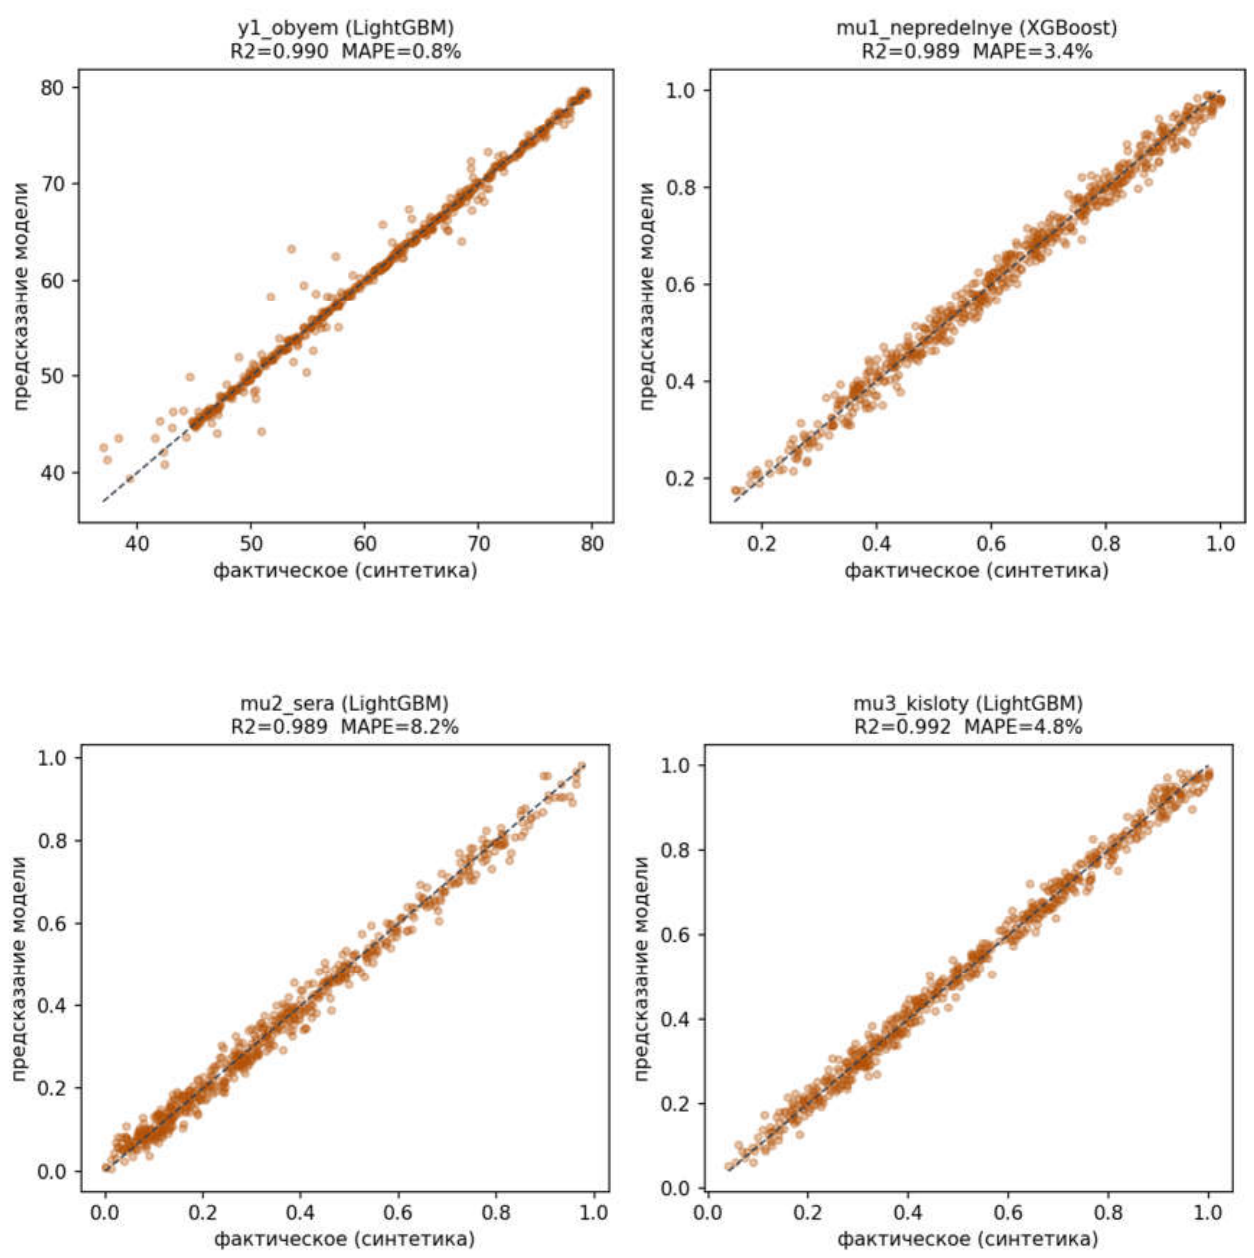
Figure 4.
Importance of the input parameters for the reactor R-1 outputs (permutation method).
Disclaimer/Publisher’s Note: The statements, opinions and data contained in all publications are solely those of the individual author(s) and contributor(s) and not of MDPI and/or the editor(s). MDPI and/or the editor(s) disclaim responsibility for any injury to people or property resulting from any ideas, methods, instructions or products referred to in the content. |
© 2026 by the authors. Licensee MDPI, Basel, Switzerland. This article is an open access article distributed under the terms and conditions of the Creative Commons Attribution (CC BY) license (http://creativecommons.org/licenses/by/4.0/).
Copyright: This open access article is published under a Creative Commons CC BY 4.0 license, which permit the free download, distribution, and reuse, provided that the author and preprint are cited in any reuse.