
Submitted:
02 November 2026
Posted:
05 November 2026
You are already at the latest version
Abstract
Insulin resistance has a key role in type 2 diabetes (T2D). However, there may be differences in transcriptomic associations of these phenotypes within different studies. Here we re-analysed data from GSE27951 and GSE20950 microarrays from adipose tissue to understand the differences in differential expression, find overlaps in differentially expressed genes and understand classification performance. We retrieved pre-processed microarray data from GSE27951 and GSE20950 using Affymetrix Human Genome U133 Plus 2.0 arrays from the Gene Expression Omnibus . We performed a differential expression between T2D and NGT (n = 10 vs 11 samples) and insulin resistant vs sensitive subcutaneous adipose tissue (IR vs IS)(n = 9 vs 10 samples). 3 samples were removed from GSE27951 as they had conflicting annotations. We performed differential expression using a probe-wise welch test. We performed false discovery rate correction using the Benjamini Hochberg method. We performed a threshold on the absolute difference in expression (log2(1.5)). Logistic regression was performed with feature selection and scaling to explore classification performance. We performed additional analysis to account for sex, perform permutation tests to understand significance of classification and look at alternative annotation. No probes met the FDR threshold of < 0.05 in T2D vs NGT. 13,124 probes met the FDR threshold of < 0.05 in IR vs IS. Once adding the effect size threshold no probes met the criteria in T2D and 3,501 probes were selected. Once adjusting for sex 3,356 probes were selected in IR. Cross validated classification using feature selection in training gave AUC values of 0.818 and 1.000 in T2D vs NGT and IR vs IS respectively. However, once performing permutation tests on classification using 100 label shuffles we found empirical p-values of 0.0495 and 0.0099. Changing the 3 conflicting annotations in GSE27951 did not give any probes meeting the FDR in T2D. The two cohorts produced substantially different differential-expression results under the implemented analytical workflow. The large IR-associated signal persisted after adjustment for sex, but technical confounding and differences between cohorts remain unresolved. Although internal cross-validation produced high AUC values, particularly for IR, these findings do not establish external predictive validity or identify clinically validated biomarkers. Further independent validation is required.
Keywords:
type 2 diabetes
; insulin resistance
; adipose tissue
; transcriptomics
; microarray
; differential expression
; machine learning
; reproducibility
1. Introduction
Type 2 diabetes is a complex metabolic disease involving insulin. Adipose tissue contributes to metabolic homeostasis through energy storage and endocrine signaling. Understanding the changes in expression occurring in adipose tissues can help to understand the biological processes occurring due to insulin resistance and diabetes. Microarrays can be used to understand transcriptomic data, allowing thousands of transcripts to be understood in terms of their expression levels simultaneously. This can be done using publicly available data sources such as the National Center for Biotechnology Information Gene Expression Omnibus [1]. However the interpretation of this data needs to consider many factors including sample composition, what the phenotypes are being defined as, normalisation methods, statistical thresholds and possible confounders. Insulin resistance and T2D are related but not the same. Individuals with insulin resistance may not be diabetic. Those with T2D will have varying lengths of disease, treatment, glycaemic control etc. This means that the transcripts may not be differentially expressed in the same way. Previous investigations have looked at gene expression associated with insulin resistance from GSE20950 and other adipose data [3]. However, this investigation focuses on a methodological re-analysis. We aimed to understand if there were significant differences in probe expression between the two public cohorts using a common statistical approach. To understand if there were any common probes and whether they shared the same direction. To understand if the pre-processing expression data can be used to classify the phenotypes using cross validation. Additional sensitivity analyses were performed to adjust for sex, understand the significance of classification using permutation tests and account for uncertainty in 3 annotations.
2. Material and Methods
This study is a secondary analysis of two publicly available GEO datasets. GSE27949, the Affymetrix gene-expression subseries of GSE27951, contains human subcutaneous adipose tissue samples from individuals with normal glucose tolerance, impaired glucose tolerance, and diabetes [8]. Only human subcutaneous adipose tissue was eligible to analyse. 10 T2D and 11 NGT samples were included in the main analysis. 9 samples with IGT were included but only for descriptive purposes. 9 IR and 10 IS samples were included from GSE20950 [7]. Adipose tissue was from obese individuals. Omental and subcutaneous samples were included but only subcutaneous samples were included to ensure the same tissue. Both were analysed using Affymetrix Human Genome U133 Plus 2.0 arrays (GPL570). Each cohort was analysed separately.
For GSE27951, participants were categorized according to the original study's glucose-tolerance annotations as having normal glucose tolerance (NGT), impaired glucose tolerance (IGT), or diabetes (DM), with the DM category used as the type 2 diabetes (T2D) group in this analysis. For GSE20950, the insulin-resistant (IR) and insulin-sensitive (IS) classifications were obtained from the original study metadata. The present analysis did not independently reclassify participants using clinical measurements.
Participant IDs and metadata were retrieved from GEO. Non-human participants were excluded. Samples were excluded if they were not the correct tissue compartment. 3 participants were excluded from GSE27951 (GSM691135, GSM691139, GSM691140) as they had conflicting annotations in the title and clinical status. 2 sensitivity analyses were performed. One using the sample title to define phenotypes and one using the clinical status to define phenotypes. Both analyses gave no FDR significant probes in T2D vs NGT. All decisions were recorded in the exported metadata.
Pre-processed expression data was retrieved from GEO using Python and GEOparse. For GSE27949, the deposited sample records describe normalization using Affymetrix Microarray Suite 5.0 (MAS 5.0), followed by additional robust multi-array average (RMA) processing [8]. The deposited expression values are labeled as RMA-normalized and are consistent with a log2 expression scale. Only samples with IDs within the participant IDs were included. Probes with missing values, Affymetrix control probes and probes with effectively zero variance were excluded. 54613 probes were included for each comparison. Boxplots were plotted to understand the distribution of the expression data. Principal component analysis was performed to understand the key patterns of expression. As pre-processed expression matrices were used from the deposited data the results will depend on the pre-processing performed. The data was not independently normalised or fully accounted for technical batch effects.
A two-sided welch t-test was performed on each probe to understand if there was a difference between the two phenotypes. The main comparison was T2D vs NGT from GSE27951. The main comparison was IR vs IS from sub-cutaneous samples in GSE20950.Multiple hypothesis testing was performed using the Benjamini Hochberg method [2]. The main significance threshold was an FDR of < 0.05. An additional effect-size criterion required an absolute difference in mean processed expression of at least log2(1.5), approximately 0.585. This threshold corresponds to an approximately 1.5-fold difference if the analyzed expression values are log2-transformed. The number of FDR significant probes and those meeting the statistical and effect size threshold were noted. The differences in expression were not interpreted as causal.
Probes were compared across the differentially expressed lists. Probes were only considered common if they met the FDR and effect size thresholds in both cohorts. The effect difference was also compared. However as different phenotypes and samples were being analysed this could not be directly replicated.
Logistic regression models were created for T2D vs NGT and IR vs IS. A standardised pipeline was used to select the top 50 probes based on ANOVA [5]. These were standardised and logistic regression performed. Stratified 5-fold cross validation was performed using shuffled folds and a random seed of 42 [5]. Feature selection, standardisation and model fitting were performed in each fold. Out-of-fold predicted probabilities were obtained for each participant. ROC AUC and balanced accuracy were calculated to evaluate internal classification performance. Approximate bootstrap confidence intervals were calculated by resampling the saved out-of-fold predictions. These intervals do not account for uncertainty introduced by model retraining and do not estimate performance in an independent population. No external validation was performed.
An additional analysis was performed to adjust for sex. Sex was included as a covariate. The number of probes were compared to the un-adjusted analysis to understand if the large effect size was removed. This does not account for any unmeasured confounders, technical batching or clinical variables.
Permutation tests were performed to understand significance. 100 permutations were performed. The classification tool was run using the shuffled labels.The AUC was compared to the distribution of the permutation samples to find the empirical p-value.The permutation tests assessed whether the observed classification performance exceeded that expected under randomly assigned labels. However, they do not establish external generalizability or rule out technical confounding.
The analysis was reconstructed in a new Python/Jupyter workflow because the scripts from the earlier version of the project were no longer available. All results reported in this manuscript were generated from the reconstructed workflow and its supplementary audit analyses.
3. Results
There were 21 participants included in the main analysis. 10 T2D and 11 NGT. 19 subcutaneous adipose samples were included in the IR vs IS comparison. 9 IGT samples were included in the full human sample from GSE27951 but were not included in the binary analysis. 54613 probes were included after filtering.
These boxplots show the distribution of the pre-processed expression data. This can give an indication of large differences in expression between samples however does not show there were no technical batch effects.
Principal component analysis was performed to get an exploratory understanding of how the expression data differed between samples. However we did not account for all possible technical or clinical confounders so cannot say the differences were only due to the disease phenotype.
In the T2D-versus-NGT comparison, 3,866 probes had nominal p-values below 0.05, but none met the FDR threshold of 0.05.
A large difference was found between the 2 analyses. However there were differences in how the phenotypes were defined, samples included, pre-processing performed and technical factors meaning we cannot relate them to the relative biological effect of insulin resistance and diabetes.
In the IR-versus-IS comparison, 20,185 probes had nominal p-values below 0.05, of which 13,124 met the FDR threshold of 0.05. After applying the additional effect-size criterion, 3,501 probes remained selected.
No probes met the criteria in T2D so no common probes were found.
This was due to the statistical criteria. This does not indicate that there are no common molecular mechanisms between the phenotypes.
Visualisation was performed to understand the differences in expression between probes included in both studies. This gives an indication of the direction of the effect but as no probes were selected in T2D there are no statistically supported common discoveries.
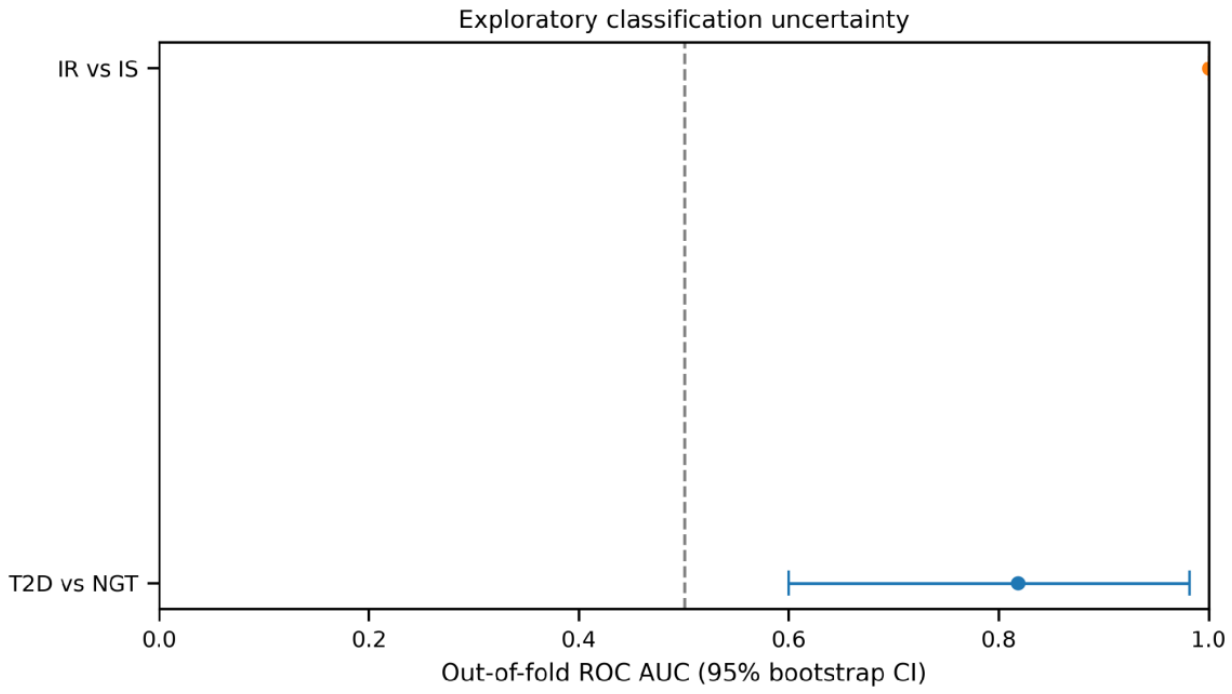
The T2D model achieved an AUC of 0.818 and balanced accuracy of ~0.764.
The IR model achieved an AUC of 1.000 and balanced accuracy of 1.000.
The IR model appears to have achieved perfect separation. However this should be interpreted with caution as there were only 19 samples. The model also performed validation within the same study population used in the training folds. Approximate bootstrap confidence intervals were calculated. The T2D model had a confidence interval of 0.600-0.982 and the IR model had a confidence interval of 1.000-1.000.
This does not indicate the models achieved perfect performance in new patients. The IR bootstrap confidence interval was degenerate at an AUC of 1.000 as the out of fold predictions stored were perfectly separating between the two groups in this 19 sample cohort. This therefore does not show that the model will have perfect performance on unseen patients and does not take into account uncertainty caused by retraining the model.
The unadjusted IR analysis identified 3501 probes meeting the criteria. After including sex in the model 12031 probes met the FDR threshold of < 0.05 and 3356 probes met the criteria. This indicated that adjusting for sex did not remove the large number of probes. However does not indicate the same individual probes were selected or there were no other confounders.
The observed AUC for the T2D model was 0.818. This was higher than most of the values from the 100 label permutations giving an empirical p-value of 0.0495. The observed AUC for the IR model was 1.000 giving an empirical p-value of 0.0099. This indicates that unlikely the results occurred by chance. However there were only a small number of permutations so the p-values are not very accurate. No external validation was performed.
Three GSE27951 samples (GSM691135, GSM691139, and GSM691140) had conflicting phenotype annotations and were excluded from the primary T2D-versus-NGT analysis (10 T2D and 11 NGT samples). In the title-based sensitivity analysis, GSM691135 was classified as NGT, GSM691139 as T2D, and GSM691140 as IGT, producing 11 T2D and 12 NGT samples. In the clinical-status-based sensitivity analysis, GSM691135 and GSM691140 were classified as T2D, while GSM691139 was classified as IGT, producing 12 T2D and 11 NGT samples. Thus, each sensitivity analysis included two additional samples in the binary comparison, while the third was assigned to IGT and excluded. Neither sensitivity analysis identified FDR-significant probes.
4. Discussion
An exploratory re-analysis of the 2 public subcutaneous adipose tissue cohorts identified a large difference in differential expression. No probes met the criteria for T2D vs NGT using this methodology. However thousands of probes met the criteria for IR vs IS. After adjusting for sex there was still a large effect size in IR. Good classification performance was seen within each cohort. Particularly in the IR. This should not be interpreted as insulin resistance causing more disruption to transcription than T2D. Different individuals, clinical definitions and original study conditions meant there could be differences in power, variation in expression, sample selection and pre-processing.
A large number of probes were associated with IR. Adjusting for sex reduced the number of probes from 3501 to 3356. The large number of selected probes persisted after adjustment for sex, although residual confounding by sex and other clinical or technical variables cannot be excluded. The original study for GSE20950 looked at obese individuals specifically selected to compare the IR and IS phenotypes reducing the difference in BMI [3]. This is a useful scenario to look at the expression associated with insulin resistance. However this does not fully account for all possible variations. As the data was not independently pre-processed and there was no verified batch adjustment model the exact number of probes selected should be considered dependent on the pipeline.
Cross validation was performed with feature selection and standardisation in each training fold. This reduces 2 common data leakages. However the high performance does not indicate any clinical usefulness. The perfect AUC for IR is very susceptible to uncertainty as there were only 19 samples. Whilst the permutation test indicates it was unlikely to happen by chance the model may be taking advantage of specific features in the cohort which would not be generalisable to independently recruited individuals. The classification results should be considered exploratory showing there are patterns in the pre-processed expression data associated with the study labels.
The fact no probes met the criteria does not indicate adipose tissue isn’t affected by diabetes. The sample size was small and over 54000 probes were tested. There may not have been enough power to detect small effects due to multiple testing corrections. The cohort also had a range of clinical and metabolic factors. There were also several conflicting phenotype annotations in the original metadata. Whilst there were 2 alternative ways to label the samples and no probes met the criteria this does not provide strong evidence for robustness to this specific analysis. It does not indicate there was a null result biologically.
Previous work has been performed on GSE20950 looking at gene expression associated with insulin resistance. Whilst this re-analysis does not claim to have identified any novel biological mechanisms it does provide transparency by comparing 2 similar but different phenotypes, using a documented pipeline and performing sensitivity analysis. The large difference in number of probes indicates how conclusions can vary depending on the cohort composition.
There are several limitations to this investigation. Firstly the sample size was small for both comparisons. The cohorts were also not matched. Secondly the data was taken from pre-processed expression data from GEO. The CEL file was not independently pre-processed and full technical batching was not present. Thirdly differential expression was performed using a probe-wise welch test. This is not a moderated linear model specifically for microarray data which may impact the power and number of probes selected [4]. Fourthly only 1 measured covariate was adjusted for. There could be other clinical and technical factors affecting the expression. Fifthly there were 3 samples with conflicting phenotype annotations in GSE27951. These were excluded and alternative labelling was performed. However there was no definitive answer to the conflicts. Sixthly classification was only validated using cross validation. The bootstrap confidence intervals were performed using sampling of the saved out of fold predictions. This does not fully account for the uncertainty due to retraining. Lastly the data from the 2 datasets are related but different clinical phenotypes meaning they cannot be considered equivalent disease definitions or external validation for each other.
Pre-process raw arrays. Explore batch and clinical covariates. Conduct differential expression analysis using moderated linear modelling techniques (e.g. limma) with appropriate covariates and sensitivity analysis. More independent subcutaneous adipose datasets will be required to validate results. In the future, a predictive model should be developed using a locked pipeline and independent dataset with analogous phenotyping.
5. Conclusions
A re-analysis of two human subcutaneous adipose tissue microarrays yielded very different results in terms of differential expression. There were no probes found below the defined FDR threshold when comparing T2D and NGT. However there were thousands of probes selected when comparing IR vs IS, even after adjusting for sex. Classifiers were developed using internal cross validation to distinguish between the phenotypes. However due to the small cohort size, un-resolved technical confounders and lack of external validation, they are not clinically useful. This shows why it is important to appropriately annotate samples, correct for multiple testing, perform sensitivity analysis and be transparent when reporting transcriptomic results from public datasets.
Ethics Statement
This study was a secondary analysis of publicly available data. No new human subjects were recruited or new biological samples obtained.
Data and Code Availability: Data used in this study can be accessed from the NCBI Gene Expression Omnibus database. Accession numbers: GSE27949 (SuperSeries: GSE27951) and GSE20950. Scripts are no longer available. Analysis performed in this manuscript was done using a Python/Jupyter pipeline. This pipeline is not currently publicly available.
Supplementary Materials
The supplementary information can be downloaded at the website of this paper posted on Preprints.org
References
- Barrett, T.; Wilhite, S.E.; Ledoux, P.; et al. NCBI GEO: archive for functional genomics data sets—update. *Nucleic Acids Res.* 2013, 41(D1), D991–D995. [Google Scholar] [CrossRef]
- Benjamini, Y.; Hochberg, Y. Controlling the false discovery rate: a practical and powerful approach to multiple testing. *J. R. Stat. Soc. Ser. B* 1995, 57(1), 289–300. [Google Scholar] [CrossRef]
- Hardy, O.T.; Perugini, R.A.; Nicoloro, S.M.; Gallagher-Dorval, K.; Puri, V.; Straubhaar, J.; et al. Body mass index-independent inflammation in omental adipose tissue associated with insulin resistance in morbid obesity. *Surgery for Obesity and Related Diseases*. 2011, 7(1), 60–67. [Google Scholar] [CrossRef]
- Ritchie, M.E.; Phipson, B.; Wu, D.; Hu, Y.; Law, C.W.; Shi, W.; Smyth, G.K. limma powers differential expression analyses for RNA-sequencing and microarray studies. *Nucleic Acids Res.* 2015, 43(7), e47. [Google Scholar] [CrossRef]
- Pedregosa, F.; Varoquaux, G.; Gramfort, A.; et al. Scikit-learn: Machine Learning in Python. *J. Mach. Learn. Res.* 2011, 12, 2825–2830. [Google Scholar]
- NCBI Gene Expression Omnibus. GSE27951: Gene-chip studies of adipogenesis-regulated microRNAs in mouse primary adipocytes and human obesity. Available online: https://www.ncbi.nlm.nih.gov/geo/query/acc.cgi?acc=GSE27951](https://www.ncbi.nlm.nih.gov/geo/query/acc.cgi?acc=GSE27951.
- NCBI Gene Expression Omnibus. GSE20950: Expression data from human adipose tissue using an expanded patient cohort. Available online: https://www.ncbi.nlm.nih.gov/geo/query/acc.cgi?acc=GSE20950](https://www.ncbi.nlm.nih.gov/geo/query/acc.cgi?acc=GSE20950.
- NCBI Gene Expression Omnibus. GSE27949: Gene-chip studies of adipogenesis-regulated microRNAs in mouse primary adipocytes and human obesity (Affymetrix). Available online: https://www.ncbi.nlm.nih.gov/geo/query/acc.cgi?acc=GSE27949.
Figure 1.
Expression Distribution Quality Control (GSE27951 and GSE20950).
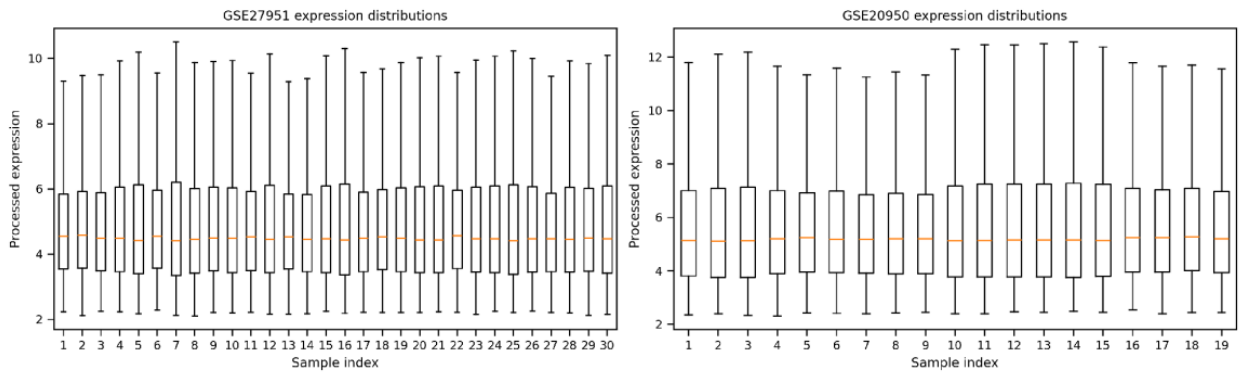
Figure 2.
Principal Component Analysis of GSE27951.
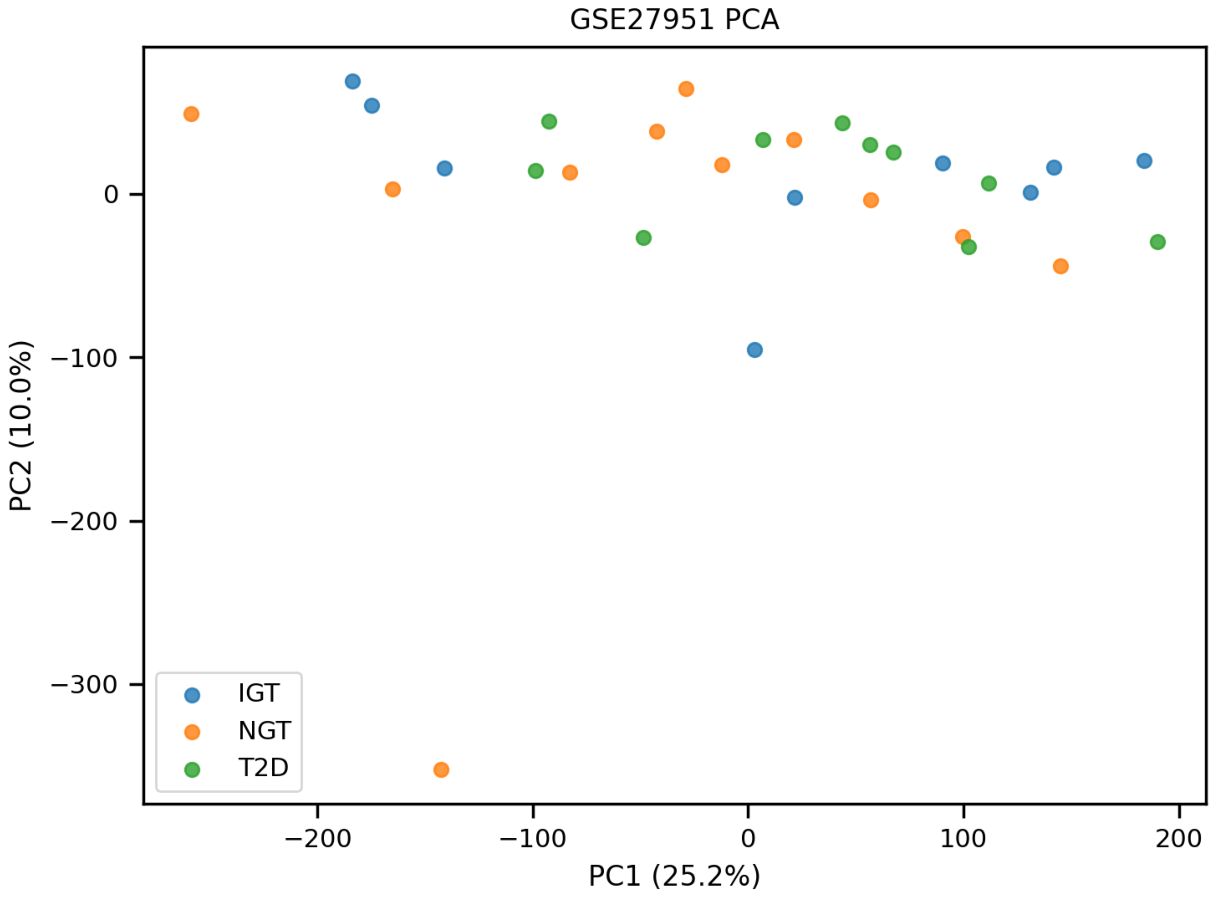
Figure 3.
Principal Component Analysis of GSE20950.
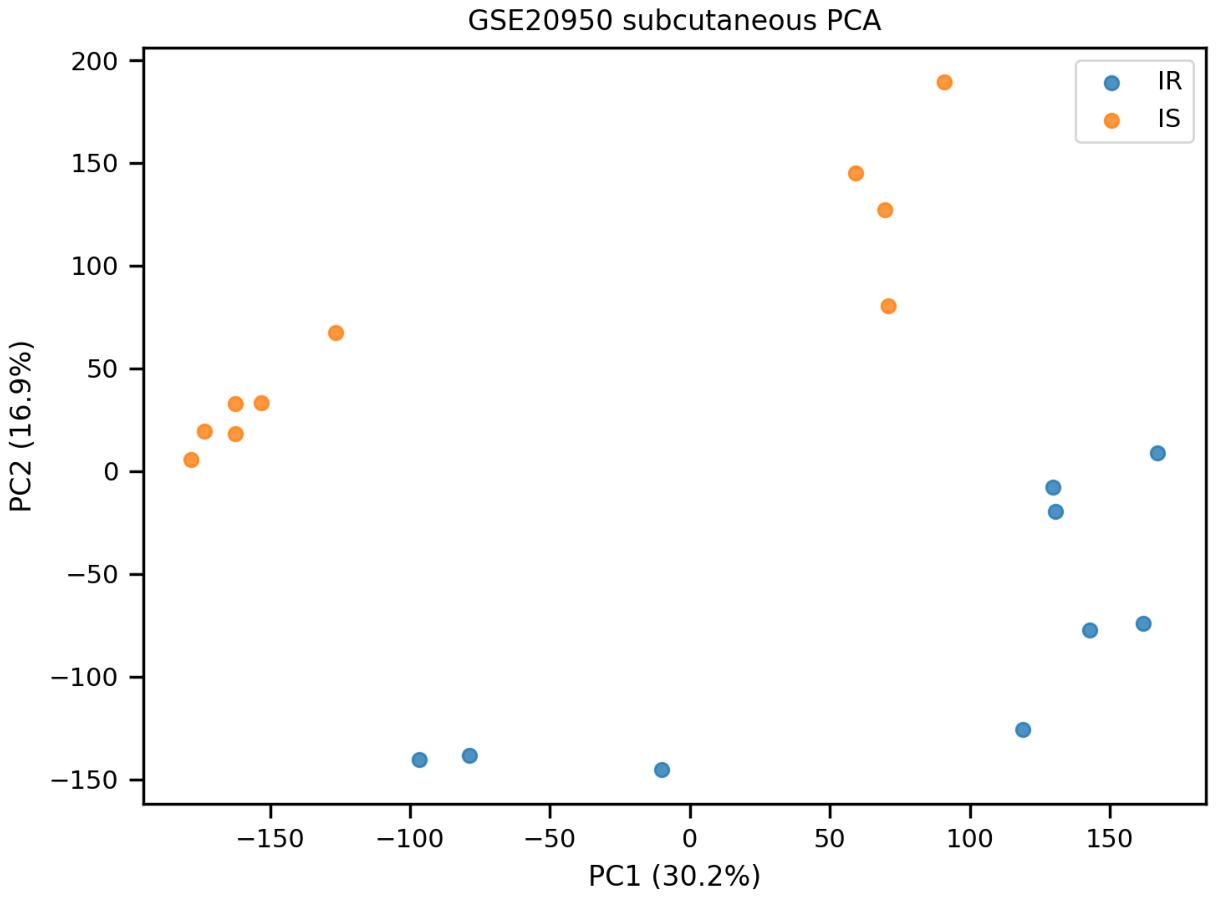
Figure 4.
Differential Expression in Type 2 Diabetes vs. Normal Glucose Tolerance.
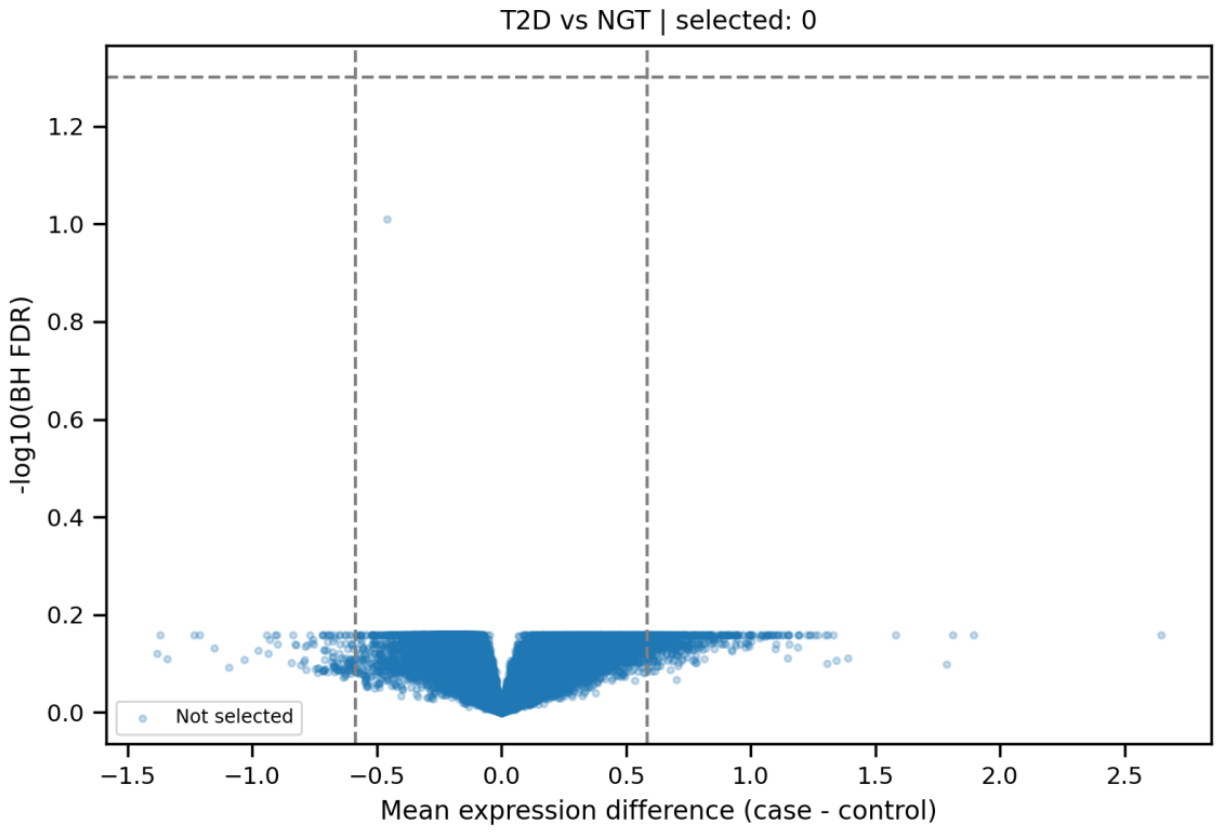
Figure 5.
Differential Expression in Insulin-Resistant vs. Insulin-Sensitive Adipose Tissue.
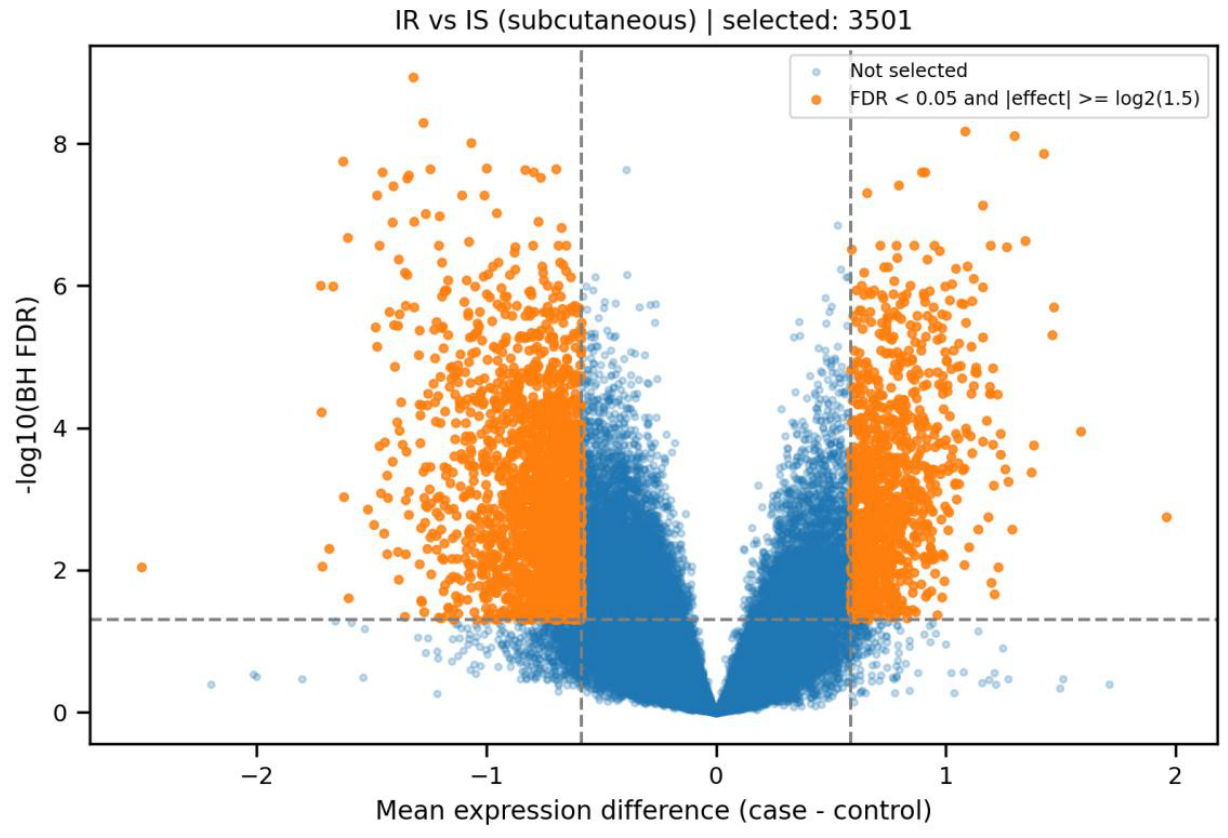
Figure 6.
Overlap of Differentially Expressed Probes Between Cohorts.
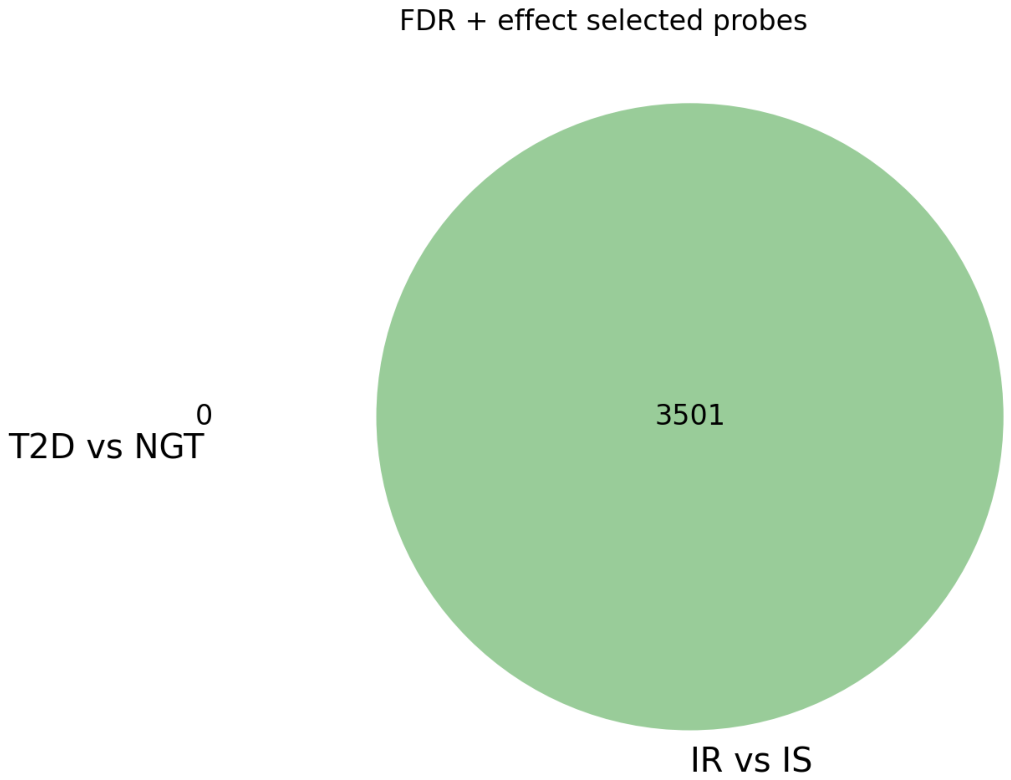
Figure 7.
Cross-Cohort Comparison of Gene Expression Differences.
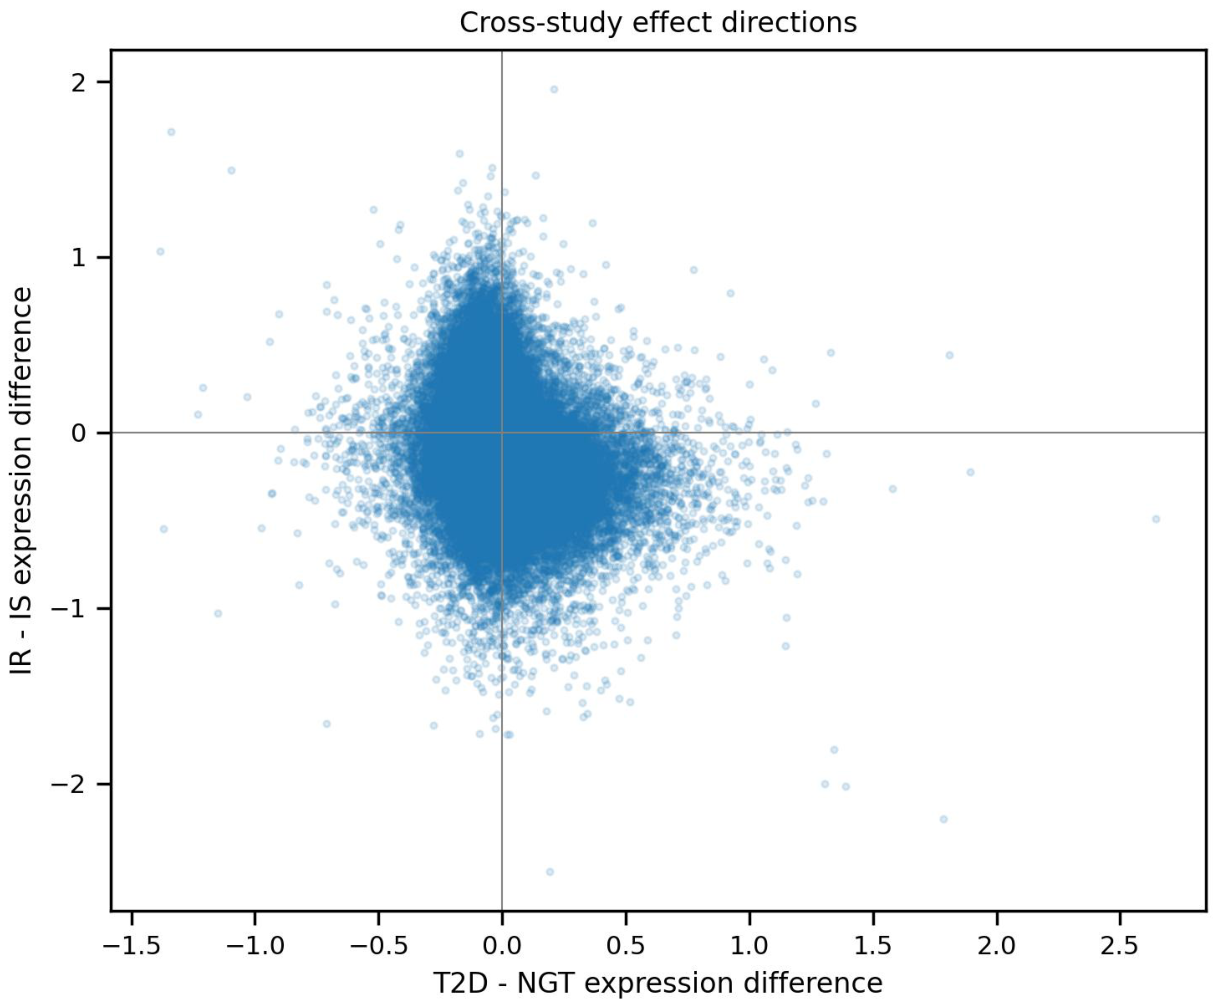
Figure 8.
ROC Curve for Type 2 Diabetes Classification.
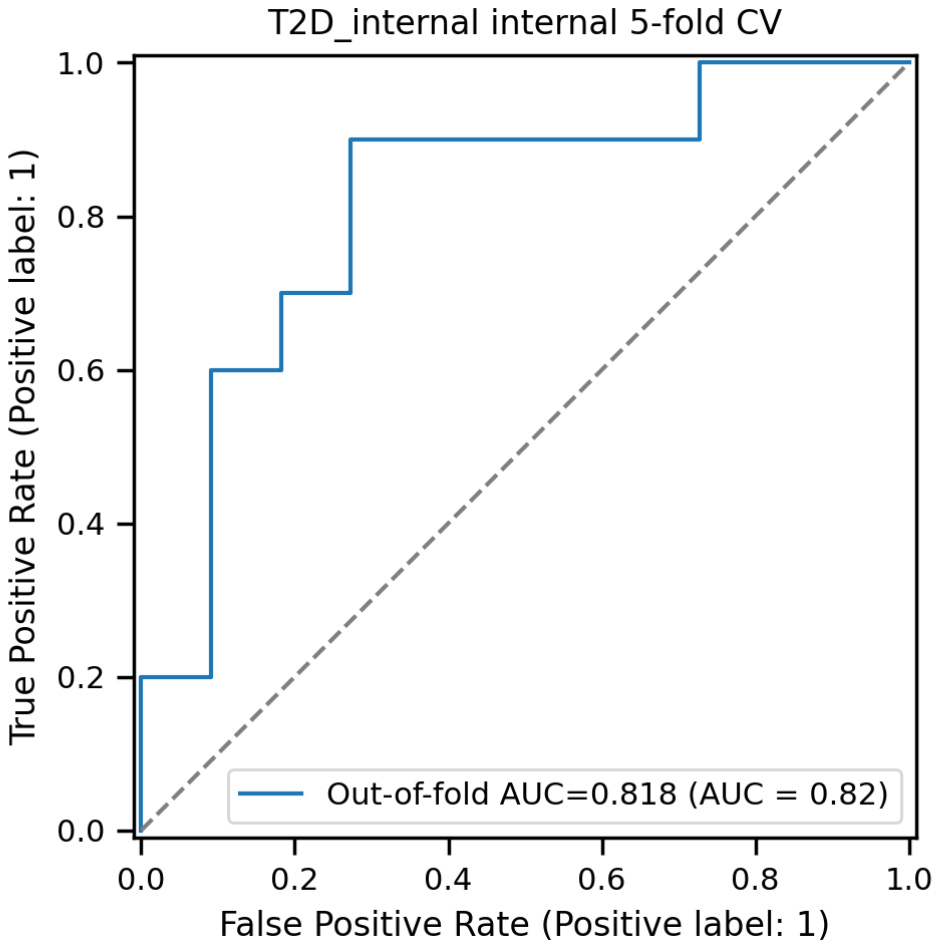
Figure 9.
ROC Curve for Insulin Resistance Classification.
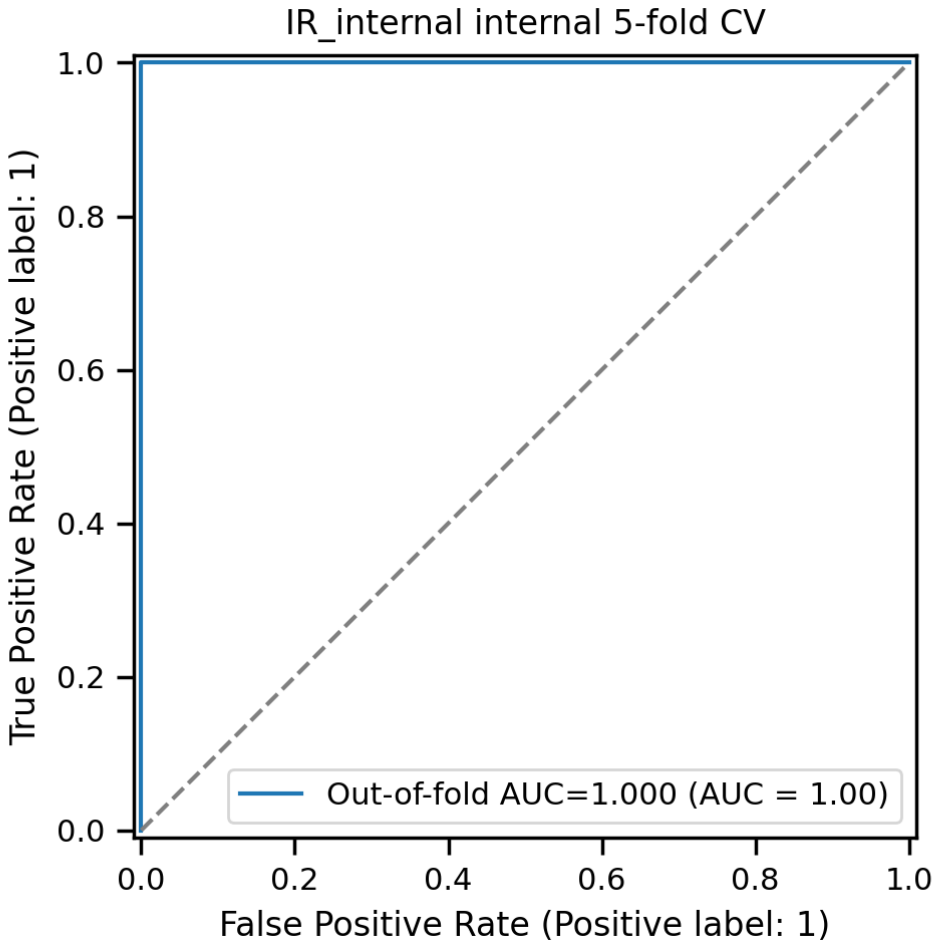
Figure 10.
ROC AUC Estimates and 95% Bootstrap Confidence Intervals.
Disclaimer/Publisher’s Note: The statements, opinions and data contained in all publications are solely those of the individual author(s) and contributor(s) and not of MDPI and/or the editor(s). MDPI and/or the editor(s) disclaim responsibility for any injury to people or property resulting from any ideas, methods, instructions or products referred to in the content. |
© 2026 by the author. Licensee MDPI, Basel, Switzerland. This article is an open access article distributed under the terms and conditions of the Creative Commons Attribution (CC BY) license.
Copyright: This open access article is published under a Creative Commons CC BY 4.0 license, which permit the free download, distribution, and reuse, provided that the author and preprint are cited in any reuse.