
Submitted:
03 November 2026
Posted:
05 November 2026
You are already at the latest version
Abstract
Pore-environment adjustment occurs during continuous flow in fine-grained sandstone, yet NMR, CT and SEM responses are not one-to-one. Montmorillonite-bearing sandstone was studied: 12 cores matched by porosity and gas permeability from 60 samples were divided into four flow levels (0.1, 0.5, 1.0 and 1.5 mL/min), with three parallel cores in each group. White oil (4.5 mPa·s) was flowed at 40 °C and 5 MPa. NMR and CT were measured at 2, 4, 6 and 8 h after saturation, and SEM was performed before and after flow. Group means show short relaxation rising and long relaxation falling continuously, with changes at the same time point generally increasing with flow rate. At 8 h, the relative change rate of short relaxation increased from 6.31% to 70.86%, long-relaxation attenua-tion from 6.26% to 62.91%, the CT small-pore fraction increased by 0.89–17.46 percentage points, and the large-pore fraction decreased by 1.81–22.32 percentage points. In high-er-flow groups, relaxation peaked at 4 h and CT pore proportion at 6 h. Even after nor-malizing for cumulative fluid volume, higher-flow groups responded more strongly. These trends support particle release, redistribution and local retention, and the parallel design strengthens the flow-rate–pore-response correlation.
Keywords:
heavy oil reservoir
; microparticle migration
; flow rate
; nuclear magnetic resonance
; CT pore structure
1. Introduction
Heavy oil reservoir is an important resource base for stable crude oil production, but its reservoirs are generally characterized by loose cementation and high content of fine-grained minerals. During the development process, fluid seepage is easy to induce particle desorption, migration and redistribution, resulting in local pore throat blockage and decreased seepage capacity, which in turn affects cold production, water injection development and long-term capacity maintenance of the reservoir [1]. The buried depth of Jin 17-30 reservoir is 800~1000m, which is dominated by siltstone and intercalated with limestone. The natural porosity is 31.1%~38.1%, and the permeability is 112.8~1467.3mD. The content of clay component is high and montmorillonite is dominant, which has the material basis for particle migration. The change of flow rate can change the hydrodynamic conditions in porous media, and then affect the start-up, transport and capture process of particles. However, its specific influence on the pore environment is not only determined by the flow intensity, but also closely related to the particle properties and pore throat structure[2]. Therefore, it is of great significance to clarify the relationship between particle migration and pore environment evolution in heavy oil reservoirs under different flow conditions for understanding the seepage damage mechanism of loose reservoirs, optimizing injection-production parameters and formulating sand control measures.
Focusing on the migration and damage mechanism of reservoir particles, domestic and foreign scholars have carried out systematic research on particle release, medium transport and multi-scale characterization. In terms of the particle release mechanism, Yuan et al. [3] analyzed the effects of temperature and salinity on particle desorption by combining atomic force microscopy measurements with extended DLVO (XDLVO) theory. Li et al. [4] used a TiO2–glycoside–zirconium nanocomposite to inhibit particle release during water flooding in clayey sandstone. Based on the DLVO model, Muneer et al. [5] predicted the critical salinity for the initiation of particle migration before and after nano-treatment. These studies have deepened the understanding of particle release conditions from the perspective of particle surface force and external environmental regulation [6]. In particle transport through porous media, the classical colloid model describes the mechanisms of particle attachment, filtration, and exclusion [7]. Han et al. [8] revealed the controlling effect of seepage velocity on pore-plugging growth and permeability decline. Loi et al. [9] established a data-processing method for productivity decline that accounts for particle migration, thereby extending related research to macroscopic seepage response and production performance analysis. Zhou et al. [10] systematically reviewed research on particle migration in loose sandstone reservoirs, providing a reference for theoretical development and engineering applications in this field. In terms of experimental characterization, NMR, CT, and SEM provide multiscale observation methods based on pore-fluid relaxation response, internal-structure imaging, and microstructure, respectively [11,12]. Jia Hu et al. [13] and Han Chao et al. [14] applied nuclear magnetic resonance technology to the study of waterflooding processes and particle-migration-induced damage, thereby expanding the experimental methods for dynamic characterization of the reservoir pore environment. In general, the existing research has established the theoretical relationship between particle release, transport and reservoir seepage response, and provided a theoretical basis for revealing the particle migration process.
Important model basis and characterization methods. Recent sandstone experiments have also combined SEM with on-line NMR to observe changes in microstructure and pore structure [14].
However, there are still some deficiencies in the applicability of existing research and the experimental identification of flow effect under the condition of oil phase displacement in heavy oil reservoirs. First of all, many studies have focused on the effects of chemical conditions such as salinity and pH on particle release in aqueous phase systems [15]. However, there is still a lack of systematic experimental research on the relationship between particle migration and pore environment changes under oil phase flow conditions. Secondly, although the relationship between seepage velocity and pore plugging evolution and permeability attenuation has been paid attention to, it is still difficult to fully judge the repeatability of the results based on the laws obtained from single core or limited repeated experiments. At the same time, the flow rate and the cumulative liquid flow rate affect the displacement process together. If there is no comparison under the condition of equal cumulative liquid flow rate, it is difficult to distinguish the influence of flow rate change and particle continuous migration. Finally, although NMR, CT and SEM have been used to study the pore structure and particle migration damage of reservoirs, how to combine the observation results of different scales to identify the changes of pore environment and the extent to which different characterization results can confirm each other for the oil phase displacement process still need further study. The above shortcomings make it difficult to fully explain the influence of flow rate changes on particle migration and pore environment evolution under oil phase displacement conditions. Therefore, it is necessary to carry out parallel core experiments on the basis of controlling the difference of initial physical properties of cores, analyze the flow effect by comparing the equal cumulative liquid flow rate, and establish the connection between multi-scale observation evidence in combination with NMR, CT and SEM, so as to improve the reliability of experimental conclusions and their ability to interpret target reservoirs.
In view of the above problems, this paper takes the heavy oil reservoir of Jin 17-30 block as the research object, selects the reservoir core and uses white oil to simulate the formation crude oil. Under the condition of unified temperature, pressure and fluid viscosity, four flow levels of 0.1, 0.5, 1.0 and 1.5 mL/min are set to study the response law of pore environment under different flow conditions. A total of 12 cores with similar initial porosity and gas permeability were selected from 60 samples. They were stratified and paired according to three blocks, and randomly assigned to four flow levels. Three independent parallel cores were set up at each flow level to reduce the interference of core initial physical property differences on inter-group comparison. Combined with NMR, CT and SEM, 8 h displacement experiment and multi-scale characterization were carried out, and the influence of flow change and cumulative liquid flow degree on the response of pore environment was distinguished by comparative analysis under the condition of equal cumulative liquid flow. On this basis, the similarity criterion analysis is carried out from the aspects of geometric scale, reservoir physical properties, flow dynamics and boundary conditions to evaluate the applicability of indoor experiments to the actual flow conditions of the target reservoir. The main innovation of this paper is to construct an experimental analysis framework with better repeatability between flow change and pore environment response of heavy oil reservoir by combining parallel core experiment of layered matching, equal cumulative liquid volume control with NMR, CT and SEM multi-scale characterization. The scope of application of the experimental results is clarified by similarity criterion analysis, which provides experimental basis for understanding particle migration and pore environment evolution under oil phase displacement conditions, and also provides reference for the optimization of injection-production parameters and the formulation of sand control measures for similar reservoirs in Jin 17-30 block.
2. Materials and Methods
2.1. Experimental Materials
The reservoir of Jin 10-11-3 well in Jin 17-30 block of the study interval is mainly siltstone with limestone. The burial depth is 800~1000m. There are 60 core samples, with porosity of 30.8% ~ 38.6%, with an average of 36.25%. The gas permeability is 271 ~ 307 mD, with an average of 283.27mD. According to porosity and gas permeability, 60 cores were stratified and screened, and three matching blocks were formed in the similar physical property range. One block was randomly assigned to four flow levels from each block, and finally 12 independent parallel cores were obtained.
The initial size and physical properties of 12 matching cores are shown in Table 1. Each flow group contains three independent cores, and the difference of macroscopic physical properties in the group is small. Calculated with the sample data, the average porosity of each group is about 37.77% ~ 37.90%, and the average gas permeability is about 283.0 ~ 283.3 mD. The initial physical properties between the groups are comparable.
2.2. Experimental Instruments
The experimental device and detection process are shown in Figure 1, including a constant current pump, an intermediate container containing white oil, pressure monitoring, a core holder placed in a thermostat, and a liquid collection and metering device. The detection branch is composed of NMR, CT and SEM, which is used to establish the oil-saturated reference, control the experimental conditions and obtain the relaxation, structure and morphology information. The flow path is constant flow pump→intermediate container→core holder→produced liquid metering. Each flow group adopts three independent parallel cores and performs the same oil saturation, liquid flow and stage detection process.
2.3. Experimental Principle
In this study, the flow rate was characterized by the flow intensity per unit cross-sectional area, and the pore environment was analyzed by NMR, CT and SEM. NMR mainly reflects the relaxation response of hydrogen-containing fluids. The partition is not directly equal to the aperture [16]; CT reflects the geometric composition of pores limited by resolution and segmentation rules. SEM provides clues to the morphology of particles and local pores, and does not undertake the quantification of migration quality. In order to reduce the individual difference of the core, the experimental samples are stratified and matched according to the porosity and gas permeability, and then the flow rate is randomly distributed. Three independent parallel cores were set for each flow rate, and the stage data were used to calculate the group mean and dispersion degree. Recent studies have also used NMR, mercury intrusion and Micro-CT to characterize the pore structure of sandstone, which provides a basis for information complementarity at different test scales [17].
The cross-sectional area A and the initial geometric pore volume were calculated according to the cylindrical sample. Vp and Darcy velocity u. Width according to the cylinder diameter d, porosity φ Take decimals. Cumulative injected pore volume multiples Npv Used to describe the degree of liquid, the calculation formula is :
In the equation, d, L are cm, Q is mL/min, t is h. Vp In mL. 60 in Equation (1) is used for time conversion. The cumulative injection amount is calculated according to the nominal constant current duration at the detection time point, and the pre-saturated injection amount is not included. At 8 h, 48,240,480 and 720 mL were injected into the four groups, corresponding to 5.01,24.30,49.67 and 75.47 PV, respectively.
(1) NMR and CT partition index
NMR was divided into short relaxation intervals according to the original. T2<1 ms, medium relaxation interval 1 ms≤T2≤100 ms and long relaxation interval T2>100 ms [13]. In this paper, the partition change data relative to the cesium oil benchmark are used, and the ' increase ' is recorded as positive and the ' decrease ' is recorded as negative. The relative change rate can be expressed as :
Ii is the i-th interval response. Ri is the rate of change relative to the initial value. Each interval denominator is different, three Ri There is no need to add up to zero, and the increase of short relaxation and the decrease of long relaxation cannot be used as the calculation of oil conservation.
CT adopts the proportion of small, medium and large pore partitions provided by the summary table. gi The sum of the three items in each stage is 100%. Proportion difference Δgi In percentage points, the change of relative initial proportion Ci In percentage terms :
Taking the 1.5 mL/min group as an example, the proportion of pores increased from 14.04% to 31.50%, an increase of 17.46 percentage points, and a relative increase of 124.36%. The two have different meanings. The proportion of CT reflects the change of partition composition under the established resolution and segmentation rules, which can not be converted into absolute pore volume, nor can it be determined that the real pore size is smaller or the large pores are blocked. NMR and CT are mainly used to compare the change direction, flow sorting and peak time points. Micro-CT research can analyze the changes of pore and throat geometric parameters in different water invasion stages through three-dimensional pore network model [18].
(2) The principle of image analysis and comparison
Representative values of 0.5 and 1.5 mL/min were selected. Spectrum, CT pore network diagram and four flow groups before and after SEM. SEM compares the skeleton boundary, surface fine particles and local pore openings ; due to the limitation of sampling and positioning in the front and rear fields of view, the amount of particle shedding is not calculated, and the similar morphology is not regarded as continuous tracking of the same particle. The relationship between mineral composition and pore type can also be analyzed by XRD and SEM, and is complementary to NMR and Micro-CT pore distribution characterization [19].
The quantitative results were mainly based on the mean value of parallel samples in the flow group, and the standard deviation was used to represent the degree of dispersion within the group. Image data are used to supplement the representative morphology and spectrum. The comparison included the order of groups at the same time point, the stage change and the equal volume of liquid contrast. The data of the stage belong to the same core continuous observation and cannot be repeated independently. Repetition between independent cores is used to estimate inter-group repeatability [20]. The initial porosity and gas permeability are used to determine the degree of sample matching.
(3) Similarity criterion
The similarity criterion is a bridge between the indoor experimental model and the actual field system, which ensures that the experimental phenomena are similar to the formation phenomena in physical mechanism. In this paper, the judgment basis is established from four aspects : geometric similarity, dynamic similarity, physical property similarity and boundary condition similarity. Geometric similarity requires that the size of the experimental model and the reservoir scale should be scaled proportionally, and the relationship between the flow path length and the pressure drop should be similar. The dynamic similarity requires the flow velocity, temperature, pressure and other characteristic quantities to make the particle stress mechanism consistent ; the similarity of physical properties requires that the core porosity, permeability, clay content and mineral composition are consistent with the reservoir. Similar boundary conditions require that the inlet pressure, outlet pressure and temperature correspond to the formation conditions.
The basis for the simulation of heavy oil by white oil lies in the physical correlation between the two : white oil is a mixture of alkanes, which is non-polar oil phase with heavy oil, similar to the wetting mode and interface effect of rock, and does not react with clay minerals. The main control variable of chemical factor interference and outburst flow rate can be eliminated. The viscosity-temperature sensitivity of white oil is strong. By setting multi-stage viscosity (2~15 mPa·s) and combining with temperature control (40~120°C), the equivalent mobility state of heavy oil in the formation temperature range ( formation crude oil viscosity 3802~54351 mPa·s) can be covered under the experimental conditions, and the equivalent matching of mobility and hydrodynamic force of particles can be realized. The main experiment in this paper adopts 4.5 mPa·s white oil and 40°C conditions, which is at the medium level of the above multi-level design.
The experimental conditions and field corresponding conditions and adjustment basis are shown in Table 2.
The similarity determination is based on dimensionless parameters. The experiment is similar to the time when the field meets the same cumulative injection pore volume multiple, that is, the displacement process is satisfied. The calculation formula of Npv is shown in formula (1) ; the particle start-up is controlled by the competition of hydrodynamic drag force and adhesion force. The determination parameters are particle Reynolds number and capillary number :
In. is the fluid density, kg/m3; Darcy velocity, m/s; dₚ It is a typical fine particle size, m; For the fluid viscosity, Pa·s; is the oil-water interfacial tension, N/m. Rep≪1 shows that the particle flow is in the laminar flow area, which is consistent with the seepage state in the formation pore. Nc characterizes the relative size of viscous force and interfacial tension, and its magnitude determines the sensitivity interval of particle initiation and retention.
Take the 1.5 mL/min group as an example to calculate : Darcy speed u=0.2956 cm/min≈4.93×10 m/s; density of crude oil =0.85×10³ kg/m3, typical fine particle size. Dₚ=10 μm, white oil viscosity =4.5×10⁻3 Pa·s, interfacial tension =0.03 N/m, then: Rep= 0.85×103×4.93×10⁻5×10×10⁻6/(4.5×10⁻3) ≈ 9.3×10⁻5 ≪ 1, the particle flow is in the laminar flow area, which is consistent with the seepage state in the formation pores; = 4.5×10⁻3×4.93×10⁻5/0.03≈7.4×10⁻6. It is in the sensitive interval of particle migration and sand production in oilfield development (10⁻6~10⁻4 magnitude), indicating that the relative mechanism of hydrodynamic force and interfacial tension is comparable to that in the field.
Equivalent conversion of flow rate: 0.1~1.5 mL/min corresponds to Darcy velocity of 0.0199~0.2956 cm/min, that is, 0.29~4.26 m/d, covering the magnitude of seepage velocity in the near wellbore zone and reservoir during cold production and water injection development of heavy oil reservoirs. Due to the geometric scaling between the core and the reservoir, the experimental time is much shorter than the field time, but the four flow groups are injected for 8 h respectively. 5.01, 24.30, 49.67 and 75.47 PV, which are equivalent to the engineering magnitude of the cumulative injection multiple of the reservoir in the oilfield water injection development, and meet the requirements of time similarity.
Based on the above calculation and analysis, the core porosity (30.8 %~38.6 %) and permeability (271~307 mD) fall within the actual physical property range of the reservoir (porosity 31.1%~38.1%, permeability 112.8~1467.3 mD). The experimental temperature and pressure are in the same order of magnitude as the formation temperature (40~50 °C) and pressure (about 8 Mpa). The multi-stage white oil viscosity combined with flow rate adjustment makes the particle force mechanism meet the dynamic similarity; the boundary flow rate and cumulative injection multiple correspond to the field development process. Therefore, the experimental conditions in this paper meet or satisfy the similarity criterion through conversion in four aspects: geometry, physical properties, dynamics and boundary conditions, which can effectively simulate the process of particle migration and pore environment adjustment induced by flow velocity in real strata.
2.4. Experimental Process
The viscosity of 4.5 mPa·s white oil was used in the experiment, the temperature was 40°C, and the setting pressure was 5 Mpa. The actual control variable is the constant flow pump volume flow Q, set 0.1, 0.5, 1.0 and 1.5 mL/min ; in this paper, the expression of ‘ velocity ‘ is used, and the Darcy velocity u is used to describe the flow intensity per unit cross-sectional area. Therefore, the ‘ flow rate increase ‘ corresponds to the simultaneous increase of Q and u. Three independent parallel cores were set up for each flow rate, and the same oil saturation, liquid flow and stage detection process were adopted.
The reference NMR and CT data were obtained after the core was saturated, which was recorded as 0h. Then the white oil was introduced according to the set flow rate, and the stage detection was carried out at 2, 4, 6 and 8h. The test was taken out every 2h. NMR was a phased off-position measurement, and CT was compared according to the corresponding stage. Each group was normalized with its own initial state, and then the mean and standard deviation of the three independent core results were calculated.
2.5. Data processing and Statistical Analysis
Three independent parallel cores were set up in each flow rate group. The arithmetic average of the three results was used to represent the overall level between groups, and the standard deviation was used to represent the degree of dispersion within the group. For the endpoint indexes such as the relative change rate of 8 h short relaxation, the attenuation amplitude of long relaxation, the increment of CT small-scale partition and the decrease of large-scale partition, the difference of four flow levels was compared by one-way analysis of variance. The statistical test is only used to evaluate the trend between groups and is not used to prove the particle migration path.
3. Experimental Results
3.1. NMR Partition Response and Its Flow Rate Difference
Figure 2 shows the stages of representative parallel cores at four flow levels. T2 Spectrum. The main peak of the long relaxation interval is the main feature of each group, and the main peak of the long relaxation decreases and the short relaxation response increases with the flow advance. The changes were more obvious in the high flow group. Figure 2 is used to show the representative spectrum, and the quantitative comparison between groups is based on the mean and standard deviation of the three parallel cores.
The relative change rate of the four groups of short relaxation increases with time. Based on the group mean values of three parallel cores, the groups of 0.1, 0.5, 1.0 and 1.5 mL/min reached 6.31 %, 20.56 %, 52.71 % and 70.86 % at 8 h, respectively. The order between groups was consistent with the results of the original single sample.
The long relaxation interval continued to change negatively, and the 8 h attenuation ranges of the mean values of the three parallel core groups were 6.26 %, 15.52 %, 38.72 % and 62.91 %, respectively. When increased from 0.5 to 1.5 mL/min, the change of short and long relaxation endpoints increased to 3.45 times and 4.05 times, respectively.
Figure 3.
Relative change rates of NMR partitions of representative cores at four flow levels.
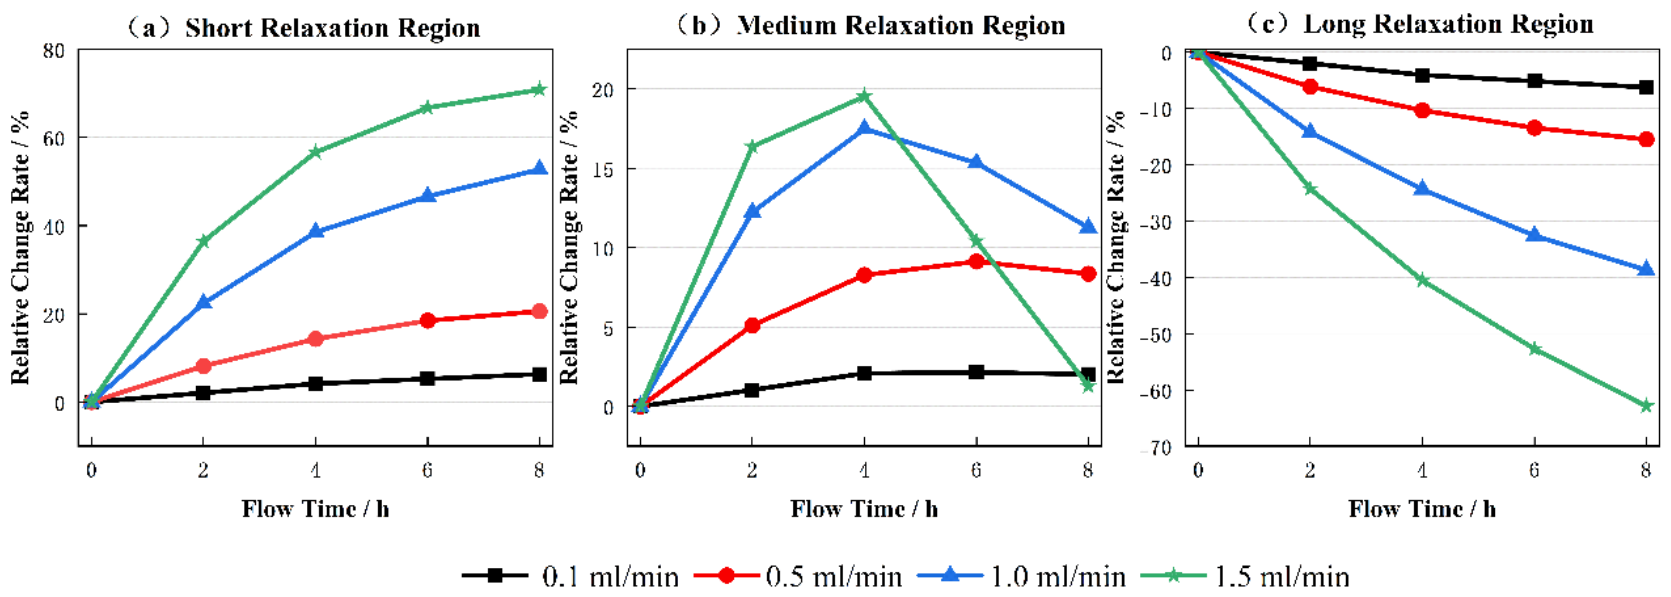
There are stage differences in the relaxation interval. In terms of group mean, 0.1 and 0.5 mL/min groups reached the maximum values of 2.14 % and 9.13 % at 6 h, respectively, and 1.0 and 1.5 mL/min groups reached 17.48 % and 19.52 % at 4 h, respectively. Subsequently, the higher flow group decreased. The results show that the response of the middle interval is phased, and the early adjustment of the high flow group is more obvious.
The increment of the short relaxation stage is also gradually reduced. Taking the representative high-flow group as an example, the increments of each 2 h stage in the 1.5 mL/min group were 36.45, 20.17, 10.12 and 4.12 percentage points, respectively, and 22.36, 16.16, 8.11 and 6.08 percentage points in the 1.0 mL/min group. Parallel repetition is mainly used to test the repeatability between groups.
3.2. Stage Evolution of CT Pore Composition
CT partition statistics are shown in Figure 4. The initial small pores of the four flow groups accounted for 13.49 % ~ 14.04 %, the mesopores were 48.48 % ~ 53.25 %, and the macropores were 32.85 % ~ 37.71 %. The relatively close macroscopic physical properties do not guarantee that the local pore composition is completely consistent. Therefore, the initial values of each core are normalized during the analysis, and the mean ± standard deviation of the three parallel samples is used to represent the end point change.
In terms of group mean, the proportion of small pores in the 0.1 mL/min group increased from 13.81 % to 14.70 %, and the proportion of large pores decreased from 37.71 % to 35.90 %. In the 0.5 mL/min group, the small pore increased from 13.49 % to 16.50 %, and the large pore decreased from 36.58 % to 31.50 %. In the 1.0 mL/min group, the small pore increased from 13.90 % to 22.20 %, and the large pore decreased from 32.85 % to 20.80 %. In the 1.5 mL/min group, the small pores increased from 14.04 % to 31.50 %, and the large pores decreased from 37.02 % to 14.70 %. Each group showed an increase in small-scale zoning and a decrease in large-scale zoning.
The change of 8 h endpoint is shown in Table 3. According to the group mean of three parallel cores, with the increase of Q from 0.1 to 1.5 mL/min, the increment of small pores was 0.89,3.01,8.30 and 17.46 percentage points, and the decrease of large pores was 1.81,5.08,12.05 and 22.32 percentage points. The relative change also increases with the increase of flow rate, and the example repeated data support that the difference between groups is statistically significant.

Table 3.
NMR end-point response and maximum value of medium relaxation interval (R:%).
| Q | Short interval R | Middle interval R | Long interval R | Middle interval maximum R | Time point |
|---|---|---|---|---|---|
| 0.1 | +6.31\pm0.38 | +2.06\pm0.12 | -6.26\pm0.38 | 2.14\pm0.13 | 6 |
| 0.5 | +20.56\pm1.23 | +8.36\pm0.50 | -15.52\pm0.93 | 9.13\pm0.55 | 6 |
| 1.0 | +52.71\pm3.16 | +11.26\pm0.68 | -38.72\pm2.32 | 17.48\pm1.05 | 4 |
| 1.5 | +70.86\pm4.25 | +1.27\pm0.08 | -62.91\pm3.77 | 19.52\pm1.17 | 4 |
Table 4.
Changes in the proportion of 8 h in CT pore partition (Δg: percentage point ).
| Q | Small hole Δg |
Mesoporous Δg |
Big hole Δg | The relative growth of small holes | Macropore relative loss |
|---|---|---|---|---|---|
| 0.1 | +0.89±0.05 | +0.92±0.06 | -1.81±0.11 | 6.44 ±0.39 | 4.80 ±0.29 |
| 0.5 | +3.01±0.18 | +2.07±0.12 | -5.08±0.30 | 22.31 ±1.34 | 13.89 ±0.83 |
| 1.0 | +8.3± 0.50 | +3.75±0.23 | -12.05±0.72 | 59.71 ±3.58 | 36.68 ±2.20 |
| 1.5 | +17.46±1.05 | +4.86±0.29 | -22.32±1.34 | 124.36 ±7.46 | 60.29 ±3.62 |
The proportion of mesopores in the low-flow group still increased to 8 h, reaching 49.40 % and 52.00 % in the 0.1 and 0.5 mL/min groups, respectively. In the higher flow group, it increased first and then decreased : in the 1.0 mL/min group, it increased from 53.25 % to 58.50 % at 6 h, and decreased to 57.00 % at 8 h. The 1.5 mL/min group increased from 48.94 % to 56.20 %, and then decreased to 53.80 %. The proportion of the end point of the middle hole is still higher than the initial value, indicating that the later decline is not restored to the initial state.
The representative CT pore network is shown in Figure 5. The image is used to show the structural morphological changes, and the quantitative conclusion is based on the parallel core statistical table.
3.3. Supplementary Control Under Equal Cumulative Fluid Volume
At the same detection time, the high flow group passed more white oil, so the isochronous comparison included both the flow intensity and the cumulative flow difference. The same nominal injection volume was used as a supplementary control.
Table 5.
Comparison of parallel repeated responses under the same nominal cumulative fluid volume.
| Volume | Q | Time | Injection volume\(PV) | Short interval growth | Long interval attenuation | Hole increment | Big hole decline |
|---|---|---|---|---|---|---|---|
| 120 | 0.5 | 4 | 12.15 | 14.32±0.86 | 10.37±0.62 | 1.56±0.09 | 2.63±0.16 |
| 120 | 1.0 | 2 | 12.42 | 22.36±1.34 | 14.28±0.86 | 2.20±0.13 | 3.95±0.24 |
| 180 | 0.5 | 6 | 18.23 | 18.47±1.11 | 13.46±0.81 | 2.31±0.14 | 3.88±0.23 |
| 180 | 1.5 | 2 | 18.87 | 36.45±2.19 | 24.32±1.46 | 3.76±0.23 | 7.32±0.44 |
| 240 | 0.5 | 8 | 24.30 | 20.56±1.23 | 15.52±0.93 | 3.01±0.18 | 5.08±0.30 |
| 240 | 1.0 | 4 | 24.83 | 38.52±2.31 | 24.43±1.47 | 4.30±0.26 | 8.25±0.49 |
In 120 mL control, 0.5 mL/min group for 4 h and 1.0 mL/min group for 2 h were about 12.15 and 12.42 PV, respectively. The short relaxation change, long relaxation attenuation and CT small-scale/large-scale partition change were more obvious in the higher flow group. The 180 and 240 mL control also maintained the same direction.
In the 180 mL control group, the 6 h of 0.5 mL/min group and the 2 h of 1.5 mL/min group were 18.23 and 18.87 PV, respectively. The short relaxation growth increased from 18.47 % to 36.45 %, and the long relaxation decay increased from 13.46 % to 24.32 %. The increment of CT small pores increased from 2.31 to 3.76 percentage points, and the decrease of large pores increased from 3.88 to 7.32 percentage points. In the 240 mL control, the 0.5 mL/min group at 8 h and the 1.0 mL/min group at 4 h also maintained a higher response than the high flow group.
The three controls showed the same direction in NMR and CT, indicating that in the comparison of the mean values of the groups after parallel repetition, the higher flow group still showed a stronger response at the same cumulative fluid volume, and the cumulative injection volume was not enough to explain all the changes alone. However, due to the different duration of the equal volume control, it is still necessary to carefully distinguish the flow and time effects.
3.4. Particle Morphology at Different Flow Rates
The representative SEM images of the four flow groups are shown in Figure 6. Each flow group selects a representative field of view from three parallel cores to display skeleton particles, surface fine particles, and interparticle openings. SEM is mainly used to provide local morphology evidence and does not undertake the quantification of particle migration quality.
In the 1.0 mL/min group, fine-grained aggregates were observed in the local gap, and the opening boundary and aggregate morphology were changed in the front and rear images. In the 1.5 mL/min group, there were also differences in the attached particles and local void contours on the pore wall. The morphology change of the higher flow rate group provides clues for particle position adjustment and local accumulation. However, the shape alone cannot confirm the mineral type, and the image cannot be converted to the migration quality [21]. Therefore, SEM is only used as local morphology evidence.
4. Mechanism Analysis
4.1. Flow Rate Increase and Particle Release Conditions
The results of parallel repetition showed that the higher flow group was accompanied by stronger short relaxation enhancement, long relaxation attenuation and CT partition shift. [22]. The Darcy velocity increased from 0.0199 to 0.2956 cm/min, about 14.9 times. This value only characterizes the overall flow intensity, and the velocity near the actual particles is affected by the local pore throat and flow distribution, which cannot be directly used for the calculation of single particle force. Due to the use of independent parallel cores with layered matching, the individual differences of the samples are controlled to a certain extent. Therefore, the correlation between flow rate and response can be further discussed, but it still needs to be verified by pressure and particle output data.
Under the ideal condition of low particle Reynolds number, the drag force of spherical particles varies with viscosity, particle size and relative velocity. When the fluid properties are consistent, increasing the flow rate can enhance the hydrodynamic disturbance of particles; for the pore wall or weakly cemented fine particles, the increase of disturbance torque may make some particles cross the stable condition, so the response observed in the experiment has physical rationality with the increase of flow rate [23].
The early partition of the high flow group changed greatly, and then the short relaxation increment narrowed, which was consistent with the explanation that the easily adjusted particles responded first and the subsequent adjustment slowed down. The comparison of equal liquid volume shows that the instantaneous flow intensity may be involved in the response. Three dimensions have been formed
The study shows that different sandstones can show different degrees of particle redeposition, pore scale redistribution and permeability change under high flow water injection [24].
4.2. Partition Evolution and Local Detention Mechanism
The removal of particles from the original attachment position can expand the local opening, and the accumulation of particles at the edge or shrinkage of other pores may change the space occupied by the oil phase [25,26]. Microfluidic studies have shown that local retention can change the surrounding flow field and promote adjacent capture. In this experiment, this process can be used as a compatible explanation for the weakening of long relaxation and the reduction of CT large-scale partition.
The increase in the proportion of pores is not equal to ' the increase of particles in the pores '. The particles may change the effective pore boundary in the larger pores or after the edge retention, and the change of the pore wall state may also enhance the surface relaxation. Therefore, the enhancement of NMR short relaxation and the increase of CT small-scale partition should be regarded as the common response to the adjustment of pore environment, which is not directly equivalent to the new pores.
In the higher flow group, the relaxation intermediate interval increases first and then decreases, reflecting the transition of the medium-scale environment. After continuous flow, local retention, space refinement or fluid environment change can weaken it. The proportion of pores in CT reaches the maximum at 6 h and then falls back, while the short relaxation and CT pores still increase, indicating that the two types of partition stages are not synchronized.
Based on the existing data, a more suitable mechanism explanation is that higher flow rate may enhance the hydrodynamic disturbance of particles and release or adjust the position of weakly attached fine particles [27]; subsequent transport and local trapping may change the effective pore boundary and fluid relaxation environment, which is characterized by enhanced short relaxation and increased proportion of smaller-scale partitions. SEM provides local morphology clues, NMR and CT provide phase response.
4.3. Why NMR and CT Responses are Out of Sync
The two methods support each other in the overall direction and flow sorting, but the maximum time point in the middle interval is different. The NMR of 1.0 and 1.5m/min groups reached the maximum value at 4h, and the proportion of CT mesopores reached the maximum value at 6h. The NMR of 0.1 and 0.5mL/ min groups reached the maximum at 6h, while CT still increased at 8h. Therefore, the two cannot be one-to-one numerical conversion.
The NMR response depends on the fluid relaxation environment, and CT is classified according to the geometry after imaging and segmentation [28]. The redistribution of particles may change the contact area, surface composition and effective boundary of the pore wall, and some changes can affect the relaxation first. CT resolution and threshold also affect statistics [29]. Therefore, the difference of peak time points reflects the difference of measurement objects and partition boundaries, and cannot be used to calculate the migration time of particles across apertures.
The more stable evidence in the current data is that in the comparison of the group mean values of three parallel cores, the short relaxation and small-scale partitions of the four flow groups are enhanced, and the long relaxation and large-scale partitions are weakened, and the change is greater at higher flow rates. Parallel repetition enhances the repeatability of this sort, but NMR and CT still belong to different physical quantities, which should be understood as mutually supportive response relationships. The overall erosion mechanism of particle release-transport- retention driven by the increase of flow velocity is shown in Figure 7.
4.4. Application Prospect and Research Prospect
In this study, flow setting, parallel repetition, stage statistics and local morphology were linked to obtain a more consistent structural response ranking at four flow levels. Through layered matching and setting up three independent parallel cores, the initial macroscopic physical property differences of the samples are controlled to a certain extent, so the current results can more strongly support the correlation between flow rate and pore environment response. The equal volume control is still used to avoid all the differences in the degree of fluid passage due to the flow rate.
Structural change and net seepage damage still need to be evaluated separately. Large-scale partition reduction may correspond to channel contraction, or may be accompanied by local dredging or flow redistribution. Previous studies have combined particle wettability control with displacement experiments, and proposed a strategy to reduce the damage of loose sandstone particle migration permeability [30].
In the follow-up study, the sample size can be further increased on the basis of the existing parallel repetition, and the liquid permeability, pressure difference and the amount of produced particles can be measured synchronously at the same cumulative injection pore volume node. The NMR integral and CT segmentation method can be unified to establish the quantitative relationship between particle redistribution, pore adjustment and seepage capacity. Then, the flow classification verification is carried out with the target reservoir core and the corresponding fluid.
5. Conclusion
(1) Under the condition of uniform white oil, temperature and set pressure, the four flow groups composed of three parallel cores showed short relaxation enhancement and long relaxation weakening, and the change range at the same time point increased with the increase of flow rate. The cumulative liquid flow control such as still maintains this ranking, indicating that there is a consistent trend correlation between flow rate and pore response.
(2) CT results show that the proportion of small-scale partitions increases, the proportion of large-scale partitions decreases, and the adjustment is more obvious at higher flow rates, which supports each other with the change direction of NMR, indicating that under the current resolution and zoning rules, the pore environment is adjusted to smaller-scale partitions and shorter relaxation directions, but it is not equivalent to the synchronous change of absolute pore volume or real pore size.
(3) In the higher flow group, the relaxation response and the proportion of pores in CT increased first and then decreased, but the peak time was different, indicating that the relaxation environment and the geometric partition response were not synchronized, and the overall direction of the two was consistent and reflected the complementarity of different characterization scales.
(4) The results of NMR, CT and SEM are consistent with the mechanism of hydrodynamic disturbance enhancement, weak attachment fine particle release or position adjustment and local retention at higher flow rates. Parallel repetition improves the reliability of flow effect judgment.
References
- Tang, H.; Jia, C.; Wang, Z.; et al. Evolution of pore structure during fines migration in sand pack: NMR experimental and numerical investigations [J]. Front. Energy Res. 2024, 12(9), 1399477. [Google Scholar] [CrossRef]
- Khan, S.; Jaafar, M. Z.; Risal, A. R. B.; et al. Fines migration in porous media: A critical review of mechanisms, impacts, and mitigation strategies in subsurface energy operations [J]. Phys. Fluids 2025, 37(12), 546–550. [Google Scholar] [CrossRef]
- Yuan, W. F.; Yang, Y. L.; Yuan, L.; et al. Impact of temperature and salinity on fines detachment: AFM measurements and XDLVO theory [J]. Pet. Sci. 2025, 22(1), 338–347. [Google Scholar] [CrossRef]
- Li, Y.; Altalbawy, F. M. A.; Rachchh, N.; et al. Mitigating fines migration in low salinity water flooding of clay rich sandstones using TiO2 Saponin Zr nanocomposites [J]. Sci. Rep. 2025, 15(1), 18870. [Google Scholar] [CrossRef] [PubMed]
- Muneer, R.; Hashmet, M. R.; Pourafshary, P. DLVO modeling to predict critical salt concentration to initiate fines migration pre-and post-nanofluid treatment in sandstones [J]. SPE J. 2022, 27(04), 1915–1929. [Google Scholar] [CrossRef]
- Barbosa, F. R.; Miri, R.; Salimi, M.; et al. Thermal Effects on Fines Migration: Insights from Sand Pack Experiments [J]. Energies 2025, 18(13), 1–21. [Google Scholar] [CrossRef]
- Loi, G.; Yang, Y.; Nguyen, C.; et al. Fines migration and clogging under pH alteration: Stochastic model and its upscaling [J]. Powder Technol. 2025, 456(4), 120778. [Google Scholar] [CrossRef]
- Han, G.; Kwon, T. H. Effect of seepage velocity on pore clogging growth behavior and its effect on permeability reduction during fines migration in porous media [J]. Water Resour. Res. 2023, 59(3), e2022WR033537. [Google Scholar] [CrossRef]
- Loi, G.; Nguyen, C.; Chequer, L.; et al. Treatment of oil production data under fines migration and productivity decline [J]. Energies 2023, 16(8), 3523. [Google Scholar] [CrossRef]
- Zhou, W. S.; Liu, Z. K.; Liu, Y. Research progress and prospect of particle migration in loose sandstone reservoirs [J]. Oil Drill. Technol. 2025, 54(2), 112–123. [Google Scholar]
- Liu; Huang, Z. Exploration of microstructure characteristics and mechanical behaviors of thermal-damaged argillaceous sandstone via LF-NMR and µ-CT technologies [J]. Geomech. Geophys. Geo-Energy Geo-Resour. 2023, 9(1), 27. [Google Scholar] [CrossRef]
- Jiang, Z.; Zhu, Y.; Li, P.; et al. Applicability of nuclear magnetic resonance experiment in analyzing pore and fluid distribution characteristics of tight sandstone: A case study in the julu area, bohai bay basin, China [J]. ACS Omega 2023, 8(46), 43903–43919. [Google Scholar] [CrossRef] [PubMed]
- Jia, H.; Zhang, R.; Luo, X. B.; et al. Nuclear magnetic resonance experiments on the time-varying law of crude oil viscosity and core wettability in high-multiple waterflooding sandstone [J]. Pet. Explor. Dev. 2024, 51(2), 348–355. [Google Scholar] [CrossRef]
- Han, C.; Huang, F.; Zhi, W. D.; et al. The damage mechanism of particle migration in unconsolidated sandstone reservoir based on nuclear magnetic resonance technology [J]. Sci. Technol.
- Tian, B.; Deng, X.; Pan, C.; et al. An Investigation on the Pore Structure Characterization of Sandstone Using a Scanning Electron Microscope and an Online Nuclear Magnetic Resonance System [J]. Appl. Sci. 2024, 14(16), 7063. [Google Scholar] [CrossRef]
- Dalabayeva, E.; Pourafshary, P.; Muneer, R. DLVO-based prediction of critical pH for fines migration in sandstone reservoirs [J]. Pet. Res. 2026, 11(1), 72–83. [Google Scholar] [CrossRef]
- Fajt, M.; Machowski, G.; Puzio, B.; et al. Modelling effective diffusion for accurate NMR pore size analysis in nano-and microporous rocks [J]. Sci. Rep. 2025, 15(1), 36688. [Google Scholar] [CrossRef] [PubMed]
- Shi, J.; Chen, K.; Ji, S.; et al. Pore Structure Analysis of Tight Sandstone Using NMR, MIP and Micro-CT Methods: A Case Study From the Longdong, Ordos Basin, China [J]. Geol. J. 2025, 34(9), 234–240. [Google Scholar] [CrossRef]
- Mao, W.; Yao, Y.; Qin, Z.; et al. Pore structure characterization of sandstone under different water invasion cycles using micro-CT [J]. Geomech. Geophys. Geo-Energy Geo-Resour. 2024, 10(1), 53. [Google Scholar] [CrossRef]
- Yang, C.; Yang, E. Mineral composition and pore structure on spontaneous imbibition in tight sandstone reservoirs [J]. Sci. Rep. 2025, 15(1), 7504. [Google Scholar] [CrossRef] [PubMed]
- Hurlbert, S. H. Pseudoreplication and the design of ecological field experiments [J]. Ecol. Monogr. 1984, 54(2), 187–211. [Google Scholar] [CrossRef]
- Muneer, R.; Pourafshary, P.; Hashmet, M. R. An integrated modeling approach to predict critical flow rate for fines migration initiation in sandstone reservoirs and water-bearing formations [J]. J. Mol. Liq. 2023, 376, 121462. [Google Scholar] [CrossRef]
- Du, M.; Yang, Z. M.; Lyu, W. F.; et al. Dynamic seepage experiment of tight oil / shale oil under matrix fracture coupling [J]. Pet. Explor. Dev. 2024, 51(2), 356–366. [Google Scholar] [CrossRef]
- Fogouang, L. M.; André, L.; Leroy, P.; et al. Particulate transport in porous media at pore-scale. Part 2: CFD-DEM and colloidal forces [J]. J. Comput. Phys. 2024, 519, 113439. [Google Scholar] [CrossRef]
- Hao, J.; Ma, L.; Taylor, K. G. Experimental 3D visualisation of fines generation and migration in sandstone during water injection: implication on the efficiency of aquifer thermal energy storage [J]. Geothermics 2025, 132(11), 103443. [Google Scholar] [CrossRef]
- Zheng, W.; Tang, C.; Cai, S.; et al. Pore-scale modelling of particle migration in loose sandstone [J]. Front. Earth Sci. 2024, 12(6), 1509825. [Google Scholar] [CrossRef]
- Cao, S. C.; Cao, M.; Yuan, Y.; et al. Experimental and numerical investigation of fines migration mechanisms in porous media: Implications for marine gas hydrate production [J]. J. Mar. Sci. Eng. 2025, 13(10), 2002. [Google Scholar] [CrossRef]
- Li, Y.; Huang, J. Pore-scale controls on detachment and redistribution of endogenous particles induced by water flow in unconsolidated sandstone. Powder Technol. 2025, 34(12), 122065. [Google Scholar] [CrossRef]
- Zhao, S.; Liu, K.; Sun, C.; et al. Study on characterization of sandstone pore structure and seepage mechanism based on NMR and CT technology [J]. PLoS ONE 2026, 21(1), e0337448. [Google Scholar] [CrossRef]
- Spurin, C.; Ellman, S.; Sherburn, D.; et al. Python Workflow for Segmenting Multiphase Flow in Porous Rocks [J]. Transp. Porous Media 2024, 151(15), 2819–2834. [Google Scholar] [CrossRef]
Figure 1.
Experimental device and detection process diagram.
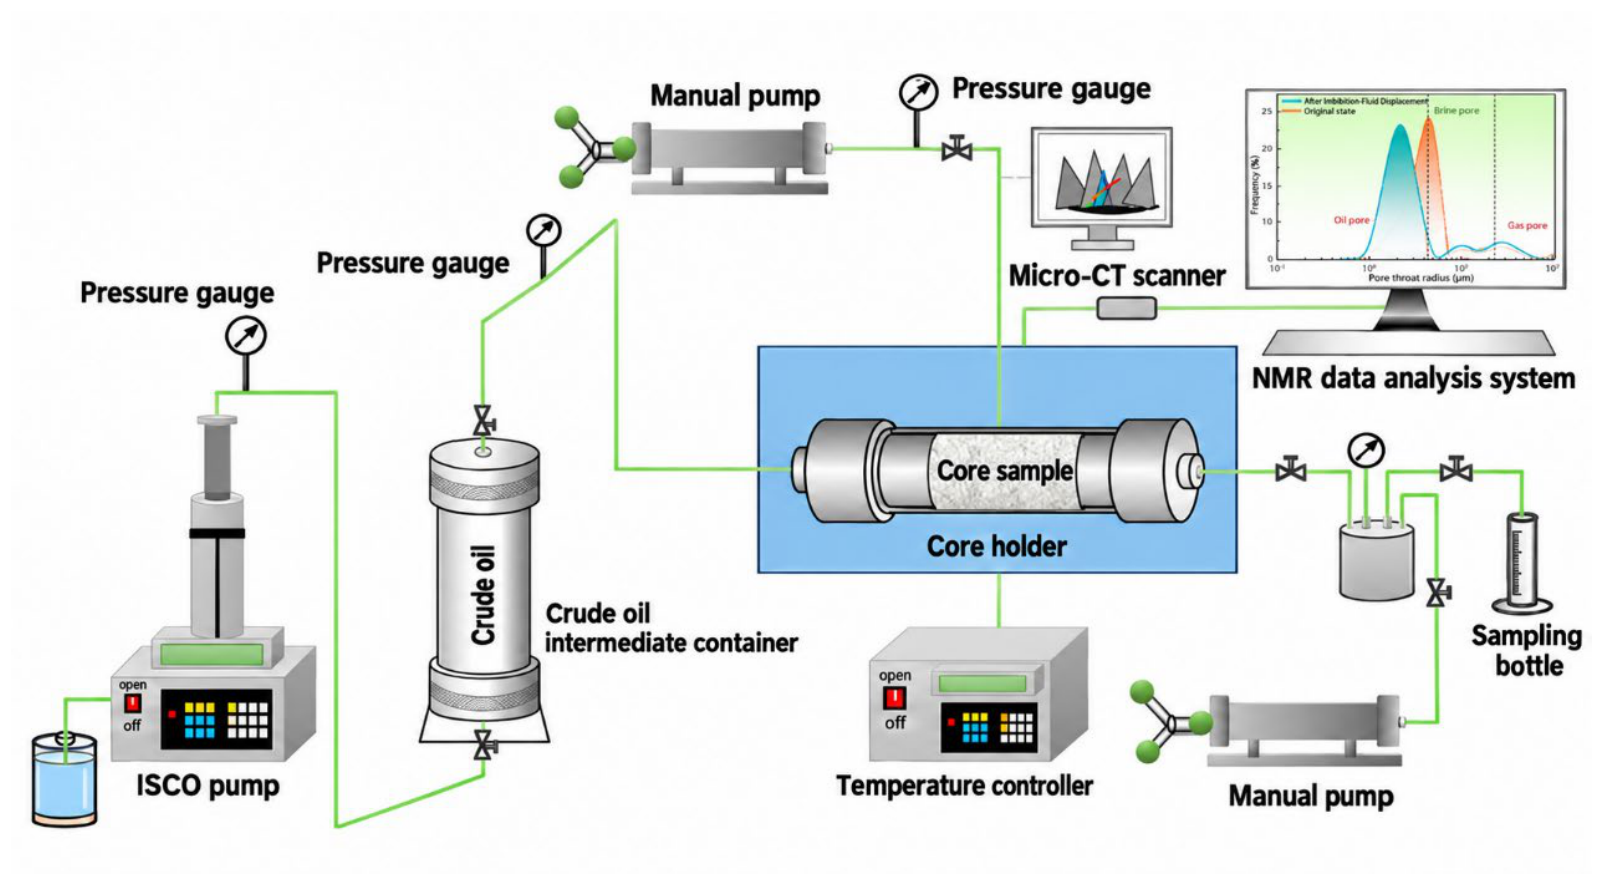
Figure 2.
Stages of representative parallel cores at different flow levels T2 The spectrum.
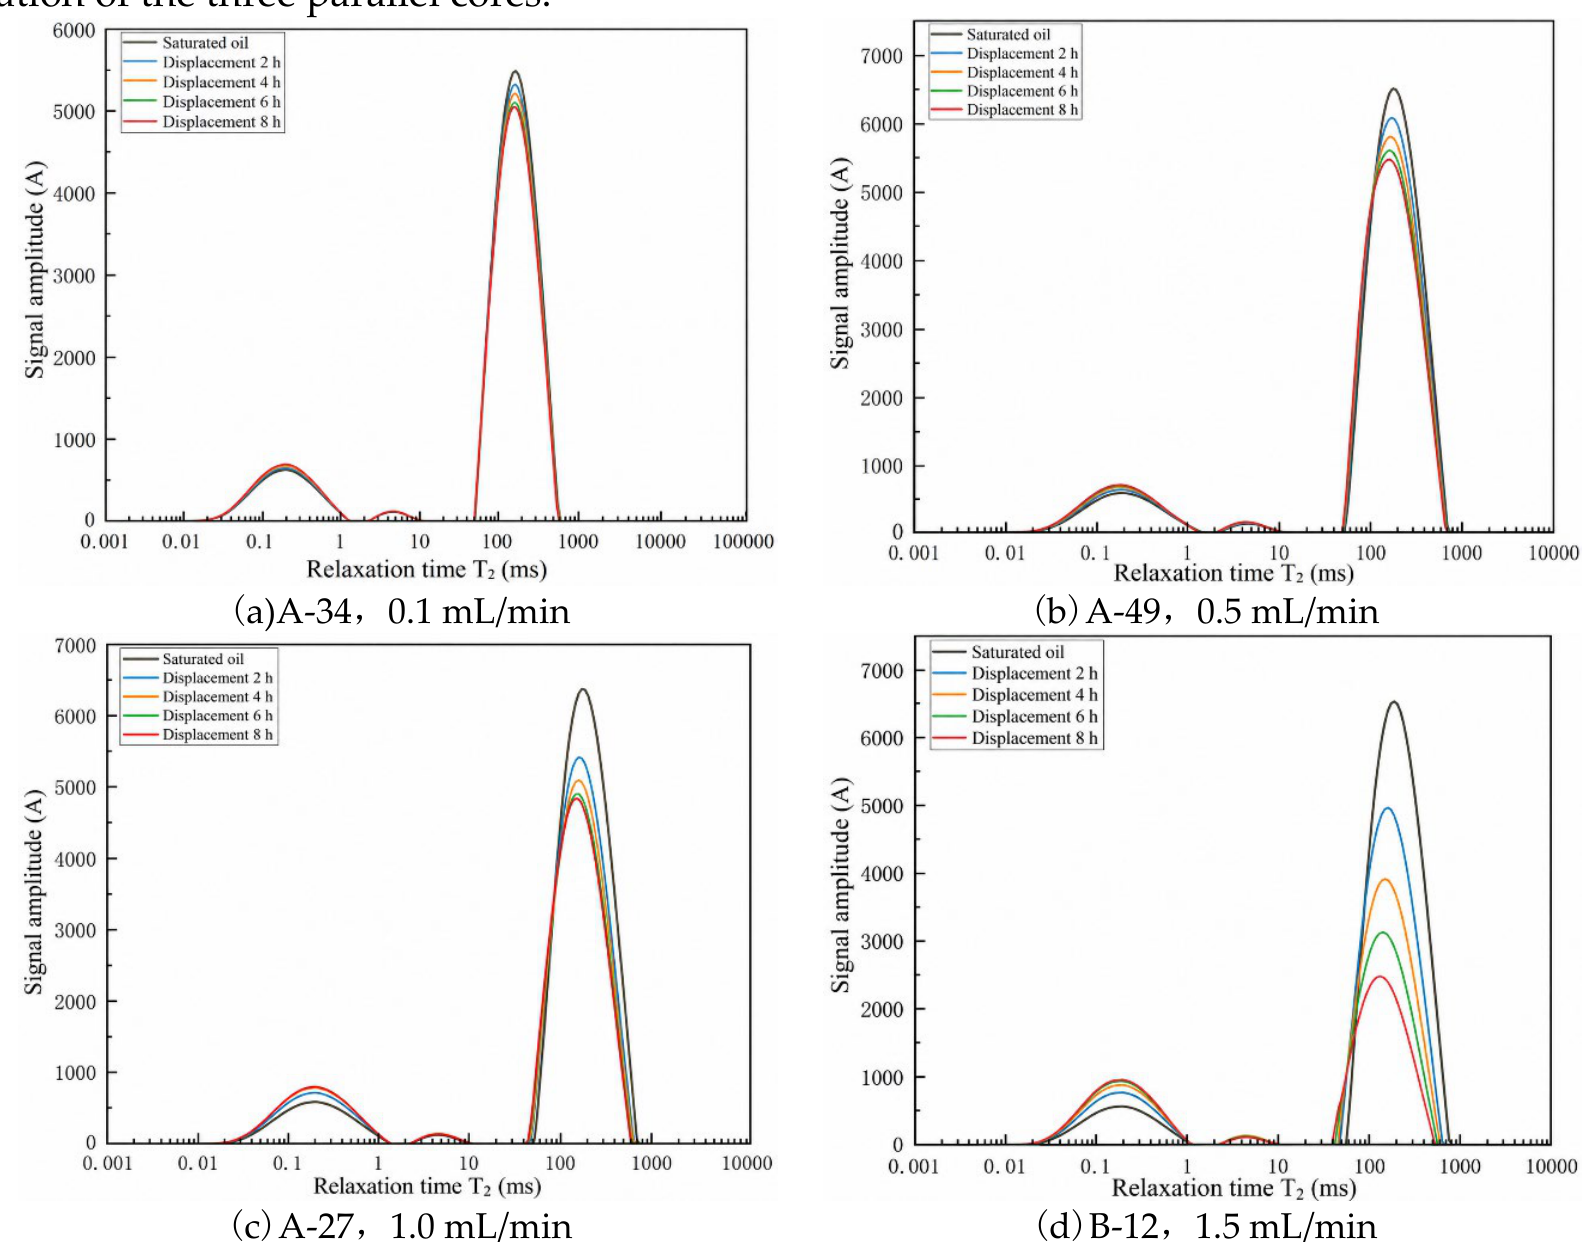
Figure 4.
The proportion of CT pore partitions of representative cores at four flow levels.
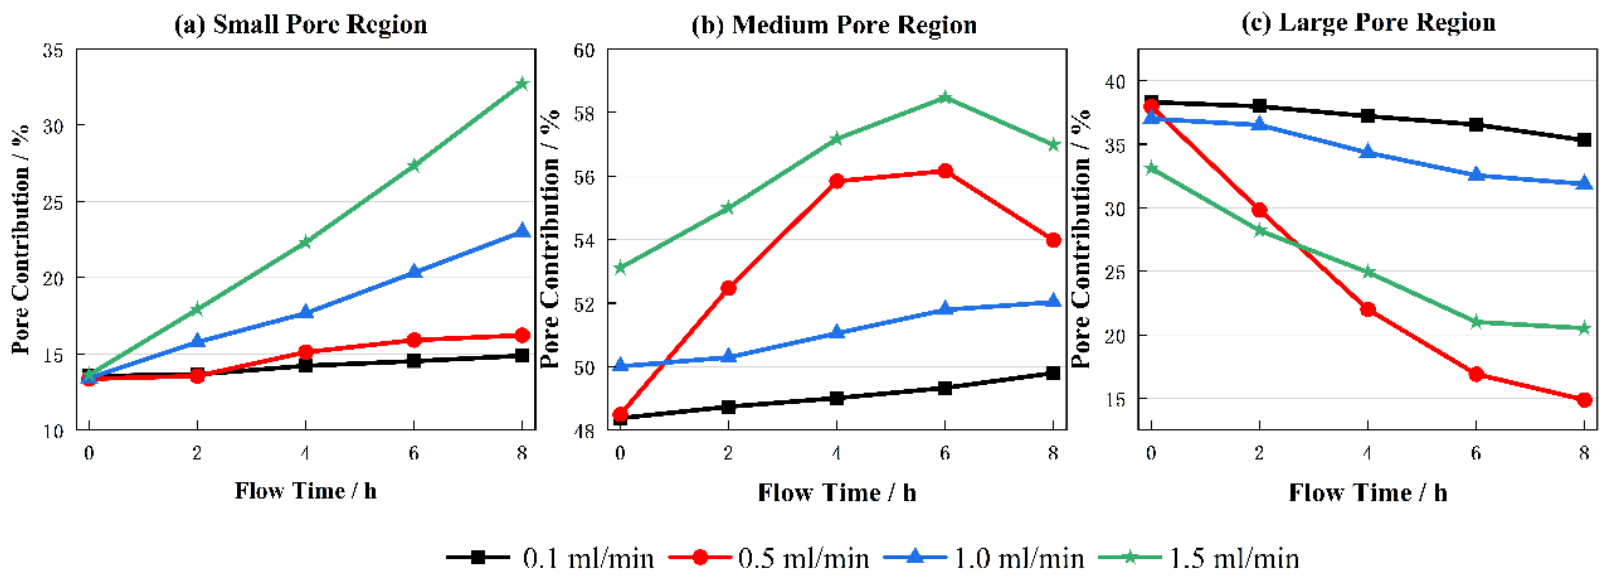
Figure 5.
CT pore network of representative parallel cores at different flow levels.
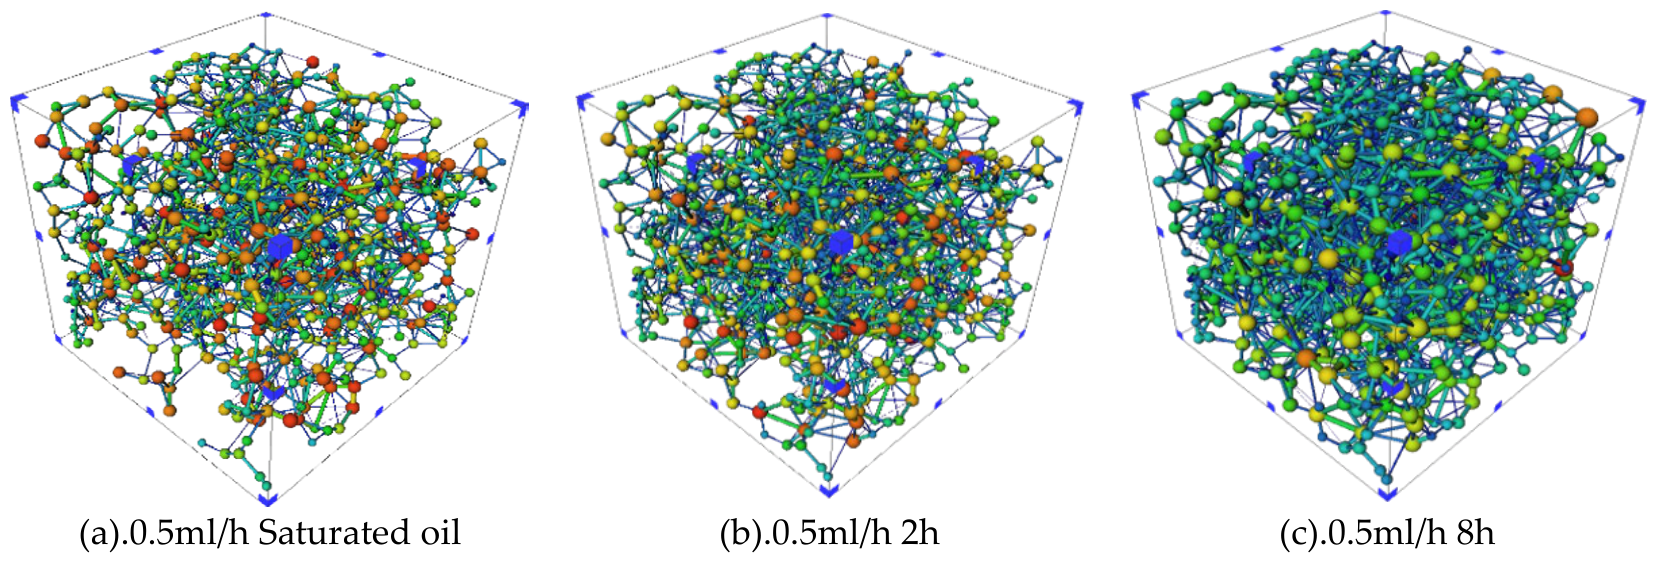
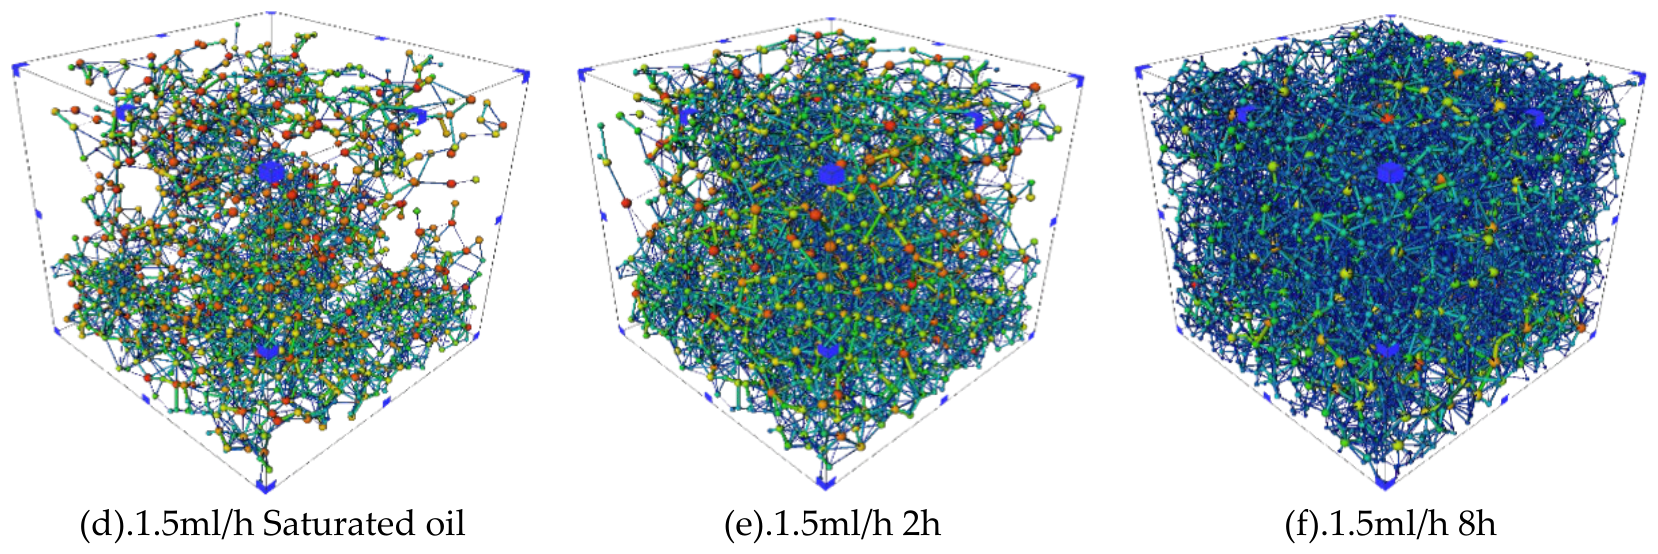
Figure 6.
SEM morphology of representative parallel cores before and after flow at each flow level.
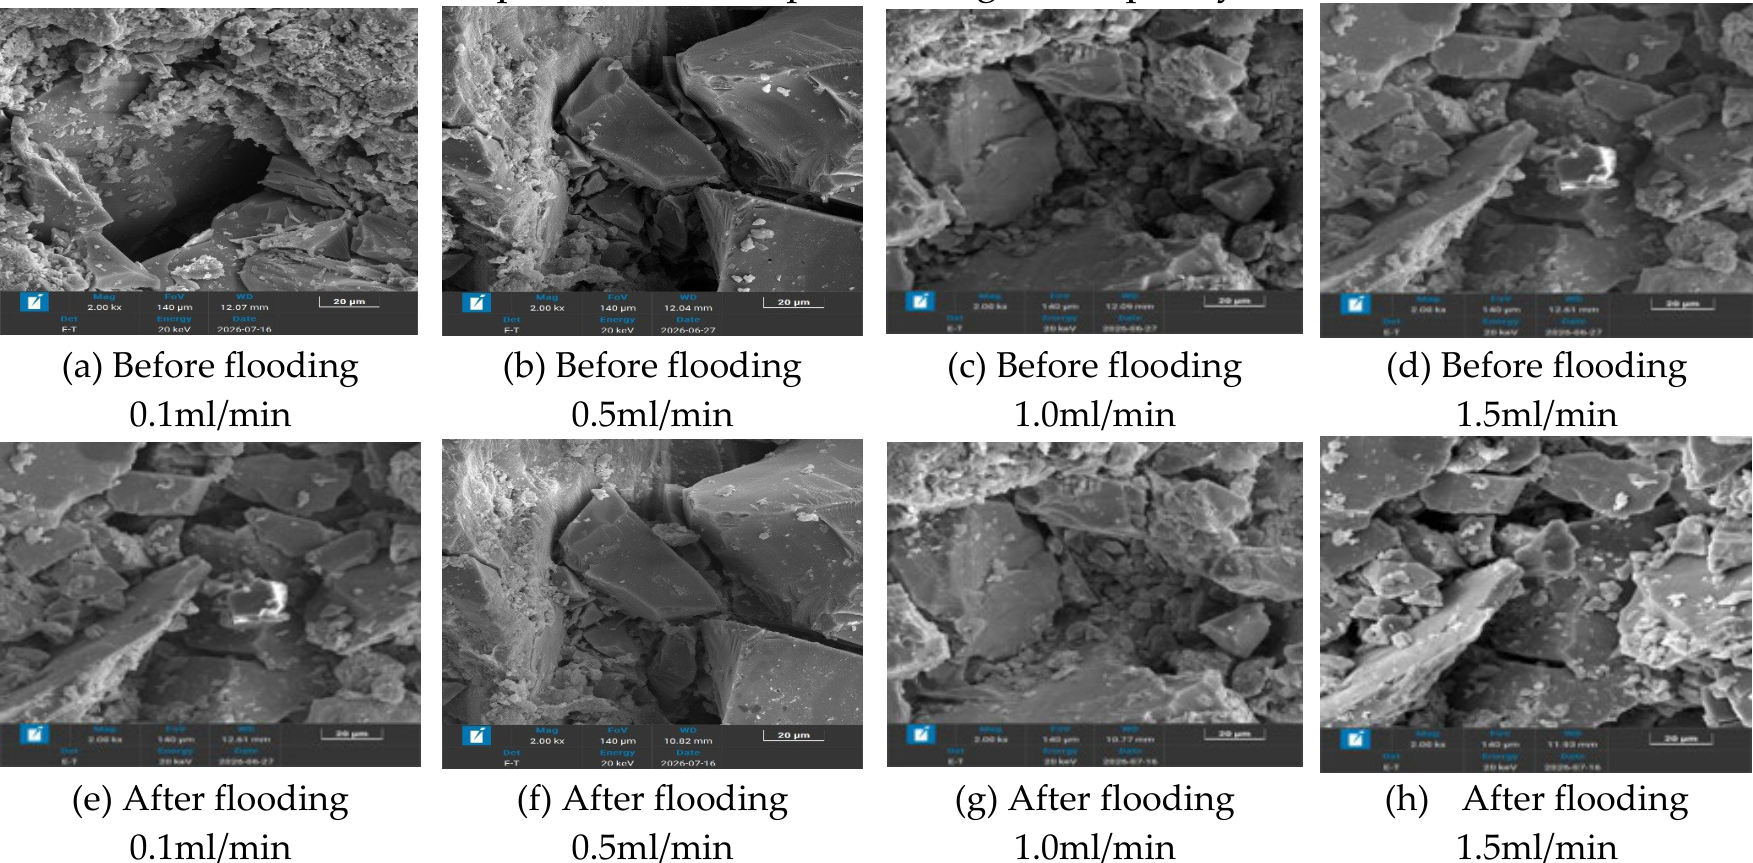
Figure 7.
Mechanism of particle release-transport-retention erosion process in pore environment by increasing flow velocity.
Figure 7.
Mechanism of particle release-transport-retention erosion process in pore environment by increasing flow velocity.
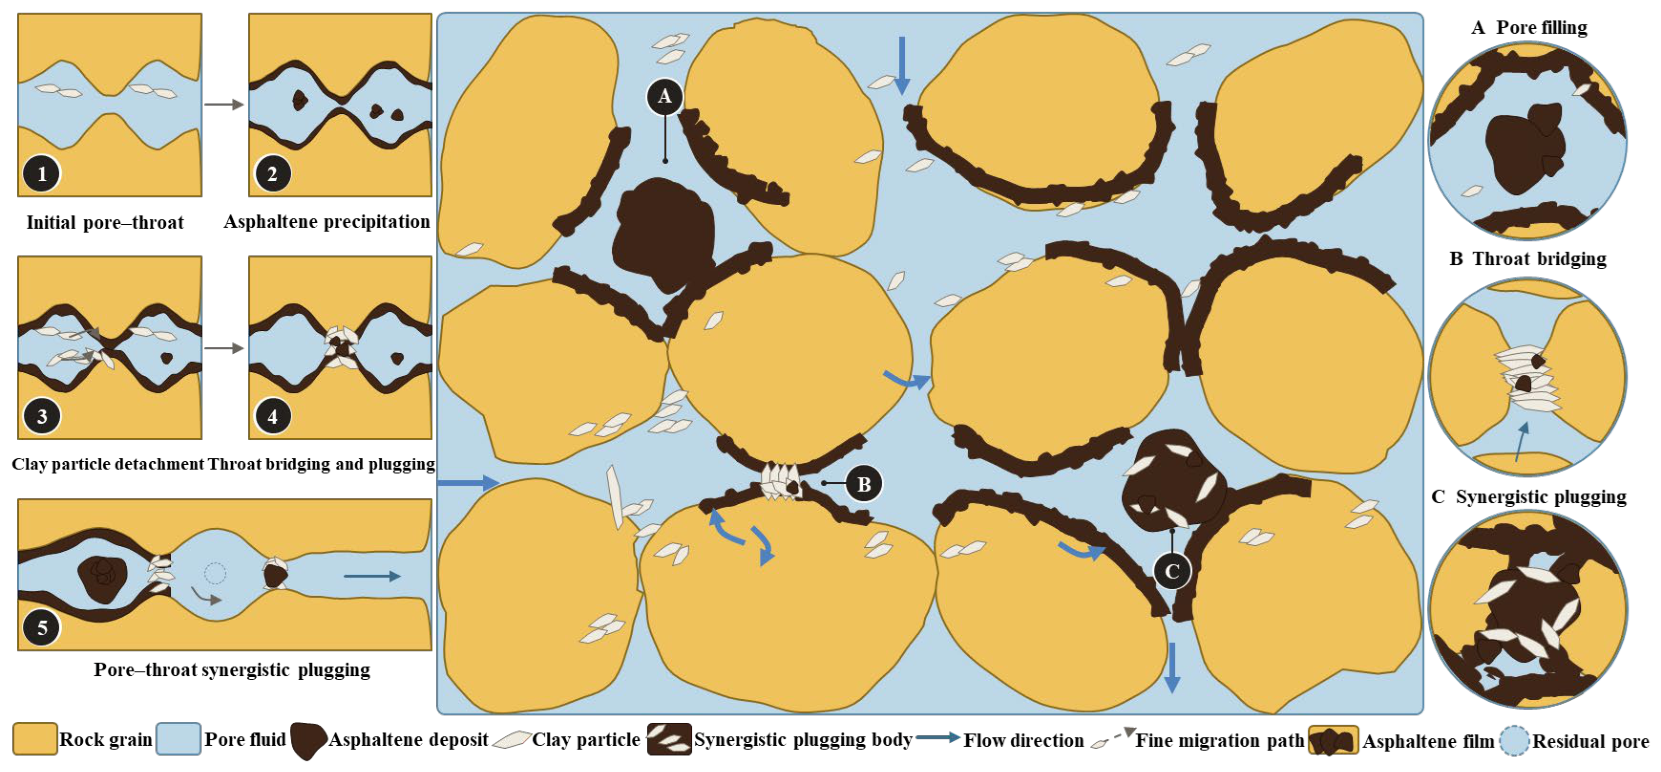
Table 1.
Initial parameters and liquid flow conditions of 12 matching parallel cores at four flow levels.
Table 1.
Initial parameters and liquid flow conditions of 12 matching parallel cores at four flow levels.
| No. | Q(mL/min) | L(cm) | D(cm) | φ(%) | k(mD) | u(cm/min) | Vp(mL) |
|---|---|---|---|---|---|---|---|
| A-34 | 0.1 | 5.02 | 2.532 | 37.9 | 282 | 0.0199 | 9.580 |
| A-36 | 0.1 | 5.01 | 2.531 | 37.8 | 283 | 0.0199 | 9.566 |
| A-37 | 0.1 | 5.03 | 2.534 | 38.0 | 285 | 0.0198 | 9.601 |
| A-49 | 0.5 | 5.05 | 2.553 | 38.2 | 286 | 0.0977 | 9.875 |
| A-50 | 0.5 | 5.04 | 2.552 | 37.8 | 281 | 0.0978 | 9.745 |
| A-51 | 0.5 | 5.06 | 2.554 | 37.7 | 283 | 0.0976 | 9.773 |
| A-27 | 1 | 5.06 | 2.533 | 37.9 | 285 | 0.1984 | 9.664 |
| A-30 | 1 | 5.04 | 2.532 | 37.8 | 282 | 0.1986 | 9.593 |
| A-32 | 1 | 5.07 | 2.534 | 38.0 | 283 | 0.1983 | 9.716 |
| B-12 | 1.5 | 5.04 | 2.542 | 37.3 | 280 | 0.2956 | 9.541 |
| B-13 | 1.5 | 5.03 | 2.541 | 38.1 | 285 | 0.2958 | 9.718 |
| B-14 | 1.5 | 5.05 | 2.543 | 37.9 | 284 | 0.2953 | 9.721 |
Table 2.
Similarity correspondence between experimental conditions and field conditions.
| Experimental conditions | Corresponding conditions on site | Adjustment basis and method |
|---|---|---|
| Core size (Φ2.5 cm ×5 cm) | The actual reservoir pore medium | According to the geometric scaling, the relationship between the flow path length and the pressure drop is kept similar. |
| Permeability (average 283.27 mD ) | The reservoir permeability is 112.8~1467.3 mD. | Typical core samples are selected to keep the permeability level consistent with the field. |
| Formation pressure ( experimental setting 5 MPa ) | The actual formation pressure is about 8 MPa. | The same order of magnitude as the formation pressure, simulate the interlayer pressure interference. |
| Temperature (experiment 40~120°C,main experiment 40 ° C ) | The formation temperature is 40~50°C. | According to the setting of well temperature logging data, the fluid physical properties are kept similar to the reaction kinetics. |
| White oil viscosity\n (2~15 mPa·s,multistage ) | The formation crude oil is 3802 ~ 54351 mPa·s. | The multi-stage viscosity is set according to the principle of dynamic similarity, and the particle force mechanism is similar by adjusting the flow rate and pressure difference. |
| The flow rate was 0.1 ~ 1.5 mL/min. | The actual seepage velocity in formation pores | The multi-stage flow rate is set to study the critical condition of particle start-up, and the formation equivalent flow rate is calculated according to the viscosity difference. |
Disclaimer/Publisher’s Note: The statements, opinions and data contained in all publications are solely those of the individual author(s) and contributor(s) and not of MDPI and/or the editor(s). MDPI and/or the editor(s) disclaim responsibility for any injury to people or property resulting from any ideas, methods, instructions or products referred to in the content. |
© 2026 by the authors. Licensee MDPI, Basel, Switzerland. This article is an open access article distributed under the terms and conditions of the Creative Commons Attribution (CC BY) license (http://creativecommons.org/licenses/by/4.0/).
Copyright: This open access article is published under a Creative Commons CC BY 4.0 license, which permit the free download, distribution, and reuse, provided that the author and preprint are cited in any reuse.