

Submitted:
02 November 2026
Posted:
05 November 2026
You are already at the latest version
Abstract
Guanidine thiocyanate (GT), a solid by-product of guanidine-salt manufacture, combines a valuable antimicrobial guanidinium cation with a toxic, oxidation-sensitive thiocyanate anion. Here, both ions are converted into useful products. In stage I, aqueous GT is treated with CuCl2 and metallic copper at 20–30 °C; Cu2+/Cu0 synproportionation (ΔE° = +1.14 V) precipitates β-CuSCN in 92 % yield without thiocyanate oxidation or acid formation, leaving guanidinium chloride (GuCl) in solution. In stage II, GuCl reacts with acrylic acid; speciation analysis (K ≈ 7•10−11) and FTIR show that the product is a mixture of guanidinium salts and partially polymerised acrylic acid rather than guanidinium acrylate. In a formalin-modified poly(vinyl alcohol) (PVA)/silica sol adhesive, the modifier shifts the ζ-potential of silica from −28.6 to +2.5 mV; at the resulting ionic strength (≈0.26 mol kg−1) DLVO theory predicts no electrostatic barrier, so the 120-day stability is attributed to steric stabilisation by adsorbed PVA. Compared with an unmodified PVAc reference, the adhesive shows 44–62 % higher lap-shear strength (5.2–6.8 MPa), lower 24 h water uptake (1.8 vs. 7.6 %) and antibacterial activity that is 91.8 % retained after washing, at a net raw-material cost of ≈2.1 kUSD t−1.
Keywords:
guanidine thiocyanate
; waste valorisation
; guanidinium
; colloidal silica
; poly(vinyl alcohol) adhesive
; ζ-potential
; DLVO
; Copper(I) thiocyanate
; synproportionation
; antibacterial adhesive
1. Introduction
Waterborne adhesives based on poly(vinyl alcohol) (PVA) and poly(vinyl acetate) (PVAc) dominate non-structural bonding of wood, paper and mineral materials because they are inexpensive, solvent-free and easy to apply [1,2,3]. Their main drawbacks are limited water resistance and the absence of intrinsic biostability: hydrophilic glue lines absorb moisture and can support microbial growth, which is undesirable in furniture, packaging and building elements used in healthcare and food-related environments [4,5]. Two strategies are commonly used to overcome these limitations—crosslinking or hybridisation of the polymer matrix with inorganic nanofillers, and incorporation of biocidal components [6,7,8,9].
Inorganic–organic hybrids of PVA and colloidal silica combine the film-forming ability of the polymer with the stiffness and barrier effect of nanosized SiO2, which improves strength, thermal stability and transparency [8,9,10,11]. The performance of such hybrids, however, depends critically on the colloidal state of the filler: aggregated silica forms weak boundary layers and micro-defects in the glue line [12,13,14]. Silica sols are electrostatically stabilised at pH 8–10, gel most rapidly at pH 5–7 and are very sensitive to multivalent and organic cations [15,16,17]. Any cationic additive introduced into a silica-containing adhesive therefore alters the charge balance of the particles and, through it, the processability of the formulation [18,19,20,21].
Guanidinium-containing compounds are among the most effective non-leaching antimicrobial agents. The guanidinium cation (pKa ≈ 13.6) remains protonated over the whole practical pH range [22,23]; it forms multiple hydrogen bonds through six N–H donors [24] and interacts electrostatically with the negatively charged bacterial membrane [25,26,27]. Poly(hexamethylene guanidine) (PHMG) and related polymers have been incorporated into PVA films and hydrogels [28,29,30], acrylic coatings [31], polyester and polyolefin fibres [32,33], wound dressings [34] and dental adhesives [35], typically giving broad-spectrum activity against Gram-positive and Gram-negative bacteria [36,37,38,39,40,41]. Polymerisable guanidinium salts, including guanidinium (meth)acrylates, are attractive because the cation can be anchored to the matrix through the vinyl group [42].
Commercial guanidine derivatives are produced from urea and ammonium nitrate or from cyanamide at elevated temperature. Guanidine thiocyanate (GT), [C(NH2)3]SCN, which is formed in thiocyanate-based guanidine routes (e.g., fusion of dicyandiamide with ammonium thiocyanate) and accumulates as a solid residue at guanidine-salt plants, is therefore a potentially cheap source of the guanidinium cation [43]. Its direct use is hindered by the thiocyanate anion: SCN− is toxic to aquatic organisms, persistent in effluents and difficult to destroy biologically or electrochemically [44,45,46]. Moreover, thiocyanate is easily oxidised by nitric acid and by Cu2+ ions; under uncontrolled conditions these reactions generate nitrogen oxides, thiocyanogen, hydrogen cyanide and other hazardous products. A valorisation route must therefore remove SCN− quantitatively, under mild conditions and preferably in the form of a useful product. Ion exchange with nitric acid, the most obvious way to replace the anion, is unattractive for this reason: the oxidising acid and thiocyanate have to be kept apart kinetically, and the resulting guanidinium nitrate is an energetic salt. Copper(I) thiocyanate is such a product: it is an insoluble, wide-band-gap p-type semiconductor used as a hole-transport layer in perovskite and organic solar cells [47,48,49] and as a biocide in antifouling paints [50].
Waste-to-adhesive approaches have been reviewed mainly for biomass-derived proteins, lignocellulosics and wood waste [5,51,52]; reports on the use of nitrogen-rich industrial residues as functional adhesive modifiers remain scarce. Related studies have shown that the performance of formulations derived from secondary industrial streams is often governed by the state of the dispersed phase rather than by the chemistry of a single component [53,54]; the present study examines this for a guanidinium-modified silica sol/PVA adhesive. In this work we (i) develop a one-step CuCl2/Cu0 synproportionation route that removes the thiocyanate anion of waste GT as β-CuSCN and leaves the guanidinium cation in solution as guanidinium chloride (GuCl), without nitric acid or other strong oxidants, (ii) characterise the product obtained by reacting GuCl with acrylic acid and critically assess the extent of acrylate exchange by speciation analysis and FTIR, (iii) analyse the colloidal state of silica sol in the PVA-based formulation by ζ-potential, particle size and DLVO calculations, (iv) evaluate the rheological, adhesive, thermal, water-resistance and antibacterial properties of the resulting composite adhesive in comparison with an unmodified PVAc reference and with requirements for commercial adhesives, and (v) establish the material balance and raw-material cost of the process. To the best of our knowledge, this is the first route in which both ions of a guanidine thiocyanate waste are converted into value-added products, the guanidinium cation into a functional adhesive modifier and the thiocyanate anion into β-CuSCN.
2. Materials and Methods
2.1. Materials
Waste guanidine thiocyanate (technical grade, solid residue of guanidine-salt production; Republic of Uzbekistan, Navoiy region, “Navoiyazot” JSC) was used as received after determining moisture by drying; its identity was confirmed by FTIR (Section 3.1). Copper(II) chloride dihydrate (0.1–0.5 M aqueous solutions), metallic copper (turnings/powder, ≥ 99%), acrylic acid (99%, stabilised with hydroquinone monomethyl ether), PVA (degree of hydrolysis 98–99%), epoxy-dian resin ED-20 with polyethylene polyamine (PEPA) hardener, formalin (37% HCHO) and an aqueous colloidal silica sol (30 wt% SiO2; particle diameter 12–22 nm; specific surface area 124–227 m2 g−1; Na+-stabilised, pH 9–10) were of technical or analytical grade. Silver nitrate and iron(III) chloride hexahydrate (analytical grade) were used for qualitative tests for chloride and thiocyanate. Distilled water was used throughout; KNO3 (1 mM) served as the background electrolyte in electrokinetic measurements.
2.2. Two-Stage Preparation of the Guanidinium Modifier
Stage I (synproportionation). Copper turnings were added to a 20 wt% aqueous GT solution in a jacketed reactor, and a 0.1–0.5 M CuCl2 solution was introduced dropwise at 20–30 °C under stirring at atmospheric pressure until precipitation ceased (molar ratio GT : Cu2+ : Cu0 = 2 : 1 : 1). Thiocyanate is precipitated as CuSCN, whereas the guanidinium cation remains in solution as GuCl:
2[C(NH2)3]SCN + CuCl2 + Cu → 2CuSCN↓ + 2[C(NH2)3]Cl
Metallic copper reduces Cu2+ to Cu+, so that thiocyanate is precipitated by synproportionation rather than oxidised, and no acid is formed:
Cu2+ + Cu0 + 2SCN− → 2CuSCN↓
The precipitate was separated on a vacuum filter, washed with distilled water until the test for chloride (AgNO3) was negative, dried at 60–80 °C to constant mass and weighed. Residual thiocyanate in the filtrate was checked with FeCl3. The GuCl filtrate was transferred directly to stage II.
Stage II (reaction with acrylic acid). Acrylic acid was added to the GuCl filtrate at a molar ratio of 1 : 1, and the mixture was stirred continuously at 20–40 °C without any neutralising agent:
[C(NH2)3]Cl + CH2=CHCOOH ⇄ [C(NH2)3][CH2=CHCOO] + HCl
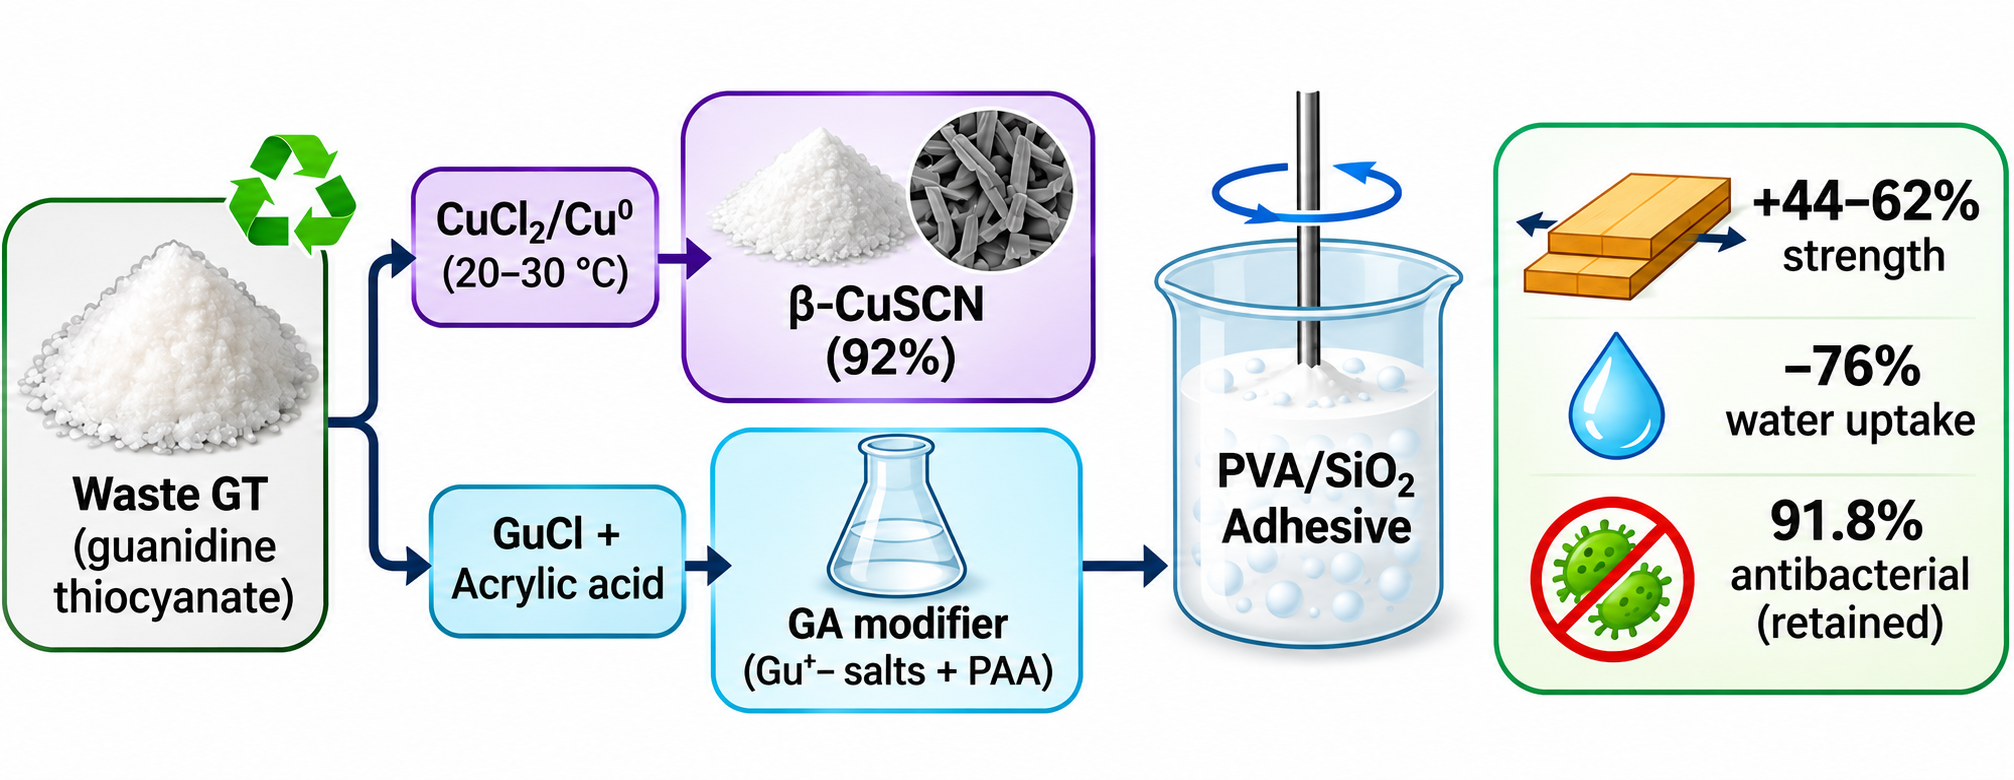
The temperature was kept below 40 °C because spontaneous radical polymerisation of acrylic acid with a sharp viscosity rise was observed above this limit. The product of stage II is denoted below as the “GA modifier”; its actual composition is discussed in Section 3.3. The processing scheme is summarised in Figure 1.
2.3. Preparation of the Composite Adhesive
The base formulation (variant A) contained 40 g of GA modifier, 100 g of PVA (dry polymer, dissolved in water), 15 g of 30% silica sol and 5 g of formalin. PVA was dissolved in water at 80–95 °C and cooled to 20–40 °C before the modifier was added, to avoid uncontrolled polymerisation of acrylic species during mixing; the GA modifier was then added, the silica sol was introduced dropwise over 30–40 min, and formalin was added last. The mixture was heated at 15–20 °C h−1 to 50–90 °C and held for 60–90 min at pH 4.5–7.0. The silica sol content was varied from 5 to 25 g and the modifier content from 0 to 60 g. In variant B, ED-20 resin was used as the matrix; the modifier and silica sol were dispersed at 200–250 rpm and PEPA (13–14 parts per 100 parts of resin) was added last. Liquid samples were used for colloidal and rheological measurements; films cast at equal thickness and dried under standard conditions were used for mechanical, thermal and antibacterial tests.
2.4. Characterisation
FTIR spectra were recorded on a Shimadzu FTIR spectrometer (IRTracer-100, Shimadzu Corporation, Kyoto, Japan) in attenuated total reflectance mode (400–4000 cm−1, resolution 4 cm−1); bands were assigned according to Nakamoto [55]. The phase composition of the CuSCN precipitate was determined by X-ray diffraction (Cu Kα radiation, Malvern Panalytical Empyrean, 2θ = 10–75°). DTA/TGA was performed on a Shimadzu thermal analyser (Shimadzu DTG-60H) in nitrogen at ≈10 °C min−1 from 30 to 600 °C (sample mass 4.10 mg).
The hydrodynamic diameter Dh was measured by dynamic light scattering (Malvern Zetasizer Nano ZS). The ζ-potential was determined by moving-boundary macroelectrophoresis in a U-tube: samples were diluted to 0.05% SiO2 with 1 mM KNO3, which also served as the side liquid; the voltage U between the electrodes was controlled with a digital voltmeter, and the boundary velocity u was measured with a millimetre scale and a stopwatch. The field strength E = U/L (L is the inter-electrode distance) and the electrophoretic mobility uE = u/E were calculated, and each measurement was repeated three times with reversed polarity. Because the Smoluchowski condition (κa ≫ 1) is not satisfied for silica particles of radius a ≈ 10 nm in 1 mM electrolyte (κa ≈ 1.04), mobilities were converted to ζ-potentials with Henry’s equation using Ohshima’s approximation for f(κa) [56]; the Smoluchowski equation would underestimate ζ by a factor of 1.45 under these conditions (Table 1) [57,58]. Because the modifier raises the ionic strength of the diluted samples (≈8.5-fold dilution of the formulation; I ≈ 1–42 mM), f(κa) was evaluated for each sample at its actual ionic strength rather than at that of the background electrolyte.
Contact angles of the liquid formulation were measured by the sessile-drop method (5 µL, 23 ± 1 °C, 50 ± 5% RH) [59]; for wood the spreading diameter was also recorded because of penetration and moisture effects [60,61,62]. The surface free energy of solids was resolved into dispersive and polar components by the Owens–Wendt method [63], and the work of adhesion was calculated with the Young–Dupré equation, Wa = γL(1 + cos θ). Flow curves were recorded on a rotational rheometer and fitted with the Ostwald–de Waele model; thixotropy was evaluated from the hysteresis-loop area [64,65].
Lap-shear strength was determined according to ISO 4587 [66] on metal, wood, glass and ceramic substrates (at least three specimens per series), and the failure mode was recorded [67,68]. Tensile and compressive strength of cured films were measured on Shimadzu AGS-X (Shimadzu Corporation, Kyoto, Japan). Water resistance was evaluated from the mass gain after 24 h immersion and from the retention of strength. An unmodified PVAc adhesive served as the reference. Antibacterial activity was determined by the agar diffusion method against Staphylococcus aureus ATCC 25923 and Escherichia coli ATCC 25922; the modifier-free formulation served as the control. To assess wash resistance, samples were washed in running water for 2 h and re-tested [30,32].
2.5. Calculations
The acrylate fraction was calculated as α(A−) = 1/(1 + 10pKa − pH) with pKa = 4.25 for acrylic acid [69]. Ionic strengths were calculated for a 1 : 1 electrolyte, and the Debye length as κ−1 = 0.304/√I nm (25 °C). Particle interaction energies were estimated within the DLVO framework [70,71]: the van der Waals term was calculated with the complete Hamaker expression for two spheres (R = 10 nm, A = 0.8·10−20 J for SiO2–water–SiO2 [72]), and the double-layer term with the linear superposition approximation, the diffuse-layer potential being obtained from the Grahame equation for an effective surface charge of −0.010 C m−2 [73,74].
3. Results and Discussion
3.1. Stage I: One-Step Removal of Thiocyanate and Formation of Guanidinium Chloride
The FTIR spectrum of the waste GT (Figure 2a) is dominated by an intense, narrow ν(SCN) band at 2051 cm−1 (transmittance down to 28%), accompanied by ν(C–S) at 721 cm−1 and a weaker band at 634 cm−1. The broad N–H stretching region (3363–3165 cm−1), the protonated amine band at 3019 cm−1, νas(CN3)/ν(C=N) at 1666 cm−1 and the N–H/C–N bands at 1412 and 1378 cm−1 confirm the guanidinium cation; the width of the N–H envelope reflects an extensive intermolecular hydrogen-bond network typical of guanidinium salts [24]. Since the 2000–2100 cm−1 region is free from other absorptions, the 2051 cm−1 band is an unambiguous marker of thiocyanate and was used to monitor its removal.
Stage I combines the removal of thiocyanate and the formation of a soluble guanidinium salt in a single operation (Eq. 1, Table 2). On dropwise addition of CuCl2 to the GT solution containing copper turnings, a white precipitate formed immediately, and the filtrate gave a negative FeCl3 test for thiocyanate at the end of the addition. Because reaction (1) consumes no proton and releases no acid, the guanidinium cation remains in solution as GuCl and the filtrate can be transferred to stage II directly, without crystallisation of an intermediate salt and without neutralisation of an acidic effluent. This is the principal advantage over ion exchange with nitric acid, in which oxidation of thiocyanate has to be suppressed by cooling and the guanidinium salt has to be recovered by crystallisation from a solution in which it is appreciably soluble.
The FTIR spectrum of the stage II product (Figure 2b) contains no absorption in the 2000–2100 cm−1 region and no ν(C–S) band at 721 cm−1, which, together with the negative FeCl3 test of the filtrate, confirms that thiocyanate is removed in stage I; the guanidinium cation, in contrast, is retained through all stages (Table 5).
3.2. Thermodynamics of Synproportionation and Phase Composition of β-CuSCN
Direct precipitation of thiocyanate with Cu2+ is accompanied by oxidation of SCN−, because Cu2+ is a sufficiently strong oxidant towards thiocyanate. In the presence of metallic copper the reaction proceeds by synproportionation (Eq. 2). The standard potentials of the Cu2+/CuSCN (E° = +0.91 V) and CuSCN/Cu0 (E° = −0.23 V) couples [69] give ΔE° = +1.14 V and lg K = 19.3 for reaction (2), so that precipitation is practically complete. Because oxidation of SCN− by Cu2+ is itself thermodynamically allowed (E°((SCN)2/SCN−) ≈ +0.77 V < E°(Cu2+/CuSCN) = +0.91 V), the role of metallic copper is kinetic: it consumes Cu2+ faster than Cu2+ can oxidise thiocyanate. The precipitate is white; a white or light-grey colour is characteristic of copper(I), whereas copper(II) compounds are blue or green. The yield of CuSCN was 92% of the theoretical value (94.7 g per 100 g of GT; theoretical 102.9 g).
The XRD pattern of the dried precipitate (Figure 3) shows reflections at 2θ = 16.2 (003), 27.2 (101), 28.8 (012), 32.6 (006), 34.6 (104), 47.1 (110) and 49.9° (113), which correspond to rhombohedral β-CuSCN, the polymorph used in optoelectronic applications [47,48,49]. Dropwise addition of CuCl2 is essential: at high supersaturation nucleation outruns crystal growth, and a fine, poorly filterable precipitate is formed. The CuSCN washings, which contain small amounts of Cu2+ and Cl−, are the only aqueous effluent of the process (Section 3.7).
3.3. Stage II: Composition of the GA Modifier
Reaction of the GuCl filtrate with acrylic acid at 20–40 °C gave a colourless to pale-yellow, viscous liquid containing fine white crystals. Its high viscosity already suggested partial polymerisation of acrylic acid. The direction of reaction (3) can be estimated from the acid strengths: K = Ka(AA)/Ka(HCl) ≈ 7·10−11 (pKa(HCl) ≈ −5.9 [93]), which corresponds to ΔG° ≈ +58 kJ mol−1. Because no acid is formed in stage I, the acidity of the medium is determined by acrylic acid itself: for an equimolar 2 M GuCl/acrylic acid solution the calculated pH is 1.98, and only 0.53% of acrylic acid is present as the acrylate anion (Figure 4, Table 3). Removing water facilitates crystallisation but cannot shift the equilibrium substantially, since its position is governed by the acid strengths.
The FTIR spectrum of the stage II product (Figure 2b, Table 4) fully agrees with this estimate. The strongest bands are ν(C=O) of non-ionised COOH at 1709 cm−1 and the C–O/δ(OH) band at ≈1160 cm−1, while δ(CH2) at 1457 cm−1 and the saturated ν(C–H) bands at 2923/2853 cm−1 are characteristic of a polymer chain. The monomer doublet at 1635/1618 cm−1 and the =CH2 wagging band at 985 cm−1 are absent, the strong νas(COO−) band expected at 1550–1570 cm−1 is observed only as a weak band at 1550 cm−1, and the guanidinium N–H bands are weak, because ATR sampling of the heterogeneous product probes mainly the viscous liquid phase rather than the fine salt crystals. Thus, without neutralisation, the stage II product is a mixture of guanidinium salts with predominantly non-ionised, partially polymerised acrylic acid (poly(acrylic acid)-like segments), rather than stoichiometric guanidinium acrylate. Quantitative formation of the acrylate requires neutralisation to pH ≥ 6.3 (α > 99%). For the adhesive application this composition is not a drawback: the COOH/COO− system buffers the formulation in the required pH 4.5–7.0 window, and PVA–poly(acrylic acid) hydrogen bonding is known to produce strong waterborne adhesives [75].
3.4. Structure and Thermal Behaviour of the Composite
In the spectrum of the composite (Figure 2c) a very broad, intense band at 3367 cm−1 results from overlapping N–H and O–H stretching vibrations and indicates an extensive hydrogen-bond network between the guanidinium fragments, the hydroxyl groups of PVA and the silanol groups of silica. The carbonyl band at 1713 cm−1 (non-ionised COOH and residual acetate of PVA) is retained, the band at 1635 cm−1 is due to bound water δ(H–O–H) overlapping with guanidinium δ(NH2), and the bands at 1192 and 1062 cm−1 belong to ν(C–O) of PVA and νas(Si–O–Si) of silica. The absence of the 2051 cm−1 band confirms that no thiocyanate is carried into the adhesive. Table 5 traces the diagnostic bands through all stages: SCN− is removed in stage I, the guanidinium ν(C=N) band is preserved at every stage, and carboxyl groups are present mainly in non-ionised form.
The DTA/TGA curves of the dried composite (Figure 5, Table 6) show practically no mass loss up to ≈130 °C (Δm < 1%); 5 and 10% mass loss occur at ≈140 and ≈150 °C, respectively, so the material is thermally stable up to 100 °C. The endotherm at 103–143 °C (peak 118.3 °C, signal minimum 136.4 °C, ΔH ≈ 101 J g−1) proceeds without mass loss and is attributed to melting of a crystalline guanidinium-salt phase; a contribution of residual GT (m.p. ≈ 118 °C) is excluded by the absence of the ν(SCN) band. The main mass loss (39.7% up to 196 °C) is associated with a strong endotherm at 193.3 °C (ΔH ≈ 192 J g−1), where evaporation of bound water, free acrylic acid (b.p. 141 °C) and residual formaldehyde, dehydration of carboxyl groups and melting of PVA crystallites overlap [76,77]. The second stage (196–348 °C, 27.3%) corresponds to side-chain dehydration of PVA to polyenes and to deamination/condensation of guanidinium fragments, and the third (348–599 °C, 26.1%) to destruction and carbonisation of polyene and poly(acrylic) chains [77,78,79]. No exotherm is observed over the whole range, which shows that polymerisable acrylic monomer is practically absent (radical polymerisation of residual vinyl groups would produce an exotherm at 120–180 °C). Because the route does not pass through guanidinium nitrate, whose decomposition is strongly exothermic [80], the dried adhesive contains no energetic guanidinium salt. The residue at 600 °C (6.93%) exceeds the calculated SiO2 content of the dry composite (3.07%), the difference (≈3.9%) being carbonised organic matter formed in nitrogen.
3.5. Colloidal State of the Silica Sol in the Formulation
The order of addition proved decisive for homogeneity. When formalin was added last, a homogeneous, translucent and stable system was obtained; when it was added together with or before the other components, gel particles and aggregates appeared. Two processes compete in the system—crosslinking of the PVA matrix and distribution of silica particles throughout its volume—and crosslinking must start only after the filler has been distributed. Likewise, rapid addition of the sol locally raises the particle concentration, shortens inter-particle distances and initiates irreversible siloxane bridging, whereas dropwise addition allows each portion to disperse. The pH window 4.5–7.0 is a compromise between the requirements of the three components: acetalisation of PVA by formaldehyde is efficient only in strongly acidic media (pH < 2–3), the guanidinium fragment should not be exposed to strongly acidic conditions, and silica sol is stable at pH 8–10 but gels fastest at pH 5–7 [15,16,17,81].
Without modifier the silica sol has ζ = −28.6 mV and Dh = 72.4 nm (Table 7, Figure 6). Increasing the GA content progressively decreases the negative potential to −4.8 mV at 30 g, where Dh passes through a maximum (128.5 nm) and slight turbidity appears; at the base content (40 g) the sign of ζ is reversed (+2.5 mV) and the system is homogeneous and stable (Dh = 91.7 nm). At 50–60 g, ζ increases to +8.3 and +14.4 mV, but Dh grows again (118.3 and 146.5 nm) and the film becomes more hydrophilic. This sequence—charge compensation, inversion and restabilisation by excess cations—is the classical response of a negatively charged sol to a cationic additive [19,20,21].
A charge balance shows that the measured ζ-values cannot be explained by complete adsorption of guanidinium. For 15 g of 30% sol (4.5 g SiO2, total surface 560–1020 m2) and a surface charge density of 0.01–0.05 C m−2 at pH 6–8 [73], the total negative charge of the particles is 0.06–0.53 mmol, i.e., only 0.01–0.09 g of modifier would suffice to neutralise it, whereas 40 g provides ≈450–4100 times more guanidinium than surface sites. Hence most of the cations remain in solution, and the slow approach of ζ to zero over the 0–40 g range indicates weak adsorption under conditions of strong screening and competition. A Stern–Langmuir analysis with an adsorption constant K of 6·102–5·103 M−1 places the charge neutralisation concentration at c0 = 0.5/K = 0.05–5 mM and predicts ζ ≈ +9 mV at the base-formulation concentration (≈261 mM) irrespective of K, in reasonable agreement with the measured +2.5 mV. Adsorption of PVA, which shifts the shear plane outwards, and the decrease in pH towards the isoelectric point of silica (pH 2–3) also reduce |ζ| [15,18]. A dedicated ζ(c) titration in the micromolar–millimolar range is required to determine K experimentally.
The ionic strength of all practical formulations (20–60 g modifier; 0.13–0.39 mol kg−1) compresses the diffuse layer below 1 nm (Table 7). DLVO calculations (Figure 7) give an energy barrier of ≈48 kT at 1 mM and ≈10 kT at 10 mM; the barrier falls below 15 kT above ≈7 mM and vanishes at ≥ 100 mM. If the diffuse-layer potential is instead identified with the measured ζ-potential of the sol (−28.6 mV), the barrier does not exceed ≈6 kT even at 1 mM (Figure 7b), which reinforces this conclusion. Therefore none of the formulations with 20–60 g modifier is stabilised electrostatically. The model is semi-quantitative (the Derjaguin approximation loses accuracy at κa ≈ 1), and silica is known to be more stable than predicted by DLVO theory owing to hydration forces [82,83,84]. The absence of an electrostatic barrier therefore does not imply fast coagulation; rather, the homogeneity and 120-day shelf life of the base formulation are attributed to steric stabilisation by PVA macromolecules adsorbed on SiO2 together with hydration repulsion [11,13,14].
The silica content has a strong, non-linear effect on the dispersion (Figure 8, Table 8). Between 5 and 15 g of sol, Dh increases only from 68.4 to 89.6 nm, and the base formulation (15 g; 3.07% SiO2 in the dry composite) has a shelf life of 120 days. At 20 g, Dh rises to 136.5 nm and the shelf life falls to 30 days because aggregation starts; at 25 g (198.7 nm, 7 days) the films become brittle and non-uniform. In parallel, the dynamic viscosity increases from 420 to 1900 mPa·s, the flow index decreases from 0.82 to 0.48 and the hysteresis area increases from 18.5 to 105.6 Pa s−1, i.e., the formulation becomes more pseudoplastic and thixotropic as a particle network forms [13,64,65]. The base formulation (950 mPa·s, n = 0.68, 43.2 Pa s−1) combines good spreading under shear with resistance to sagging at rest.
3.6. Wetting, Adhesion, Water Resistance and Antibacterial Activity
Contact angles of the formulation on glass (31.4°) and ceramic (28.7°) were markedly lower than on metal (48.5°) and wood (63.2°) (Table 9). The work of adhesion, estimated with the Young–Dupré equation using γL = 72.7 mN m−1 because the surface tension of the formulation was not determined, follows the same order: ceramic > glass > metal > wood. Since PVA is surface-active and lowers γL, the absolute Wa values are upper-bound estimates, but the ranking is not affected. The better wetting of the high-energy, silanol-rich mineral surfaces (γS = 52.7–55.3 mN m−1) is consistent with electrostatic and hydrogen-bond interactions of the cationic guanidinium centres with substrates that are chemically similar to the silica filler [85,86].
The lap-shear strength of the composite exceeded that of the unmodified PVAc reference on all substrates (Figure 9a): 6.8 vs. 4.2 MPa on metal (+61.9%), 5.2 vs. 3.6 MPa on wood (+44.4%), 6.1 vs. 4.0 MPa on glass (+52.5%) and 6.4 vs. 4.1 MPa on ceramic (+56.1%). Failure was cohesive on wood, glass and ceramic, and mixed (mainly cohesive) on metal, indicating that the adhesive–substrate interface is not the weakest element of the joint. The increase in strength is attributed to (i) silica particles acting as physical crosslinks in the matrix, (ii) electrostatic adsorption of guanidinium on the substrate, which strengthens the boundary layer [12], and (iii) hydrogen bonding between the modifier and PVA, reflected by the broad 3367 cm−1 band [75]. The PVA-based composite (variant A) had a compressive strength of 12.5 MPa, a tensile strength of 8.4 MPa and an elongation of 86.0%, whereas the epoxy-based variant B reached 28.6 and 16.8 MPa but only 6.5% elongation. Variant A is thus suited to flexible joints and porous or mineral substrates, and variant B to rigid, highly loaded joints [87,88,89].
After 24 h in water, the composite gained only 1.8% in mass compared with 7.6% for the reference, retained 96.4% of its strength (reference 78.5%) and showed no swelling, cracking or disintegration, whereas the reference swelled and softened slightly. The temperature of 5% mass loss was ≈140 °C for the composite and ≈115 °C for the reference. Formaldehyde modification (hemiformal and partial acetal formation) is expected to reduce the number of free hydroxyl groups and chain mobility, and well-dispersed silica particles lengthen the diffusion path of water [9,10]. Excess modifier has the opposite effect, because the ionic salt is hydrophilic.
The modifier-free formulation showed no antibacterial activity, whereas the composite produced inhibition zones of 12.6, 18.4 and 20.7 mm at 20, 40 and 60 g of modifier (Figure 9b). After washing, the zones were 9.8, 16.9 and 15.4 mm, corresponding to 77.8, 91.8 and 74.4% retained activity. The base formulation (40 g) therefore combines high initial activity with the highest wash resistance, while at 60 g part of the modifier is evidently weakly bound and is washed out. Because the agar-diffusion test detects only the fraction of the biocide that can diffuse into the medium, the retained inhibition zones characterise the wash-resistant but still mobile fraction of guanidinium; the activity of the immobilised fraction has to be quantified by contact-killing tests [36,41]. Retention of activity is attributed to incorporation of acrylic fragments into polymer chains (the FTIR and DTA data show practically no residual vinyl monomer) and to adsorption and hydrogen bonding of guanidinium cations on silica particles [24,30,32,41]. The mechanism of action—adsorption of permanently charged guanidinium groups on the negatively charged bacterial membrane followed by its disruption—is the same as for guanidine polymers [25,26,27].
Table 10 compares the composite with requirements and data for commercial adhesives. Its viscosity (0.95 Pa·s) falls within the range of low-viscosity PVAc dispersions [90], so standard application equipment can be used. However, its strength on wood (5.2 MPa) is below the EN 204 [91] requirement for durability classes D1–D3 under standard conditions (10 N mm−2, determined on beech specimens according to EN 205), and its strength on steel is well below that of a commercial structural epoxy (22.6 N mm−2, ISO 4587) [92]. The composite is therefore not intended for load-bearing structural joints; its advantages—wash-resistant antibacterial activity, low water uptake and good adhesion to mineral surfaces—make it suitable for moderately loaded joints and protective coatings on glass, ceramic and metal where biostability is required. Classification according to EN 204 requires additional testing according to EN 205. Because about 57 wt% of the modifier is GuCl, the dry adhesive contains ≈5.8 wt% chloride; for bonding of corrosion-sensitive metals, partial replacement of chloride, e.g., by anion exchange, should be considered.
3.7. Material Balance, Atom Economy and Raw-Material Cost
The material balance was calculated for 100 kg of GT (0.846 kmol) from the stoichiometry of reactions (1) and (3) and the base formulation. Stage I consumes 72.1 kg of CuCl2·2H2O and 26.9 kg of copper (GT : Cu2+ : Cu0 = 2 : 1 : 1) and gives 102.9 kg of CuSCN theoretically (94.7 kg at the experimental yield of 92%), 80.8 kg of GuCl in the filtrate and 15.2 kg of water released from the crystal hydrate; no acid is formed, and no acidic effluent has to be neutralised. With both CuSCN and GuCl counted as products, the atom economy of stage I is 92.3%. Stage II consumes 61.0 kg of acrylic acid and yields 141.8 kg of the GA modifier. For 1 t of the base adhesive formulation (variant A; dry-component basis: PVA 100, modifier 40, silica sol 15 and formalin 5 mass parts), 176.3 kg of waste GT is processed and 166.9 kg of CuSCN is obtained as a by-product. The GT-derived raw materials therefore close the loop for both ions of the waste: the guanidinium cation becomes the functional component of the adhesive, and the thiocyanate anion becomes a marketable copper(I) salt. The only aqueous effluent consists of the CuSCN washings, from which residual copper is precipitated as hydroxide.
A raw-material cost estimate for 1 t of the base formulation, based on market prices of June–October 2026 [94,95,96,97,98] and on zero cost of the waste GT, is given in Table 11. The total raw-material cost is ≈2600 USD t−1; PVA (38.9%), CuCl2·2H2O (29.3%) and copper (25.7%) are the main items. Sale of the CuSCN by-product offsets 35.8% of the cost of the copper reagents and lowers the net raw-material cost to ≈2090 USD t−1, i.e., ≈2.3 USD per kg of dry matter (dry-matter content 0.915), compared with retail prices of ≈4.5–5.1 USD per kg of dry matter for commercial PVA wood glues in Uzbekistan [97,98]. The difference is not a profit margin, since energy, labour, depreciation and packaging are not included, but it shows that the process is not penalised by the cost of thiocyanate removal; the use of secondary copper turnings would reduce the cost further.
4. Conclusions
A one-step route for the valorisation of waste guanidine thiocyanate has been developed. Treatment of aqueous GT with CuCl2 in the presence of metallic copper at 20–30 °C removes thiocyanate as β-CuSCN in 92% yield by Cu2+/Cu0 synproportionation (ΔE° = +1.14 V, lg K = 19.3), without oxidation of thiocyanate, without nitric acid and without formation of acid; the guanidinium cation remains in solution as GuCl and is used directly in the next stage. FTIR confirms the complete disappearance of the ν(SCN) band at 2051 cm−1.
Reaction of GuCl with acrylic acid without a neutraliser is thermodynamically unfavourable (K ≈ 7·10−11; 0.53% acrylate at pH 1.98), and FTIR shows that the product consists of guanidinium salts and partially polymerised, mostly non-ionised acrylic acid. This modifier nevertheless performs well in a formalin-modified PVA/silica sol adhesive, where the COOH/COO− system buffers the formulation at pH 4.5–7.0.
In the formulation, guanidinium reverses the ζ-potential of silica from −28.6 to +2.5 mV at 40 g per 100 g PVA, but the high ionic strength (≈0.26 mol kg−1) eliminates the electrostatic DLVO barrier; the stability of the base formulation (120 days) is due to steric stabilisation by adsorbed PVA. The optimum composition (PVA 100 : modifier 40 : 30% silica sol 15 : formalin 5) gives 950 mPa·s, lap-shear strengths of 5.2–6.8 MPa (+44–62% vs. PVAc), 1.8% water uptake, 96.4% strength retention after water exposure, thermal stability up to 100 °C and wash-resistant antibacterial activity (91.8% retained). The adhesive is intended for moderately loaded joints and coatings requiring biostability; for structural applications and EN 204 classification, further testing is required. The process closes the loop for both ions of the waste: 176 kg of GT per tonne of adhesive is converted, 167 kg of marketable CuSCN is co-produced, and the net raw-material cost is ≈2.1 kUSD t−1. Further work will address the quantitative composition of the modifier (1H NMR, titration), contact-killing tests according to ISO 22196 and partial replacement of chloride for metal bonding.
Author Contributions
Conceptualization, O.H.Q. and B.B.O.; methodology, O.H.Q.; formal analysis, O.H.Q. and S.F.F.; investigation, O.H.Q., F.I.O., B.N.U., I.A.B., S.F.F. and N.O‘.Sh.; data curation, F.I.O. and N.O‘.Sh.; visualization, B.N.U.; validation, V.N.A. and I.A.B.; resources, V.N.A.; writing—original draft preparation, O.H.Q.; writing—review and editing, B.B.O., V.N.A. and S.F.F.; supervision, B.B.O. All authors have read and agreed to the published version of the manuscript.
Funding
This research received no external funding.
Institutional Review Board Statement
Not applicable.
Informed Consent Statement
Not applicable.
Data Availability Statement
The original data presented in this study are available on request from the corresponding author.
Acknowledgments
The authors gratefully acknowledge Bukhara State Technical University for providing the institutional support and research facilities necessary to conduct this study.
Conflicts of Interest
The authors declare no conflicts of interest.
References
- Gadhave, R.V. Wood adhesive based on polyvinyl alcohol stabilized polyvinyl acetate, vinyl neodecanoate, vinyl trimethoxy silane, and N-methylol acrylamide copolymer emulsion: synthesis and characterization. J. Adhes. Sci. Technol. 2025, 39, 993–1009. [Google Scholar] [CrossRef]
- Xu, D.; Li, C.; Zhou, Y.; Wang, Z.; Hou, D.; Lei, H.; et al. Feasibly Developing Polyester-Type Poly(vinyl alcohol) Adhesive in One Go with High Water Resistance and Bonding Performance. Langmuir 2024, 40, 25967–25977. [Google Scholar] [CrossRef] [PubMed]
- Shirshin, K.V.; Lobanova, K.S.; Vdovina, O.S.; Petrovskaya, N.A. Water-Resistant Polyvinyl Acetate Adhesives: A Review. Polym. Sci. Ser. D. 2026, 19, 354–359. [Google Scholar] [CrossRef]
- Kumar, C.; Leggate, W. An overview of bio-adhesives for engineered wood products. Int. J. Adhes. Adhes. 2022, 118, 103187. [Google Scholar] [CrossRef]
- Sierra-Romero, A.; Novakovic, K.; Geoghegan, M. Adhesive Interfaces toward a Zero-Waste Industry. Langmuir 2022, 38, 15476–15493. [Google Scholar] [CrossRef] [PubMed]
- Zhang, Z.; Liu, Y.; Lin, S.; Wang, Q. Preparation and properties of glutaraldehyde crosslinked poly(vinyl alcohol) membrane with gradient structure. J. Polym. Res. 2020, 27, 228. [Google Scholar] [CrossRef]
- Chousidis, N. Polyvinyl alcohol (PVA)-based films: insights from crosslinking and plasticizer incorporation. Eng. Res. Express 2024, 6, 025010. [Google Scholar] [CrossRef]
- Hu, P.; Jia, M.; Zuo, Y.; He, L. A silica/PVA adhesive hybrid material with high transparency, thermostability and mechanical strength. RSC Adv. 2017, 7, 2450–2459. [Google Scholar] [CrossRef]
- Tan, X.; Liang, C.; Bai, S.; Lan, P.; Ren, Y.; Zhao, J.; et al. PVA/silica hybrid hydrogel with ultra-high strength and toughness. J. Mater. Sci. 2024, 59, 6916–6928. [Google Scholar] [CrossRef]
- Liu, D.; Yuan, L.; Xu, H.; Tian, H.; Xiang, A. PVA grafted POSS hybrid for high performance polyvinyl alcohol films with enhanced thermal, hydrophobic and mechanical properties. Polym. Compos. 2019, 40, 2768–2776. [Google Scholar] [CrossRef]
- Wei, Q.; Wang, Y.; Zhang, Y.; Chen, X. Aggregation Behavior of Nano-Silica in Polyvinyl Alcohol/Polyacrylamide Hydrogels Based on Dissipative Particle Dynamics. Polymers 2017, 9, 611. [Google Scholar] [CrossRef] [PubMed]
- Irfan, M.; Requena, G.; Haubrich, J. The effect of weak boundary layers on adhesion properties of laser pretreated aluminum alloy EN-AW 6082 surfaces. Int. J. Adhes. Adhes. 2022, 119, 103271. [Google Scholar] [CrossRef]
- Kawaguchi, M. Dispersion stability and rheological properties of silica suspensions in aqueous solutions. Adv. Colloid Interface Sci. 2020, 284, 102248. [Google Scholar] [CrossRef] [PubMed]
- Lee, S.H.; Kim, S.Y.; Salehiyan, R.; Hyun, K. Effects of silica nanoparticles on the rheological properties and morphologies of polyvinyl alcohol/silver nanowire suspensions. Korea-Aust. Rheol. J. 2021, 33, 321–331. [Google Scholar] [CrossRef]
- Kosmulski, M. The pH dependent surface charging and points of zero charge. VIII. Update. Adv. Colloid Interface Sci. 2020, 275, 102064. [Google Scholar] [CrossRef] [PubMed]
- Sögaard, C.; Kolman, K.; Christensson, M.; Otyakmaz, A.B.; Abbas, Z. Hofmeister effects in the gelling of silica nanoparticles in mixed salt solutions. Colloids Surf. A Physicochem. Eng. Asp. 2021, 611, 125872. [Google Scholar] [CrossRef]
- Trompette, J.-L. Influence of Co-Ion Nature on the Gelation Kinetics of Colloidal Silica Suspensions. J. Phys. Chem. B 2017, 121, 5654–5659. [Google Scholar] [CrossRef] [PubMed]
- Jalil, A.H.; Pyell, U. Quantification of Zeta-Potential and Electrokinetic Surface Charge Density for Colloidal Silica Nanoparticles Dependent on Type and Concentration of the Counterion: Probing the Outer Helmholtz Plane. J. Phys. Chem. C 2018, 122, 4437–4453. [Google Scholar] [CrossRef]
- Kosior, D.; Maroni, P.; Borkovec, M. Particle Deposition to Silica Surfaces Functionalized with Cationic Polyelectrolytes. Colloids Interfaces 2021, 5, 26. [Google Scholar] [CrossRef]
- Agrawal, N.R.; Duan, C.; Wang, R. Nature of Overcharging and Charge Inversion in Electrical Double Layers. J. Phys. Chem. B 2024, 128, 303–311. [Google Scholar] [CrossRef] [PubMed]
- Boakye-Ansah, S.; Khan, M.A.; Haase, M.F. Controlling Surfactant Adsorption on Highly Charged Nanoparticles to Stabilize Bijels. J. Phys. Chem. C 2020, 124, 12417–12423. [Google Scholar] [CrossRef] [PubMed]
- Xu, B.; Jacobs, M.I.; Kostko, O.; Ahmed, M. Guanidinium Group Remains Protonated in a Strongly Basic Arginine Solution. ChemPhysChem 2017, 18, 1503–1506. [Google Scholar] [CrossRef] [PubMed]
- Dardonville, C.; Caine, B.A.; Navarro de la Fuente, M.; Martín Herranz, G.; Corrales Mariblanca, B.; Popelier, P.L.A. Substituent effects on the basicity (pKa) of aryl guanidines and 2-(arylimino)imidazolidines: correlations of pH-metric and UV-metric values with predictions from gas-phase ab initio bond lengths. New J. Chem. 2017, 41, 11016–11028. [Google Scholar] [CrossRef]
- Negi, I.; Jangra, R.; Gharu, A.; Trant, J.F.; Sharma, P. Guanidinium–amino acid hydrogen-bonding interactions in protein crystal structures: implications for guanidinium-induced protein denaturation. Phys. Chem. Chem. Phys. 2023, 25, 857–869. [Google Scholar] [CrossRef] [PubMed]
- Haktaniyan, M.; Bradley, M. Polymers showing intrinsic antimicrobial activity. Chem. Soc. Rev. 2022, 51, 8584–8611. [Google Scholar] [CrossRef] [PubMed]
- Cao, X.; Meng, L.; Zhang, N.; Zhou, Z. Microscopic Examination of Polymeric Monoguanidine, Hydrochloride-Induced Cell Membrane Damage in Multidrug-Resistant Pseudomonas aeruginosa. Polymers 2017, 9, 398. [Google Scholar] [CrossRef] [PubMed]
- Tan, J.; Zhao, Y.; Hedrick, J.L.; Yang, Y.Y. Effects of Hydrophobicity on Antimicrobial Activity, Selectivity, and Functional Mechanism of Guanidinium-Functionalized Polymers. Adv. Healthc. Mater. 2022, 11, 2100482. [Google Scholar] [CrossRef] [PubMed]
- Olewnik-Kruszkowska, E.; Gierszewska, M.; Jakubowska, E.; Tarach, I.; Sedlarik, V.; Pummerova, M. Antibacterial Films Based on PVA and PVA–Chitosan Modified with Poly(Hexamethylene Guanidine). Polymers 2019, 11, 2093. [Google Scholar] [CrossRef] [PubMed]
- Yang, X.; Wang, B.; Sha, D.; Liu, Y.; Liu, Z.; Shi, K.; et al. PVA/Poly(hexamethylene guanidine)/Gallic Acid Composite Hydrogel Films and Their Antibacterial Performance. ACS Appl. Polym. Mater. 2021, 3, 3867–3877. [Google Scholar] [CrossRef]
- Gong, W.; Wei, D.; Zhang, S.; Jiang, Y.; Ye, J.; Zheng, A.; et al. Nonleaching antimicrobial poly(vinyl alcohol)/polyhexamethylene guanidine hydrochloride hydrogels reinforced by hydrogen bond. Polym. Adv. Technol. 2020, 31, 3238–3246. [Google Scholar] [CrossRef]
- Ding, X.; Chen, F.; Guan, Y.; Zheng, A.; Wei, D.; Xu, X. Preparation and properties of an antimicrobial acrylic coating modified with guanidinium oligomer. J. Coat. Technol. Res. 2020, 17, 1505–1513. [Google Scholar] [CrossRef]
- Cao, W.; Wei, D.; Jiang, Y.; Ye, S.; Zheng, A.; Guan, Y. Surface chemical bonding with poly(hexamethylene guanidine) for non-leaching antimicrobial poly(ethylene terephthalate). J. Mater. Sci. 2019, 54, 2699–2711. [Google Scholar] [CrossRef]
- Wang, Y.; Yu, W.; Shu, A.; Shi, J.; Zhang, M. Polypropylene-Grafted Poly(hexamethylene guanidine)/Modified Polyethylene Monofilament and Its Antimicrobial Performance. Int. J. Polym. Sci. 2020, 2020, 6416230. [Google Scholar] [CrossRef]
- Babaahmadi, M.; Yeganeh, H. Polyhexamethylene guanidine hydrochloride-functionalized wound dressings: Physical, mechanical and biological evaluations. Polym. Adv. Technol. 2023, 34, 3236–3246. [Google Scholar] [CrossRef]
- Silvestrin, L.B.; Garcia, I.M.; Visioli, F.; Collares, F.M.; Leitune, V.C.B. Physicochemical and biological properties of experimental dental adhesives doped with a guanidine-based polymer: an in vitro study. Clin. Oral Investig. 2022, 26, 3627–3636. [Google Scholar] [CrossRef] [PubMed]
- Bromberg, L.; Magariños, B.; Concheiro, A.; Hatton, T.A.; Alvarez-Lorenzo, C. Nonleaching Biocidal N-Halamine-Functionalized Polyamine-, Guanidine-, and Hydantoin-Based Coatings. Ind. Eng. Chem. Res. 2024, 63, 6268–6278. [Google Scholar] [CrossRef] [PubMed]
- Li, Y.; Cai, P.; Tong, Z.; Xiao, H.; Pan, Y. Preparation of Copolymer-Based Nanoparticles with Broad-Spectrum Antimicrobial Activity. Polymers 2017, 9, 717. [Google Scholar] [CrossRef] [PubMed]
- Kamaruzzaman, N.F.; Chong, S.Q.Y.; Edmondson-Brown, K.M.; Ntow-Boahene, W.; Bardiau, M.; Good, L. Bactericidal and Anti-biofilm Effects of Polyhexamethylene Biguanide in Models of Intracellular and Biofilm of Staphylococcus aureus Isolated from Bovine Mastitis. Front. Microbiol. 2017, 8, 1518. [Google Scholar] [CrossRef] [PubMed]
- Liu, W.; Zhang, J.; Chen, L. Poly(hexamethylene guanidine): An Effective Compound in Tackling Persistent Bacterial Subpopulations. Microorganisms 2025, 13. [Google Scholar] [CrossRef] [PubMed]
- Rao, Y.; Zou, X.; Shen, X.; Zhang, H.; Gao, S.; Guo, J.; et al. Regulation of Hydrophobic Structures of Antibacterial Guanidinium-Based Amphiphilic Polymers for Subcutaneous Implant Applications. Biomacromolecules 2024, 25, 89–103. [Google Scholar] [CrossRef] [PubMed]
- Dong, J.J.; Muszanska, A.; Xiang, F.; Falkenberg, R.; van de Belt-Gritter, B.; Loontjens, T. Contact Killing of Gram-Positive and Gram-Negative Bacteria on PDMS Provided with Immobilized Hyperbranched Antibacterial Coatings. Langmuir 2019, 35, 14108–14116. [Google Scholar] [CrossRef] [PubMed]
- Li, Q.; Yan, F.; Texter, J. Polymerized and Colloidal Ionic Liquids─Syntheses and Applications. Chem. Rev. 2024, 124, 3813–3931. [Google Scholar] [CrossRef] [PubMed]
- Niyozov, E.; Razzakov, K.; Nazarov, S.; Olimov, B.; Gafurova, G. Investigation of physicochemical properties of guanidine-based corrosion inhibitor. E3S Web Conf. 2024, 587, 03004. [Google Scholar] [CrossRef]
- Wang, L.; An, X.; Xiao, X.; Li, N.; Xie, D.; Lai, F.; et al. Treatment of thiocyanate-containing wastewater: a critical review of thiocyanate destruction in industrial effluents. World J. Microbiol. Biotechnol. 2023, 39, 35. [Google Scholar] [CrossRef] [PubMed]
- Turan, A.; Keyikoglu, R.; Kobya, M.; Khataee, A. Degradation of thiocyanate by electrochemical oxidation process in coke oven wastewater: Role of operative parameters and mechanistic study. Chemosphere 2020, 255, 127014. [Google Scholar] [CrossRef] [PubMed]
- Shafiei, F.; Watts, M.P.; Pajank, L.; Moreau, J.W. The effect of heavy metals on thiocyanate biodegradation by an autotrophic microbial consortium enriched from mine tailings. Appl. Microbiol. Biotechnol. 2021, 105, 417–427. [Google Scholar] [CrossRef] [PubMed]
- Arora, N.; Dar, M.I.; Hinderhofer, A.; Pellet, N.; Schreiber, F.; Zakeeruddin, S.M.; et al. Perovskite solar cells with CuSCN hole extraction layers yield stabilized efficiencies greater than 20%. Science 2017, 358, 768–771. [Google Scholar] [CrossRef] [PubMed]
- Wang, B.; Nam, S.; Limbu, S.; Kim, J.-S.; Riede, M.; Bradley, D.D.C. Properties and Applications of Copper(I) Thiocyanate Hole-Transport Interlayers Processed from Different Solvents. Adv. Electron. Mater. 2022, 8, 2101253. [Google Scholar] [CrossRef]
- Wijesekara, A.; Varagnolo, S.; Dabera, G.D.M.R.; Marshall, K.P.; Pereira, H.J.; Hatton, R.A. Assessing the suitability of copper thiocyanate as a hole-transport layer in inverted CsSnI3 perovskite photovoltaics. Sci. Rep. 2018, 8, 15722. [Google Scholar] [CrossRef] [PubMed]
- Paz-Villarraga, C.A.; Castro, Í.B.; Fillmann, G. Biocides in antifouling paint formulations currently registered for use. Environ. Sci. Pollut. Res. 2022, 29, 30090–30101. [Google Scholar] [CrossRef] [PubMed]
- Zeringue, C.T.; Chirdon, W.M.; Sharp, W.; Gang, D.; Khattab, A.; Hernandez, R.; et al. Production of Sustainable Green Adhesives from Proteinaceous Biomass with an Emphasis on Waste-Derived Protein Residuals: A Review. Ind. Eng. Chem. Res. 2023, 62, 12716–12731. [Google Scholar] [CrossRef]
- Ferrari, F.; Striani, R.; Fico, D.; Alam, M.M.; Greco, A.; Esposito Corcione, C. An Overview on Wood Waste Valorization as Biopolymers and Biocomposites: Definition, Classification, Production, Properties and Applications. Polymers 2022, 14, 5519. [Google Scholar] [CrossRef] [PubMed]
- Olimov, B.; Ramazanov, B.; Akhmedov, V.; Fatilloyev, S.; Murodov, D.; O̒rinov, K. Valorisation of Secondary Petrochemical Feedstocks into a Multicomponent Demulsifier: Sodium Xylenesulfonate from Pyrolysis-Derived Xylene Formulated with Alkaline-Earth Stearates and Waste Motor Oil. Chemistry 2026, 8, 150. [Google Scholar] [CrossRef]
- Fatilloyev, S.; Umirov, F.; Maxmudov, R.; Voxidov, E.; Usanbayev, N.; Axmedov, V.; Temirov, U.; Olimov, B. Diffusion-controlled nitrogen release in microwave-induced organo-mineral urea composites. J. Indian Chem. Soc. 2026, 103, 103155. [Google Scholar] [CrossRef]
- Nakamoto, K. Infrared and Raman Spectra of Inorganic and Coordination Compounds. Part A: Theory and Applications in Inorganic Chemistry, 6th ed.; John Wiley & Sons: Hoboken, NJ, USA, 2009. [Google Scholar]
- Ohshima, H. A Simple Expression for Henry’s Function for the Retardation Effect in Electrophoresis of Spherical Colloidal Particles. J. Colloid Interface Sci. 1994, 168, 269–271. [Google Scholar] [CrossRef]
- Skoglund, S.; Hedberg, J.; Yunda, E.; Godymchuk, A.; Blomberg, E.; Odnevall Wallinder, I. Difficulties and flaws in performing accurate determinations of zeta potentials of metal nanoparticles in complex solutions—Four case studies. PLoS ONE 2017, 12, e0181735. [Google Scholar] [CrossRef] [PubMed]
- Ramaye, Y.; Dabrio, M.; Roebben, G.; Kestens, V. Development and Validation of Optical Methods for Zeta Potential Determination of Silica and Polystyrene Particles in Aqueous Suspensions. Materials 2021, 14, 290. [Google Scholar] [CrossRef] [PubMed]
- Huhtamäki, T.; Tian, X.; Korhonen, J.T.; Ras, R.H.A. Surface-wetting characterization using contact-angle measurements. Nat. Protoc. 2018, 13, 1521–1538. [Google Scholar] [CrossRef] [PubMed]
- Martha, R.; Dirna, F.C.; Hasanusi, A.; Rahayu, I.S.; Darmawan, W. Surface free energy of 10 tropical woods species and their acrylic paint wettability. J. Adhes. Sci. Technol. 2020, 34, 167–177. [Google Scholar] [CrossRef]
- Benkreif, R.; Brahmia, F.Z.; Csiha, C. Influence of moisture content on the contact angle and surface tension measured on birch wood surfaces. Eur. J. Wood Wood Prod. 2021, 79, 907–913. [Google Scholar] [CrossRef]
- Amin, Y.; Nugroho, N.; Bahtiar, E.T.; Dwianto, W.; Lubis, M.A.R.; Adzkia, U.; et al. Surface Roughness, Dynamic Wettability, and Interphase of Modified Melamine Formaldehyde-Based Adhesives on Jabon Wood. Polymers 2024, 16, 1084. [Google Scholar] [CrossRef] [PubMed]
- Owens, D.K.; Wendt, R.C. Estimation of the surface free energy of polymers. J. Appl. Polym. Sci. 1969, 13, 1741–1747. [Google Scholar] [CrossRef]
- Bonn, D.; Denn, M.M.; Berthier, L.; Divoux, T.; Manneville, S. Yield stress materials in soft condensed matter. Rev. Mod. Phys. 2017, 89, 035005. [Google Scholar] [CrossRef]
- Larson, R.G.; Wei, Y. A review of thixotropy and its rheological modeling. J. Rheol. 2019, 63, 477–501. [Google Scholar] [CrossRef]
- ISO 4587:2003; Adhesives—Determination of Tensile Lap-Shear Strength of Rigid-to-Rigid Bonded Assemblies. International Organization for Standardization: Geneva, Switzerland, 2003.
- Budhe, S.; Banea, M.D.; de Barros, S.; da Silva, L.F.M. An updated review of adhesively bonded joints in composite materials. Int. J. Adhes. Adhes. 2017, 72, 30–42. [Google Scholar] [CrossRef]
- Demiral, M. Strength in Adhesion: A Multi-Mechanics Review Covering Tensile, Shear, Fracture, Fatigue, Creep, and Impact Behavior of Polymer Bonding in Composites. Polymers 2025, 17, 2600. [Google Scholar] [CrossRef] [PubMed]
- Rumble, J.R. (Ed.) CRC Handbook of Chemistry and Physics, 104th ed.; CRC Press: Boca Raton, FL, USA, 2023. [Google Scholar]
- Derjaguin, B.; Landau, L. Theory of the stability of strongly charged lyophobic sols and of the adhesion of strongly charged particles in solutions of electrolytes. Prog. Surf. Sci. (reprint of Acta Physicochim. URSS 1941, 14, 633). 1993, 43, 30–59. [Google Scholar] [CrossRef]
- Verwey, E.J.W.; Overbeek, J.Th.G. Theory of the Stability of Lyophobic Colloids; Elsevier: Amsterdam, The Netherlands, 1948. [Google Scholar]
- Bergström, L. Hamaker constants of inorganic materials. Adv. Colloid Interface Sci. 1997, 70, 125–169. [Google Scholar] [CrossRef]
- Bolt, G.H. Determination of the Charge Density of Silica Sols. J. Phys. Chem. 1957, 61, 1166–1169. [Google Scholar] [CrossRef]
- Sun, Y.; Zhang, R.; Sun, C.; Liu, Z.; Zhang, J.; Liang, S.; et al. Quantitative Assessment of Interfacial Interactions Governing Ultrafiltration Membrane Fouling by the Mixture of Silica Nanoparticles (SiO2 NPs) and Natural Organic Matter (NOM): Effects of Solution Chemistry. Membranes 2023, 13, 449. [Google Scholar] [CrossRef] [PubMed]
- Li, X.; Wang, Z.; Li, W.; Sun, J. Superstrong Water-Based Supramolecular Adhesives Derived from Poly(vinyl alcohol)/Poly(acrylic acid) Complexes. ACS Mater. Lett. 2021, 3, 875–882. [Google Scholar] [CrossRef]
- Tsioptsias, C.; Fardis, D.; Ntampou, X.; Tsivintzelis, I.; Panayiotou, C. Thermal Behavior of Poly(vinyl alcohol) in the Form of Physically Crosslinked Film. Polymers 2023, 15, 1843. [Google Scholar] [CrossRef] [PubMed]
- Santos, F.B.; Miranda, N.T.; Schiavon, M.I.R.B.; Fregolente, L.V.; Wolf Maciel, M.R. Thermal degradation kinetic of poly(acrylamide-co-sodium acrylate) hydrogel applying isoconversional methods. J. Therm. Anal. Calorim. 2021, 146, 2503–2514. [Google Scholar] [CrossRef]
- Suleiman, G.S.A.; Zeng, X.; Chakma, R.; Wakai, I.Y.; Feng, Y. Recent advances and challenges in thermal stability of PVA-based film: A review. Polym. Adv. Technol. 2024, 35, e6327. [Google Scholar] [CrossRef]
- Otaru, A.J.; Albin Zaid, Z.A.A. Analysis of TGA data for polyvinyl alcohol at slow heating rate using deep neural networks, activation energy, and activation enthalpy. Sci. Rep. 2025, 15, 37915. [Google Scholar] [CrossRef] [PubMed]
- Liu, Y.; Wang, X.; Shu, C.-M.; Wang, Y.; Zhao, D.; Chen, W.; et al. Thermal hazard evolution on guanidine nitrate. J. Therm. Anal. Calorim. 2018, 133, 659–671. [Google Scholar] [CrossRef]
- Iler, R.K. The Chemistry of Silica: Solubility, Polymerization, Colloid and Surface Properties, and Biochemistry; Wiley: New York, NY, USA, 1979. [Google Scholar]
- Klaassen, A.; Liu, F.; Mugele, F.; Siretanu, I. Correlation between Electrostatic and Hydration Forces on Silica and Gibbsite Surfaces: An Atomic Force Microscopy Study. Langmuir 2022, 38, 914–926. [Google Scholar] [CrossRef] [PubMed]
- Luo, Y.; Gao, X.; Tian, R.; Li, H. Approach to Estimation of Hamaker Constant as Taking Hofmeister Effects into Account. J. Phys. Chem. C 2018, 122, 9432–9440. [Google Scholar] [CrossRef]
- Tuladhar, A.; Dewan, S.; Pezzotti, S.; Brigiano, F.S.; Creazzo, F.; Gaigeot, M.-P.; et al. Ions Tune Interfacial Water Structure and Modulate Hydrophobic Interactions at Silica Surfaces. J. Am. Chem. Soc. 2020, 142, 6991–7000. [Google Scholar] [CrossRef] [PubMed]
- Pstrowska, K.; Gunka, V.; Sidun, I.; Demchuk, Y.; Vytrykush, N.; Kułażyński, M.; et al. Adhesion in Bitumen/Aggregate System: Adhesion Mechanism and Test Methods. Coatings 2022, 12, 1934. [Google Scholar] [CrossRef]
- Mashayekhi, F.; Bardon, J.; Westermann, S.; Addiego, F. Adhesion Optimization between Incompatible Polymers through Interfacial Engineering. Polymers 2021, 13, 4273. [Google Scholar] [CrossRef] [PubMed]
- Soliman, S.M.A.; Abdelhakim, M.; Sabaa, M.W. Study curing of epoxy resin by Isophoronediamine/ Triethylenetetramine and reinforced with montmorillonite and effect on compressive strength. BMC Chem. 2024, 18, 211. [Google Scholar] [CrossRef] [PubMed]
- Ahmadi, Z. Nanostructured epoxy adhesives: A review. Prog. Org. Coat. 2019, 135, 449–453. [Google Scholar] [CrossRef]
- Branda, F.; Grappa, R.; Costantini, A.; Luciani, G. Sol–Gel Approach for Fabricating Silica/Epoxy Nanocomposites. Polymers 2023, 15, 2987. [Google Scholar] [CrossRef] [PubMed]
- GOST 18992-80; Polyvinyl Acetate Homopolymer Coarse Dispersion. Specifications. (In Russian). Izdatel’stvo Standartov: Moscow, Russia, 1980.
- EN 204:2016; Classification of Thermoplastic Wood Adhesives for Non-Structural Applications. European Committee for Standardization (CEN): Brussels, Belgium, 2016.
- Henkel. LOCTITE EA E-20HP, Technical Data Sheet. Available online: https://datasheets.tdx.henkel.com/LOCTITE-EA-E-20HP-en_GL.pdf (accessed on 16 October 2026).
- Trummal, A.; Lipping, L.; Kaljurand, I.; Koppel, I.A.; Leito, I. Acidity of Strong Acids in Water and Dimethyl Sulfoxide. J. Phys. Chem. A 2016, 120, 3663–3669. [Google Scholar] [CrossRef] [PubMed]
- Analytiq, Business. Price Indices: Polyvinyl Alcohol, Acrylic Acid, Formaldehyde and Copper. Available online: https://businessanalytiq.com/procurementanalytics/index/ (accessed on 16 October 2026).
- Made-in-China.com. Cupric Chloride Price. Available online: https://www.made-in-china.com/products-search/hot-china-products/Cupric_Chloride_Price.html (accessed on 28 October 2026).
- IndiaMART. Colloidal Silica and Copper Thiocyanate: Latest Prices. Available online: https://dir.indiamart.com/impcat/colloidal-silica.html (accessed on 16 October 2026).
- Prom.uz. PVA Glue in Tashkent. Available online: https://www.prom.uz/tags/klei-pva/ (accessed on 16 October 2026).
- Central Bank of the Republic of Uzbekistan. Official Exchange Rates. Available online: https://cbu.uz/ru/arkhiv-kursov-valyut/ (accessed on 16 October 2026).
Figure 1.
Processing of waste guanidine thiocyanate by the CuCl2/Cu0 route and preparation of the composite adhesive.
Figure 1.
Processing of waste guanidine thiocyanate by the CuCl2/Cu0 route and preparation of the composite adhesive.
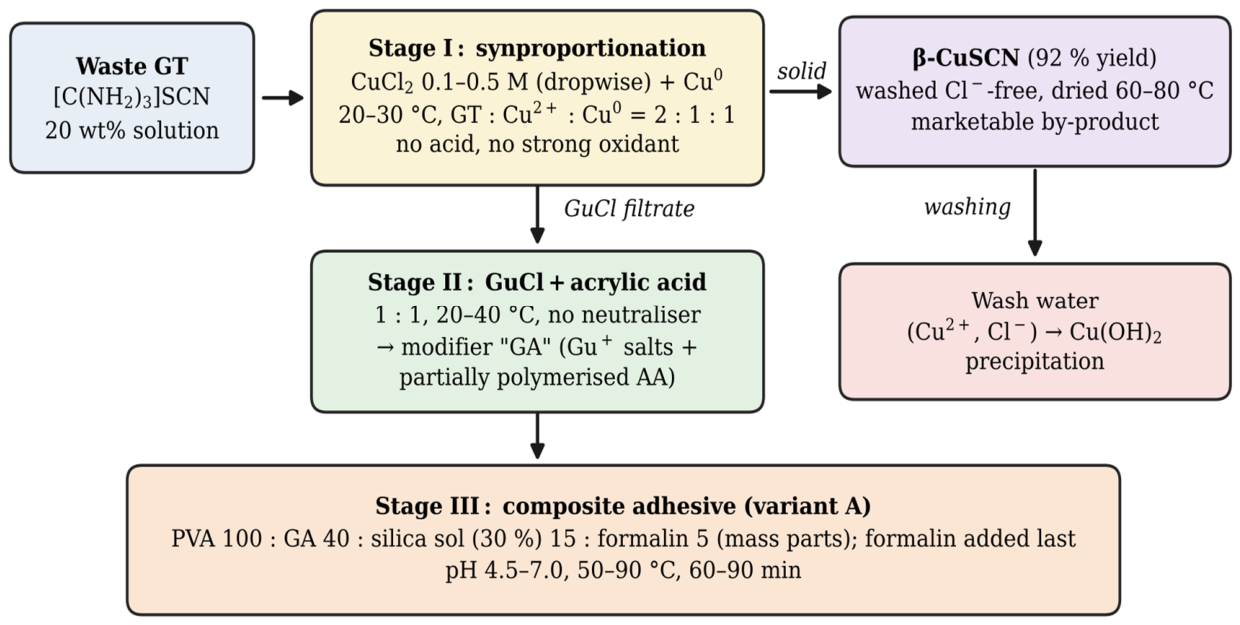
Figure 2.
FTIR spectra (ATR) of (a) waste guanidine thiocyanate, (b) the stage II product (GA modifier) and (c) the composite adhesive (variant A).
Figure 2.
FTIR spectra (ATR) of (a) waste guanidine thiocyanate, (b) the stage II product (GA modifier) and (c) the composite adhesive (variant A).
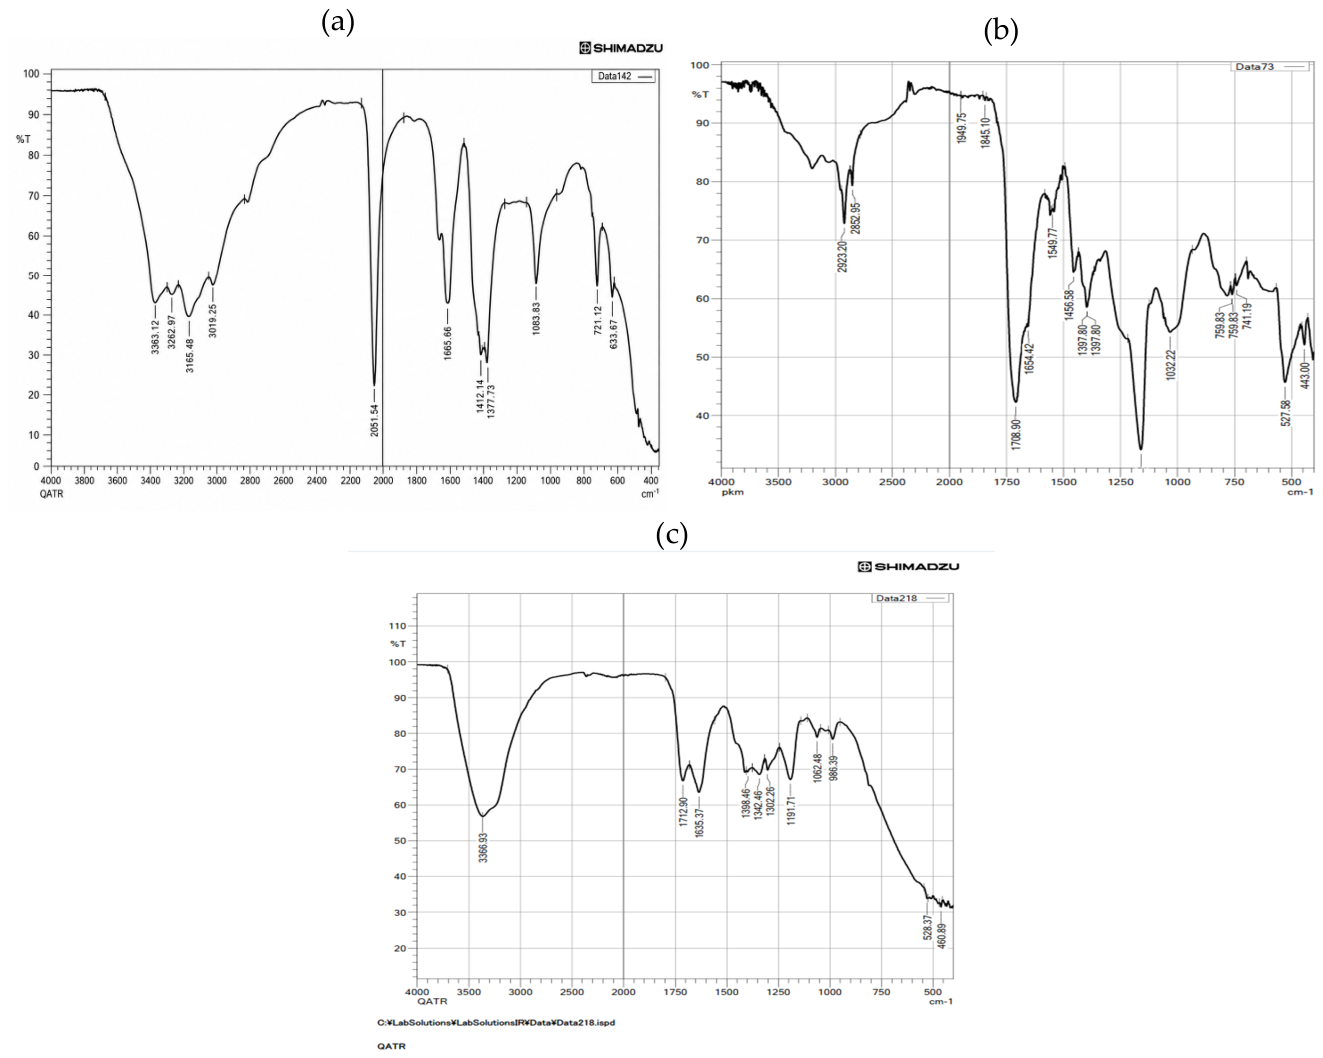
Figure 3.
XRD pattern (Cu Kα) of the CuSCN precipitate obtained in stage I.
Figure 4.
Fraction of acrylate anion as a function of pH (pKa = 4.25) with the points corresponding to the stage II medium and to a neutralised medium; the shaded area is the pH range of the adhesive formulation.
Figure 4.
Fraction of acrylate anion as a function of pH (pKa = 4.25) with the points corresponding to the stage II medium and to a neutralised medium; the shaded area is the pH range of the adhesive formulation.
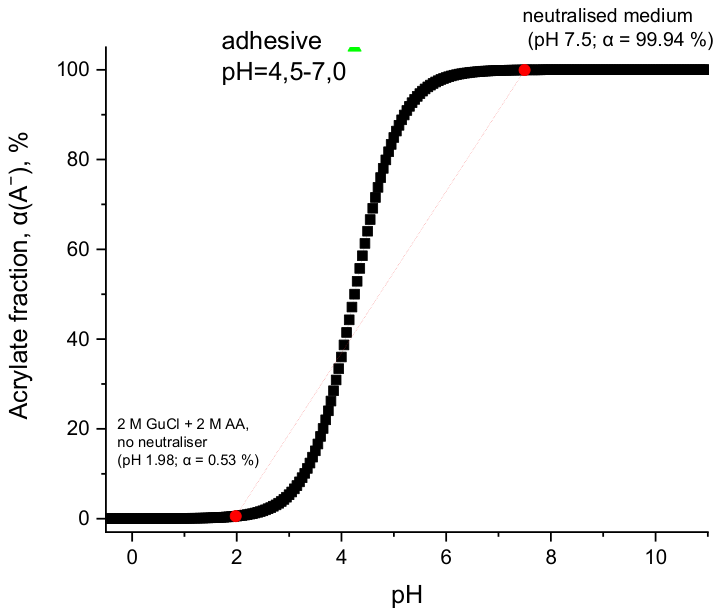
Figure 5.
DTA (red) and TGA (blue) curves of the composite adhesive (variant A) in nitrogen (≈10 °C min−1, m0 = 4.10 mg).
Figure 5.
DTA (red) and TGA (blue) curves of the composite adhesive (variant A) in nitrogen (≈10 °C min−1, m0 = 4.10 mg).
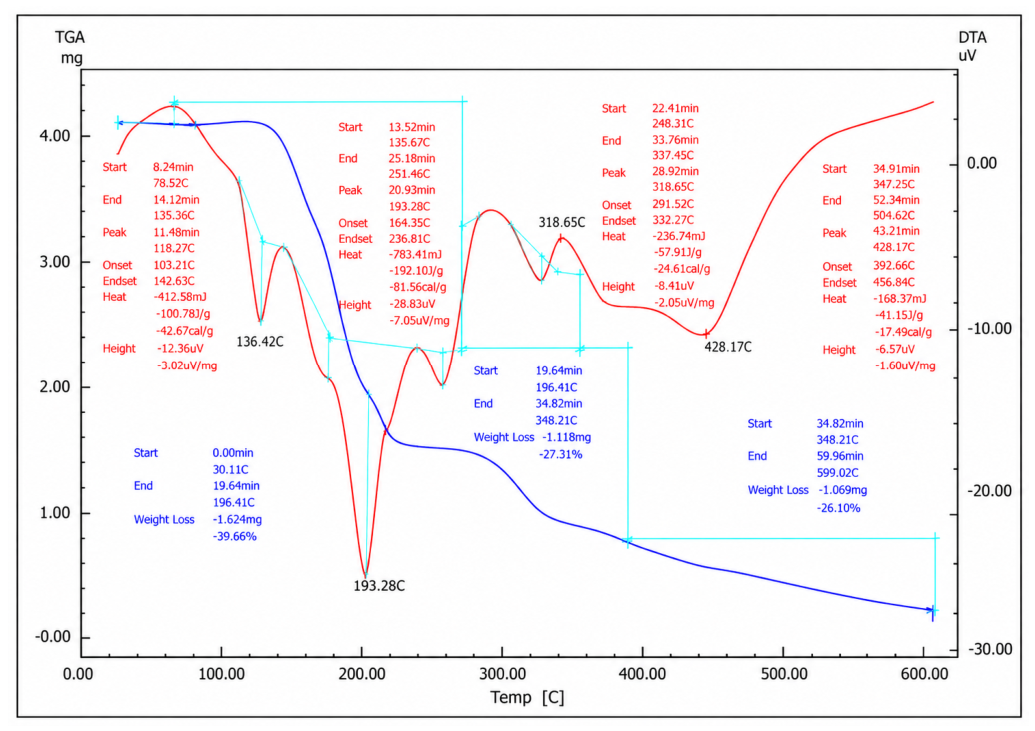
Figure 6.
ζ-potential and hydrodynamic diameter of the formulation as a function of the GA modifier content (15 g of 30% silica sol per 100 g PVA); ζ-potentials Henry-corrected at the sample ionic strength.
Figure 6.
ζ-potential and hydrodynamic diameter of the formulation as a function of the GA modifier content (15 g of 30% silica sol per 100 g PVA); ζ-potentials Henry-corrected at the sample ionic strength.
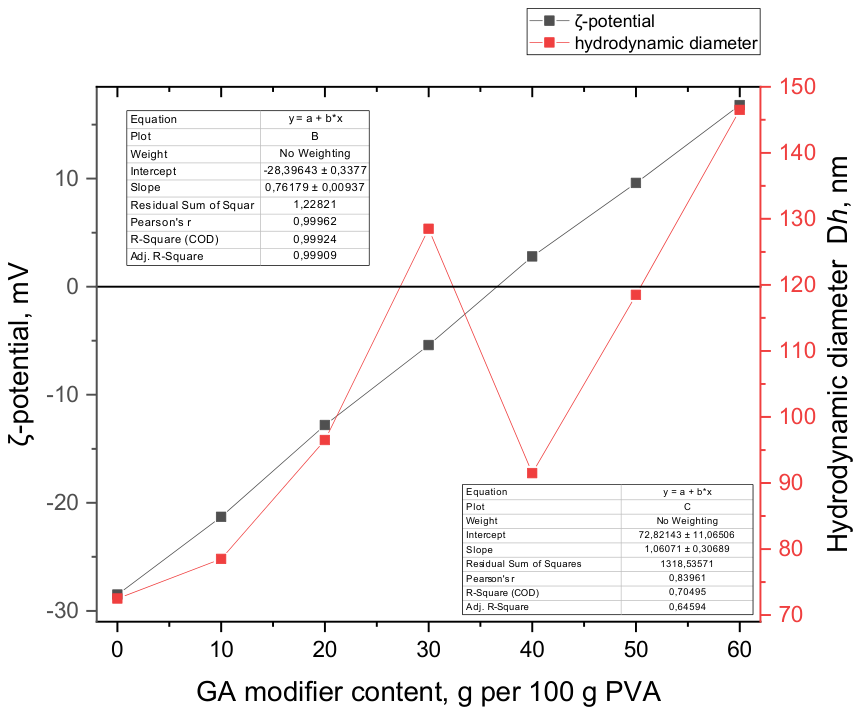
Figure 7.
DLVO interaction energy of silica particles (R = 10 nm, A = 0.8·10−20 J): (a) V(h) at different ionic strengths (ψd from the Grahame equation, σ = −0.010 C m−2); (b) barrier height as a function of ionic strength for ψd from the Grahame equation and for ψd equal to the ζ-potential of the sol; the shaded band marks formulations containing 20–60 g of modifier.
Figure 7.
DLVO interaction energy of silica particles (R = 10 nm, A = 0.8·10−20 J): (a) V(h) at different ionic strengths (ψd from the Grahame equation, σ = −0.010 C m−2); (b) barrier height as a function of ionic strength for ψd from the Grahame equation and for ψd equal to the ζ-potential of the sol; the shaded band marks formulations containing 20–60 g of modifier.
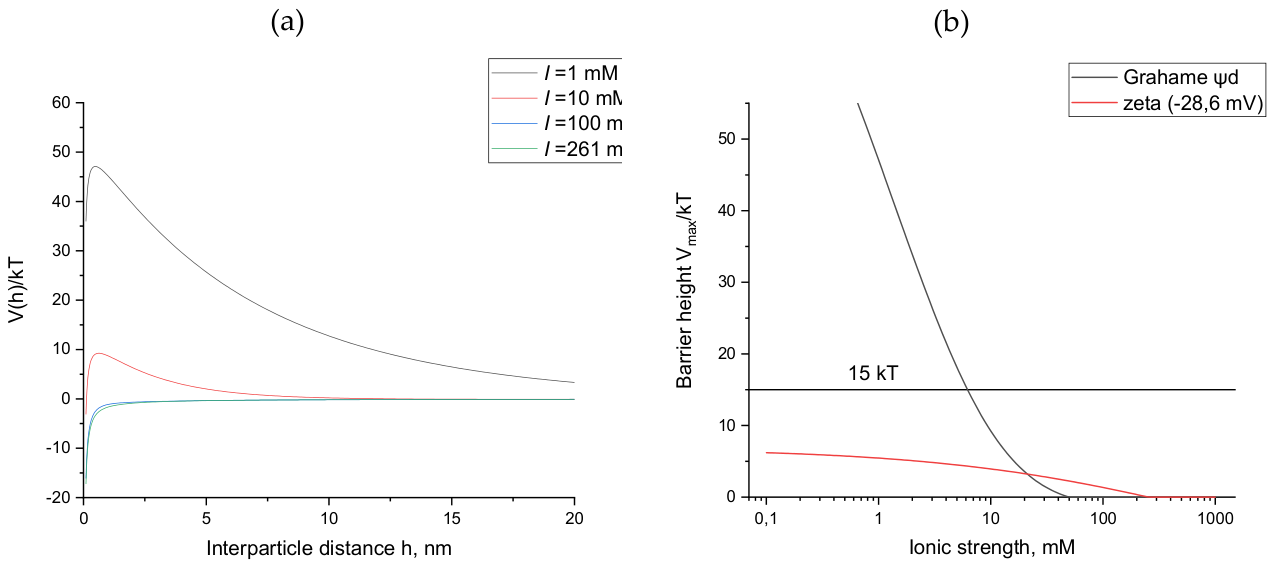
Figure 8.
Effect of the silica sol content on (a) viscosity and flow index and (b) hydrodynamic diameter and shelf life of the formulation.
Figure 8.
Effect of the silica sol content on (a) viscosity and flow index and (b) hydrodynamic diameter and shelf life of the formulation.
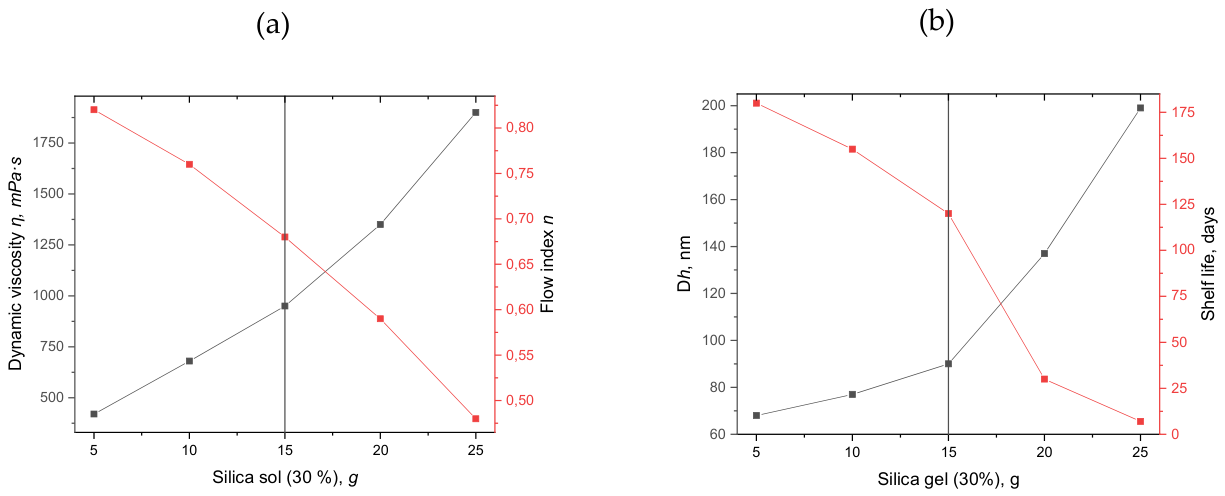
Figure 9.
(a) Lap-shear strength of the composite adhesive and of the unmodified PVAc reference on different substrates; (b) inhibition-zone diameter as a function of the GA modifier content before and after washing (percentages show the retained activity).
Figure 9.
(a) Lap-shear strength of the composite adhesive and of the unmodified PVAc reference on different substrates; (b) inhibition-zone diameter as a function of the GA modifier content before and after washing (percentages show the retained activity).
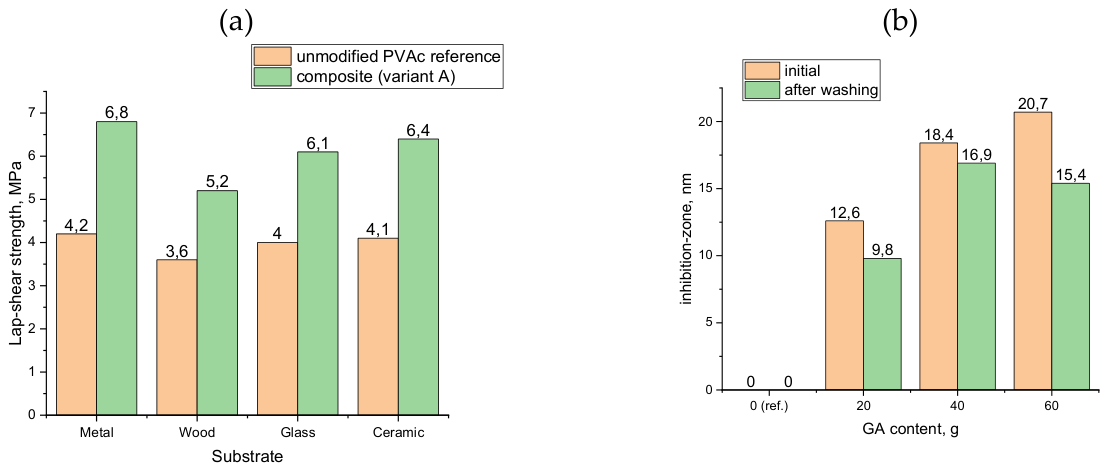

Table 1.
Effect of the Henry correction on the ζ-potential of silica particles (a = 10 nm).
| I, mM | κ−1, nm | κa | f(κa) | ζ(Henry)/ζ(Smoluchowski) |
|---|---|---|---|---|
| 0.1 | 30.40 | 0.33 | 1.007 | 1.49 |
| 1 | 9.61 | 1.04 | 1.036 | 1.45 |
| 10 | 3.04 | 3.29 | 1.100 | 1.36 |
| 100 | 0.96 | 10.40 | 1.262 | 1.19 |
Table 2.
Reaction conditions and control criteria of stages I and II.
| Stage (equation) | Conditions | Molar ratio | Control |
|---|---|---|---|
| I. Synproportionation (1) | 20 wt% GT; 0.1–0.5 M CuCl2 added dropwise; Cu0 turnings; 20–30 °C | GT : Cu2+ : Cu0 = 2 : 1 : 1 | end of precipitation; SCN− in filtrate (FeCl3); CuSCN yield 92% |
| II. Exchange with acrylic acid (3) | GuCl filtrate; acrylic acid (99%, MEHQ-inhibited); 20–40 °C; continuous stirring | GuCl : AA = 1 : 1 | viscosity; FTIR (C=O, C=C, C=N) |
Table 3.
Fraction of acrylate anion under different conditions (25 °C).
| Condition | pH | α(A−), % | Implication |
|---|---|---|---|
| Stage II: 2 M GuCl + 2 M acrylic acid | 1.98 | 0.53 | guanidinium acrylate < 1% |
| Adhesive formulation, pH 4.5 | 4.50 | 64.0 | partially neutralised |
| Neutralised medium | 7.50 | 99.94 | quantitative acrylate formation |
Table 4.
Diagnostic FTIR bands (cm−1) of acrylic acid, poly(acrylic acid) and acrylate (literature) compared with the stage II product.
Table 4.
Diagnostic FTIR bands (cm−1) of acrylic acid, poly(acrylic acid) and acrylate (literature) compared with the stage II product.
| Vibration | Acrylic acid | Poly(acrylic acid) | Acrylate anion | Stage II product |
|---|---|---|---|---|
| ν(C=O), COOH | 1700–1705 | 1700–1715 | — | 1709 (very strong) |
| νas(COO−) | — | — | 1550–1570 (strong) | 1550 (weak) |
| νs(COO−) | — | — | 1400–1430 | 1398 |
| ν(C=C) | 1635 + 1618 | absent | 1640–1645 | not observed (1654: guanidinium, see Table 5) |
| δ(CH2), chain | — | 1450–1455 | — | 1457 |
| ν(C–O) + δ(OH) | 1296, 1240 | 1240, 1160–1170 | — | ≈1160 |
| ω(=CH), ω(=CH2) | 985, 815–820 | absent | 985–990, 830–840 | not observed |
| ν(C–H), saturated | — | 2950–2920, 2860–2850 | — | 2923, 2853 |
| ν(N–H), guanidinium | — | — | 3400–3100 | very weak |
Table 5.
Diagnostic FTIR bands (cm−1) through the processing stages.
| GT | GA modifier | Composite | Assignment |
|---|---|---|---|
| 3363–3165 | 3204 | 3367 | ν(N–H), ν(O–H) |
| 2051 | — | — | ν(SCN−), removed |
| — | 1709 | 1713 | ν(C=O), COOH |
| 1666 | 1654 | 1635 | ν(C=N), retained at all stages |
| — | 1398 | 1398 | νs(COO−) |
| 721 | — | — | ν(C–S), removed |
Table 6.
DTA/TGA data for the composite adhesive (N2, ≈10 °C min−1).
| Stage | T range, °C | Mass loss, mg (%) | DTA effect: onset–endset; peak, °C | ΔH, J g−1 | Interpretation |
|---|---|---|---|---|---|
| I | 30–196 | 1.624 (39.66) | endo: 103.2–142.6; 118.3 (min. 136.4) endo: 164.4–236.8; 193.3 |
100.8 192.1 |
melting of guanidinium-salt phase; evaporation of bound water, acrylic acid and HCHO, COOH dehydration, melting of PVA crystallites |
| II | 196–348 | 1.118 (27.31) | endo: 291.5–332.3; 318.7 | 57.9 | PVA dehydration (polyenes), deamination and condensation of guanidinium |
| III | 348–599 | 1.069 (26.10) | endo: 392.7–456.8; 428.2 | 41.2 | destruction of polyene and poly(acrylic) chains, carbonisation |
| Residue | 599 | 0.284 (6.93) | — | — | SiO2 (3.07% calc.) and carbonised residue |
Table 7.
ζ-potential, hydrodynamic diameter and ionic strength of the formulation as a function of the modifier content.
Table 7.
ζ-potential, hydrodynamic diameter and ionic strength of the formulation as a function of the modifier content.
| GA, g | ζ, mV | Dh, nm | Visual state | I, mol kg−1 * | κ−1, nm * |
|---|---|---|---|---|---|
| 0 (sol) | −28.6 | 72.4 | transparent, stable | ≈0.001 | 9.6 |
| 10 | −20.1 | 78.6 | stable | 0.065 | 1.19 |
| 20 | −11.7 | 96.8 | stable | 0.131 | 0.84 |
| 30 | −4.8 | 128.5 | slight turbidity | 0.196 | 0.69 |
| 40 (base) | +2.5 | 91.7 | homogeneous, stable | 0.261 | 0.59 |
| 50 | +8.3 | 118.3 | stability slightly reduced | 0.327 | 0.53 |
| 60 | +14.4 | 146.5 | hydrophilicity increases | 0.392 | 0.49 |
* Calculated for a 1 : 1 electrolyte, assuming that 100 g PVA is used as a 10% aqueous solution, that each 167.6 g of modifier (1 mol GuCl + 1 mol acrylic acid, Section 3.3) contributes 1 mol of 1 : 1 electrolyte, and that water introduced with the silica sol and formalin is included (0.914 kg in total). ζ-potentials were obtained with Henry’s function evaluated at the ionic strength of the diluted electrophoresis samples (Section 2.4).
Table 8.
Effect of the silica sol content on the dispersion and rheology of the formulation.
| Silica sol, g | SiO2 in dry composite, % | Dh, nm | η, mPa·s | n | Hysteresis, Pa s−1 | Shelf life, days |
|---|---|---|---|---|---|---|
| 5 | 1.05 | 68.4 | 420 | 0.82 | 18.5 | 180 |
| 10 | 2.07 | 76.8 | 680 | 0.76 | 29.7 | 150 |
| 15 (base) | 3.07 | 89.6 | 950 | 0.68 | 43.2 | 120 |
| 20 | 4.06 | 136.5 | 1350 | 0.59 | 67.8 | 30 |
| 25 | 5.02 | 198.7 | 1900 | 0.48 | 105.6 | 7 |
Table 9.
Contact angle of the formulation, surface free energy of the substrates and work of adhesion (upper-bound estimate, γL = 72.7 mN m−1).
Table 9.
Contact angle of the formulation, surface free energy of the substrates and work of adhesion (upper-bound estimate, γL = 72.7 mN m−1).
| Substrate | θ, deg | γS, mN m−1 | Wa, mJ m−2 |
|---|---|---|---|
| Metal | 48.5 | 42.6 | 120.8 |
| Wood | 63.2 | 35.8 | 105.1 |
| Glass | 31.4 | 52.7 | 134.9 |
| Ceramic | 28.7 | 55.3 | 136.9 |
Table 10.
Comparison of the composite adhesive with the unmodified reference and with data for commercial adhesives.
Table 10.
Comparison of the composite adhesive with the unmodified reference and with data for commercial adhesives.
| Property | Composite (variant A) | Unmodified PVAc reference | Commercial adhesives / standard requirements |
|---|---|---|---|
| Lap-shear strength, MPa: metal / wood | 6.8 / 5.2 | 4.2 / 3.6 | epoxy (Loctite EA E-20HP) [92]: 22.6 (steel), 11.4 (fir); EN 204 D1–D3 [91]: ≥ 10 (beech) |
| Strength retention after water exposure | 96.4% (24 h) | 78.5% (24 h) | epoxy [92]: 81% (1000 h, 23 °C); EN 204 D3 [91]: ≥ 2 MPa after 4 days in water |
| Dynamic viscosity, Pa·s | 0.95 | — | PVAc dispersions [90]: 0.2–1.0 (grade D 50N) |
| Temperature of 5% mass loss, °C | ≈140 | ≈115 | epoxy [92]: Tg = 60 °C |
| Inhibition zone, mm (after washing) | 18.4 (16.9) | 0 (0) | — |
Table 11.
Raw-material cost of 1 t of the base adhesive formulation (variant A; prices of June–October 2026 [94,95,96,97,98]).
| Raw material | Consumption, kg t−1 | Price, USD kg−1 | Cost, USD t−1 |
|---|---|---|---|
| Waste GT | 176.3 | 0 | 0 |
| CuCl2·2H2O | 127.2 | 6.00 | 762.9 |
| Copper (Cu0) | 47.4 | 14.09 | 667.8 |
| Acrylic acid | 107.5 | 1.09 | 117.2 |
| PVA | 625.0 | 1.62 | 1012.5 |
| Silica sol (30%) | 93.8 | 0.37 | 34.7 |
| Formalin (37%) | 31.3 | 0.25 | 7.8 |
| Total raw materials | — | — | 2602.9 |
| Credit: CuSCN by-product | 166.9 | 3.07 | −512.0 |
| Net raw-material cost | — | — | 2091.0 |
Disclaimer/Publisher’s Note: The statements, opinions and data contained in all publications are solely those of the individual author(s) and contributor(s) and not of MDPI and/or the editor(s). MDPI and/or the editor(s) disclaim responsibility for any injury to people or property resulting from any ideas, methods, instructions or products referred to in the content. |
© 2026 by the authors. Licensee MDPI, Basel, Switzerland. This article is an open access article distributed under the terms and conditions of the Creative Commons Attribution (CC BY) license (http://creativecommons.org/licenses/by/4.0/).
Copyright: This open access article is published under a Creative Commons CC BY 4.0 license, which permit the free download, distribution, and reuse, provided that the author and preprint are cited in any reuse.