

Submitted:
03 November 2026
Posted:
05 November 2026
You are already at the latest version
Abstract
The variability of thermal protection provided by nominally identical fire-resistant glazing panes is poorly captured by the pass/fail outcome of full-scale fire-resistance tests. We re-analysed 15-s unexposed-surface temperature histories from 60 same-type, full-size panes nested within seven heterogeneous EI 30 partition tests. Between 30 and 45 min, the median within-test interquartile range increased from 1.59 to 5.20 K; an increase was observed in six of seven tests. A complementary maximum-above-median measure exposed individual heated panes even where the interquartile range did not increase. A five-minute differential descriptor identified two early accelerated responses (T2-G2 and T5-G6) in a common observation window, whereas two additional original flags arose only later during longer exposures. Time to a 140 K mean pane-temperature rise ranged from 8.12 to 33.91 min; this descriptor is not an additional fire-resistance rating. The exploratory lower-tail calculation was sensitive to rare components and cannot establish an independent pane-count effect. These findings demonstrate substantial heterogeneity and distinct anomalous trajectories within one nominal glazing product while preserving the original EI 30 classification.
Keywords:
fire-resistant glazing
; thermal heterogeneity
; intumescent interlayers
; full-scale fire testing
; temperature histories
; anomalous heating
; component variability
1. Introduction
Fire-resistant glazed partitions combine transparency with the requirement to limit heat transfer during fire exposure. In insulating glazing, thermally active interlayers contribute to this function through dehydration, expansion and other transformations that form a protective barrier. Previous investigations have examined intumescence of silica-containing gels, structural evolution of protective layers and their response during heating [1,2,3]. Classification establishes whether the complete element satisfies specified criteria, but it cannot describe how similarly the individual panes of the same nominal construction perform during continued exposure. Pane-resolved temperature records therefore offer information on the heterogeneity of the installed fire-protective material that is not apparent from the classification outcome alone.
The thermal response of transparent fire-protective interlayers can depend on formulation, curing and ageing. Material-scale studies of hydrogel and silica-gel systems have shown that composition and processing influence their insulating and thermal stability characteristics [4,5,6]. Storage and installation can also affect glazed fire-rated constructions [7]. These are plausible sources of material and system variation, but the present dataset does not include pane-specific composition, moisture, batch or processing measurements. Consequently, differences between the measured panes cannot be assigned uniquely to an individual material mechanism or manufacturing variable.
Previous experimental and modelling studies of fire-exposed glazing have primarily addressed thermal breakage, cracking, fallout, dimension effects and the behaviour of complete façades [8,9,10,11,12]. In a related full-scale programme, the effects of partition height and mullion reinforcement on the performance of glazed walls were analysed at element level [13]. More recent work has examined interactions between fire development and multi-pane façade response [14]. Although these investigations demonstrate the influence of geometry and boundary conditions, they do not quantify within-specimen dispersion of full-size, nominally identical fire-resistant panes over the course of a full-scale standard-fire exposure.
Archived fire-resistance data can be analysed beyond pass/fail criteria when measurement context and the observational design are respected [15,16]. The original T1–T7 programme included panes of a single nominal Type-A glazing product, but the tests were not identical replicates: partition height, reinforcement and pane count differed. The 60 panes are therefore component observations nested within seven full-scale tests, not 60 independent experimental replications. Between-test comparisons cannot independently isolate material batch effects, local heat transfer, geometry or pane count. We consequently prioritise within-test comparisons and make the boundaries of subsequent statistical illustrations explicit.
The current reanalysis evaluates 15-s temperature histories of 60 full-size Type-A panes from seven full-scale EI 30 tests previously used to assess complete partition performance [13]. The common 30-min rating time is used only as a reference and is not treated as a physical transition or the actual insulation-failure time. Differences between panes are quantified using the within-test interquartile range and an additional measure of the hottest pane relative to its test median. This combination distinguishes changes in the central distribution from isolated upper-tail departures.
We also examine short-duration accelerated heating with a five-minute differential descriptor, D5, defined relative to simultaneous companion panes. Because a maximum over a longer observation period has more opportunity to become extreme, D5 is re-evaluated with a common observation window across tests. The time R140 from the common 30-min reference until an individual pane reaches a mean temperature rise of 140 K is used as a complementary trajectory descriptor, not as an additional insulation rating. An illustrative empirical order-statistics analysis is retained as a secondary sensitivity exercise; it cannot experimentally establish a causal effect of component count.
The objectives are to (i) quantify time-dependent, within-specimen thermal heterogeneity; (ii) distinguish distribution-wide dispersion from unusually warm individual panes and separate early from late short-term accelerations; and (iii) test the sensitivity of exploratory tail estimates to rare pane responses and heterogeneous test conditions. The resulting evidence concerns the thermal behaviour of one nominal fire-protective glazing product in full-scale construction tests. It does not determine a unique gel degradation mechanism, a universal system-size relation or an altered fire-resistance classification.
2. Materials and Methods
2.1. Experimental Programme and Data Source
Pane-resolved temperature histories were recovered from a previously conducted full-scale experimental programme on aluminium-glazed partitions [13]. Eight tests were conducted in the original programme; T1–T7 employed the same nominal Type-A glazing and are included here, whereas T8 used a different glazing system and is excluded. This reuse of existing experiments addresses a different question from the earlier study: heterogeneity and atypical heating of individual panes rather than the structural scale effect of complete partitions.
The seven tests are heterogeneous clusters rather than independent repetitions of one configuration. Heights ranged from 3000 to 5954 mm; reinforced mullions were used in T2–T6, whereas T1 and T7 had non-reinforced mullions. Pane count changed with wall configuration and height. The individual pane is a component-level observation, while the full-scale test is the clustering unit. No design factor was independently manipulated to identify the causal effect of adding panes.
To avoid mixing pane sizes, the primary population includes only the 933 × 1425 mm full-size Type-A panes, excluding locally present smaller panes in T3 and T5. The result is 60 full-size panes in seven tests: 6, 6, 6, 9, 9, 12 and 12 in T1–T7. All panes had the same nominal glazing type, layer configuration, dimensions and manufacturer; production-batch identity and individual histories were unavailable. Accordingly, “nominally identical” does not imply verified material identity at batch or microstructural level.
Table 1 documents the original configurations and fire-integrity and temperature-based insulation-criterion times. These specimen-level outcomes provide context only; no new EI classification or component-level rating is inferred from the reanalysis.
2.2. Test Specimens and Fire-Resistant Glazing
All analysed specimens were aluminium mullion-transom glazed partitions designed for an EI 30 application. The framing system used three-chamber aluminium profiles with a fire-protective insert in the central chamber. The full-size Type-A glazing had a nominal thickness of 20 mm and consisted of 5 mm ESG + 3 mm intumescent gel + 4 mm TVG + 3 mm intumescent gel + 5 mm ESG. The two gel layers formed the thermally active fire-protective part of the glazing system [1, 2].
The glazing was supported on timber setting blocks and retained with steel glazing angles separated from the glass by felt, while aluminium glazing beads and EPDM gaskets completed the perimeter retention. The test specimens were installed in rigid supporting constructions made primarily of 240-mm-thick autoclaved aerated concrete.
The top and bottom edges and one vertical edge of each partition were mechanically fixed to the supporting construction, while the opposite vertical edge remained free to simulate continuation of a wider partition beyond the furnace opening [13]. This boundary condition belonged to the original scale-effect test programme rather than being selected for the present statistical reanalysis. Because the free edge can affect local thermal and mechanical conditions, possible residual position- and test-level effects are not assumed to be eliminated by the statistical centring procedure and are considered in the interpretation and limitations.
2.3. Fire Exposure and Temperature Measurements
The fire-resistance tests followed the EN 1364-1 wall-testing framework [17], with general procedures described in EN 1363-1 [18]. The specimens were exposed on one face to standard-fire conditions; furnace temperatures were monitored with plate thermometers and pressure was controlled according to the applicable fire-testing procedure. These are archived tests rather than newly designed trials for an assessment of glazing-material variability; the procedures and recorded test conditions are presented here to support interpretation.
Fire integrity (E) and insulation (I) were evaluated during the original tests. Temperature-based insulation assessment uses the mean and maximum unexposed-face temperature-rise criteria described in EN 13501-2 [19]. Here, each pane’s mean temperature-rise history is analysed separately. Neither the pane-specific 140 K crossing nor a short-term acceleration flag is interpreted as the complete wall’s insulation-failure time.
Unexposed-surface temperatures were measured with the standard EN 1363-1 disc thermocouple assembly: Type K (NiCr/NiAl) thermocouple wire soldered to a copper disc, covered by a silica-fibre insulating pad with a density of approximately 900 ± 100 kg/m3 and bonded so that thermal contact was maintained as the specimen deformed [13, 18]. The standard accuracy requirement for ambient and unexposed-face temperature measurement is ±4 K [18]. The archived test documentation available for the present reanalysis does not retain sensor-level identification or the individual calibration certificates; accordingly, no additional sensor-specific metadata are inferred here.
For each full-size pane, the mean pane temperature was calculated from two surface thermocouples positioned in diagonally opposite quarters. The pane layouts and numbering for all seven tests are shown in Figure 1, together with the measurement convention. For pane i in test j, the mean temperature rise was calculated using Equation (1).
where T1,ij(t) and T2,ij(t) are the temperatures recorded by the two pane surface thermocouples at time t, and T0,ij is the corresponding initial mean pane temperature.
Figure 1.
Full-scale test layouts T1–T7, pane numbering and surface-temperature measurement convention. Asterisks identify panes flagged as extreme under the original D5 definition. Only full-size 933 × 1425 mm Type-A panes were included in the statistical population; the smaller upper-row panes shown in T3 and T5 were excluded. Mean pane temperature rise was calculated from two surface thermocouples positioned in diagonally opposite quarters.
Figure 1.
Full-scale test layouts T1–T7, pane numbering and surface-temperature measurement convention. Asterisks identify panes flagged as extreme under the original D5 definition. Only full-size 933 × 1425 mm Type-A panes were included in the statistical population; the smaller upper-row panes shown in T3 and T5 were excluded. Mean pane temperature rise was calculated from two surface thermocouples positioned in diagonally opposite quarters.
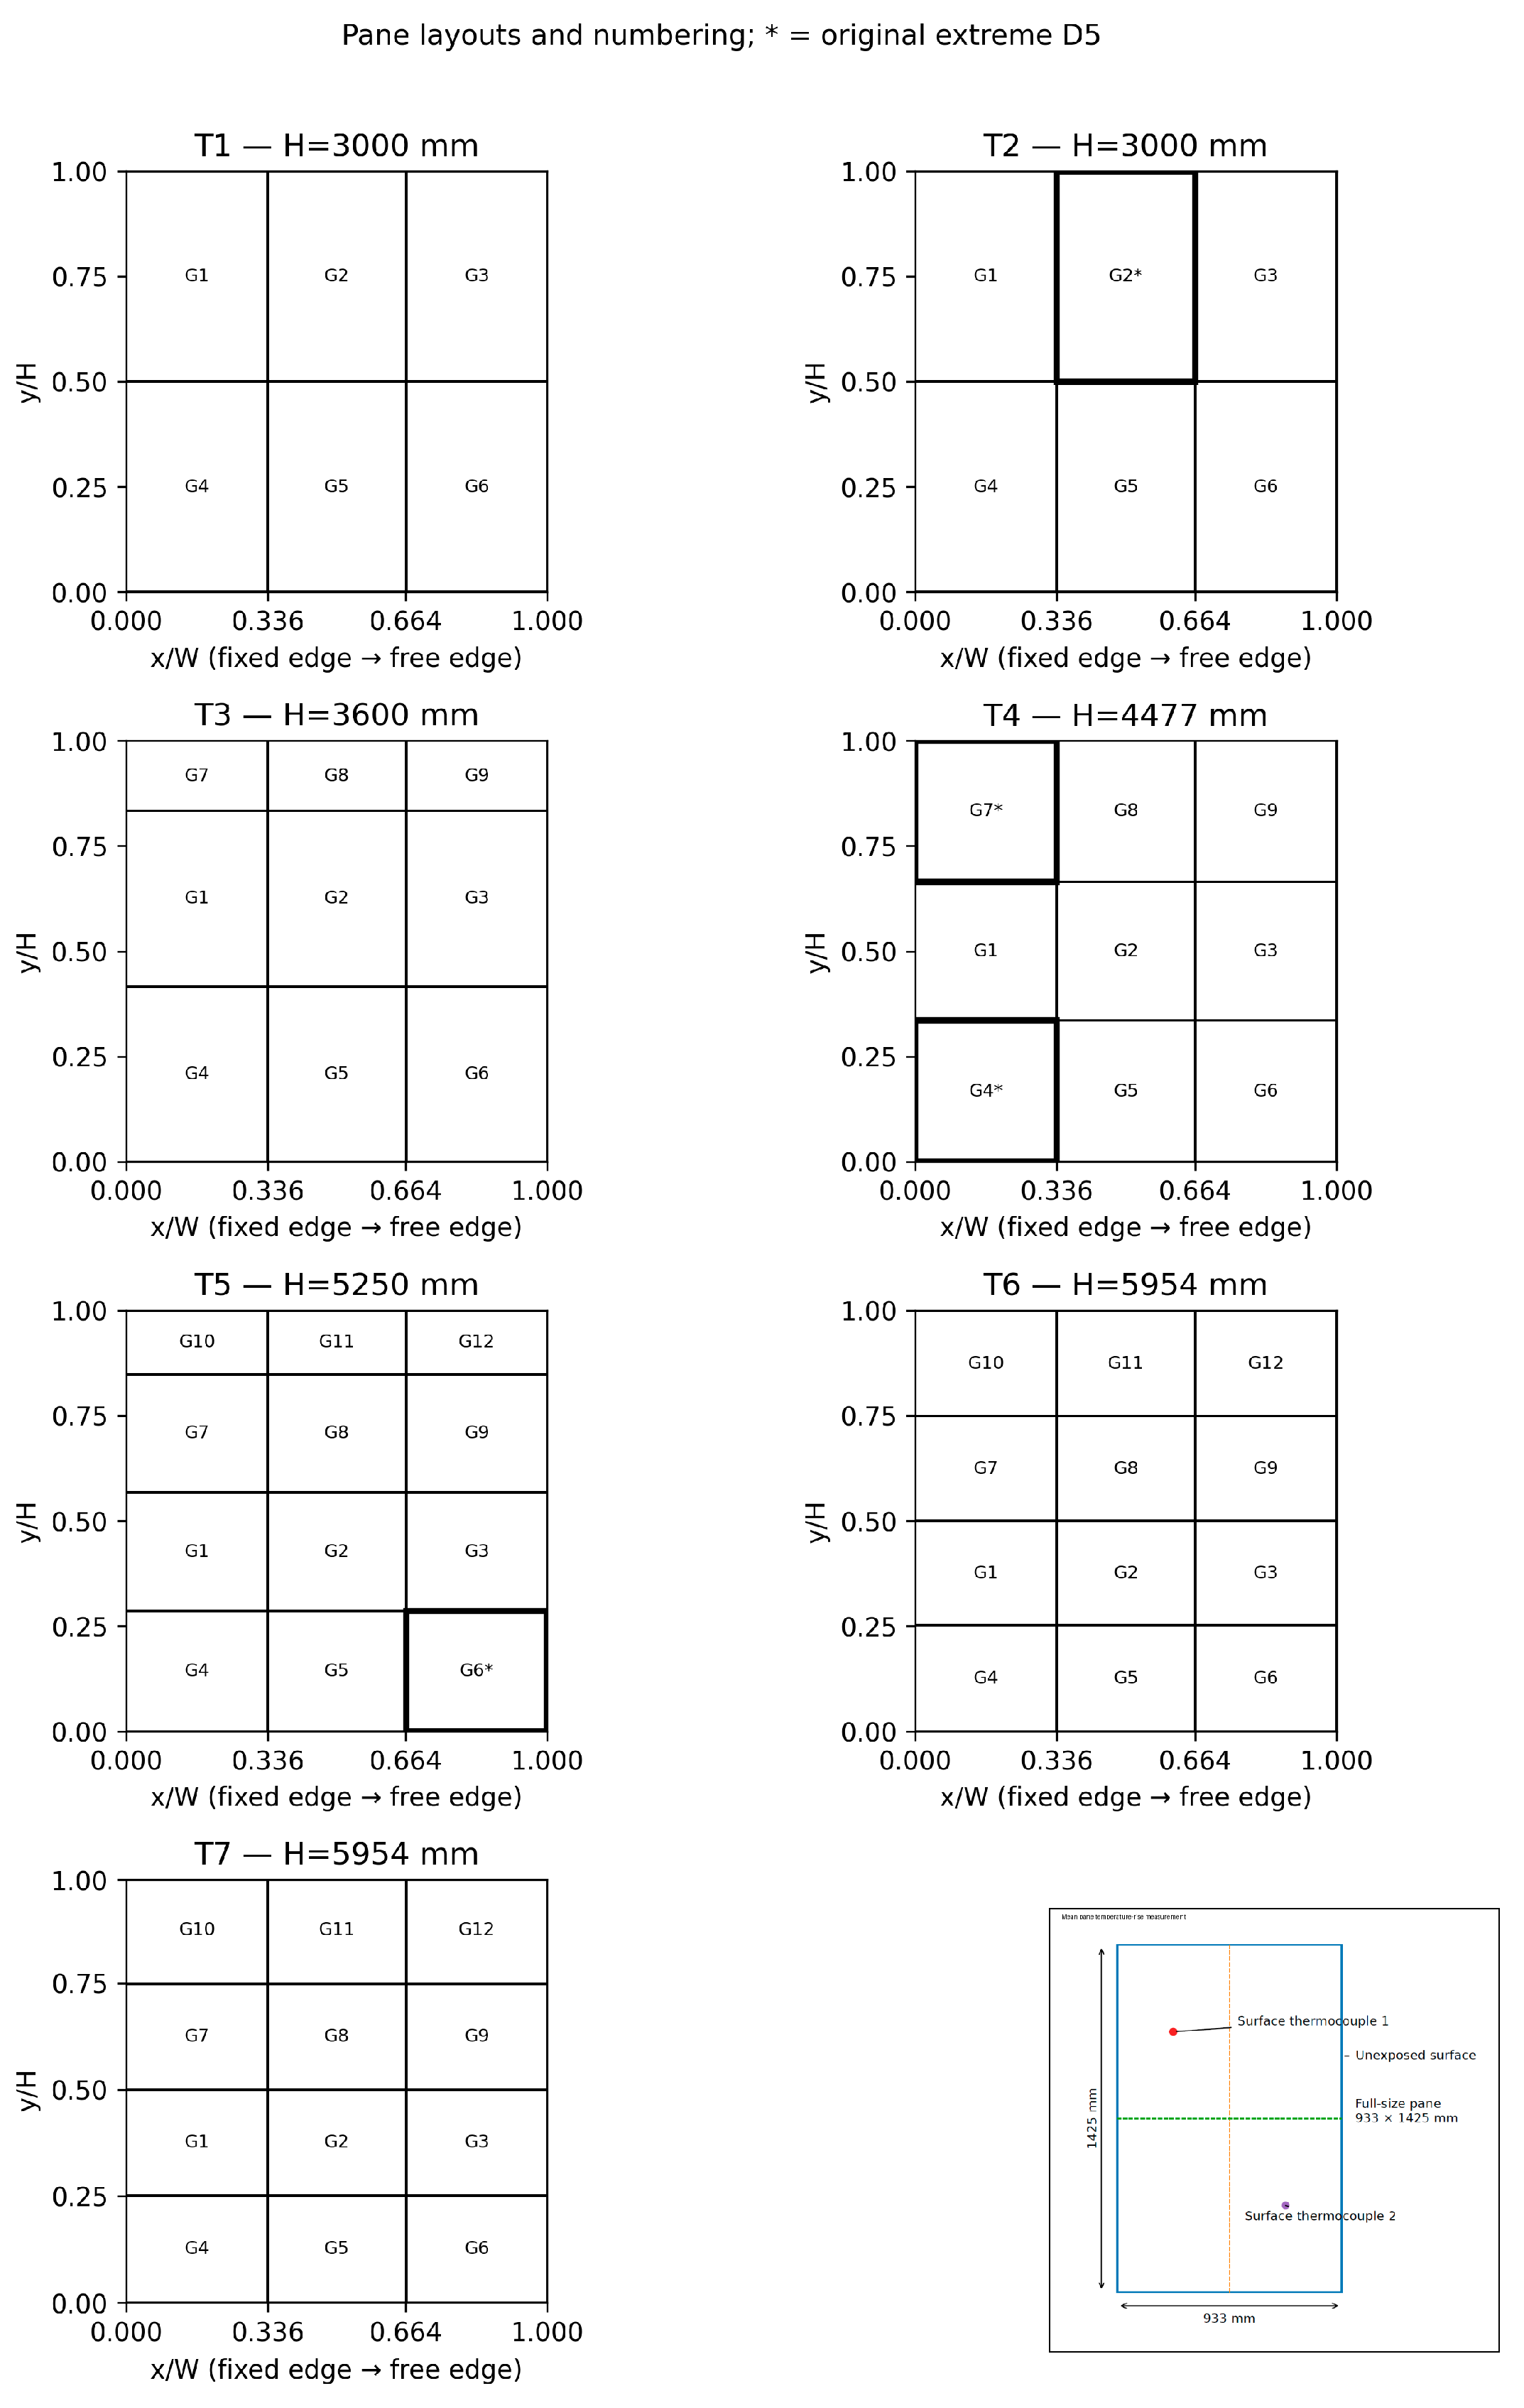
The archived histories were sampled nominally every 15 s without temporal smoothing. Recorded integrity times for T1–T7 were 60, 46, 58, 67, 62, 67 and 46 min, respectively; corresponding temperature-based insulation-criterion times were 48, 41, 47, 50, 37, 50 and 48 min. The principal 30–45 min comparison was performed while all seven specimens retained integrity, although the temperature-based insulation criterion had already been reached in some tests. Temperatures measured on profiles, transoms or joints were excluded.
2.4. Thermal Reserve Relative to the 140 K Criterion
To compare the continued thermal response of individual panes using a common reference, the time t140,ij at which the mean temperature rise of pane i in test j first reached 140 K was determined. Because the temperature histories were sampled every 15 s, t140,ij was obtained by linear interpolation between the consecutive records immediately below and above 140 K using Equation (2).
The descriptor R140,ij was then calculated from Equation (3) as the time interval between the common 30-min classification reference and t140,ij.
A larger R140 therefore indicates later attainment of the 140 K mean pane-temperature level. R140 is a trajectory descriptor referenced to the common EI 30 classification time; it is not the fire-resistance time of the complete specimen and does not include integrity or the maximum-temperature criterion.
All 60 panes reached 140 K within the available records. For 20 panes, t140 occurred after loss of integrity of the corresponding full-scale specimen. These values were retained in the primary trajectory analysis because they are experimentally recorded temperatures, but their physical interpretation is more limited. A conservative sensitivity analysis truncating credit at tE is therefore retained as described in Section 2.8.4.
2.5. Within-Test Dispersion and Upper-Tail Departures
For each test j and time t, pane-to-pane dispersion was calculated from the interquartile range IQRj(t) of the measured mean temperature-rise values (Equation (4)). The IQR describes the central 50% of pane responses and is therefore relatively insensitive to one isolated unusually warm pane. Accordingly, we also evaluated Uj(t), defined descriptively as the maximum pane mean temperature rise minus the simultaneous within-test pane median. Uj(45 min) was calculated directly from the recorded values to provide an observational complement to IQR; it is not a standard fire-resistance metric.
Relative dispersion, rIQRj(t), was retained from the original analysis to account for the increasing temperature level during exposure (Equations (5) and (6)). It was defined within tests rather than by pooling panes across different walls.
The series summaries were medians of seven test-specific quantities (Equations (7) and (8)). These summaries do not imply that the seven experiments are identical replicates; all test-level results are reported explicitly at 30 and 45 min in Table 2.
Dispersion was examined at 25, 30, 35, 40, 45, 50, 55 and 60 min, with inferential comparisons restricted to times when all seven intact test clusters provided data. Later summaries with fewer contributors were retained as descriptions only. No temporal smoothing or replacement of individual extreme histories was performed.
2.6. Screening of Short-Term Anomalous Heating
Short-term thermal acceleration was characterised using a 5-min differential descriptor. For pane i in test j, the temperature increase over a 5-min interval was calculated using Equation (9).
The simultaneous within-test median increment and the pane-specific departure from that median were defined using Equations (10) and (11), respectively.
D5,ij was then defined by Equation (12) as the maximum departure observed for that pane during the analysed period.
The original D5 calculation admitted 5-min windows beginning at 30 min and ending no later than integrity loss in the corresponding test. The five-minute interval captures a sustained temperature departure rather than one 15-s fluctuation. Panes were flagged under a Q3 + 3IQR screening rule [20]. Such labels indicate unusual empirical trajectories, not proved faults, precipitate transformations or insulation-failure criteria.
Different test durations create unequal opportunities to obtain a large maximum D5. We therefore additionally calculated D5 over a common set of 5-min windows starting from 30 to 41 min, ensuring that every window ended by 46 min, the earliest integrity loss in the seven-test series. Alternative window lengths and starts were retained as definition-sensitivity checks. Early and later-stage flags were interpreted separately.
2.7. Secondary Empirical Lower-Tail Illustration
For completeness and to interrogate the sensitivity of the observed distribution to rare panes, the centred thermal-margin and minimum-draw calculations from the previous analysis were retained as a secondary exploratory illustration. Within each test, R140 was centred on the test median (Equations (13) and (14)) to remove its median shift; this cannot remove differences in geometry, furnace exposure or within-wall dependence. Pooling centred observations then defines an empirical distribution conditional on these assumptions, not a demonstrated common distribution of independent pane performances.
For a hypothetical random draw of N components from this pooled empirical distribution, the minimum is defined in Equation (15). Even without a specific fire-performance mechanism, its expected value is non-increasing with increasing N whenever draws are taken from the same non-degenerate distribution. Therefore, the direction of the calculated N-trend is mathematically inherent in order statistics [21] and is not experimental evidence that a larger real partition has poorer glazing or reduced EI classification.
The expected minima were calculated from the empirical order-statistic distribution; Equation (16) provides the equivalent Monte Carlo estimator. Resampling 100,000 draws supplied finite-N diagnostic distributions rather than the primary point estimates. The cluster bootstrap described below was used to evaluate sensitivity to sampling heterogeneous original test clusters, not to establish population generalisability.
The illustration was restricted to N = 6, 9 and 12, the pane counts present in the original test programme. Because these counts coincide with different wall heights/configurations, they are not an experimentally isolated pane-count intervention. No extrapolation beyond this range or prescriptive component-count threshold was attempted.
2.8. Statistical Analysis
Statistical analyses treated 60 pane histories as observations nested in seven test clusters. The small number of independent full-scale tests limits inferential generalisation. The focus was on effect sizes, test-specific descriptive values, screening sensitivity and within-test temporal comparisons. The statistical procedures are therefore interpreted as checks of consistency within this programme, not as independent validation.
2.8.1. Temporal Changes in Pane-to-Pane Variability
The primary temporal contrast compares within-test IQR at 30 and 45 min; 30–40 min is a secondary timing check. Exact one-sided paired Wilcoxon signed-rank tests [22] were conducted on the seven full-scale test-level IQR values, and Holm adjustment [23] was retained for the two planned time comparisons. The 30–45 min unadjusted exact p value is 0.015625; the manuscript reports the pre-specified adjusted results where multiple testing applies. The number of individual tests with increased IQR is reported alongside medians.
2.8.2. Association Between Acceleration and Relative Thermal Margin
Spearman’s coefficient [24] summarised the association between D5 and within-test-centred R140. The two descriptors are calculated from overlapping portions of the same thermal histories, so their association is not an independent verification of a material mechanism. Cluster-aware bootstrap intervals and removal of flagged panes were used as sensitivity checks, not as evidence of independent replication.
2.8.3. Hierarchical Bootstrap Procedure
The hierarchical bootstrap [25] resampled seven original test clusters with replacement and then resampled panes within each selected cluster. Repeated copies of one original test were treated as distinct pseudo-clusters and re-centred separately. Each statistic was recalculated for 20,000 replicates; the percentile interval is reported as a 95% bootstrap interval. With only seven structurally different clusters, these intervals describe resampling sensitivity conditional on the sampled programme, not a universally valid uncertainty bound.
2.8.4. Sensitivity and Internal Diagnostic Analyses
The sensitivity programme addressed the main limitations directly: the effect of removing each D5-flagged pane or all four flags from the pooled illustration; re-estimating D5 under the common-window and alternative window definitions; and censoring additional R140 credit after specimen integrity loss using Equations (17) and (18). These transformations are diagnostic choices and do not modify measured temperatures.
and
In the internal leave-one-test-out exercise, one original full-scale test was withheld and minimum-response distributions were calculated from the other six test clusters. The observed minimum of the held-out test was compared with that distribution. This is an internal compatibility diagnostic for a heterogeneous archival dataset, not independent experimental validation or out-of-sample evidence for a transferable pane-count law.
All analyses and data visualisations were implemented in Python using archived 15-s pane mean temperature-rise histories. Supplementary Dataset S1 contains these pane-resolved records (60 pane series), a variable dictionary, and executable scripts that recalculate the pane-level R140 and D5 descriptors, the within-test IQR and upper-tail excursions, test-wise comparisons, correlations, empirical expected-minimum illustrations, and internal leave-one-test-out diagnostics. Optional cluster-bootstrap simulations use a recorded random seed; small differences in percentile limits are expected between Monte Carlo runs. The supplied histories are pane means based on two surface thermocouples, rather than the original individual sensor readings. OpenAI ChatGPT assisted with drafting and checking portions of the scripts; the authors verified the computations against the archived records and Supplementary Table S1. No measured temperature data were created or changed using generative AI.
3. Results
3.1. Time-Dependent Within-Test Thermal Heterogeneity
The full pane-level temperature histories (Figure 2) show that the 60 panes were closely grouped near the common 30-min reference: the overall mean pane temperature rise was 73.15 K, the median 73.0 K, the standard deviation 3.22 K and the range 67.3–82.4 K. Across the seven independent test clusters, median within-test IQR was 1.59 K (median relative IQR 2.06%). These pooled descriptive quantities supplement, rather than replace, the test-wise assessment.
Figure 2.
Pane-resolved mean temperature-rise histories for T1–T7. The vertical dashed line marks the common 30-min classification reference and the horizontal dotted line marks 140 K mean temperature rise. Thick labelled curves identify the four panes flagged as extreme under the original D5 definition; tE is shown in each panel title.
Figure 2.
Pane-resolved mean temperature-rise histories for T1–T7. The vertical dashed line marks the common 30-min classification reference and the horizontal dotted line marks 140 K mean temperature rise. Thick labelled curves identify the four panes flagged as extreme under the original D5 definition; tE is shown in each panel title.
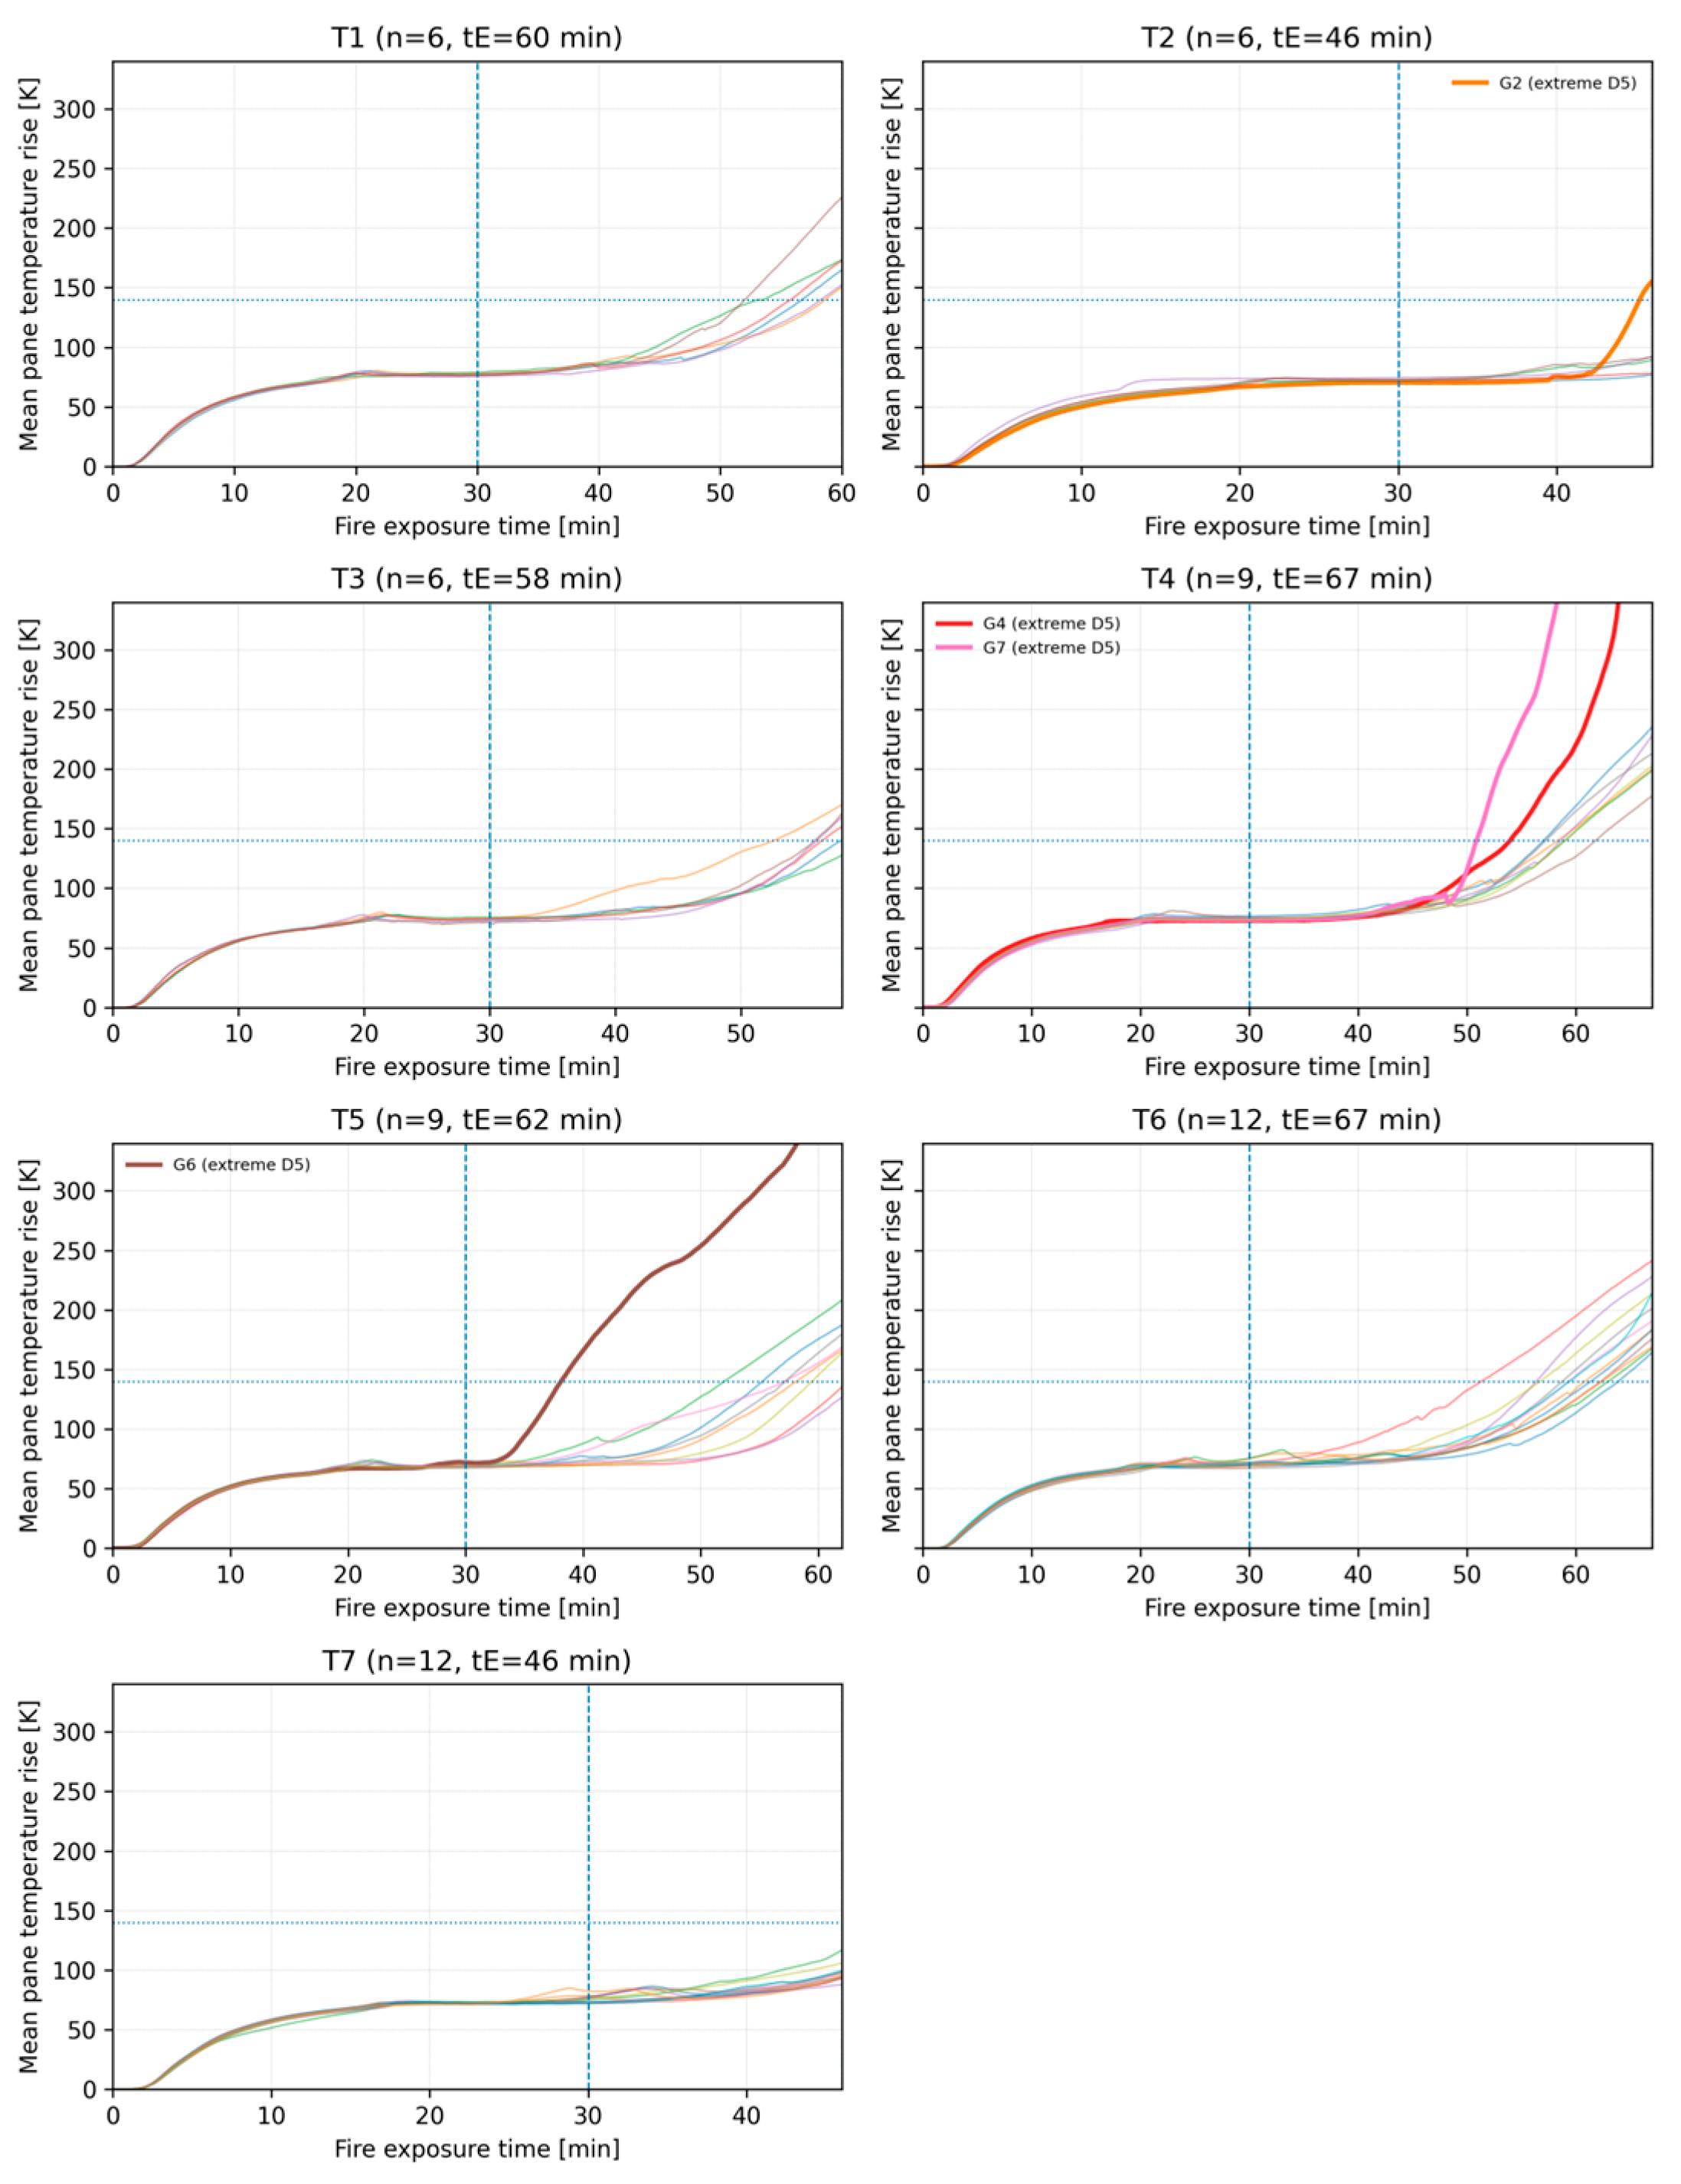
The histories subsequently separated continuously rather than changing regime at 30 min. T5-G6 started a strong early departure at 34.25 min and T2-G2 at 41.00 min. By contrast, T4-G7 and T4-G4 showed their largest short-duration accelerations much later, beginning at 55.25 and 61.00 min. Their dissimilar timing is central to interpreting apparently extreme D5 values.
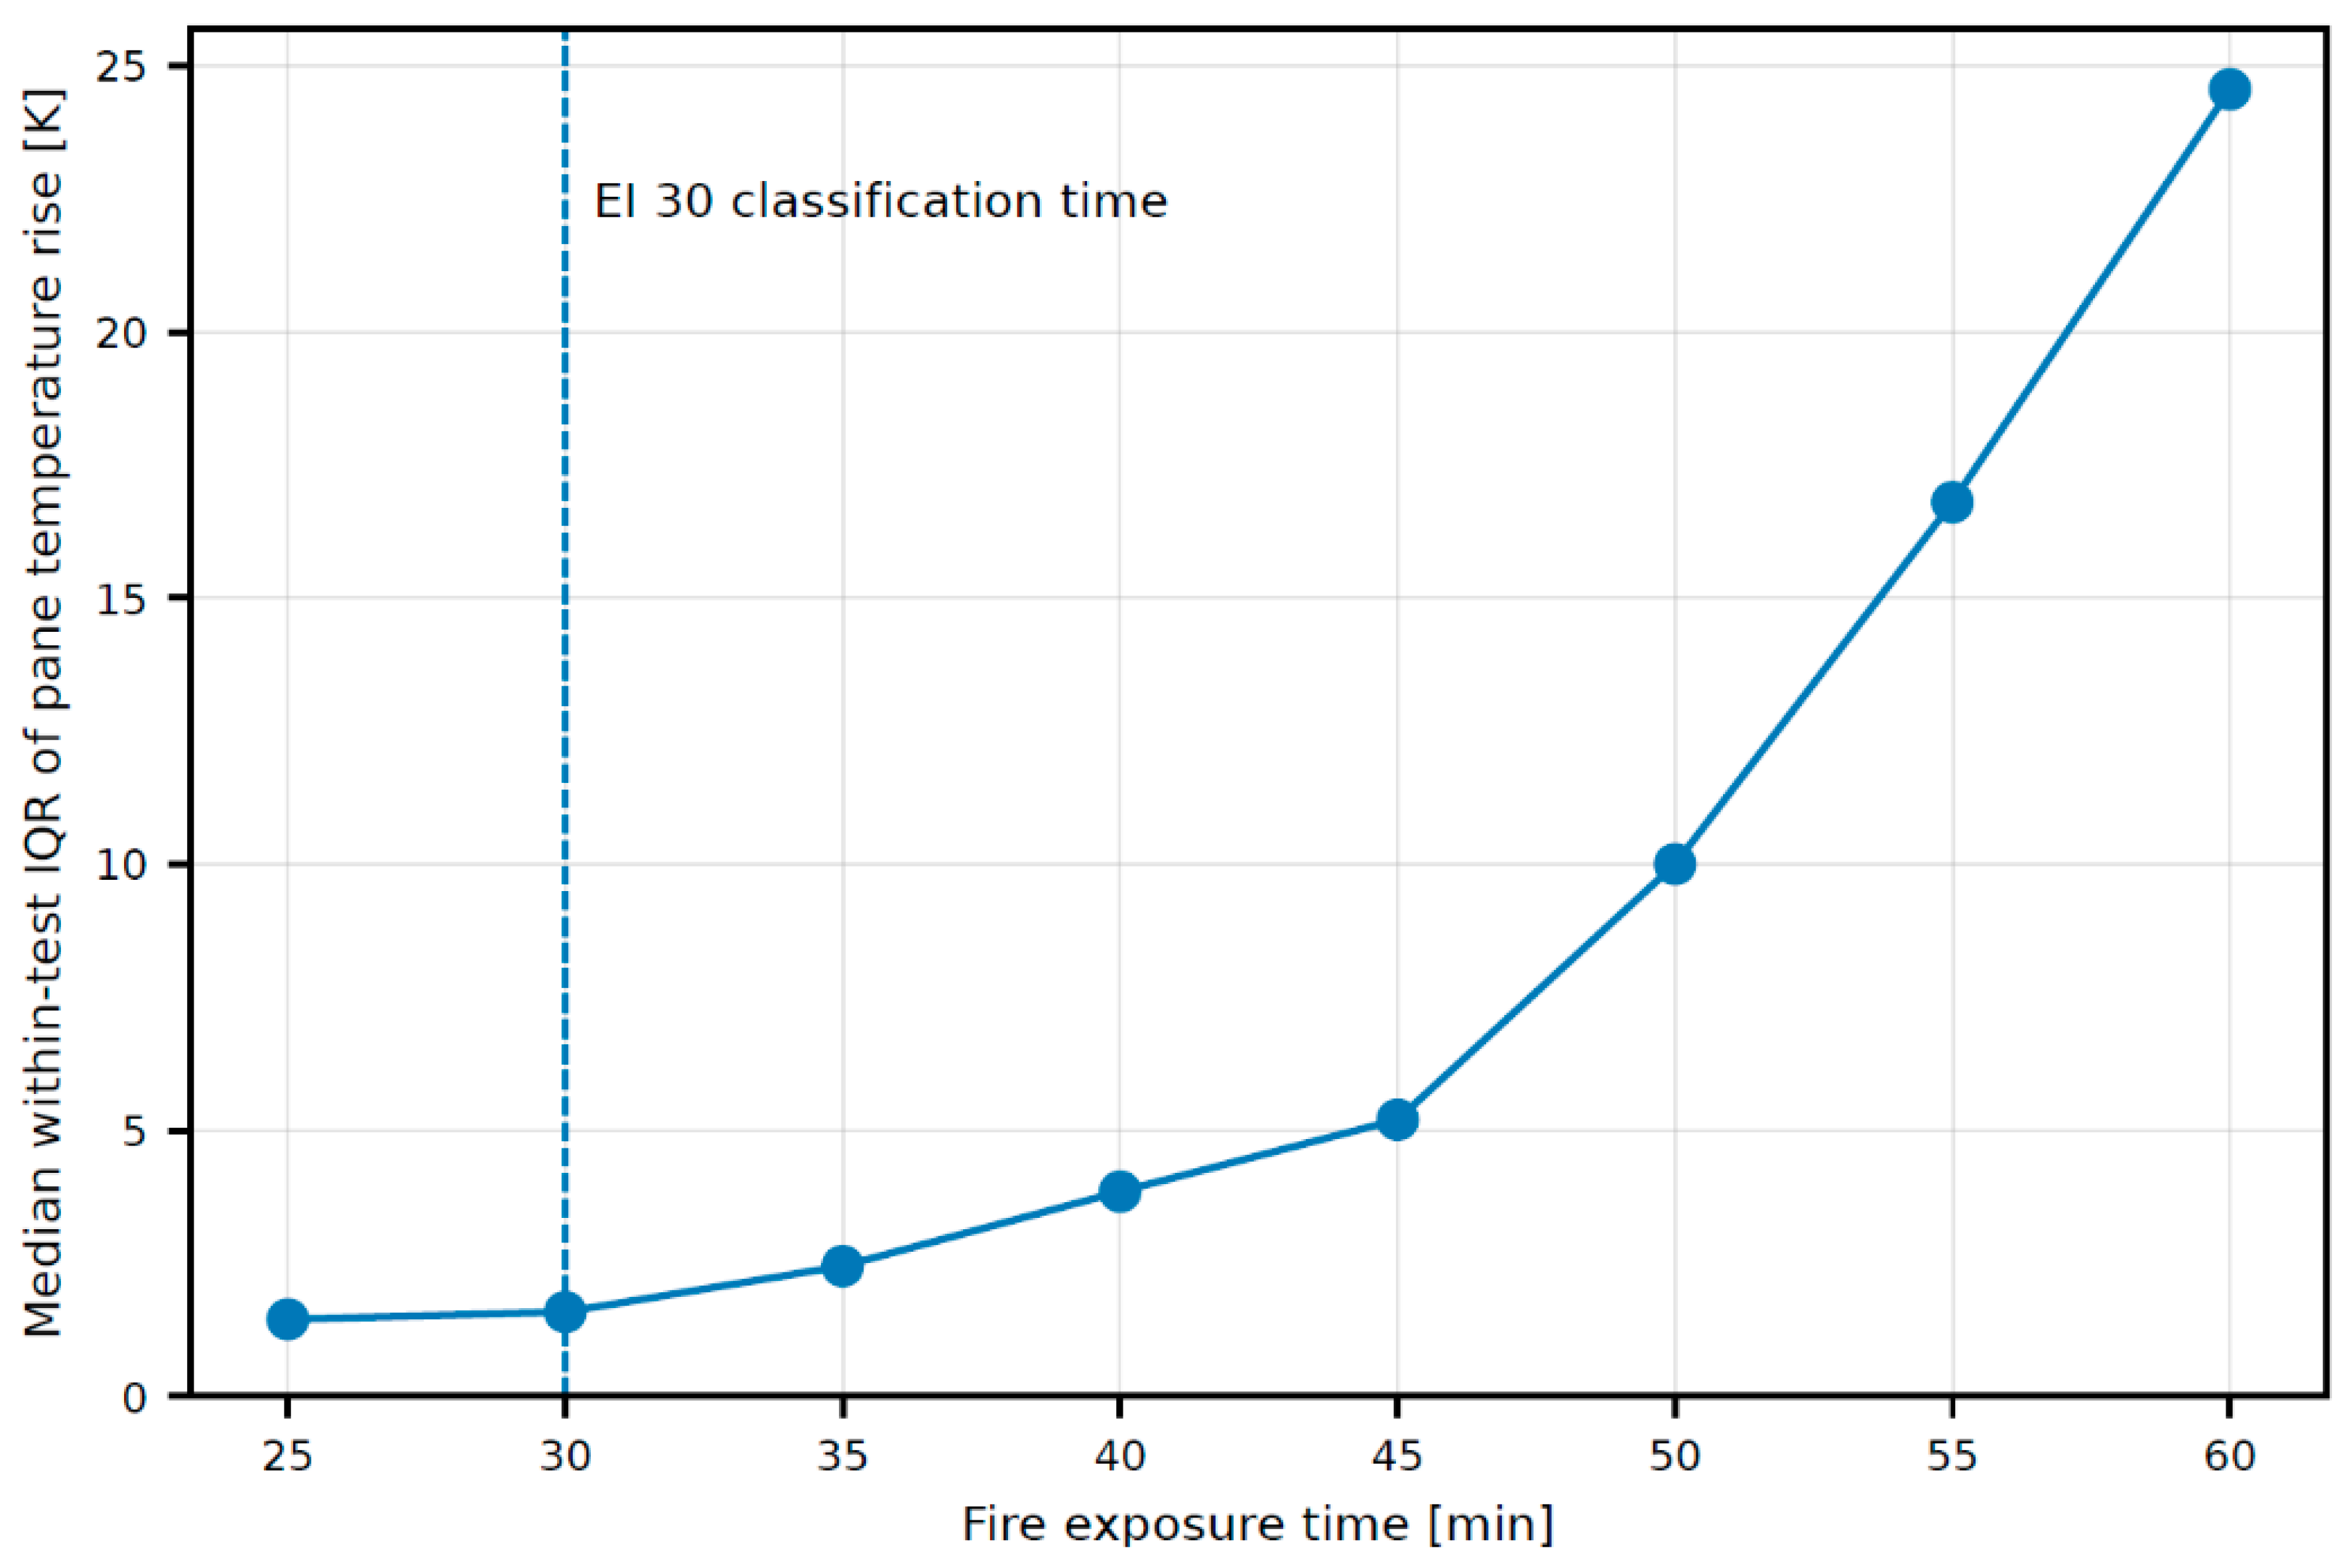
Median within-test IQR increased from 1.59 K at 30 min to 3.85 K at 40 min and 5.20 K at 45 min (Figure 3). Median relative IQR increased from 2.06% to 5.15% and 5.61%, respectively; Holm-adjusted exact one-sided paired tests for the originally specified 30–40 and 30–45 min comparisons gave p = 0.0313. Importantly, IQR increased from 30 to 45 min in six of the seven tests, not all seven (Table 2). In T3 it decreased slightly from 2.04 to 1.14 K. Later median IQR values of 10.00, 16.80 and 24.56 K at 50, 55 and 60 min are descriptive only, because fewer intact clusters contributed (five, five and four tests).
Figure 3.
Development of the median within-test interquartile range of pane mean temperature rise. The vertical dashed line marks the common 30-min classification reference. Values at 50, 55 and 60 min are descriptive because fewer than seven intact test clusters remained available.
Figure 3.
Development of the median within-test interquartile range of pane mean temperature rise. The vertical dashed line marks the common 30-min classification reference. Values at 50, 55 and 60 min are descriptive because fewer than seven intact test clusters remained available.
3.2. Thermal Variation Beyond Central Dispersion and Time to 140 K
Test-level values in Table 2 show why IQR and an extreme-pane descriptor are complementary. At 45 min, the warmest pane exceeded its own test median by 10.40–143.25 K. In T3, central IQR was only 1.14 K despite a 23.78 K maximum-above-median departure; in T5, both descriptors were high (IQR = 25.60 K; maximum-above-median = 143.25 K). The contrast establishes that a small IQR must not be interpreted as excluding an atypical individual component. These quantities describe the installed pane responses and do not, by themselves, identify whether their differences arose from the gel, thermal exposure or local boundary conditions.
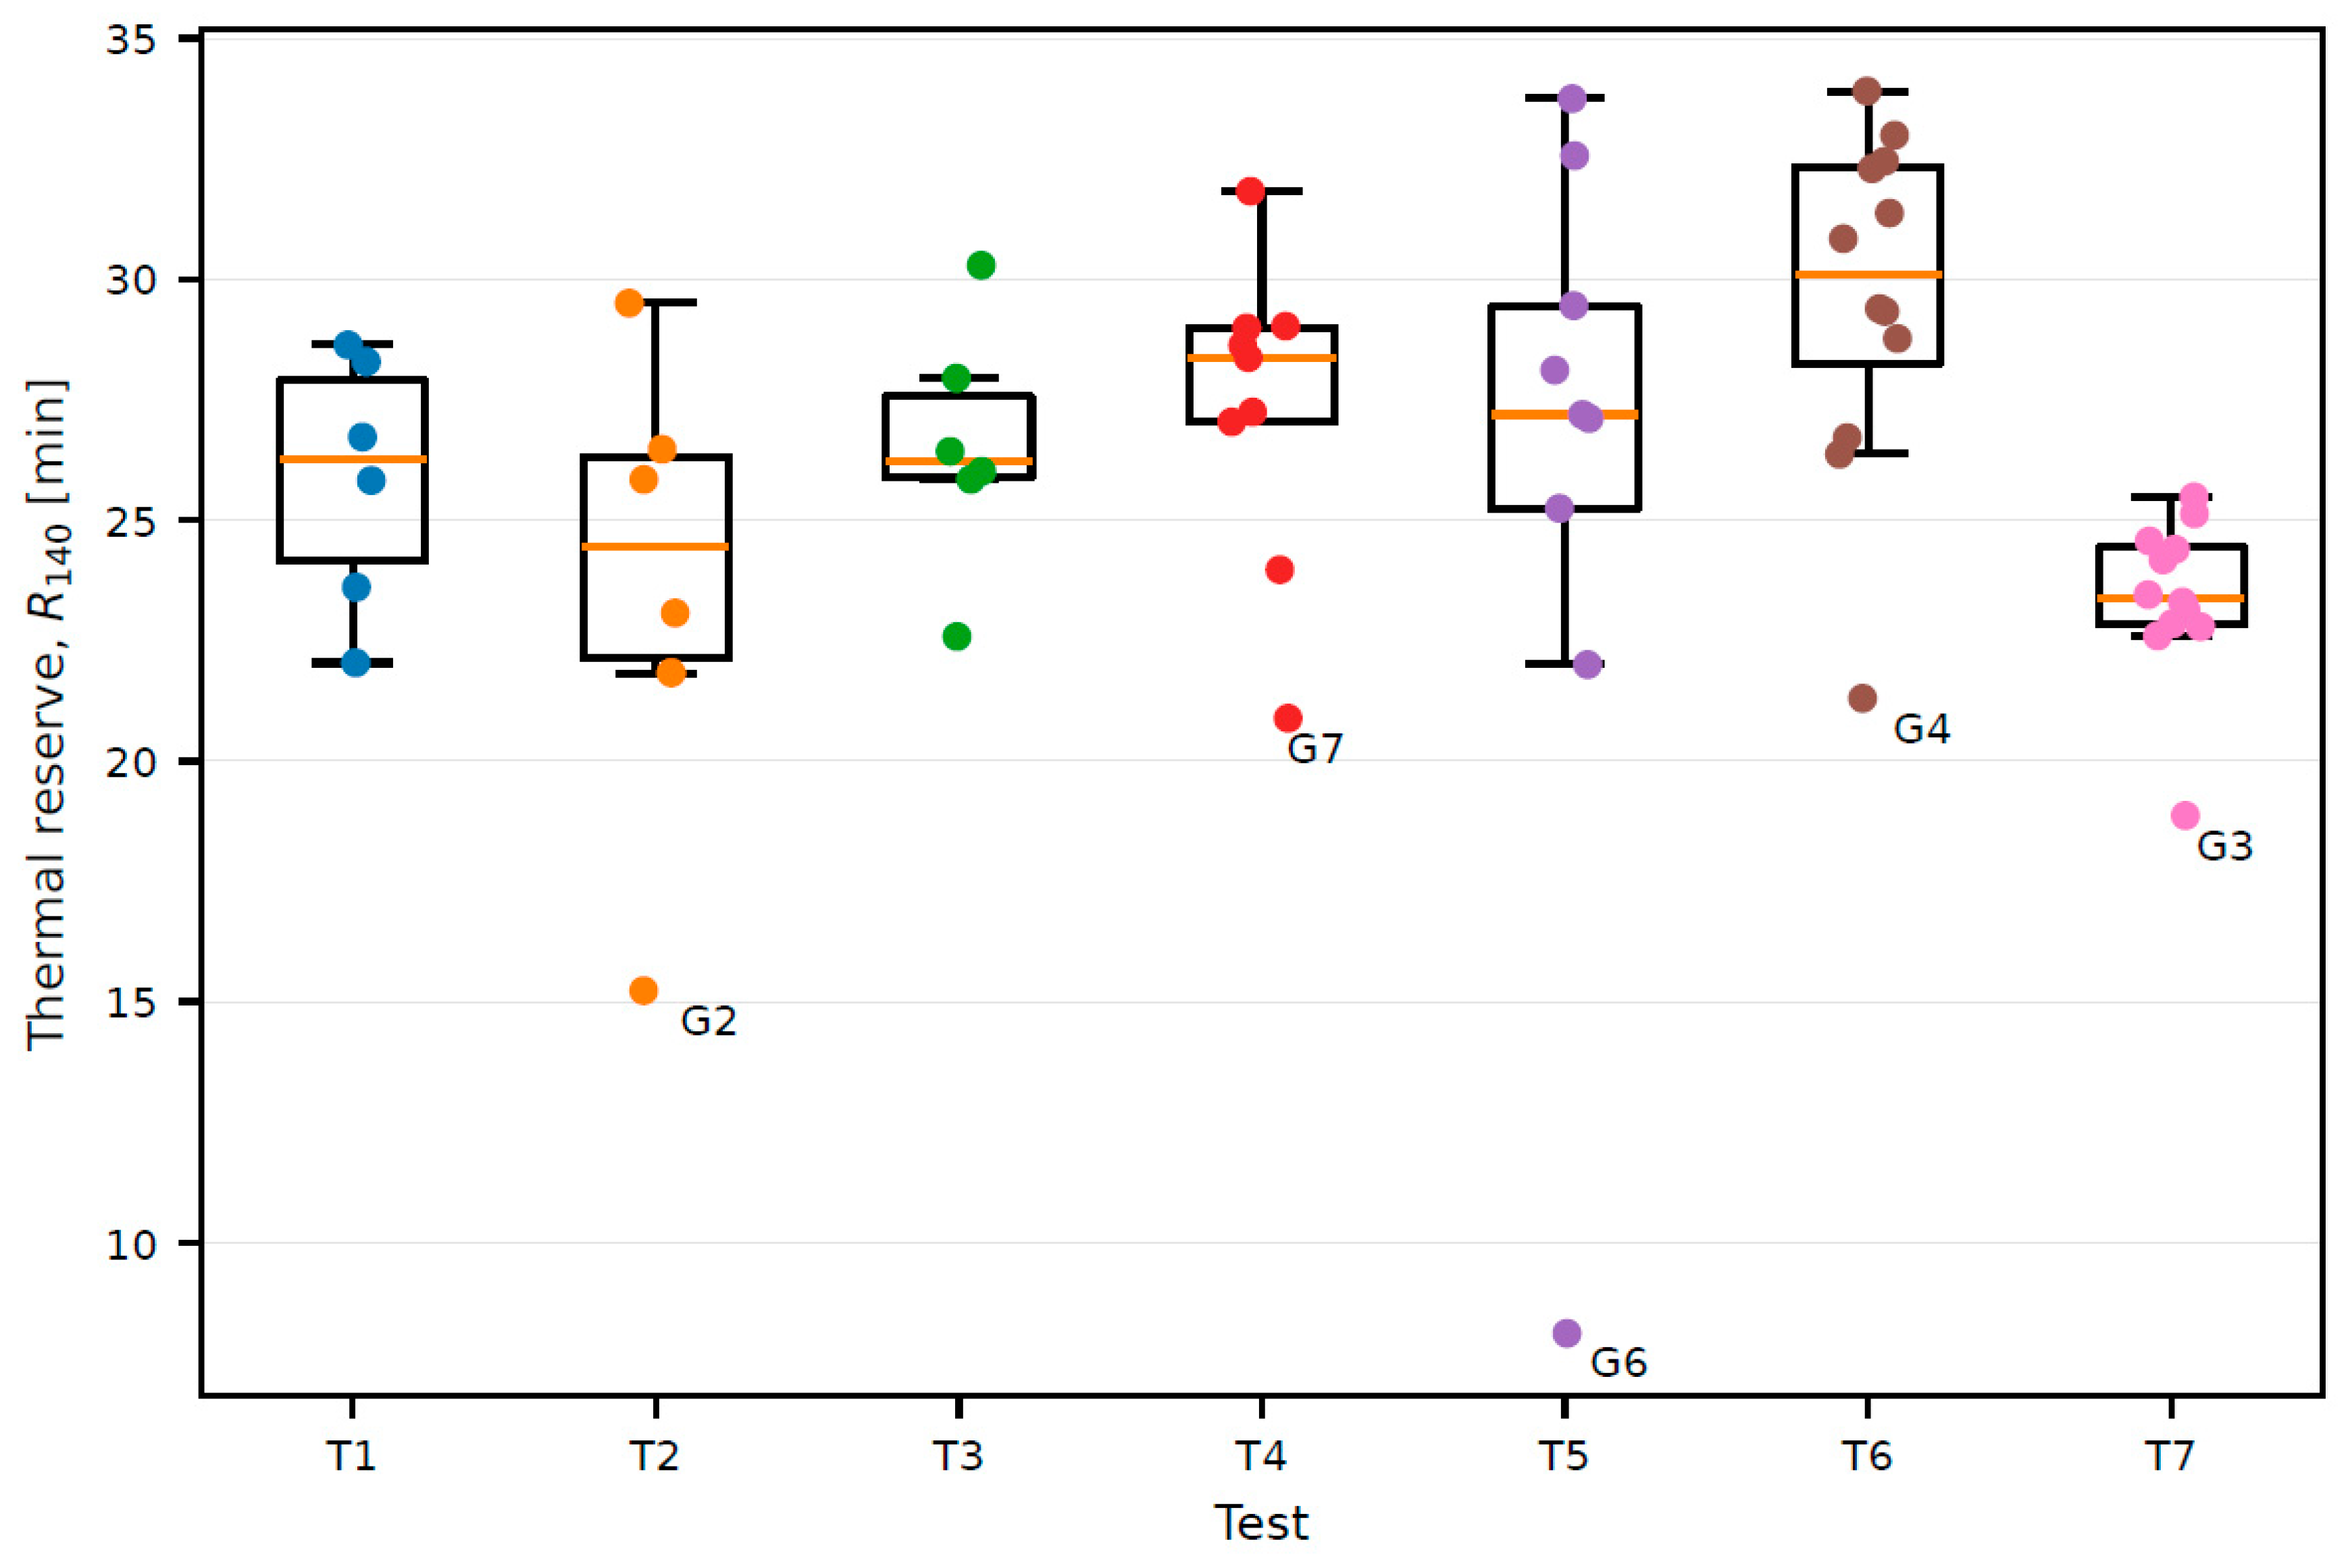
The complementary R140 descriptor ranged from 8.12 to 33.91 min across the 60 panes (median = 26.45 min; Q1 = 23.41 min; Q3 = 29.00 min). The lowest values were observed for T5-G6 (8.12 min), T2-G2 (15.23 min) and T7-G3 (18.87 min), followed by T4-G7 (20.89 min) and T6-G4 (21.30 min). Different test medians (23.38–30.12 min) confirm that between-test shifts exist and should not be confused with within-test material variation (Figure 4).
For 20 of 60 panes, the 140 K crossing occurred after integrity loss of the corresponding full-scale specimen. These are experimentally recorded temperature trajectories, not additional resistance of an intact separating element. The truncated sensitivity check below limits the interpretation of their contribution to the secondary order-statistics illustration.
Figure 4.
Distribution of R140 by full-scale test. Box plots show the within-test distribution; labelled points identify selected low-R140 panes discussed in the text.
Figure 4.
Distribution of R140 by full-scale test. Box plots show the within-test distribution; labelled points identify selected low-R140 panes discussed in the text.
3.3. Early and Late Anomalous Heating
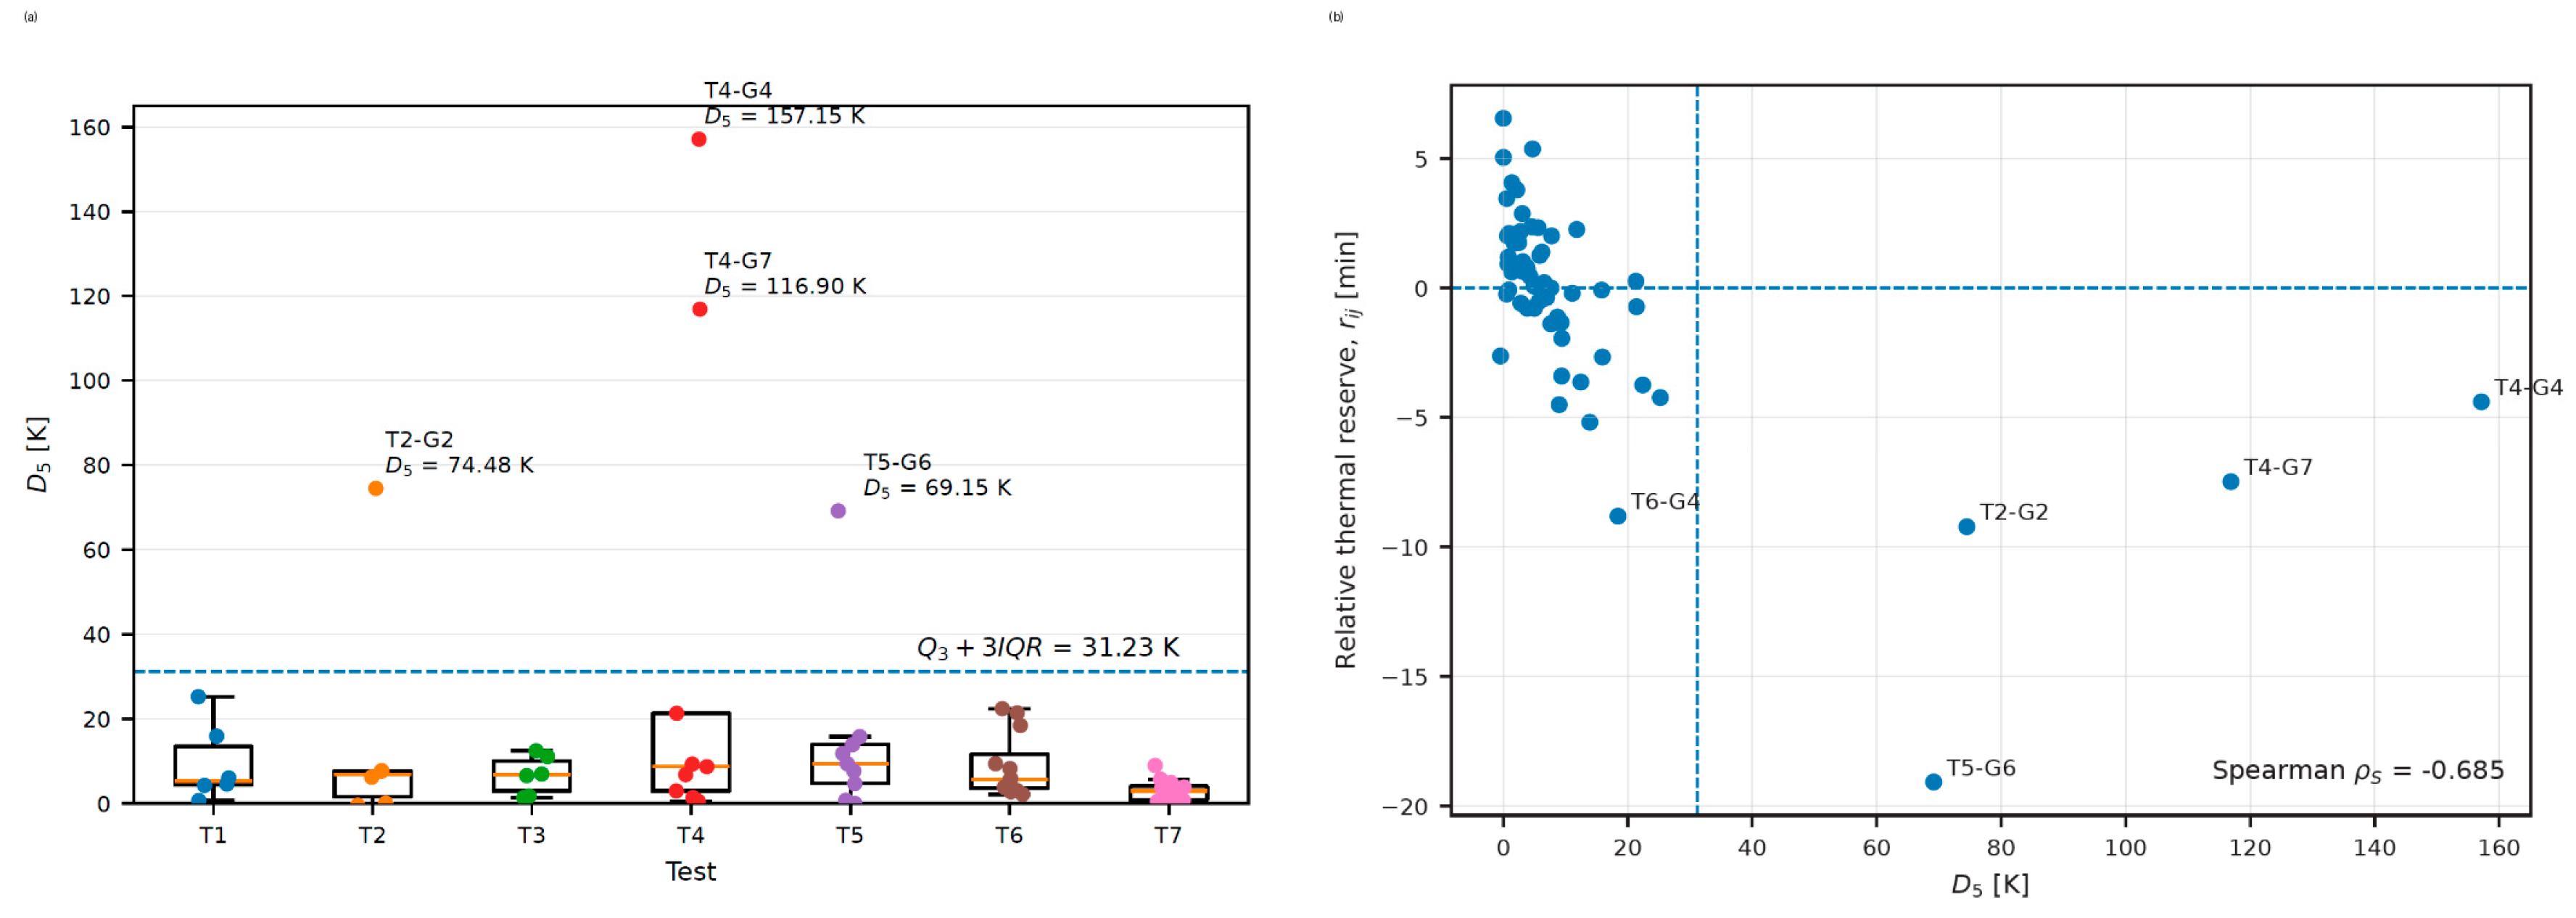
Original intact-window D5 was strongly right-skewed (median 5.79 K; Q1 = 2.68 K; Q3 = 9.82 K). The Q3 + 3IQR screening threshold was 31.23 K and flagged T4-G4, T4-G7, T2-G2 and T5-G6 (Table 3; Figure 5a). Their original D5 values were 157.15, 116.90, 74.48 and 69.15 K. The flags are empirical screening events, not manufacturing defect identifications.
The timing of the four responses differed materially. T5-G6 accelerated between 34.25 and 39.25 min, spanning the test’s temperature-based insulation-criterion time of 37 min and t140 = 38.12 min, while integrity was retained until 62 min. T2-G2 accelerated between 41.00 and 46.00 min; this interval began at the temperature-based insulation-criterion time, contained t140 = 45.23 min, and ended at integrity loss. By contrast, T4-G7 and T4-G4 exhibited their largest D5 values only at 55.25–60.25 and 61.00–66.00 min, after both the temperature-based insulation criterion (50 min) and their respective t140 values, but before integrity loss at 67 min.
When all panes were assessed with identical eligible 5-min windows starting between 30 and 41 min, the D5 screening threshold became 21.03 K and only T2-G2 and T5-G6 remained flagged. The corresponding D5 values of T4-G7 and T4-G4 fell to 7.75 and 6.05 K. Thus, the T4 departures are real late-stage accelerations, but they are not comparable to the two early flags under an equal observation opportunity.
The four original flags occur at different normalised pane positions (Figure 1), providing no simple shared spatial explanation. Previous records document intumescent-layer degradation in selected panes of T4 and T5 [13]. Without individual chemical, moisture, microstructural or production-batch data, the observations cannot isolate a unique causal mechanism for any flag.
3.4. Association of Short-Term Acceleration with the Relative Thermal Trajectory
Across 60 panes, original-window D5 and within-test-centred R140 were negatively associated (Spearman ρ = −0.685; hierarchical-bootstrap 95% interval approximately −0.83 to −0.37). The association remained after the four originally flagged panes were omitted (ρ = −0.616). These statistics use pane observations nested within seven different tests and are presented as associations between descriptors derived from the same thermal records, not as independent material-property correlations.
The equal-window association was also negative (ρ = −0.526; ρ = −0.475 when the two equal-window flags were excluded). The relation was not one-to-one: T5-G6 combined a strong early acceleration with the lowest centred R140, whereas late T4-G4 acceleration did not coincide with a comparably extreme centred margin; other low-margin panes remained below the D5 flag threshold. D5 therefore screens atypical short-period heating but neither identifies a degradation mechanism nor substitutes for the full temperature history.
Figure 5.
Short-term thermal acceleration and relative reserve. (a) Original D5 distribution by test; the dashed line marks the Q3 + 3IQR screening threshold. (b) Association between D5 and within-test-centred R140; labelled points denote the four original D5 flags and selected low-reserve panes.
Figure 5.
Short-term thermal acceleration and relative reserve. (a) Original D5 distribution by test; the dashed line marks the Q3 + 3IQR screening threshold. (b) Association between D5 and within-test-centred R140; labelled points denote the four original D5 flags and selected low-reserve panes.
3.5. Exploratory Order-Statistics Illustration (Secondary Analysis)
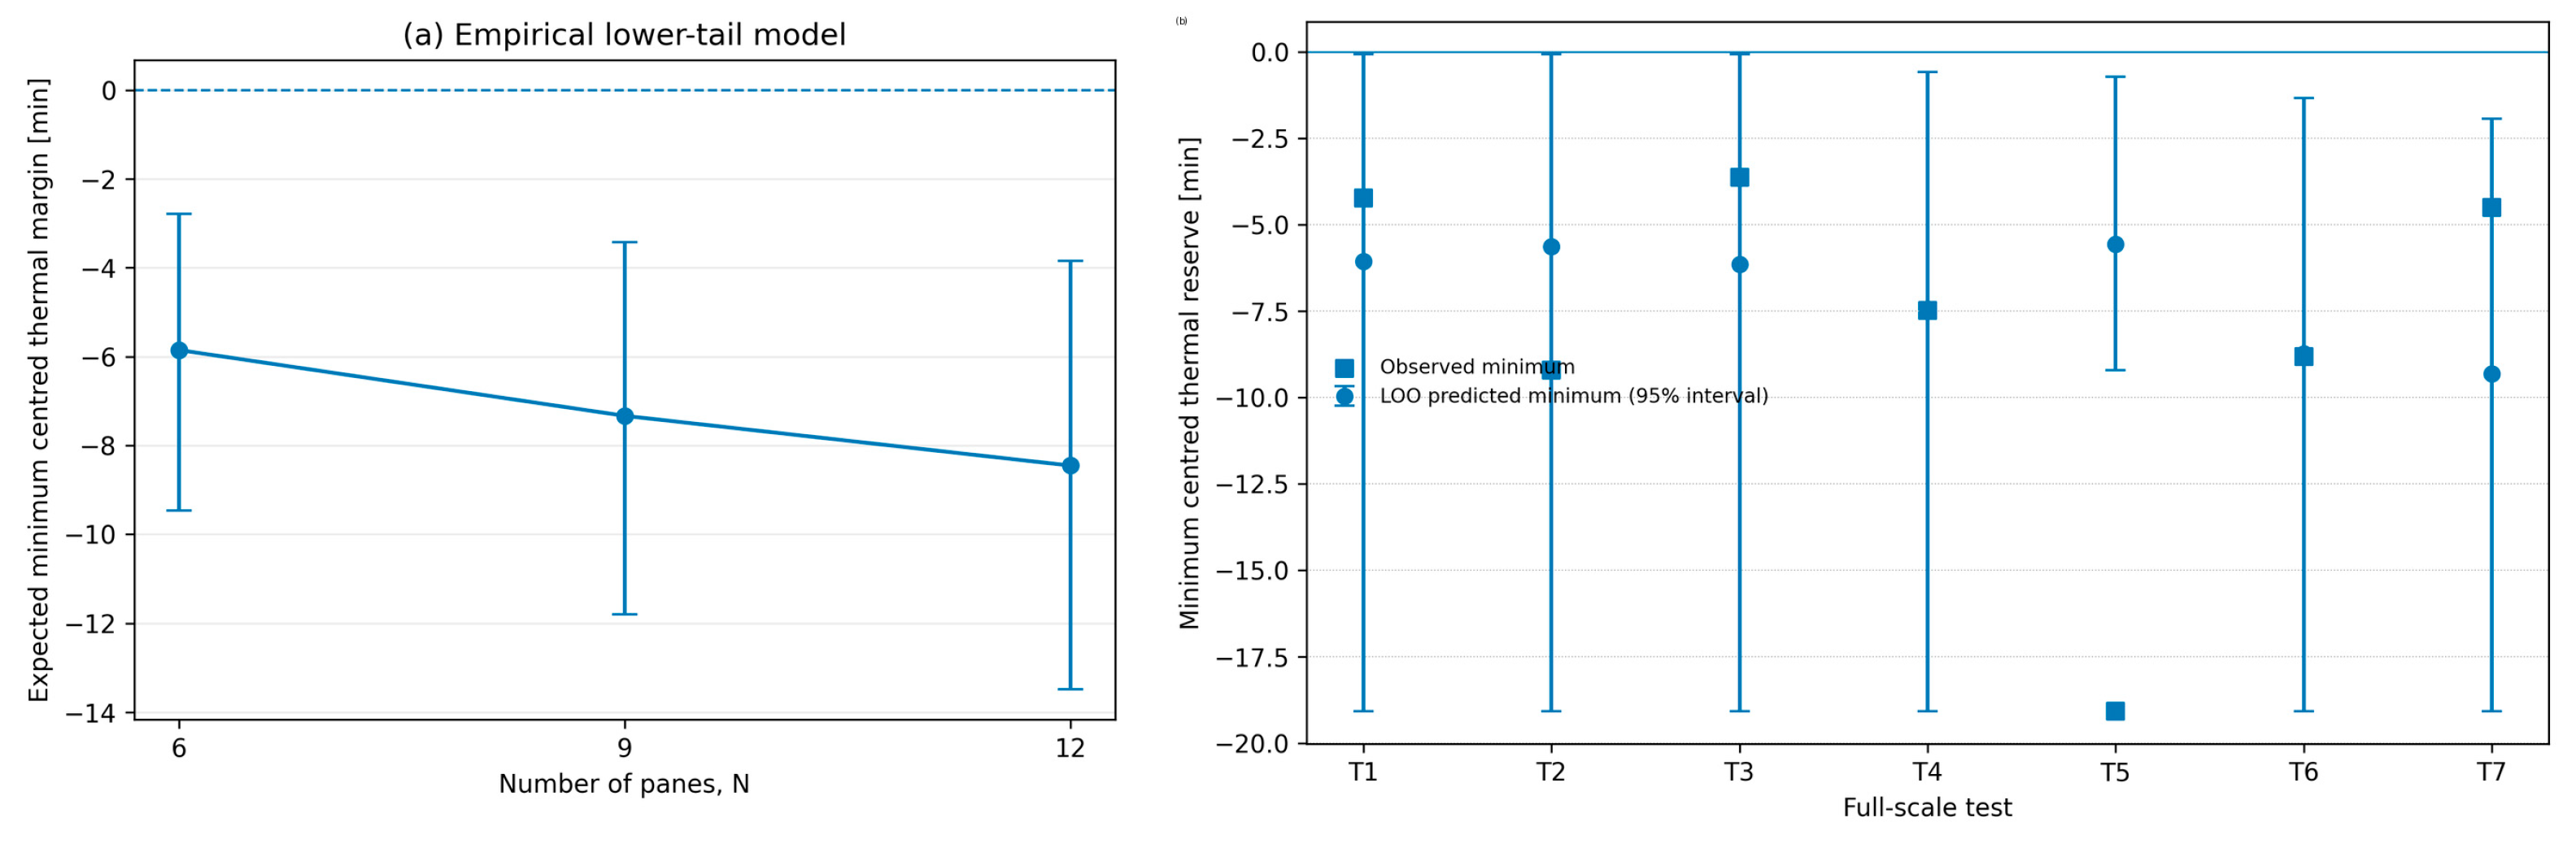
Under the explicit assumption that centred pane values are exchangeable draws from one pooled empirical distribution, the expected minimum was −5.85 min for N = 6, −7.33 min for N = 9 and −8.45 min for N = 12 (Table 4; Figure 6a). Corresponding hierarchical-bootstrap percentile intervals were −9.47 to −2.79, −11.80 to −3.42 and −13.49 to −3.84 min. These numbers are outputs of a model applied to the observed distribution, not comparisons establishing a pure pane-count effect experimentally.
The predicted 6-to-12 difference of 2.60 min (bootstrap interval 0.95–4.10 min) reflects the expected-minimum property of repeated draws from an empirical distribution, not deterioration of an individual pane or a verified performance penalty for a larger wall. Pane count co-varied with height and other test characteristics, and the seven tests do not support independently validated scaling predictions. This illustration is retained principally to reveal sensitivity to the observed lower tail.
3.6. Influence and Internal Model-Consistency Diagnostics
The internal leave-one-test-out exercise showed that T5 was poorly represented by the other six test clusters (Figure 6b): its observed minimum centred reserve was −19.07 min, but the most negative training value after withholding T5 was only −9.23 min. Consequently, no resampling from the six remaining tests could reproduce the observed T5 minimum. Other held-out minima were broadly within the resulting model distributions. These findings reveal nonexchangeability and the influence of rare test-specific histories; they do not constitute external validation.
Figure 6.
Secondary empirical order-statistics illustration and internal leave-one-test-out diagnostics. (a) Expected minimum centred thermal margin for N = 6, 9 and 12; error bars show 95% hierarchical-bootstrap intervals. (b) Observed minimum for each full-scale test compared with the leave-one-test-out predicted minimum and its 95% interval. T5 lies below the support available from the other six clusters.
Figure 6.
Secondary empirical order-statistics illustration and internal leave-one-test-out diagnostics. (a) Expected minimum centred thermal margin for N = 6, 9 and 12; error bars show 95% hierarchical-bootstrap intervals. (b) Observed minimum for each full-scale test compared with the leave-one-test-out predicted minimum and its 95% interval. T5 lies below the support available from the other six clusters.
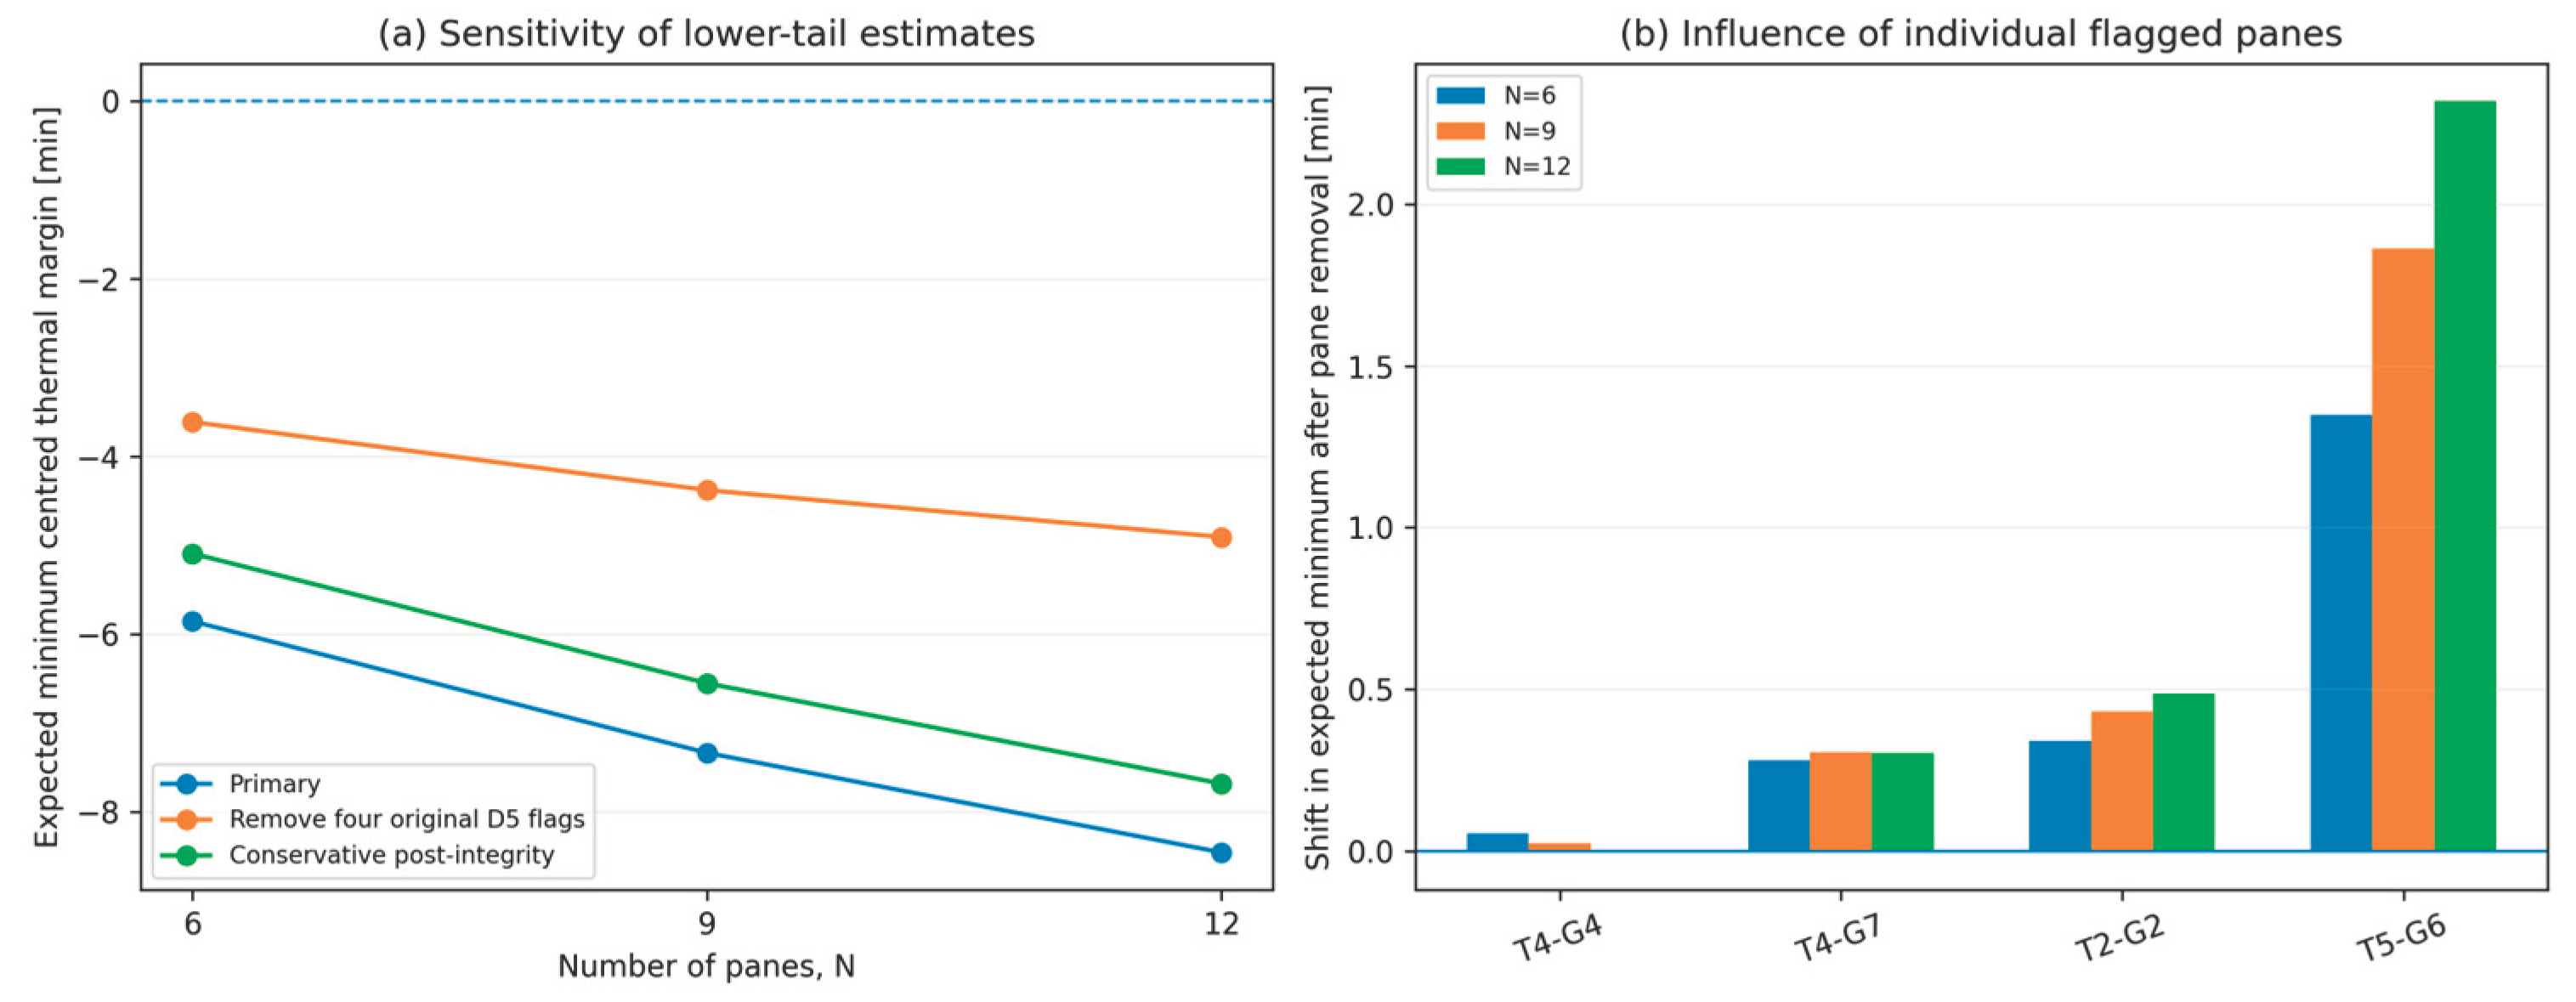
The individual-influence exercise (Figure 7) found only small changes when T4-G4, T4-G7 or T2-G2 was removed. Removing T5-G6 shifted the expected minima towards zero by 1.35, 1.86 and 2.32 min for N = 6, 9 and 12. If all four original D5 flags were removed and the remainder re-centred, model estimates became −3.61, −4.38 and −4.90 min. The apparent 6-to-12 difference was then approximately 1.30 min, rather than 2.60 min with all panes retained.
The conservative integrity-truncated transformation yielded minima of −5.09, −6.55 and −7.68 min for N = 6, 9 and 12. These tests show how a small number of influential trajectories and endpoint conventions change the magnitude of a mathematical illustration; they do not demonstrate a transferable system-size law.
Figure 7.
Sensitivity and influence analyses. (a) Expected minimum centred thermal margin for the primary dataset, after removal of all four original D5 flags, and under the conservative post-integrity transformation. (b) Shift in the expected minimum after removal of each original D5-flagged pane; T5-G6 has the largest individual influence.
Figure 7.
Sensitivity and influence analyses. (a) Expected minimum centred thermal margin for the primary dataset, after removal of all four original D5 flags, and under the conservative post-integrity transformation. (b) Shift in the expected minimum after removal of each original D5-flagged pane; T5-G6 has the largest individual influence.
4. Discussion
4.1. Material-Response Interpretation and the Limits of Causal Attribution
Nominally identical fire-resistant panes developed substantially different temperature histories during the same test exposure. An interquartile-range summary characterises the central part of the pane population, but the warmest pane can deviate strongly even when the IQR remains compact, as T3 illustrates. Such behaviour is compatible with the multiple thermal and material processes governing intumescent glazing: dehydration, expansion, evolving insulating layers and sensitivity to formulation/ageing documented in materials research [1,2,3,4,5,6,26,27]. The data establish heterogeneity in the measured thermal performance of installed panes; they do not identify which microscopic transformation produced any individual trajectory.
D5 separates rapid differential heating from the overall dispersion, but it must be read in time context. Its negative association with R140 remained under the common-window and anomaly-removal checks; nonetheless both quantities derive from the same temperature records and are not independent observations of material degradation. T5-G6 is a convincing example of an unusually warm, rapidly accelerating pane; T4-G4 and T4-G7 provide equally important examples of strong late-stage changes that disappear from an early common-window extreme screen.
This early-versus-late distinction is material to interpreting fire-protective glass because the formation and subsequent evolution of insulating interlayers occur throughout heating, not at a unique 30-min threshold. The common EI 30 rating time is an imposed reference and not an abrupt physical transition. Longer tests may simply permit more opportunities to observe late acceleration. Comparing maxima over unequal time windows would therefore conflate response severity with observation opportunity.
Archived qualitative observations of intumescent-layer degradation in T4 and T5 [13] are compatible with the observed atypical trajectories, but they are not pane-specific chemical or microstructural diagnoses. Production, moisture content, previous ageing, local restraint, furnace heating and frame–glass interaction remain potential alternative contributors. Without material analysis of individual panes or independent replicated assemblies, assigning the extremes to a manufacturing defect or a universal gel mechanism would exceed the evidence.
4.2. Rating-Time Reference and the Scope of the Measured Responses
All seven complete partitions reached EI 30, but their thermal curves evolved continuously across the common 30-min time. The temperature-based insulation-criterion times were between 37 and 50 min, while integrity times ranged from 46 to 67 min. The heterogeneity reported here describes pane-resolved heating during continued exposure, not an unrecognised failure of the declared rating. This distinction is central to the use of the data as experimental material-response evidence.
R140 is the elapsed time after the 30-min reference until one pane reaches a 140 K mean rise; it excludes the maximum-temperature and integrity criteria of the complete wall. In 20 panes the crossing occurred after integrity loss, so the corresponding post-integrity temperatures are observational histories with limited relevance to a separating element remaining intact. No new EI rating, reserve allowance or component limit can be inferred from these curves.
The work illustrates the value of preserving pane-resolved thermocouple histories from standard full-scale fire experiments [15,16]. Analysing within-test dispersion, maximal departures from contemporaneous panes and time-local accelerations adds information to the original wall-level E/I assessment while leaving the historical classification intact.
4.3. Why the Empirical Lower-Tail Calculation Is Not a Verified System-Size Effect
If a common empirical distribution is repeatedly sampled, increasing the number of draws must produce a non-increasing expected minimum [21]. The computed N = 6, 9 and 12 trend is therefore expected even without a causal relationship between wall size and intrinsic glazing response. Actual tests combined different heights, reinforcement and frame configurations with different pane counts, so component count was not experimentally isolated.
The experimental contribution is the measured within-test distribution and the unusual trajectories entering its tail. The secondary model highlights their leverage: removing T5-G6 materially changes the expected-minimum estimates, and a model trained on the other six full-scale tests cannot reproduce T5’s observed minimum. Therefore, the numerical N-contrast should neither be treated as a validated scaling coefficient nor used in reliability calculations for other products.
That the expected minimum remains non-increasing after anomaly removal does not provide independent physical validation: this behaviour follows mathematically from drawing minima from any non-degenerate distribution. The change in magnitude from 2.60 to about 1.30 min is instead the meaningful sensitivity finding. It demonstrates that a single lower-tail observation can strongly affect a population-based estimate generated from a small heterogeneous programme.
We retain the order-statistics calculations for transparency and as a cautionary example of how apparently plausible trends can be driven by distributional assumptions. The model is descriptive, not a design factor, classification amendment or empirical proof of deterioration with pane number.
4.4. Implications for Fire-Protective Material Assessment
A practical benefit for fire-testing laboratories is that routinely acquired multiple-pane temperature histories can reveal between-component heterogeneity that is concealed by a specimen-level criterion time. Where applicable, retaining and comparing all pane histories-not only selected representative curves-supports identification of atypical heating before and after the common rating reference.
For manufacturers of multi-layer fire-resistant glazing, the findings motivate assessment of consistency of thermally active interlayers, storage and installation conditions [7]. The present observations do not show that a specific supplied pane was defective or that a particular batch is systematically inferior. They show why the upper-temperature tail and its timing can matter even if the median or IQR across panes remains small.
For engineering interpretation, none of the reported descriptors is an alternative regulatory requirement. The calculations do not justify imposing a maximum pane count, reducing the achieved EI classification or adopting a numerical safety penalty. Such decisions would require independent experiments in which pane count, partition geometry, material batch and local thermal boundary conditions are separated by design.
4.5. Experimental Scope and Avenues for Verification
The findings are limited to 60 nominally identical full-size panes of one glazing product in seven non-identical full-scale tests. This provides 60 component observations but only seven experimental clusters. The test configurations, wall heights and pane counts vary together. Neither within-test centring nor cluster bootstrap creates independent replicates or removes all common environmental/structural influences.
IQR, maximal above-median temperature, D5 and R140 are descriptive or screening measures of the recorded surface temperature rise. They do not independently measure insulating-layer chemistry, moisture migration or nanoscale transformation. The two thermocouples per pane describe the mean of two local surface readings rather than a full temperature field. Spatial position, local shielding, frame deformation and thermocouple contact may also affect individual trajectories.
The intact-window D5 maxima depend on unequal test durations; the common-window analysis addresses this observation-opportunity effect, but cannot assign an early flag to a specific material cause. The 20 post-integrity R140 values cannot be interpreted as extra fire resistance. The secondary order-statistics illustration additionally assumes exchangeability of centred pane observations; this assumption is unverified because neighbouring panes share a specimen and boundary conditions.
Future tests should use controlled repeat specimens of one configuration, with independently documented material batches and pane-specific interlayer characterisation, together with enough component replication to separate within-batch and between-batch variability. Such tests would be required before generalising a lower-tail distribution, identifying a physical degradation mechanism, or translating an apparent pane-count dependence into a reliability model.
5. Conclusions
The 15-s temperature-history reanalysis of 60 full-size panes of one nominal fire-resistant glazing product, nested in seven full-scale EI 30 tests, supports the following conclusions:
- At 30 min, the median test-specific IQR was 1.59 K; by 45 min it had risen to 5.20 K. IQR increased in six of seven tests, with T3 an exception (2.04 to 1.14 K). Variability increased progressively rather than at a physical transition at the 30-min rating time.
- Central dispersion alone did not capture isolated heated panes. At 45 min the hottest pane exceeded the same-test median by 10.40–143.25 K. T3 had a small IQR of 1.14 K despite a 23.78 K upper departure, while T5 showed both strong dispersion and a 143.25 K upper departure.
- The common observation-window D5 assessment retained two early accelerated trajectories, T2-G2 and T5-G6. T4-G4 and T4-G7 were late-stage accelerations that appeared extreme only in the longer original windows. The equal-window D5 association with centred R140 was negative (ρ = −0.526), but this correlation between descriptors of the same thermal histories is not a mechanistic proof.
- Pane-level R140 ranged from 8.12 to 33.91 min, but it is a descriptive time to a 140 K mean rise after the EI 30 reference, not a separate fire-resistance classification. Twenty values occurred after loss of specimen integrity and were interpreted subject to this limit.
- The auxiliary order-statistics calculation was strongly affected by rare observations, particularly T5-G6; the 6-to-12 model contrast changed from 2.60 to about 1.30 min after removing four flagged panes. Because the expected-minimum trend is mathematical and pane count was confounded with system configuration, these estimates do not demonstrate a causal or independently validated system-size effect.
Supplementary Materials
The following supporting information can be downloaded at the website of this paper posted on Preprints.org. Supplementary Materials comprise Tables S1–S3 (60 pane-level derived descriptors, leave-one-test-out checks, and individual influence results) and Supplementary Dataset S1 (15-s pane mean temperature-rise histories, variable dictionary, verification data, and executable Python scripts). The dataset and scripts reproduce the principal numerical results from the original processed temperature histories; no new measurements were introduced.
Funding
This research received no external funding.
Institutional Review Board Statement
Not applicable.
Informed Consent Statement
Not applicable.
Data Availability Statement
The 15-s pane mean temperature-rise records and analysis scripts supporting the principal findings are provided as Supplementary Dataset S1, alongside the pane-level derived descriptors in Supplementary Table S1. Original individual thermocouple readings, calibration documentation and further archival test records are not included in that dataset; requests for additional records should be addressed to the corresponding author and may be subject to applicable third-party or institutional access restrictions.
Acknowledgments
The authors acknowledge the technical personnel involved in the original full-scale fire-resistance test programme.
Conflicts of Interest
The authors declare no conflicts of interest.
Declaration of Generative AI and AI-Assisted Technologies
During preparation of this study the authors used OpenAI ChatGPT (including GPT-5.6 Sol and GPT-6) to assist with manuscript organisation, language editing, identification and checking of bibliographic records, and drafting and reviewing Python scripts for calculation and data visualisation. The authors inspected and independently checked the analytical definitions, data mapping, code output and manuscript conclusions and accept responsibility for the work. No generative AI system was used to create or alter experimental temperature measurements.
References
- Liu, W.; Ge, X.; Zhou, X.; Tang, Y. Thermal intumescent behavior of a gel containing silica. RSC Adv. 2015, 5, 33208–33211. [Google Scholar] [CrossRef]
- Liu, W.; Ge, X.; Zhang, Z. Study of the relationship between thermal insulation behavior and microstructure of a fire-resistant gel containing silica during heating. Fire Mater. 2018, 42, 44–49. [Google Scholar] [CrossRef]
- Wu, M.; Chow, W.K.; Ni, X. Characterization and thermal degradation of protective layers in high-rating fire-resistant glass. Fire Mater. 2015, 39, 26–40. [Google Scholar] [CrossRef]
- Wang, F.; Cai, M.; Yan, L. Effect of Poly(acrylamide-acrylic acid) on the Fire Resistance and Anti-Aging Properties of Transparent Flame-Retardant Hydrogel Applied in Fireproof Glass. Polymers 2021, 13, 3668. [Google Scholar] [CrossRef]
- Cotini, O.; Ataollahi, N.; Di Maggio, R. Curing treatments of silica gel for fire-retardant glass by intumescence. SN Appl. Sci. 2023, 5, 319. [Google Scholar] [CrossRef]
- Mastalska-Popławska, J.; Wójcik, Ł.; Izak, P.; Konaszewski, D. Effect of Composition on the Physicochemical Properties of Cross-Linked Poly(sodium acrylate)/Sodium Silicate Hydrogels. Materials 2023, 16, art. 7422. [Google Scholar] [CrossRef]
- Kinowski, J.; Sulik, P.; Sędłak, B. Impact of improper storage and installation of glazed fire rated walls on their performance. MATEC Web Conf. 2019, 284, 02003. [Google Scholar] [CrossRef]
- Dembele, S.; Rosario, R.A.F.; Wen, J.X. Thermal breakage of window glass in room fires conditions – Analysis of some important parameters. Build. Environ. 2012, 54, 61–70. [Google Scholar] [CrossRef]
- Wang, Q.; Wang, Y.; Zhang, Y.; Chen, H.; Sun, J.; He, L. A stochastic analysis of glass crack initiation under thermal loading. Appl. Therm. Eng. 2014, 67, 447–457. [Google Scholar] [CrossRef]
- Wang, Y.; Rush, D. Determination of critical fallout condition of tempered glass in an enclosure fire. Fire Saf. J. 2018, 101, 18–24. [Google Scholar] [CrossRef]
- Xie, Q.; Wang, T.; Guo, S.; Ma, C. A comparative study of statistical methods for critical parameters at tempered glass fallout in an enclosure fire. Constr. Build. Mater. 2021, 266, 121033. [Google Scholar] [CrossRef]
- Wang, Y.; Zhang, Y.; Wang, Q.; Yang, Y.; Sun, J. The effect of glass panel dimension on the fire response of glass façades. Constr. Build. Mater. 2018, 181, 588–597. [Google Scholar] [CrossRef]
- Sędłak, B.; Sulik, P.; Garbacz, A. Scale effect in the evaluation of the fire resistance of glazed partitions. J. Build. Eng. 2022, 49, 104108. [Google Scholar] [CrossRef]
- Chen, H.; Xia, T.; Ran, D.; Zhou, L.; Bisby, L.; Wang, Y. Interaction between compartment fire development and fallout of tempered glass in a framing multi-pane glass façade. Fire Saf. J. 2026, 163, 104830. [Google Scholar] [CrossRef]
- Maluk, C. Motivation, drivers and barriers for a knowledge-based test environment in structural fire safety engineering science. Fire Saf. J. 2017, 91, 103–111. [Google Scholar] [CrossRef]
- Bonner, M.; Wegrzynski, W.; Papis, B.K.; Rein, G. KRESNIK: A top-down, statistical approach to understand the fire performance of building facades using standard test data. Build. Environ. 2020, 169, 106540. [Google Scholar] [CrossRef]
- EN 1364-1:2015; Fire resistance tests for non-loadbearing elements – Part 1: Walls.
- EN 1363-1:2020; Fire resistance tests – Part 1: General requirements.
- EN 13501-2:2023; Fire classification of construction products and building elements – Classification using data from fire resistance tests, excluding ventilation services.
- Hoaglin, D.C.; Iglewicz, B.; Tukey, J.W. Performance of Some Resistant Rules for Outlier Labeling. J. Am. Stat. Assoc. 1986, 81, 991–999. [Google Scholar] [CrossRef]
- Bayramoglu, I. Joint distribution of a random sample and an order statistic: A new approach with an application in reliability analysis. Reliab. Eng. Syst. Saf. 2020, 193, 106594. [Google Scholar] [CrossRef]
- Wilcoxon, F. Individual Comparisons by Ranking Methods. Biom. Bull. 1945, 1, 80. [Google Scholar] [CrossRef]
- Holm, S. A Simple Sequentially Rejective Multiple Test Procedure. Scand. J. Stat. 1979, 6, 65–70. [Google Scholar]
- Zar, J.H. Spearman Rank Correlation: Overview. In Wiley StatsRef: Statistics Reference Online; Wiley, 2014. [Google Scholar]
- Field, C.A.; Welsh, A.H. Bootstrapping Clustered Data. J. R. Stat. Soc. Ser. B Stat. Methodol. 2007, 69, 369–390. [Google Scholar] [CrossRef]
- Zhou, L.; Yi, L.; Yan, L.; Xu, Z. Construction of transparent PAM/PVA interpenetrating network hydrogel for designing fireproof glass with superior heat insulation and aging resistance. J. Mater. Res. Technol. 2023, 27, 3301–3309. [Google Scholar] [CrossRef]
- Wu, D.; Zhou, L.; Yan, L.; Liu, H.; Yi, L. Construction of a Ternary Interpenetrating Polymer Network Hydrogel Strengthening Fire Resistance and Anti-Aging Properties of Grouting Fireproof Glass. J. Appl. Polym. Sci. 2026, 143, e70746. [Google Scholar] [CrossRef]

Table 1.
Full-scale tests included in the primary pane population.
| Test | Partition Height [mm] | Mullion Reinforcement | Full-Size Panes, n | Temperature-Based I Criterion [min] | Integrity tE [min] |
| T1 | 3000 | No | 6 | 48 | 60 |
| T2 | 3000 | Yes | 6 | 41 | 46 |
| T3 | 3600 | Yes | 6 | 47 | 58 |
| T4 | 4477 | Yes | 9 | 50 | 67 |
| T5 | 5250 | Yes | 9 | 37 | 62 |
| T6 | 5954 | Yes | 12 | 50 | 67 |
| T7 | 5954 | No | 12 | 48 | 46 |
Table 2.
Test-wise within-pane thermal dispersion at 30 and 45 min and maximum pane departure above the within-test median at 45 min. The latter is descriptive and is not a regulatory criterion.
Table 2.
Test-wise within-pane thermal dispersion at 30 and 45 min and maximum pane departure above the within-test median at 45 min. The latter is descriptive and is not a regulatory criterion.
| Test | Full-Size Panes, n | IQR at 30 min [K] | IQR at 45 min [K] | Maximum Above Median at 45 min [K] |
| T1 | 6 | 1.59 | 6.34 | 10.40 |
| T2 | 6 | 1.16 | 9.51 | 46.02 |
| T3 | 6 | 2.04 | 1.14 | 23.77 |
| T4 | 9 | 1.45 | 3.65 | 4.95 |
| T5 | 9 | 0.90 | 25.60 | 143.25 |
| T6 | 12 | 1.90 | 4.12 | 31.50 |
| T7 | 12 | 4.21 | 5.20 | 16.77 |
Table 3.
Panes flagged by the original D5 screening rule and their exposure-time context.
| Pane | Original D5 [K] | D5 Interval [min] | Common-Window D5 [K] | Common-Window Extreme? | R140 [min] | Temp.-Based I [min] | tE [min] |
| T5-G6 | 69.15 | 34.25–39.25 | 69.15 | Yes | 8.12 | 37 | 62 |
| T2-G2 | 74.48 | 41.00–46.00 | 74.48 | Yes | 15.23 | 41 | 46 |
| T4-G7 | 116.90 | 55.25–60.25 | 7.75 | No | 20.89 | 50 | 67 |
| T4-G4 | 157.15 | 61.00–66.00 | 6.05 | No | 23.97 | 50 | 67 |
Table 4.
Exploratory expected-minimum illustration under an exchangeable-draw assumption.
| Number of Panes, N | Expected Minimum Centred Margin [min] | 95% Hierarchical-Bootstrap Interval [min] |
| 6 | -5.85 | -9.47 to -2.79 |
| 9 | -7.33 | -11.80 to -3.42 |
| 12 | -8.45 | -13.49 to -3.84 |
| N=6 to N=12 contrast | 2.60 | 0.95 to 4.10 |
Disclaimer/Publisher’s Note: The statements, opinions and data contained in all publications are solely those of the individual author(s) and contributor(s) and not of MDPI and/or the editor(s). MDPI and/or the editor(s) disclaim responsibility for any injury to people or property resulting from any ideas, methods, instructions or products referred to in the content. |
© 2026 by the authors. Licensee MDPI, Basel, Switzerland. This article is an open access article distributed under the terms and conditions of the Creative Commons Attribution (CC BY) license.
Copyright: This open access article is published under a Creative Commons CC BY 4.0 license, which permit the free download, distribution, and reuse, provided that the author and preprint are cited in any reuse.