

Submitted:
30 October 2026
Posted:
03 November 2026
You are already at the latest version
Abstract
Background. Open access (OA) can widen access to research, but its uptake in Africa has rarely been measured across the whole continent and over a long period. Methods. We identified 854,785 articles with at least one African institutional address, indexed in the Web of Science Core Collection and published between 2002 and 2021. We matched each article by DOI to Unpaywall (August 2022) and described OA by year, OA type, region, country, research area, collaboration type and funding. Results. Overall, 44.3% of articles were openly available. The yearly share rose from 16.7% in 2002 to 56.0% in 2020 and 55.0% in 2021, and OA articles have outnumbered closed ones since 2018. Gold OA made up 67.6% of OA articles in 2021. Shares ranged from 61.5% in Eastern Africa to 33.9% in Northern Africa, and from 28.5% (Tunisia) to 78.4% (Gambia) across 54 countries (mean 57.7%, SD 11.2). More than 70% of articles in public health, infectious diseases and tropical medicine were OA, against 25–32% in materials science, engineering, chemistry, computer science and physics. Over the whole period, 50.4% of articles with a co-author outside Africa were OA, against 36.5% of articles from a single African country. Funded articles were more often OA than unfunded ones (56.9% vs 35.5%). Mean citations were higher for OA articles, but this comparison is not adjusted for field or journal. Conclusions. OA is now the majority mode for internationally indexed African research, but the gains are uneven and lean on Gold OA, external funding and international partners. Because Web of Science covers journals published in Africa poorly, these results describe the internationally visible part of African research.
Keywords:
open access
; Africa
; Unpaywall
; web of science
; scientometrics
; research collaboration
; research funding
; article processing charges
1. Introduction
Open access (OA) means that research articles are free to read online, without a subscription. Over the past two decades, OA has moved from a niche practice to a mainstream form of publishing. Using Unpaywall, Piwowar et al. (2018) estimated that at least 28% of the scholarly literature was OA, and that 45% of articles published in 2015 were. The UNESCO Recommendation on Open Science, adopted in 2021, asks member states to make publicly funded research openly available and to reduce inequalities in access to knowledge (UNESCO, 2021).
OA levels differ widely between countries and regions, and the pattern is not a simple one of rich countries leading. In biomedical articles published in 2015, Iyandemye and Thomas (2019) found a negative correlation between a country’s income per person and its OA share, with sub-Saharan Africa showing the highest share of any world region. They also found that articles written across several countries were more often OA than single-country articles (57.2% vs 41.0%). At the level of universities, Robinson-Garcia et al. (2020) reported that 39.1% of African university output from 2014–2017 was OA, below Europe (50.1%) and North America (49.1%). Huang et al. (2020) observed that African universities relied mostly on publisher-based (Gold) OA, while growth in Europe and North America came mostly from repositories, and suggested that donor funders with OA requirements may explain part of the African pattern. Simard et al. (2022) showed that countries differ both in how much OA they produce and in how much they use OA literature.
These estimates depend strongly on the database used. Basson et al. (2022) found that Dimensions indexes a larger share of OA publications than Web of Science, with the largest gap for countries outside North America and Europe. Journals published in sub-Saharan Africa are about four times less likely than European journals to be indexed in Web of Science or Scopus (Asubiaro et al., 2024), and both databases under-represent African and low-income journals more generally (Maddi et al., 2025). Open sources such as OpenAlex cover far more African research: in one comparison, OpenAlex held about three times as many African publications with a DOI as Web of Science (Alonso-Álvarez & van Eck, 2024), and it indexes many Gold and Diamond OA journals that Web of Science and Scopus miss (Simard et al., 2024).
The African publishing context adds specific barriers and opportunities. Article processing charges (APCs) are a major obstacle: at a typical APC of about US$2,600, some African researchers would need to spend close to six months of pre-tax salary to publish one article (Nabyonga-Orem et al., 2020). In a recent survey of 241 researchers in Nigeria, Kenya and South Africa, 78.0% had published OA, but 63.5% said APCs limited their OA publishing (Onaolapo et al., 2026). At the same time, Africa has a large but under-indexed journal sector: Ndege et al. (2025) identified 1,790 journals from 1,169 African publishers, and 35% of the 667 African journals listed in the Directory of Open Access Journals charge no fees (Diamond OA). Most no-fee African journals rely on volunteers and unstable funding, and only about one in ten is indexed in Web of Science (Kuchma & Ševkušić, 2024). Earlier work has also highlighted infrastructure gaps, weak institutional OA policies and the risk that OA reproduces unequal knowledge flows rather than correcting them (Fox & Hanlon, 2015; Mboa Nkoudou, 2020; Okafor et al., 2022; Strydom et al., 2022).
Most studies of OA in Africa so far have focused on single countries, single fields, a few years or a sample of universities. Fewer have followed all African-affiliated articles across disciplines for two decades, or examined how OA relates to collaboration and funding at the level of individual articles. This study addresses that gap. Using 854,785 Web of Science articles with at least one African address, matched to Unpaywall, it asks four questions:
- How has the OA share of African research changed between 2002 and 2021, and through which OA types?
- How does OA differ between African regions, countries and research areas?
- Is OA more common when African authors collaborate with partners in other African countries or outside Africa?
- Is OA more common for funded research, and are OA articles cited more?
2. Data and Methods
2.1. Data Sources
The sample comes from the Web of Science (WoS) Core Collection. We searched for records whose author addresses contained the name of an African country or a major African city, in several languages, for publication years 1975–2021, and exported the full records in 2022. We then checked every address with a Python script, using regular expressions and the dataprep.clean library to standardise country names, and kept only records with at least one institutional address in one of 54 African countries.
OA status comes from Unpaywall, a free database that records whether and where each DOI-registered article can be read for free (Piwowar et al., 2018). We queried the Unpaywall REST API (version 2) for each DOI in August 2022.
2.2. Sample
Table 1 shows how the final sample was built. Records without a DOI were removed because Unpaywall can only be queried by DOI. The analysis starts in 2002 because DOI coverage of earlier records is low.
The share of records not found in Unpaywall ranged from 0.2% to 5.7% per year.
All totals and overall shares in this article use the final sample of 854,785 articles. The year-by-year panels of Figure 1, 2B, 3B–F, 4B, 6B–F and 8D–I, and the yearly values for regions, countries, collaboration types and funding reported with them, were produced from an earlier extract of the same data. That extract is identical to the final sample up to 2018 but lacks 16,084 articles published in 2019–2021, so its OA shares for those years are slightly higher (for example, 58.7% instead of 55.0% in 2021).
2.3. Open Access Status
We used the OA status that Unpaywall assigns to each article. An article is Gold when it is published in a fully OA journal, with or without a publication fee; Hybrid when it is free to read under an open licence in a subscription journal; Bronze when it is free to read on the publisher’s website without an open licence; and Green when it is free to read only in a repository. Articles with none of these are closed. When an article has several free copies, Unpaywall keeps one status, in the order Gold, Hybrid, Bronze, Green. OA status was measured once, in August 2022, so it describes availability at that date and not at publication.
2.4. Countries and Regions
Countries were taken from the institutional addresses of all authors. We grouped the 54 African countries into five regions: Northern (Algeria, Djibouti, Egypt, Libya, Morocco, Tunisia), Eastern (14 countries, including Sudan and South Sudan), Southern (10), Western (16) and Central Africa (8). The full list is in Supplementary Table S1. Countries outside Africa were grouped into World Bank regions. Counting is full: an article with authors in Kenya and Ghana counts once for each country, and once for each of their regions.
2.5. Collaboration Types
Each article was assigned to exactly one collaboration type, based on the countries in its addresses and checked in this order:
- International: at least one address outside Africa.
- Continental: all addresses in Africa, spread over two or more African regions.
- Regional: all addresses in one African region, in two or more countries.
- National: all addresses in one African country. Single-author articles fall in this group.
2.6. Funding
An article was classed as funded when its WoS record listed at least one funding organisation (the Funding Orgs field), and as not funded otherwise. In the final sample, 351,056 articles (41.1%) were funded. WoS began recording funding acknowledgements systematically in 2008, so funding is under-recorded for earlier years.
2.7. Research Areas and Citations
Research areas are the WoS research area categories; an article in several categories counts once in each. Citation counts are the WoS Times Cited, All Databases values at the time of export in 2022. We compared mean citations by OA status within four publication periods (2002–2006, 2007–2011, 2012–2016 and 2017–2021), without normalising for field or journal.
2.8. Analysis
We report counts and shares of OA articles, overall and by OA type, for each year, period, region, country, research area, collaboration type and funding status. To compare groups of the same kind (for example, countries), we also computed z-scores of the OA share: z = (x − mean) / SD, where x is the share of one group and the mean and SD are taken across all groups. We report z-scores only for groupings with many groups, such as countries and research areas. Data were processed in Python 3.8 with pandas; charts were made in Microsoft Excel and Flourish.
3. Results
3.1. OA Grew Steadily and Became the Majority After 2018
Of the 854,785 articles, 378,955 (44.3%) were openly available in August 2022. The number of African-affiliated articles per year grew about tenfold, from 11,101 in 2002 to 112,826 in 2021, and the number of OA articles grew about 33-fold, from 1,852 to 62,043. The yearly OA share rose from 16.7% in 2002 to a peak of 56.0% in 2020, and was 55.0% in 2021 (Figure 1). OA articles first matched closed ones in 2018 (50.0%) and have outnumbered them since.
3.2. Gold OA Drives the Growth
Across the whole period, 212,310 articles were Gold, 75,508 Green, 56,805 Bronze and 34,332 Hybrid (Figure 2A). Gold OA became the main route, rising from 7.8% of OA articles in 2002 to 67.6% in 2021. Bronze, the largest OA type in 2002 (53.7% of OA articles), fell to 8.9%, and Green fell from 31.6% to 13.3%. Hybrid stayed between 6% and 12% throughout (Figure 2B). Part of the high Green share in early years may reflect the longer time older articles had to be deposited in repositories before August 2022.
3.3. OA Differs Strongly Between Regions and Countries
Eastern Africa had the highest OA share (61.5%), followed by Central (52.7%), Western (51.3%) and Southern Africa (50.4%). Northern Africa had the lowest (33.9%) and the most articles (366,934) (Figure 3A). OA grew in every region, mostly through Gold OA, which reached 57.4% of articles in Eastern Africa in 2021 against 36.0% in Northern Africa (Figure 3C). Green OA peaked in the early 2010s and then declined in all regions (Figure 3E). In 2021, Northern Africa had the highest Bronze share (5.9%) and the lowest Hybrid share (2.7%) (Figure 3D and Figure 3F).
Across the 54 countries, the OA share averaged 57.7% (SD 11.2; median 60.0%) and ranged from 28.5% in Tunisia to 78.4% in Gambia (Figure 4A). Countries with very small outputs should be read with care: Equatorial Guinea (108 articles), Comoros (146) and São Tomé and Príncipe (81) are among the extremes. Among the largest producers, Kenya (62.2% of 33,722 articles) was well above the mean, while South Africa (49.4% of 242,100), Nigeria (47.4% of 65,380), Egypt (36.0% of 194,450), Algeria (30.8% of 54,164) and Tunisia (28.5% of 71,400) were below it. OA rose in every country, with the steepest gains in 2017–2021 (Figure 4B). In that last period most countries were above 50%, but Algeria (36.3%), Tunisia (37.3%), Mauritius (42.0%), Egypt (44.9%) and Morocco (46.3%) remained below. Figure 4C maps how far each country sits from the African mean.
3.4. Health Research is the Most Open, Physical Sciences and Engineering the Least
More than 70% of articles were OA in public health, infectious diseases, general medicine, microbiology, tropical medicine and health care sciences. The highest shares were in astronomy and astrophysics (81.1%), health care sciences (77.4%) and infectious diseases (77.3%). Among large fields, shares were lowest in materials science (25.5%), engineering (26.9%), chemistry (27.3%), computer science (30.0%) and physics (31.5%), and below 11% in several arts and humanities fields with small outputs (Figure 5; Supplementary Table S2). Gold OA was most common in parasitology (60.6%), general and internal medicine (55.4%), health care sciences (50.8%) and tropical medicine (50.4%). Green OA was relatively common in immunology (16.8%), microbiology (14.7%), physics (12.6%) and mathematics (10.3%), and Hybrid in plant sciences (20.8%).
3.5. Collaboration Beyond Africa Goes with More OA
International collaboration was the most common type (466,602 articles), followed by national (368,194), continental (12,350) and regional (7,639). Over the whole period, 50.4% of international articles were OA, against 47.1% of continental, 43.6% of regional and 36.5% of national articles. In 2021, the shares were 63.0% (international), 56.7% (regional), 55.1% (continental) and 52.5% (national) (Figure 6B). Gold OA rose from under 5% in 2002 to 40–45% in 2021 for every type (Figure 6C). Hybrid (7.8% in 2021) and Green OA (9.9%) were higher in international articles than in the other types (Figure 6D and Figure 6E), while Bronze declined everywhere (Figure 6F).
Among partner regions, Europe and Central Asia (278,520 articles) and North America (138,801) were the largest. The highest OA shares were found with partners in Latin America and the Caribbean (67.3%) and North America (61.0%), followed by South Asia (54.1%), East Asia and the Pacific (54.0%) and Europe and Central Asia (53.5%). Articles with partners in the Middle East outside Africa had the lowest share (44.8%) (Figure 7).
3.6. Funded Research is More Often OA
Of the 351,056 funded articles, 56.9% were OA, against 35.5% of the 503,729 unfunded articles. Funded articles had higher shares of Gold (30.8% vs 20.7%), Green (13.1% vs 5.9%) and Hybrid OA (6.2% vs 2.5%), while Bronze shares were similar (6.8% vs 6.6%) (Figure 8A–C). The gap in Gold OA stayed stable over time, the Green gap narrowed, and the Hybrid gap widened. Since 2018, Bronze OA has been slightly more common among unfunded articles (Figure 8D–I).
3.7. OA Articles Have Higher Mean Citations
In every period, OA articles had higher mean citations than closed ones: 46.1 vs 29.3 for articles published in 2002–2006, 36.7 vs 23.3 in 2007–2011, 21.7 vs 14.8 in 2012–2016 and 5.6 vs 4.9 in 2017–2021 (Figure 9A). Medians showed the same direction (for example, 23 vs 14 in 2002–2006). Among OA types, Green articles had the highest means for older articles and Hybrid articles for recent ones (Figure 9B). These comparisons are not adjusted for research area, journal or other differences between OA and closed articles.
4. Discussion
4.1. Main Findings in Context
Between 2002 and 2021, OA became the majority mode of publication for African research indexed in Web of Science. The growth was driven by Gold OA and was strongest in Eastern Africa, in health research, in international collaborations and in funded work. Northern Africa, the physical sciences and engineering, and unfunded national research lagged behind.
These results agree with earlier work in several ways. Like Iyandemye and Thomas (2019), we find high OA shares in sub-Saharan Africa and higher OA in articles written across countries. Across the whole period, the gap between international and national articles in our data (50.4% vs 36.5%) is similar in size to the gap they reported for multi-country and single-country biomedical articles in 2015 (57.2% vs 41.0%). Like Huang et al. (2020), we find that African OA relies mainly on Gold OA rather than on repositories. Our overall rate of 44.3% is higher than the 39.1% that Robinson-Garcia et al. (2020) reported for African universities in 2014–2017, but the two studies cover different sets of institutions and years, and our share for those years (45.8% in 2015, 48.7% in 2017) is in a similar range.
The low OA level in Northern Africa stands out. It matches the low share Iyandemye and Thomas (2019) found for the Middle East and North Africa region, and the low share of Cairo University’s output in Robinson-Garcia et al. (2020). Northern Africa also produced the most articles (366,934). If its output leans towards fields with low OA shares, such as chemistry and engineering, part of the regional gap would reflect research profiles rather than OA practices. We did not test this; a model that adjusts for field would be needed to separate the two.
4.2. Why Gold, Funding and Partners Matter
The dominance of Gold OA, and its link with funding and international partners, fits the cost structure of OA publishing. Gold and Hybrid OA usually require APCs, which are high relative to African research budgets and salaries (Nabyonga-Orem et al., 2020; Onaolapo et al., 2026). Funded articles in our sample had much higher Gold and Hybrid shares than unfunded ones, which suggests that grants, often from external funders with OA requirements, pay for a large part of African OA. International partners may also bring access to institutional APC budgets, transformative agreements and repository support that many African institutions lack. The higher Green share among funded and international articles points the same way.
This dependence has a cost. If OA in Africa grows mainly through externally funded APCs, researchers without such funding, often those publishing nationally, are left with fewer options. Two lower-cost routes deserve more attention. Diamond OA journals, which charge no fees, already make up a third of African journals in the Directory of Open Access Journals (Ndege et al., 2025), but they run on fragile funding and are rarely indexed in Web of Science (Kuchma & Ševkušić, 2024). Repositories (Green OA) can make articles open at no cost to authors, yet the Green share of African OA fell over the period. Stronger national and institutional repository policies, and support for Diamond journals, would broaden OA beyond funded and internationally co-authored work.
4.3. Citations
OA articles had higher mean citations in every period. This is consistent with many earlier studies, but it should not be read as proof that OA causes more citations. A systematic review of 134 studies found that about half reported a citation advantage, a quarter found none and a quarter found one only in some subsets, with few studies at low risk of bias (Langham-Putrow et al., 2021). In our data, OA articles are more often funded, international and in health fields, all of which can raise citations on their own. A field- and journal-normalised comparison is needed before drawing conclusions.
4.4. Limitations
This study has five main limitations. First, Web of Science covers journals published in Africa poorly (Asubiaro et al., 2024; Maddi et al., 2025), and many African journals have no DOI. Our sample therefore describes the internationally indexed part of African research, which is likely to be more often published in international, APC-based journals; OA through African Diamond journals is under-counted. Second, OA status was measured once, in August 2022. Older articles had more time to become openly available, which can inflate Green OA in early years, while recent articles may still have been under embargo. Third, Unpaywall changed its classification code in May 2025, and about 10% of works changed OA status as a result (OpenAlex, 2025); a new query would not reproduce our values exactly. Fourth, countries, regions and research areas are counted in full, so their totals exceed the number of articles. Fifth, all comparisons are descriptive. They show associations, not causes, and do not adjust for field, journal or other factors.
4.5. Future Work
Three extensions would strengthen these findings. The first is to re-measure the same DOIs today and track which articles became open after 2022, separating new open copies from changes due to Unpaywall’s reclassification. The second is to rebuild the sample in OpenAlex, which covers far more African publications (Alonso-Álvarez & van Eck, 2024), and compare it with the Web of Science sample. The third is to model OA as a function of year, field, country, collaboration, funding and journal type together, to estimate which factors matter most once the others are held constant.
5. Conclusion
Over two decades, open access has become the main way that internationally indexed African research reaches readers: more than half of the articles published in 2020 and 2021 were free to read. This progress is real but uneven. It is concentrated in Eastern Africa, in health research, and in articles that are funded or written with partners outside Africa, and it relies heavily on Gold OA and the fees that come with it. Northern Africa, the physical sciences and engineering, and unfunded national research remain far behind.
For OA to serve all African researchers, policy should not depend only on external grants and APCs. National and institutional OA policies, well-supported repositories, and sustainable funding for African Diamond journals offer routes that do not require authors to pay. Better data are also needed: open, inclusive sources such as OpenAlex and African indexes such as AJOL would give a fuller picture than Web of Science alone, and repeated measurements would show how quickly African research becomes open over time.
Supplementary Materials
The supplementary information can be downloaded at the website of this paper posted on Preprints.org
Author Contributions
Maxime Descartes Mbogning Fonkou: Conceptualization, Data curation, Formal analysis, Investigation, Methodology, Software, Visualization, Writing – original draft, Writing – review and editing.
Funding
This research received no specific grant from any funding agency in the public, commercial or not-for-profit sectors.
Data Availability Statement
The code used for data collection and analysis, the aggregate tables behind every figure, and the figures are available at github.com/descartesmbogning/open-access-africa-2002-2021. Raw Web of Science records cannot be shared under the Clarivate licence; the repository describes how to rebuild the sample. Unpaywall data are openly available under a CC0 licence.
Acknowledgments
The author thanks Prof. Jude Kong for his comments on an earlier draft of this manuscript, and Gustave Roussy (Villejuif, France), whose library subscription gave access to the Web of Science records used in this study.
Conflicts of Interest
The author declares no competing interests.
Preprint version
This preprint has not been peer reviewed.
Use of generative AI
In October 2026, the author used Claude (Anthropic), a large language model, to: check the definitions and figures reported in the manuscript against the original analysis notebooks; restructure, rewrite and edit the text for clarity; and organise the code repository. The study design, data collection and all analyses were carried out by the author in 2022–2023 without AI tools. No data, results or figures were generated by AI. The author reviewed and verified all text, numbers and references, and takes full responsibility for the content of this article.
References
- Alonso-Álvarez, P.; van Eck, N. J. Coverage and metadata completeness and accuracy of African research publications in OpenAlex: A comparative analysis. arXiv 2024, arXiv:2409.01120. [Google Scholar]
- Asubiaro, T.; Onaolapo, S.; Mills, D. Regional disparities in Web of Science and Scopus journal coverage. Scientometrics 2024, 129(3), 1469–1491. [Google Scholar] [CrossRef]
- Basson, I.; Simard, M.-A.; Ouangré, Z. A.; Sugimoto, C. R.; Larivière, V. The effect of data sources on the measurement of open access: A comparison of Dimensions and the Web of Science. PLOS ONE 2022, 17(3), e0265545. [Google Scholar] [CrossRef] [PubMed]
- Fox, M.; Hanlon, S. M. Barriers to open access uptake for researchers in Africa. Online Information Review 2015, 39(5), 698–716. [Google Scholar] [CrossRef]
- Huang, C.-K.; Neylon, C.; Hosking, R.; Montgomery, L.; Wilson, K. S.; Ozaygen, A.; Brookes-Kenworthy, C. Evaluating the impact of open access policies on research institutions. eLife 2020, 9, e57067. [Google Scholar] [CrossRef] [PubMed]
- Iyandemye, J.; Thomas, M. P. Low income countries have the highest percentages of open access publication: A systematic computational analysis of the biomedical literature. PLOS ONE 2019, 14(7), e0220229. [Google Scholar] [CrossRef] [PubMed]
- Kuchma, I.; Ševkušić, M. Landscape of no-fee open access publishing in Africa; EIFL, 2024. [Google Scholar] [CrossRef]
- Langham-Putrow, A.; Bakker, C.; Riegelman, A. Is the open access citation advantage real? A systematic review of the citation of open access and subscription-based articles. PLOS ONE 2021, 16(6), e0253129. [Google Scholar] [CrossRef] [PubMed]
- Maddi, A.; Maisonobe, M.; Boukacem-Zeghmouri, C. Geographical and disciplinary coverage of open access journals: OpenAlex, Scopus, and WoS. PLOS ONE 2025, 20(4), e0320347. [Google Scholar] [CrossRef] [PubMed]
- Mboa Nkoudou, T. H. Epistemic alienation in African scholarly communications: Open access as a pharmakon. In Reassembling scholarly communications: Histories, infrastructures, and global politics of open access; Eve, M. P., Gray, J., Eds.; MIT Press, 2020. [Google Scholar] [CrossRef]
- Nabyonga-Orem, J.; Asamani, J. A.; Nyirenda, T.; Abimbola, S. Article processing charges are stalling the progress of African researchers: A call for urgent reforms. BMJ Global Health 2020, 5(9), e003650. [Google Scholar] [CrossRef] [PubMed]
- Ndege, N.; Irfanullah, H. M.; Harle, J.; Drake, T.; Maddi, A.; Ma, L.; Laakso, M. Africa’s research publishing landscape: Examining journals, publishers, and the infrastructure behind them. Open Research Africa 2025. [Google Scholar] [CrossRef] [PubMed]
- Okafor, I. A.; Mbagwu, S. I.; Chia, T.; Hasim, Z.; Udokanma, E. E.; Chandran, K. Institutionalizing open science in Africa: Limitations and prospects. Frontiers in Research Metrics and Analytics 2022, 7, 855198. [Google Scholar] [CrossRef] [PubMed]
- Onaolapo, S.; Ayeni, P.; Mncube, S. Open access publishing in an African context: Notable improvements and recurring challenges. IFLA Journal 2026, 52(2), 317–331. [Google Scholar] [CrossRef]
- OpenAlex. Major update to Unpaywall database; OpenAlex Blog, 29 July 2025; Available online: https://blog.openalex.org/major-update-to-unpaywall-database.
- Piwowar, H.; Priem, J.; Larivière, V.; Alperin, J. P.; Matthias, L.; Norlander, B.; Farley, A.; West, J.; Haustein, S. The state of OA: A large-scale analysis of the prevalence and impact of open access articles. PeerJ 2018, 6, e4375. [Google Scholar] [CrossRef] [PubMed]
- Robinson-Garcia, N.; Costas, R.; van Leeuwen, T. N. Open access uptake by universities worldwide. PeerJ 2020, 8, e9410. [Google Scholar] [CrossRef] [PubMed]
- Simard, M.-A.; Basson, I.; Hare, M.; Larivière, V.; Mongeon, P. The open access coverage of OpenAlex, Scopus and Web of Science. arXiv 2024, arXiv:2404.01985. [Google Scholar]
- Simard, M.-A.; Ghiasi, G.; Mongeon, P.; Larivière, V. National differences in dissemination and use of open access literature. PLOS ONE 2022, 17(8), e0272730. [Google Scholar] [CrossRef] [PubMed]
- Strydom, A.; Mellet, J.; Van Rensburg, J.; Viljoen, I.; Athanasiadis, A.; Pepper, M. S. Open access and its potential impact on public health – A South African perspective. Frontiers in Research Metrics and Analytics 7 2022, 975109. [Google Scholar] [CrossRef] [PubMed]
- UNESCO. UNESCO Recommendation on Open Science; United Nations Educational, Scientific and Cultural Organization, 2021. [Google Scholar] [CrossRef]
Figure 1.
Number and share of open access articles by publication year, 2002–2021. Bars show the number of OA (blue) and closed (grey) articles; lines show their shares (right axis).
Figure 1.
Number and share of open access articles by publication year, 2002–2021. Bars show the number of OA (blue) and closed (grey) articles; lines show their shares (right axis).
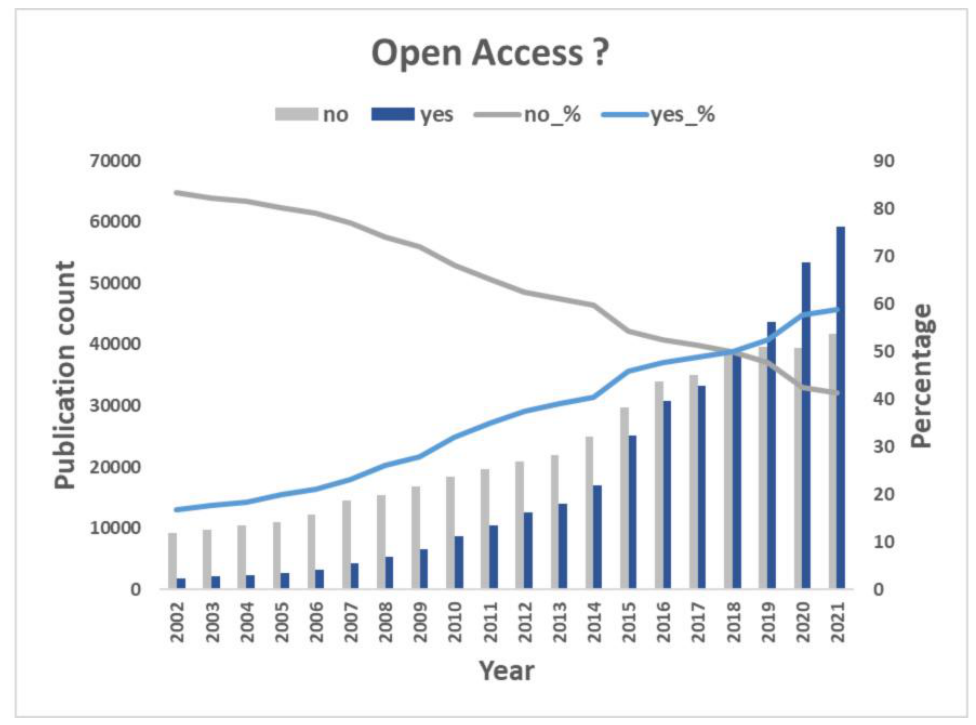
Figure 2.
Open access types, 2002–2021. (A) Number of articles by OA status over the whole period. (B) Share of each OA type among OA articles, by publication year.
Figure 2.
Open access types, 2002–2021. (A) Number of articles by OA status over the whole period. (B) Share of each OA type among OA articles, by publication year.
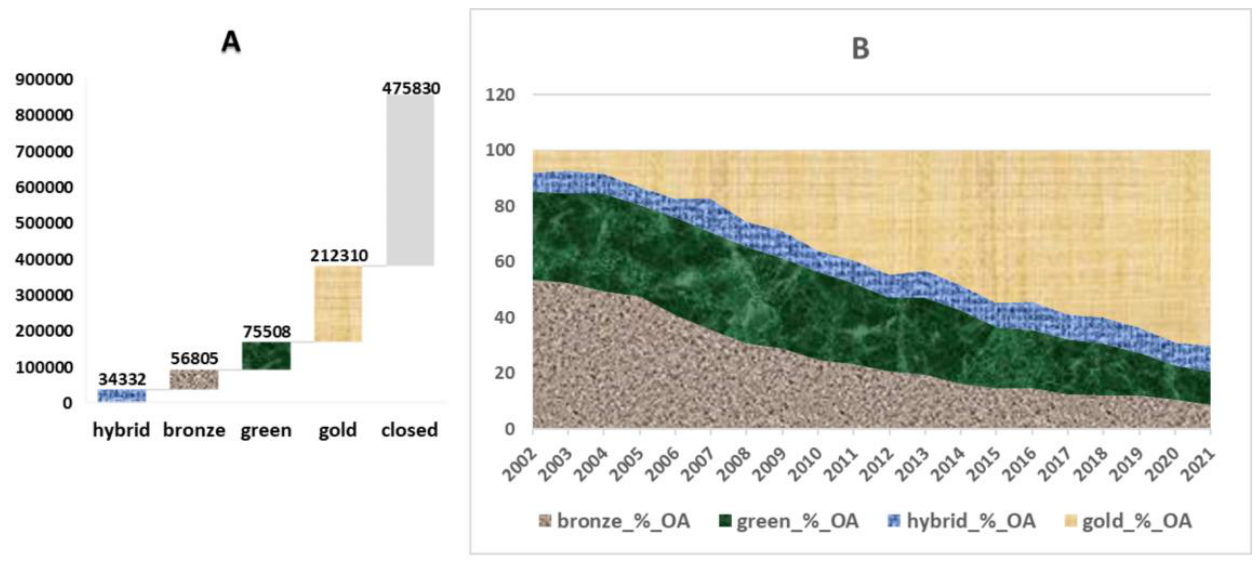
Figure 3.
Open access by African region, 2002–2021. (A) Share of articles by OA type in each region over the whole period. (B) Share of OA articles by year. (C–F) Share of Gold (C), Hybrid (D), Green (E) and Bronze (F) OA by year; labels give the 2021 values.
Figure 3.
Open access by African region, 2002–2021. (A) Share of articles by OA type in each region over the whole period. (B) Share of OA articles by year. (C–F) Share of Gold (C), Hybrid (D), Green (E) and Bronze (F) OA by year; labels give the 2021 values.
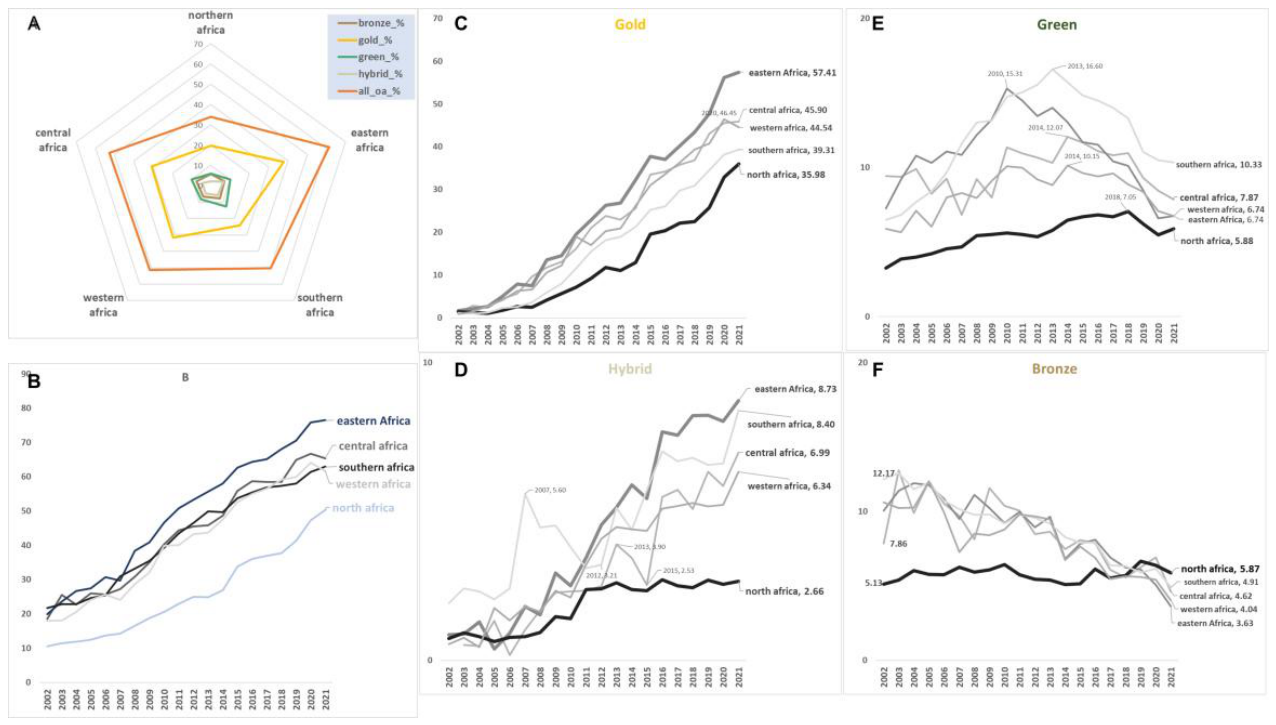
Figure 4.
Open access by African country, 2002–2021. (A) Share of each country’s articles that were OA, overall (blue) and by OA type; numbers in brackets are counts of OA articles; the dashed line marks 50%. (B) Overall OA share by publication period. (C) z-score of each country’s overall OA share against the mean of African countries; blue is above the mean, orange below. Countries are counted in full.
Figure 4.
Open access by African country, 2002–2021. (A) Share of each country’s articles that were OA, overall (blue) and by OA type; numbers in brackets are counts of OA articles; the dashed line marks 50%. (B) Overall OA share by publication period. (C) z-score of each country’s overall OA share against the mean of African countries; blue is above the mean, orange below. Countries are counted in full.
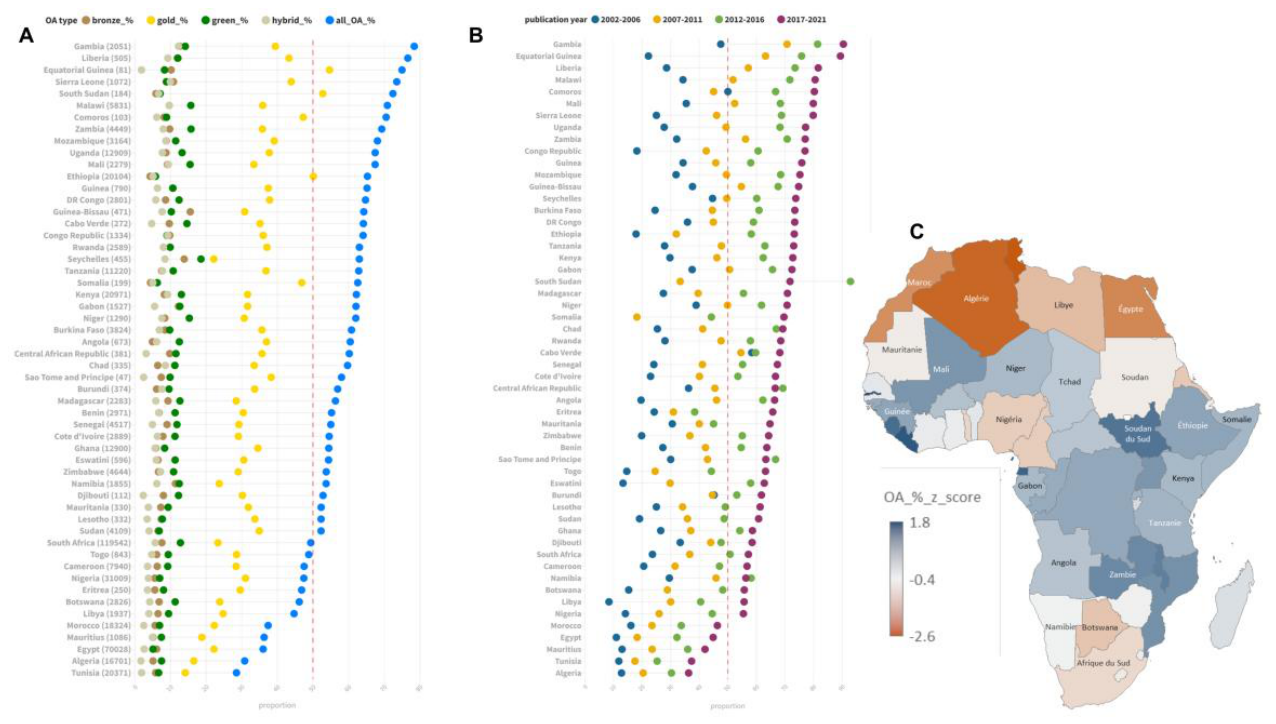
Figure 5.
Open access by research area, 2002–2021. (A) Share of articles by OA status in the largest WoS research areas, sorted by number of articles. (B) Number of articles in each research area, by OA status.
Figure 5.
Open access by research area, 2002–2021. (A) Share of articles by OA status in the largest WoS research areas, sorted by number of articles. (B) Number of articles in each research area, by OA status.
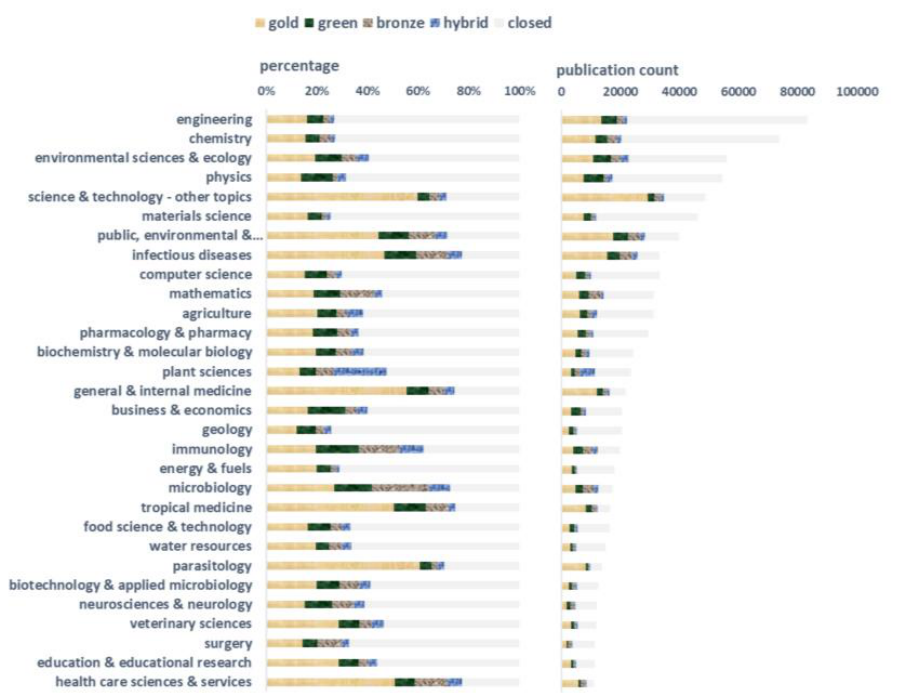
Figure 6.
Open access by collaboration type, 2002–2021. (A) Share of articles by OA type for each collaboration type over the whole period. (B) Share of OA articles by year. (C–F) Share of Gold (C), Hybrid (D), Green (E) and Bronze (F) OA by year; labels give the 2021 values.
Figure 6.
Open access by collaboration type, 2002–2021. (A) Share of articles by OA type for each collaboration type over the whole period. (B) Share of OA articles by year. (C–F) Share of Gold (C), Hybrid (D), Green (E) and Bronze (F) OA by year; labels give the 2021 values.
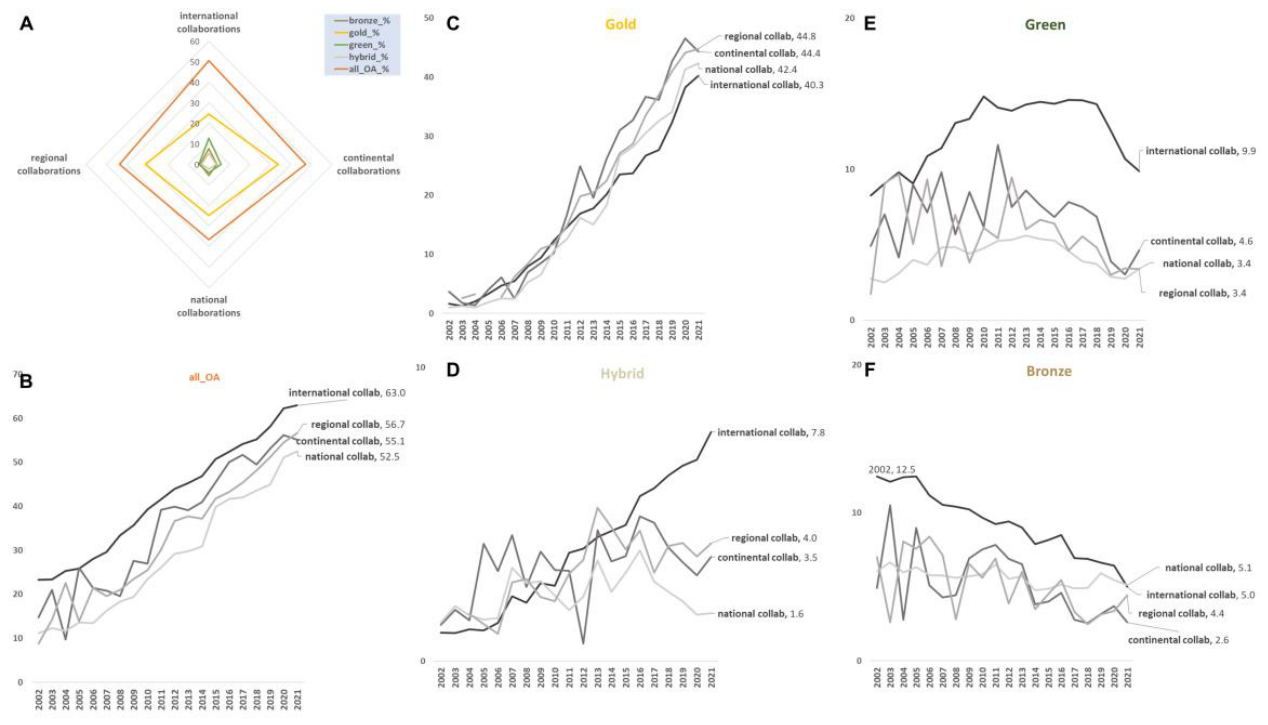
Figure 7.
Open access of articles with co-authors outside Africa, by partner region (World Bank regions), 2002–2021. (A) Share of articles by OA status; numbers in brackets are counts of OA articles. (B) Share of OA articles by publication period. An article with partners in several regions counts once for each.
Figure 7.
Open access of articles with co-authors outside Africa, by partner region (World Bank regions), 2002–2021. (A) Share of articles by OA status; numbers in brackets are counts of OA articles. (B) Share of OA articles by publication period. An article with partners in several regions counts once for each.
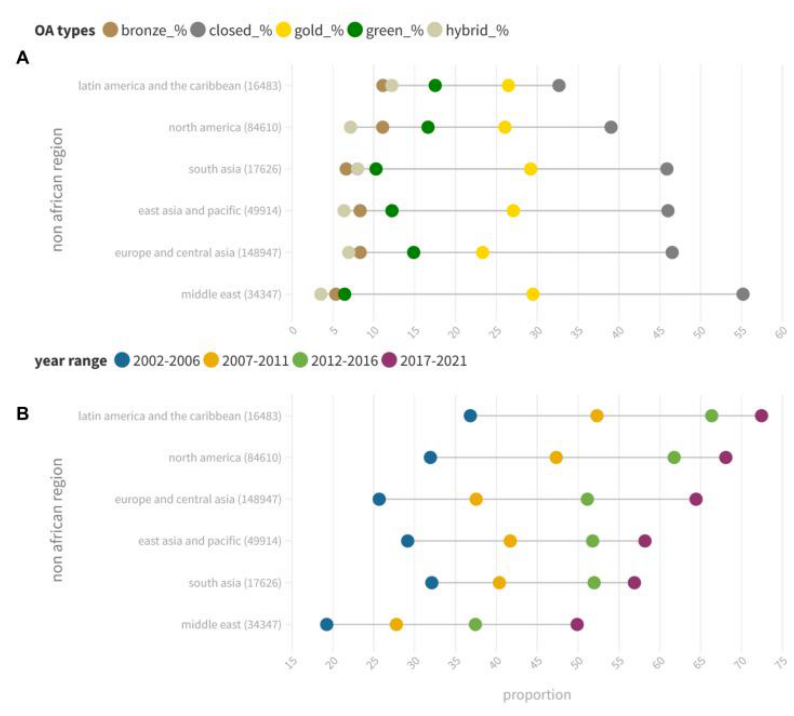
Figure 8.
Open access by funding status, 2002–2021. (A) Share of funded and unfunded articles by OA status. (B) Number of articles by OA status. (C) Share by OA status. (D–I) Share of OA (D), Gold (E), Green (F), closed (G), Hybrid (H) and Bronze (I) articles by year, for funded (green) and unfunded (orange) articles.
Figure 8.
Open access by funding status, 2002–2021. (A) Share of funded and unfunded articles by OA status. (B) Number of articles by OA status. (C) Share by OA status. (D–I) Share of OA (D), Gold (E), Green (F), closed (G), Hybrid (H) and Bronze (I) articles by year, for funded (green) and unfunded (orange) articles.
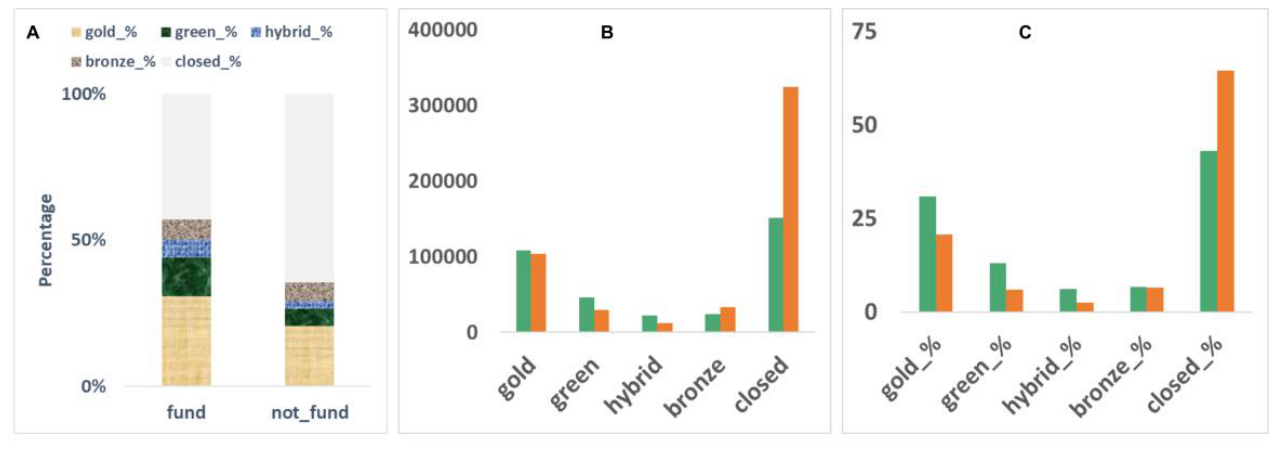
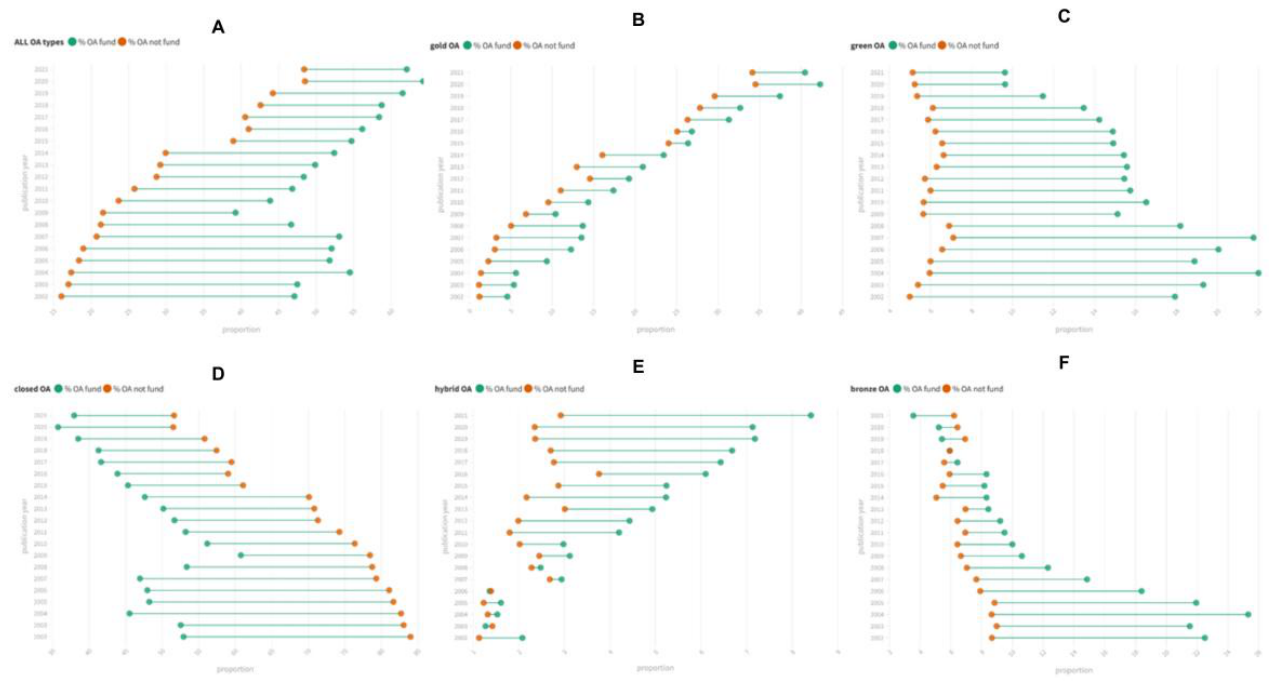
Figure 9.
Mean citations by open access status and publication period. (A) OA vs closed articles. (B) By OA type.
Figure 9.
Mean citations by open access status and publication period. (A) OA vs closed articles. (B) By OA type.
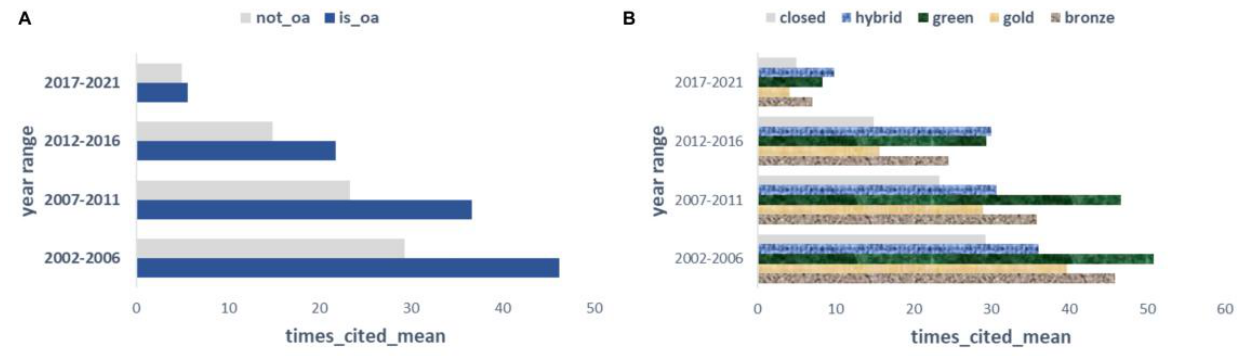

Table 1.
Construction of the sample.
| Step | Records | Removed |
| WoS records matching African country or city names, 1975–2021 | 1,416,524 | |
| At least one African institutional address, after checking | 1,269,130 | 147,394 |
| With a DOI | 978,142 | 290,988 without DOI |
| Published 2002–2021 | 881,625 | 96,517 outside the period |
| With an OA status in Unpaywall (final sample) | 854,785 | 26,840 not found |
Disclaimer/Publisher’s Note: The statements, opinions and data contained in all publications are solely those of the individual author(s) and contributor(s) and not of MDPI and/or the editor(s). MDPI and/or the editor(s) disclaim responsibility for any injury to people or property resulting from any ideas, methods, instructions or products referred to in the content. |
© 2026 by the authors. Licensee MDPI, Basel, Switzerland. This article is an open access article distributed under the terms and conditions of the Creative Commons Attribution (CC BY) license (http://creativecommons.org/licenses/by/4.0/).
Copyright: This open access article is published under a Creative Commons CC BY 4.0 license, which permit the free download, distribution, and reuse, provided that the author and preprint are cited in any reuse.