
Submitted:
30 October 2026
Posted:
03 November 2026
You are already at the latest version
Abstract
Few economic sectors are as exposed to climate variability and change as agriculture, and global food demand is still rising. Assessing agricultural climate risk is challenging because studies examine different impacts across spatial and temporal scales, limiting direct comparison. This integrative review organizes the literature around that problem in five domains. Climate risk arises when a physical hazard acts on exposed and vulnerable farms, crops, or people. It is not the same as the hazard itself, the realized impact, or resilience. Assessment methods range from crop models, statistical and threshold-based approaches, and spatial maps to surveys and financial metrics, and they are applied from the household to the continental scale under observed or future climatic conditions. Impacts extend from yield and livestock losses to lower farm income, weaker credit quality, and reduced food access, and they include compound heat–drought and flood sequences. Farmers’ decisions depend on risk perception, risk tolerance, and access to labor, finance, water, and information. Responses include agronomic adjustments, climate-smart practices, insurance, credit, and, when incremental measures prove insufficient, broader changes to production systems. Whether these responses can be scaled up depends on policy, public capacity, climate services, and spatial targeting. Rather than pooling heterogeneous effect sizes or ranking practices globally, this review identifies differences in empirical metrics and bottlenecks that constrain farm-level implementation.
Keywords:
climate change adaptation
; food security
; climate-smart agriculture
; risk assessment
1. Introduction
There are nearly 570 million farms worldwide, most of them smaller than two hectares, and together they supply a substantial share of global food production [1]. Farming is closely tied to the weather, and climate variability remains the main source of year-to-year fluctuations in agricultural production across many regions [2]. Meanwhile, population growth and changing diets are expected to keep pushing food demand upward, possibly requiring global agricultural production to rise by about 60 percent by 2050 [3], while some demand scenarios suggest that output may eventually need to double [2]. This growth will have to be achieved under climatic conditions that can themselves limit production [2,3,4].
The effects of this exposure can already be seen in agricultural production, farm income, and food security. In Europe, crop-production risk is already substantial and can become critical in southern regions during drought and heat years, while simulated staple-crop yields can decline sharply in the absence of adaptation. Assessments that account for observed producer adaptation continue to report substantial residual losses in global staple supply [4,5,6]. Delayed rainfall can also extend the hungry season, drought can reduce livestock herds and farm income, and crop failures can increase default risk for agricultural lenders [1,7,8].
As Garry et al. point out, agricultural climate risk is not the same as the climatic hazard, because it combines the hazard with a sector’s exposure and vulnerability to it [9]. It is also distinct from realized impact and from farm resilience, both of which are defined in Section 2.1. Technical estimates of yield or revenue therefore need to be read alongside how farmers perceive risk, which adaptation options they can realistically use, and which public rules, services, and maps enable or constrain those changes [10,11].
Agricultural climate risk is thus evaluated against objects and time horizons that are not interchangeable, which makes a coherent overview of the evidence both difficult and necessary. This review tackles the problem by organizing current knowledge into five linked domains: conceptualization and assessment, physical and socioeconomic impacts, farmer perceptions and adaptation choices, risk-management strategies, and the institutional conditions required to strengthen resilience. Sources were identified through iterative reading, citation chaining, and targeted retrieval across these domains, focusing on peer-reviewed studies and institutional reports where agricultural systems or food production were primary endpoints. The review does not follow a PRISMA protocol, nor does it pool fundamentally different metrics or rank practices globally. It takes a thematic, integrative approach instead, showing why empirical endpoints diverge and where institutional bottlenecks constrain farm-level implementation. The conceptual structure of the review is summarized in Figure 1.
2. Conceptualization and Assessment of Agricultural Climate Risk
This section first defines the risk construct introduced in Section 1 and the objects it applies to. It then turns to the time scales of assessment and, finally, to the data and methods that these choices require.
2.1. Conceptual Foundations
In the operational assessment of Garry et al., the hazard was represented through temperature and humidity, vulnerability through threshold exceedance, and exposure through livestock numbers or crop area [9]. The sector at risk is not limited to field crops. It also includes livestock, farm economic performance, farm households, national food supply, and, downstream, agricultural credit [1,6,7,8,9].
Realized impact is the change in a valued outcome, such as yield, livestock performance, or farm income, once hazard, exposure, and vulnerability combine [4,9]. Farm resilience is related but distinct. It is the ability of a farm system to recover, reorganize, and evolve after external stress, and it is judged by whether performance is maintained, how much it varies, and whether a critical threshold is crossed after which recovery remains incomplete [1].
Dong et al. proposed a compact formulation in which risk is the degree of loss multiplied by its probability, with loss often measured as the amplitude of yield change [12]. This product cannot be calculated, however, until the harm object is defined, and assessments disagree on what counts as the loss. In the studies reviewed here, the objects include harvest timing, farm economic performance, livestock numbers, and continental production classes [1,6,8,9]. For example, delayed monsoon onset has been used as a threshold for a national staple economy [8]. The definitions share the logic of hazard, exposure, vulnerability, and loss, but they do not share a metric. The time scale, data, and method therefore have to match the object. This relationship between hazard, exposure, vulnerability, and loss is illustrated in Figure 2.
2.2. Temporal Dimensions
A description of hazard, exposure, and vulnerability is incomplete without the assessment time scale, because the same farm faces agricultural climate risk on two distinct assessment horizons, and results that silently mix the two cannot be compared [2,10].
The near horizon is climate variability: the season-to-season swings in rainfall, temperature, and extremes that producers already live with and that disaster risk management is meant to handle [2,10]. The far horizon is climate change: shifts over the coming decades in mean conditions and in the frequency and severity of extremes, which climate-change adaptation addresses through longer-term changes in production systems [2,10]. The temporal horizon is therefore part of how an assessment is defined, not just a matter of which climate dataset is used. For this reason, the following subsections separate surveys of present conditions from projections under future scenarios, and Section 6 examines how the two horizons are divided between disaster-risk and adaptation agencies. The two horizons are contrasted in Figure 3.
2.3. Data Requirements and Scales of Assessment
Because the objects of risk include crops, livestock, land, and people, a meteorological time series alone is not enough. Biophysical studies need consistent climate, crop, soil, and management data, but large-scale, high-resolution versions of these data vary in availability and quality from region to region, and in low-input cropping systems, uncertainty in soil data can exceed the climate signal in yield projections [4]. Large-scale yield projections are further hampered by a lack of high-resolution, cultivar-specific, and management data [4]. When the object is a household or a social group, the data needed are socioeconomic, including perceived risk, labor, credit, and market access, as well as barriers that fall more heavily on female cultivators [13,14]. The spatial grain follows from the same choice of object, ranging from livestock numbers or crop area, through district revenue, to continental production classes [6,9,15]. Results can therefore be compared only when the data and the spatial unit match the harm object.
2.4. Assessment and Modeling Methods
How risk is measured depends on the harm object and time scale chosen. Process-based crop models use weather, soil, and management data to simulate growth under warmer, wetter, or drier conditions [4,16,17,18]. Statistical yield–weather models relate observed district harvests to temperature and precipitation. When driven by large climate ensembles, they represent internal variability as many weather realizations and a yield distribution rather than as a single mean path [15]. Statistical crop models project climate-induced yield changes from historical yield–climate relationships and can be coupled with economy-wide models to trace welfare and price effects [19]. Reduced-form crop emulators built on econometric fixed-effects models can closely mimic biophysical crop models and allow rapid, spatially explicit probabilistic assessments of yield impacts and user-defined risk metrics [20].
Threshold-based assessments estimate the probability of crossing an agronomic or economic threshold rather than a continuous mean yield. The threshold may be a harvest-timing rule, a heat-humidity limit for livestock, a disease-occurrence threshold, a frost event during bloom, or a tail of income loss [8,9,21,22,23]. Agroclimatic indices such as growing degree days, heat stress indices, and frost parameters, including frost days, the last spring and first autumn frost dates, and the frost-free period, translate daily temperature series into crop-relevant threshold exceedances on high-resolution grids [24,25,26]. Frequency and volatility indices show how often production changes of a given size can be expected, including in rainfed systems [12,27]. Where local crop simulation modeling is unavailable, an expert-based risk matrix can be used to assess impacts, adaptation, risk, and vulnerability [28]. Spatial maps and machine-learning rankings identify where climatic stress coincides with agricultural exposure or social vulnerability [14,29,30,31,32,33,34]. Crop-specific suitability models aggregate scored climatic and geomorphological layers, or combine ensemble species distribution modeling with seasonal low-temperature exposure, to identify where crop requirements are met, whereas recurrence-based risk mapping records how often adverse agroclimatic thresholds are exceeded [35,36,37,38]. Suitability and risk are therefore different harm objects: in Greek olive groves, areas that are climatically well suited can also face a frequent recurrence of adverse conditions [38]. Where the object is the farm household, surveys record perceived risk and reported practices. When the object is a financial claim, the outcome is measured as income-at-risk, loan recoverability, or the result of a stochastic program over water and energy [7,21,39]. Decision software can translate seasonal climate-forecast probabilities into crop-management options for the coming season [40]. Overall, each method’s results are comparable only for the harm object it was designed to quantify (Table 1).
2.5. Future Scenarios and Uncertainty
The two time scales give rise to two kinds of measurement. Some assessments describe observed or current conditions, while others project a future climate by combining a historical baseline with scenario families, sometimes using climate-model ensembles, and with or without adaptation [4,5,15,16,41,42,43,44]. For example, frost indicators for south-eastern Europe have been projected across successive 30-year horizons under a single emissions scenario, indicating fewer frost days and a longer frost-free period [25]. Studies express uncertainty as discrete scenarios or as probabilities, or they leave it unstated. These designs are not interchangeable: a no-adaptation yield projection cannot be subtracted from an empirically adapted staple-production path as if they shared a common residual [4,5,45]. Farm surveys mostly capture recent extremes and current beliefs, which fits the near horizon of variability [13,46]. Reduced-form emulators can produce probabilistic crop-impact metrics under the same pathways [20].
3. Physical, Economic and Food-Security Impacts
Agricultural climate risk is realized along a causal chain: climate drivers alter crop growth and the resource base, biophysical changes reduce production, production and productivity shocks lower agricultural credit quality, and reduced supply and access to staples weaken food security and livelihoods [4,7,8]. Physical, economic, and food-security effects therefore travel along the same chain rather than arising as separate outcomes. This chain is illustrated in Figure 4.
3.1. Biophysical Pathways
Climate change damages agricultural production through several physical pathways, including heat, water deficit and excess, soil-related stress such as salinity intrusion and constrained soil water supply, and living organisms including pests, invasive plants, and heat and feed stress on livestock [4,9,47,48,49]. These pathways do not act in isolation. Heat shortens crop-growing periods by accelerating development, increases crop water demand, and injures plants and animals. Both drought and intense rainfall reduce output, and the combined effect of heat and drought exceeds that of either stress alone [4,9]. According to the IPCC, human-induced warming since 1961 has already slowed agricultural total factor productivity growth by about 21% [45]. European ratings already classify crop-production risk as substantial overall and critical in southern regions during drought and heat years [6]. In the synthesis of Rezaei et al. for wheat, maize, millet, sorghum, and rice, simulated yield losses under the most severe climate-change scenario and without adaptation range from about 7% to 23% across these cereals [4].
Scarce irrigation water, salinity, and river flows that no longer match the growing season limit production even where rainfall is not the only water source. They can also close a double-cropping window when the wet season no longer supports two crops [16,23,47,50,51]. Irrigated plains, river basins, and mega-deltas show these hydrological constraints clearly, as salinity intrusion threatens irrigated agriculture there [47,50,51]. Heavy precipitation increases the risk of flooding and topsoil erosion, while heatwaves and droughts raise the risk of crop and forage losses. Frost during sensitive phenological stages is a further climatic limit in horticultural systems [22,52]. In the Balkans, rising growing degree days and heat stress indices for maize and wheat suggest that these crops could expand northward and to higher altitudes, but also face a greater risk of heat injury, while earlier last spring frosts and later first autumn frosts lengthen the frost-free season [24]. For kiwiberry, a substantial share of the climatically suitable area in Europe is still exposed to low temperatures in March, although not in April or May [37]. National and regional assessments project shifts in temperature extremes, rainfall regimes, and cropland suitability [34,41,42,43]. Climate change can also make pest outbreaks more likely and make agricultural land more climatically suitable for invasive alien plants [48,49]. Taken together, the biophysical outcome is a network of constraints on crops, water, and land, and on livestock where heat and feed stress apply. These constraints are already reflected in observed productivity trends and European crop-risk ratings and projected to worsen under combined heat, drought, salinity, and pest pressure [4,6,45,47,48,49].
3.2. Economic and Financial Impacts
Once production falls, climate stress passes on to farm income, herd assets, and the credit quality of agricultural lending [1,7,21]. Weather shocks can translate into a probability of large income loss at the sector scale, and drought responses can permanently reduce herd size, so recovery does not necessarily mean a return to the previous state of the farm [1,21]. Examples include projected declines in expected agricultural revenue at the district scale [15] and by evidence that climate risk lowers agricultural green total factor productivity, an effect strengthened by climate policy uncertainty [53].
3.3. Food Security and Livelihood Outcomes
Food security depends on availability, access, and timing, not on yield change alone. Delayed rains can lengthen the hungry season and raise the risk of a national staple deficit, and agricultural climate vulnerability has been linked to child malnutrition [8,54]. Salinity and water scarcity can constrain irrigated systems that supply regional food [47]. At the global scale, Hultgren et al. found that staple production declines with each additional 1 °C of global mean surface temperature [5]. Adaptation and income growth reduce those losses relative to a no-adaptation case by about 23% in 2050 and 34% by the end of the century, leaving substantial residual losses for staples other than rice [5]. History offers a longer view: in Europe, adverse agro-meteorological conditions have repeatedly caused famines, and their social and economic consequences have shaped the course of history [55].
3.4. Compound and Cascading Risks
Compound events include multiple meteorological hazards, temporally repetitive or widespread hazards, and preconditioning in which a first hazard magnifies a second [9]. The co-occurrence of extreme heat and drought is projected to increase, and joint effects can exceed either stress alone [4]. Multi-hazard dependence can also reduce risk rather than increase it when hazards do not co-occur [9]. A typical sequence is a cold spring that reduces fodder, followed by a warm, dry summer that leaves livestock short of feed [9]. Losses at the farm and food-system levels can extend to income, credit quality, and food access [7,8,54]. Even so, the literature reviewed here studies compound sequences less often than single hazards or single thresholds.
4. Farmer Perceptions and Adaptation Choices
Producers do not respond to a modeled hazard alone. They act on the climate risk they perceive and on whether finance, information, and public institutions make a change feasible [11,13]. Even when most surveyed farmers recognize the risk, this does not by itself lead to widespread adaptation [13]. Siregar and Crane, for example, found that farmers were still barely using seasonal forecasts years after being trained, and that poor understanding was not the main barrier [56].
4.1. Climate-Risk Perception and Risk Preferences
Perception is the farmer’s judgment that climate is changing or that a climate-related harm is likely. Risk preference, by contrast, is the attitude toward uncertain payoffs, usually described as risk-averse, risk-neutral, or risk-loving, and it is elicited separately from that judgment [13,57,58]. The two concepts are related but not identical. Greater risk aversion has been associated with lower technical efficiency and weaker uptake of soil-conservation structures, so preference can constrain adaptation even where climate risk is recognized [57,58]. When farmers see a longer growing season as an opportunity, their perceived risk can fall even as the climate changes [59]. Having suffered damage from a specific extreme event is one of the strongest reported reasons for farmers to take coping measures [46]. Knowledge, environmental attitudes, and local discussion further shape whether a hazard is perceived as manageable [60,61,62,63]. Farm surveys widely report that farmers perceive climate change, which illustrates the perception side of this distinction [13,64].
4.2. Socioeconomic Capacity and Institutional Access
Whether farmers can act depends on their resources and institutional access. In farm surveys, education and age predict risk perception, and access also matters for labor-saving options where gender and poverty shape feasible practices [13,65]. Resource position also shapes what people see as the main harm: resource-poor farmers tend to emphasize production, whereas resource-rich farmers emphasize health and broader socioeconomic impacts [13]. Gendered barriers in labor, markets, and finance mean that a labor-saving practice can matter as much as a water-saving one [14,65,66]. Diversifying livelihoods changes how much labor is left for the farm, and off-farm income can raise household cash while also changing the likelihood of adopting climate-smart technologies [58]. Regional surveys find similar farm-level correlates of perception and adoption, but no ranking of determinants that holds everywhere [64,67,68,69,70,71].
4.3. Adaptation Decisions and Constraints
Even when risk is recognized, gaps in finance, labor, water, technology, information, markets, or institutional support can stop farmers from acting on it [11,56,72]. Seasonal advice that is judged useful can still go unused if production conditions make the recommended action impossible [56,73]. Carrying-capacity limits and the design of local water or land systems further restrict which measures are feasible [39,72]. Training and the capacity of public organizations then decide whether a household can keep up a practice beyond the first season [11]. When adaptation is reported simply as a list of adopted practices, it should be read in light of these constraints [68,74].
4.4. Trade-Offs and Unintended Consequences
A practice that reduces one risk can increase another or close a future option. Off-farm work has been linked to a better chance of staying food-secure after drought. Destocking, however, can permanently reduce herd size, and livelihood diversification can affect the labor available for the farm [1,58]. Measures that exceed local carrying capacity, or that close later options, are maladaptive even if they help in one season [72]. Moving land into leisure or mixed enterprises can help adaptation in a given setting, but it takes land out of conventional cropping [75]. The sustainability of farm adaptation should therefore be judged by these trade-offs, not by adoption rates alone [70,74].
5. Adaptation and Risk-Management Strategies
The responses documented in the literature fall into four groups: agronomic change on the current farm, climate-smart and diversification packages, financial instruments that transfer residual risk, and, where incremental change is insufficient, more systemic shifts in production systems or livelihoods [2,3,4]. Their effectiveness has to be judged for a specific outcome, region, and farm system, not through a global ranking of practices [2,4].
5.1. Agronomic Adaptation
Agronomic adaptation makes the existing production system less sensitive to climate without replacing it. Heat- and drought-tolerant cultivars are one example. Planting-date shifts move the crop away from dry or hot periods, and irrigation and nutrient management sustain growth when rainfall fails, provided that water and capital are available [4,16]. Soil-water conservation, mulching, reduced tillage, and rotation retain moisture, break pest cycles, and protect soil [3,57]. These are among the adaptation options that crop-yield studies quantify most often, but they are still incremental changes to the existing type of farm [2,4]. In double-cropping systems, adjustments to the crop calendar and cultivars show how planting choices interact with climate [16].
5.2. Climate-Smart Agriculture and Diversification
Climate-smart agriculture combines three objectives: higher productivity, stronger adaptation, and lower greenhouse-gas emissions where possible, in support of food security [3]. Diversification and mixed land uses spread risk, and meeting climate-smart objectives at scale often requires a mix of land uses across a landscape rather than a single field practice [58,75,76]. In one study setting, rotation and conservation tillage raised technical efficiency while insurance in the same model did not. This shows that a financial instrument and an agronomic practice are not interchangeable outcomes [57]. Participatory climate-smart packages tend to be local bundles of practices, not rankings that transfer elsewhere [70,71,73,74].
5.3. Financial Risk Management
Financial instruments do not restore lost yield. They transfer the climate risk that remains after agronomic measures have been taken. Insurance, including index-based weather or livestock cover, agricultural credit, weather-linked income metrics, and disaster funds, is intended to provide financial support when a harvest or a herd fails [21,77]. These instruments can help prevent insolvency, which matters because climate stress on productivity is also a credit risk for lenders [7]. Access to cover or credit is uneven, and investment risk in climate-smart options falls more heavily where land and collateral are unequal [66]. Financial exposure remains even after mean yield has been modeled, and in farm surveys insurance often appears as just one of several private coping strategies [15,46].
5.4. Incremental and Transformational Adaptation
Incremental change keeps the production system but adjusts timing, inputs, or variety [2,16]. Transformational change replaces crops, land use, the production system, or livelihoods when incremental changes are insufficient, for example, through a shift in enterprise mix, an extension of multi-cropping into new zones, or a transition to mixed or leisure uses [2,18,75]. After a severe drought, a farm may never return to its previous state [1]. Transformation can be an opportunity, such as a poleward shift in cropping calendars, but it can also be maladaptive if it exhausts water or labor [18,72]. Growing degree day analyses tied to actual cultivation sites show such shifts already under way in Europe. Mediterranean and Balkan vineyards now exceed the classical 2000 growing degree day threshold for viticulture, and olive groves have appeared in the land-cover records of Slovenia [26]. Overall, the literature is clearer on when transformation is needed than on how to measure it on a shared scale.
5.5. Mitigation Co-Benefits and the Balance of Evidence
Climate-smart agriculture includes a mitigation objective of reducing or removing greenhouse-gas emissions where possible [3]. Conservation tillage was associated with improved technical efficiency in one rice-production study, although its effect on emissions was not quantified [57]. Farm surveys report low-carbon technology adoption and joint adaptation-mitigation strategies in specific settings [67,70,71]. Future climate risk will likely call for a mix of mitigation and adaptation [2]. Emission reductions are rarely measured directly, compared with yield, income, and risk-coping outcomes. This review therefore focuses on adaptation and discusses mitigation only through documented co-benefits and formal definitions such as climate-smart agriculture.
5.6. Effectiveness and Limitations
The reviewed evidence does not support a global ranking of practices. Irrigation and nutrient management are often reported to be among the most effective ways to protect yield, but they depend on water and investment [4]. Empirically estimated adaptation and income growth offset only part of projected losses in global staple supply, so gains at the farm level do not fully cancel out physical losses [5]. How well a practice works depends on the outcome in question, the region, the farm system, and the economic and institutional constraints that apply [2,3].
6. Policy, Institutions, Extension and Spatial Planning
Adaptation at scale depends on institutions that link technical options to farm-level action through policy coordination, public capacity, finance, and climate information services [10,11,73]. The competing mandates of disaster-risk and climate-adaptation agencies show why these functions rarely line up unless they are deliberately integrated [10].
6.1. Policy Coordination and Mandate Conflict
Farmers are more likely to invest for the long term when they expect public rules to stay in place, and national food-security and climate-smart goals offer that kind of stability [3]. Policy uncertainty can worsen the effect of climate risk on agricultural productivity [53]. When disaster-risk management and climate-change adaptation sit in different agencies, they compete for mandates and budgets, and policies drafted at the international level often fit poorly with local administration [10]. European ratings of crop-production risk provide useful signals at this policy level [6].
6.2. Public-Sector Capacity for Implementation
Policy documents achieve little without public-sector capacity in technical expertise, funding, coordination, implementation, and monitoring. Gaps in training and resources within agricultural agencies repeatedly stall the path from a national plan to action on the farm [11]. The implementation gap also has a spatial side. Climate-risk maps and adaptation plans at the subnational or landscape scale point to the places where hazard, exposure, and vulnerability are concentrated, instead of relying on national averages alone [31,32,33,34].
6.3. Extension and Climate Services
The main job of extension is to turn agrometeorological information into something a particular household can actually do. Agricultural extension, seasonal climate information, field schools, participatory climate services, community information centers, and farmer training have all been shown to link climate information with planting and livelihood decisions [56,73,78]. Climate services interpret climate-risk knowledge and communicate it in forms suited to particular users, such as forecasts, assessments, and advisories, and agriculture is one of the priority sectors for their development [79]. This link breaks down when labor, credit, water, or market constraints make a forecast impossible to act on [56]. Usefulness scores, attendance, forecast use, and changes in yield or income are different outcomes and should not be treated as one [56,73,78]. Examples include participatory seasonal planning programs and village weather stations linked to farmer clubs [73,78].
6.4. Financial and Social Access
Credit, insurance, gendered barriers in labor and markets, smallholder inclusion, and the cost of adopting new practices determine who can actually use the agronomic and financial responses described above [14,65,66,77]. Extending insurance to smallholders runs into constraints on the demand side, the supply side, and in the wider enabling environment [77]. Labor-saving options matter where women’s time, credit access, and market access are scarce [14,65]. About half of the identified risks of investing in climate-smart agriculture are more likely to affect women farmers than men [66].
6.5. Spatial and Regional Planning
Spatial targeting directs public investment to hotspots of hazard and social vulnerability and to mapped high-risk zones [14,30,31,32,33,34,51]. For perennial crops, national suitability and climate-risk maps for olive groves and vineyards can serve as the basis for this kind of targeting [35,36,38]. A climate-smart landscape treats field practices, land-use diversity, and interactions among uses as a single management problem, with multi-stakeholder planning and spatially targeted public investment [76]. Relevant planning units include river basins and mega-deltas, irrigated lowlands, urban and peri-urban agriculture, and crop–pest suitability zones [32,47,48,50]. Sectoral income-at-risk metrics and European crop-production risk ratings provide complementary economic and policy signals [6,21]. Scaling up a local intervention therefore remains case-specific, and no universal spatial formula applies.
7. Discussion
The five domains covered here are parts of one problem, not five separate catalogs. Agricultural climate risk is fully specified only when the hazard–exposure–vulnerability object and the loss metric are named together [9,12]. Assessments must also state whether they address short-term climate variability or longer-term change [2]. For example, a crop-model yield path, a household survey, and a loan-recovery metric may all concern climate and agriculture, but they do not answer the same question. The paragraphs below draw these differences together, since they decide what can be compared, what can be put into practice, and what is still unknown.
In terms of time, biophysical studies tend to combine historical baselines with future scenarios, while farm surveys focus on recent experience and perceived risk, which fits decisions taken on shorter horizons [13,46]. The operational split between near-term disaster risk management and long-term adaptation mirrors the modeling divide described in Section 2.2. This entrenches an institutional fragmentation that better climate datasets alone cannot fix [2,10].
The choice of outcome adds to the problem. Yield change, staple supply after observed adaptation, productivity, revenue, income-at-risk, farm resilience, and the timing of food shortage are distinct endpoints [1,4,5,8,15,21,45]. Claims about effectiveness that mix these endpoints as if they were measured on one scale are therefore matters of interpretation, not calculation. Simulated yield losses without adaptation cannot be subtracted from staple-production paths that already include empirically estimated adaptation [4,5]. Because these measures capture different stages of the causal chain, rankings across studies are not valid until the endpoints are unified [1,9].
Physical, economic, and food-security effects also travel along the same causal chain. Heat, water deficit and excess, soils, and biological pressure interact, and compound sequences can raise joint risk or, where hazards do not co-occur, reduce it [4,9]. Damage then affects farm income, herd assets, loan recoverability, and seasonal food access [1,7,8]. Many assessments still report a single hazard or a single threshold, so the empirical study of compound and cascading risk lags behind the conceptual literature [4,9]. Explicit harm thresholds are also much less common than continuous estimates of mean yield.
Defining risk, however, is not the same as acting on it. Thresholds, maps, and seasonal products can pinpoint a probability, but finance, labor, water, markets, and organizational capacity often block the corresponding practice [11,72]. Farm surveys commonly find that farmers perceive climate risk, yet perception alone does not lead to adaptation [13]. Farmers may rate climate services as useful and still make little use of forecasts when their production conditions do not allow it [56,73]. Better measurement reduces uncertainty about harm, but it does not by itself close the implementation gap.
The documented responses address different parts of the same chain. As the farm evidence in Section 5.2 shows, agronomic practices and insurance work through different mechanisms and cannot be treated as interchangeable routes to resilience [57]. In the literature reviewed, climate-smart agriculture and agricultural insurance serve different objectives [3,77]. Incremental change is better documented than transformational change, and direct greenhouse-gas mitigation outcomes are less documented than adaptation and risk-transfer outcomes [2,3]. Where water and capital are available, irrigation and nutrient management are often among the most effective measured ways to protect yield, yet empirically estimated adaptation and income growth still leave substantial residual losses in global staple supply [4,5]. Effectiveness therefore remains specific to the stated outcome, region, and farm system.
Adaptive capacity turns into action only where institutions make implementation possible. Climate policy uncertainty can strengthen the adverse effect of climate risk on agricultural green total factor productivity [53]. Competing disaster-risk and climate-adaptation mandates, limited public expertise and funding, unequal access to credit and land, and spatial plans that fail to translate into investment all shape whether a technically available measure is used [10,11,76]. Gendered constraints on labor and finance are part of this picture [14,65,66]. Studies that follow a single case through yield, behavior, finance, and extension would reveal where capacity fails to become action. A thematic integrative review can explain why those designs cannot yet be pooled as one effect size, but it cannot replace a meta-analysis [80].
Future research should aim to make existing studies more comparable rather than adding yet another catalog of practices. Studies that state the harm object, temporal horizon, and metric within the same design would let crop-model projections, household surveys, and financial indicators be compared directly instead of side by side. Compound and cascading sequences should be labeled as explicitly as single-hazard thresholds, because joint heat-drought risk and hazard dependence can move in opposite directions. At the farm-to-landscape scale, integrated case studies are needed. Tracing one production system through biophysical loss, stated risk perception, credit or insurance use, and extension or climate-service uptake would show where measurement stops and implementation fails. Transformational change in crops, land use, or livelihoods is still discussed more than it is measured on a shared scale, so longitudinal studies after severe drought or policy shock would complement the stronger evidence on incremental agronomic options. Public research can also help align short-term disaster-risk management with long-term adaptation mandates and subnational risk maps, so that spatial plans lead to concrete investment priorities. Process-based and statistical assessments that report the same endpoint at the same spatial unit would help bridge the gap between continental yield estimates and the coping choices of individual households. Recent advances in machine learning, high-resolution Earth observation, and open-source geospatial tools can facilitate this integration by emulating complex crop models and downscaling gridded climate indicators to farm-level metrics [20,29,38,40]. How useful these tools prove for climate-risk assessment will depend on whether they keep consistent harm objects, temporal horizons, spatial units, and assumptions about adaptation across scales.
This review has some limitations. Sources were selected purposively rather than through an exhaustive search, and the geographic coverage is uneven. The review also does not rank practices globally or estimate publication bias.
8. Concluding Remarks
This integrative review set out to organize the evidence on agricultural climate risk around a core problem, namely that studies use harm objects, time horizons, and spatial scales that cannot be compared directly. It did so across five domains: definition and measurement, impact propagation, farmer decision-making, response strategies, and institutional implementation. Instead of treating different metrics as interchangeable, the review looked for patterns that cut across the literature. The main findings are as follows:
- Agricultural climate risk is a multidimensional concept that combines hazard, exposure, and vulnerability. It is not the same as a weather event, the loss that follows, or a farming system’s capacity to recover, reorganize, and evolve.
- Climate risk is assessed through crop models, climatic thresholds, spatial mapping, farmer surveys, and financial assessment tools. These approaches often define harm, metrics, and time horizons differently. Studies also examine either observed historical conditions or projected future climates, with different assumptions about adaptation.
- Climate-related physical stress affects agricultural systems through thermal, hydrological, soil-related, and biological pathways, with consequences for crop yields, livestock, and natural resources. These impacts can spread to farm income, access to credit, livelihood stability, and food security, for example through seasonal shortages. Compound climate events can add to the overall risk.
- Farmer perceptions and risk preferences influence adaptation decisions, but access to finance, labor, water, information, and institutional support can substantially constrain implementation. Adaptation may also involve trade-offs, including increased reliance on off-farm income, livestock destocking, or pressure on the carrying capacity of natural resources.
- Adaptation responses range from agronomic adjustments and climate-smart diversification to insurance, credit mechanisms, and, in some contexts, transformational changes in agricultural systems. Mitigation is usually treated as a co-benefit rather than measured as an outcome in its own right. How well adaptation measures work depends on the outcome, region, and agricultural system, and the evidence is not strong enough to rank practices globally.
- The implementation and scalability of adaptation measures depend on policy coordination, public institutional capacity, access to reliable climate services, and equitable access to finance and land. Spatial targeting can help direct resources to the areas and systems most at risk.
- Crop yield, farm income, credit quality, and food access measure different kinds of harm that cannot be compared directly, so this review does not pool effect sizes or rank practices globally. Instead, it shows where empirical metrics diverge and where institutional and practical bottlenecks hold back implementation on the farm.
- Future research should improve comparability by defining the harm object, time horizon, and metric within the same study design. Integrated farm-to-landscape studies and decision-support tools should link biophysical impacts with risk perception, financial responses, and institutional implementation. AI-assisted and process-based tools can help, but only if they use consistent endpoints, spatial units, and clearly stated assumptions. Longitudinal evidence is also needed to assess transformational change and compound or cascading risk on shared scales.
Author Contributions
Conceptualization, I.C.; methodology, I.C and K.P.D.; validation, I.C, K.P.D.; formal analysis, K.P.D. and I.C.; investigation, K.P.D and I.C.; resources, K.P.D. and I.C.; writing—original draft preparation, I.C. and K.P.D.; writing—review and ed-iting, K.P.D., I.C.; visualization, K.P.D.; supervision, I.C.
Funding
This research received no external funding.
Acknowledgments
Conflicts of Interest
The authors declare no conflicts of interest.
References
- Pret, V.; Falconnier, G.N.; Affholder, F.; Corbeels, M.; Chikowo, R.; Descheemaeker, K. Farm Resilience to Climatic Risk. A Review. Agron. Sustain. Dev. 2025, 45, 10. [Google Scholar] [CrossRef] [PubMed]
- Howden, S.M.; Soussana, J.-F.; Tubiello, F.N.; Chhetri, N.; Dunlop, M.; Meinke, H. Adapting Agriculture to Climate Change. Proc. Natl. Acad. Sci. U. S. A. 2007, 104, 19691–19696. [Google Scholar] [CrossRef] [PubMed]
- Food and Agriculture Organization of the United Nations (FAO) Climate-Smart Agriculture Sourcebook; FAO: Rome, Italy, 2014; ISBN 978-92-5-107720-7.
- Rezaei, E.; Webber, H.; Asseng, S.; Boote, K.; Durand, J.-L.; Ewert, F.; Martre, P.; Maccarthy, D. Climate Change Impacts on Crop Yields. Nat. Rev. Earth Environ. 2023, 4, 831–846. [Google Scholar] [CrossRef]
- Hultgren, A.; Carleton, T.; Delgado, M.; Gergel, D.R.; Greenstone, M.; Houser, T.; Hsiang, S.; Jina, A.; Kopp, R.E.; Malevich, S.B.; et al. Impacts of Climate Change on Global Agriculture Accounting for Adaptation. Nature 2025, 642, 644–652. [Google Scholar] [CrossRef] [PubMed]
- European Climate Risk Assessment. Available online: https://www.eea.europa.eu/en/analysis/publications/european-climate-risk-assessment (accessed on 18 September 2026).
- Céu, M.S.; Gaspar, R.M. A Review on Climate Change, Credit Risk and Agriculture. Rural Sustain. Res. 2024, 51, 38–49. [Google Scholar] [CrossRef]
- Naylor, R.L.; Battisti, D.S.; Vimont, D.J.; Falcon, W.P.; Burke, M.B. Assessing Risks of Climate Variability and Climate Change for Indonesian Rice Agriculture. Proc. Natl. Acad. Sci. U. S. A. 2007, 104, 7752–7757. [Google Scholar] [CrossRef] [PubMed]
- Garry, F.K.; Bernie, D.J.; Davie, J.C.S.; Pope, E.C.D. Future Climate Risk to UK Agriculture from Compound Events. Clim. Risk Manag. 2021, 32, 100282. [Google Scholar] [CrossRef]
- Howland, F.; Le Coq, J.-F. Disaster Risk Management, or Adaptation to Climate Change? The Elaboration of Climate Policies Related to Agriculture in Colombia. Geoforum 2022, 131, 163–172. [Google Scholar] [CrossRef]
- Khan, N.A.; Gao, Q.; Abid, M. Public Institutions’ Capacities Regarding Climate Change Adaptation and Risk Management Support in Agriculture: The Case of Punjab Province, Pakistan. Sci. Rep. 2020, 10, 14111. [Google Scholar] [CrossRef] [PubMed]
- Dong, Z.; Pan, Z.; An, P.; Zhang, J.; Zhang, J.; Pan, Y.; Huang, L.; Zhao, H.; Han, G.; Wu, D.; et al. A Quantitative Method for Risk Assessment of Agriculture Due to Climate Change. Theor. Appl. Climatol. 2018, 131. [Google Scholar] [CrossRef]
- Ndamani, F.; Watanabe, T. Determinants of Farmers’ Climate Risk Perceptions in Agriculture—A Rural Ghana Perspective. Water 2017, 9, 210. [Google Scholar] [CrossRef]
- Chanana-Nag, N.; Aggarwal, P.K. Woman in Agriculture, and Climate Risks: Hotspots for Development. Clim. Change 2020, 158, 13–27. [Google Scholar] [CrossRef]
- Costa, F.; Forge, F.; Garred, J.; Pessoa, J.P. The Impact of Climate Change on Risk and Return in Indian Agriculture. Environ. Resour. Econ. 2023, 85, 1–27. [Google Scholar] [CrossRef]
- Pires, G.F.; Abrahão, G.M.; Brumatti, L.M.; Oliveira, L.J.C.; Costa, M.H.; Liddicoat, S.; Kato, E.; Ladle, R.J. Increased Climate Risk in Brazilian Double Cropping Agriculture Systems: Implications for Land Use in Northern Brazil. Agric. For. Meteorol. 2016, 228–229, 286–298. [Google Scholar] [CrossRef]
- Müller, C.; Cramer, W.; Hare, B.; Lotze-Campen, H. Climate Change Risks for African Agriculture. Proc. Natl. Acad. Sci. 2011, 108, 4313–4315. [Google Scholar] [CrossRef] [PubMed]
- Tian, Z.; Liang, Z.; Sun, L.; Zhong, H.; Qiu, H.; Fischer, G.; Zhao, S. Agriculture under Climate Change in China: Mitigate the Risks by Grasping the Emerging Opportunities. Hum. Ecol. Risk Assess. Int. J. 2015, 21, 1259–1276. [Google Scholar] [CrossRef]
- Wang, D.; Jenkins, K.; Forstenhäusler, N.; Lei, T.; Price, J.; Warren, R.; Jenkins, R.; Guan, D. Economic Impacts of Climate-Induced Crop Yield Changes: Evidence from Agri-Food Industries in Six Countries. Clim. Change 2021, 166, 30. [Google Scholar] [CrossRef]
- Estrada, F.; Botzen, W.J.W.; Calderon-Bustamante, O. The Assessment of Impacts and Risks of Climate Change on Agriculture (AIRCCA) Model: A Tool for the Rapid Global Risk Assessment for Crop Yields at a Spatially Explicit Scale. Spat. Econ. Anal. 2020, 15, 262–279. [Google Scholar] [CrossRef]
- Prettenthaler, F.; Köberl, J.; Bird, D.N. ‘Weather Value at Risk’: A Uniform Approach to Describe and Compare Sectoral Income Risks from Climate Change. Sci. Total Environ. 2016, 543, 1010–1018. [Google Scholar] [CrossRef] [PubMed]
- Tudela, V.; Sarricolea, P.; Serrano-Notivoli, R.; Meseguer-Ruiz, O. A Pilot Study for Climate Risk Assessment in Agriculture: A Climate-Based Index for Cherry Trees. Nat. Hazards 2022, 115. [Google Scholar] [CrossRef]
- Costa, M.; Fleck, L.; Cohn, A.; Abrahão, G.; Brando, P.; Coe, M.; Fu, R.; Lawrence, D.; Pires, G.; Pousa, R.; et al. Climate Risks to Amazon Agriculture Suggest a Rationale to Conserve Local Ecosystems. Front. Ecol. Environ. 2019, 17. [Google Scholar] [CrossRef]
- Charalampopoulos, I. Agrometeorological Conditions and Agroclimatic Trends for the Maize and Wheat Crops in the Balkan Region. Atmosphere 2021, 12, 671. [Google Scholar] [CrossRef]
- Charalampopoulos, I.; Droulia, F. Frost Conditions Due to Climate Change in South-Eastern Europe via a High-Spatiotemporal-Resolution Dataset. Atmosphere 2022, 13, 1407. [Google Scholar] [CrossRef]
- Charalampopoulos, I.; Kotsidis, N.; Droulia, F. Reverse Agroclimatology: Growing Degree Days at Actual Olive Grove and Vineyard Locations Across Europe. Agronomy 2026, 16, 1162. [Google Scholar] [CrossRef]
- Ghosh, S.; Mukhoti, S.; Sharma, P. Quantifying Rainfall-Induced Climate Risk in Rainfed Agriculture: A Volatility-Based Time Series Study from Semi-Arid India. Agric. Water Manag. 2025, 319, 109775. [Google Scholar] [CrossRef]
- Cobon, D.H.; Williams, A.A.J.; Power, B.; McRae, D.; Davis, P. Risk Matrix Approach Useful in Adapting Agriculture to Climate Change. Clim. Change 2016, 138, 173–189. [Google Scholar] [CrossRef]
- Jha, P.; Chinngaihlian, S.; Upreti, P.; Handa, A. A Machine Learning Approach to Assess Implications of Climate Risk Factors on Agriculture: The Indian Case. Clim. Risk Manag. 2023, 41, 100523. [Google Scholar] [CrossRef]
- Lecoutere, E.; Mishra, A.; Singaraju, N.; Koo, J.; Azzarri, C.; Chanana, N.; Nico, G.; Puskur, R. Where Women in Agri-Food Systems Are at Highest Climate Risk: A Methodology for Mapping Climate–Agriculture–Gender Inequality Hotspots. Front. Sustain. Food Syst. 2023, 7. [Google Scholar] [CrossRef]
- CGIAR Research Program on Climate Change, Agriculture and Food Security (CCAFS) Climate-Related Risk Maps and Adaptation Plans (Climate Smart MAP) for Rice Production in Vietnam’s Mekong River Delta; Copenhagen, Denmark, 2018.
- Dubbeling, M.; van Veenhuizen, R.; Halliday, J. Urban Agriculture as a Climate Change and Disaster Risk Reduction Strategy. Field Actions Sci. Rep. J. Field Actions 2019, 32–39. [Google Scholar]
- Rao, C.A.R.; Raju, B.M.K.; Islam, A.; Rao, A.; Rao, K.V.; Gajjala, R.C.; Ramaraju, N.K.; Matyam, P.; Kotha, S.R.; Bhaskar, S.; et al. Climate Change Risk Assessment for Adaptation Planning in Indian Agriculture. Mitig. Adapt. Strateg. Glob. Change 2025, 30, 20. [Google Scholar] [CrossRef]
- Ahmed, M.; Dars, G.H.; Ahmed, S.; Krakauer, N.Y. Analyzing Drought Trends over Sindh Province, Pakistan. Nat. Hazards 2023, 119, 643–661. [Google Scholar] [CrossRef]
- Charalampopoulos, I.; Droulia, F.; Mavridi, A.; Roussos, P.A. Mapping the Climatic Suitability for Olive Groves in Greece. Agronomy 2025, 15, 2604. [Google Scholar] [CrossRef]
- Kotsidis, N.; Droulia, F.; Biniari, K.; Charalampopoulos, I. Modeling and Mapping the Climatic Suitability for Viticulture in Greece. Atmosphere 2026, 17, 190. [Google Scholar] [CrossRef]
- Margaritidis, A.K.; Charalampopoulos, I. Integrating Species Distribution Modelling and Spring Low-Temperature Exposure to Assess Climatic Suitability for Actinidia arguta in Europe. Agronomy 2026, 16, 2082. [Google Scholar] [CrossRef]
- Papadopoulos-Dorlis, K.; Droulia, F.; Roussos, P.A.; Psomiadis, E.; Charalampopoulos, I. Modeling and Mapping Climate Risk for Olive Cultivation in Greece Using an AI-Assisted Geospatial Analysis System. Climate 2026, 14, 199. [Google Scholar] [CrossRef]
- Jones, E.C.; Leibowicz, B.D. Climate Risk Management in Agriculture Using Alternative Electricity and Water Resources: A Stochastic Programming Framework. Environ. Syst. Decis. 2022, 42, 117–135. [Google Scholar] [CrossRef]
- Han, E.; Ines, A.V.M.; Baethgen, W.E. Climate-Agriculture-Modeling and Decision Tool (CAMDT): A Software Framework for Climate Risk Management in Agriculture. Environ. Model. Softw. 2017, 95, 102–114. [Google Scholar] [CrossRef]
- Hurduzeu, G.; Kevorchian, C.; Gavrilescu, C.; Hurduzeu, R. Hazards and Risks in the Romanian Agriculture Due to Climate Changes. Procedia Econ. Finance 2014, 8, 346–352. [Google Scholar] [CrossRef]
- Lilburne, L.; Ausseil, A.-G.; Sood, A.; Guo, J.; Teixeira, E.; Vetharaniam, I.; van der Weerden, T.; Smith, H.; Neverman, A.; Cichota, R.; et al. Modelling to Identify Direct Risks for New Zealand Agriculture Due to Climate Change. J. R. Soc. N. Z. 2025, 55, 1683–1700. [Google Scholar] [CrossRef] [PubMed]
- Mandal, U.K.; Karim, F.; Yu, Y.; Ghosh, A.; Zahan, T.; Mallick, S.; Kamruzzaman, M.; Paul, P.L.C.; Mainuddin, M. Assessing Vulnerability and Climate Risk to Agriculture for Developing Resilient Farming Strategies in the Ganges Delta. Clim. Risk Manag. 2025, 47, 100690. [Google Scholar] [CrossRef]
- Brown, I. Climate Change and Soil Wetness Limitations for Agriculture: Spatial Risk Assessment Framework with Application to Scotland. Geoderma 2017, 285, 173–184. [Google Scholar] [CrossRef]
- Intergovernmental Panel on Climate Change (IPCC). Climate Change 2022 – Impacts, Adaptation and Vulnerability: Working Group II Contribution to the Sixth Assessment Report of the Intergovernmental Panel on Climate Change, 1st ed.; Cambridge University Press: Cambridge, UK, 2023; ISBN 978-1-009-32584-4. [Google Scholar] [CrossRef]
- Nassivera, F.; Gallenti, G.; Carzedda, M. An Inquiry on North-Eastern Italian Farmers’ Perception of Climate Change and Related Risks to Agriculture. Ital. Rev. Agric. Econ. 2022, 77, 63–72. [Google Scholar] [CrossRef]
- Schneider, P.; Asch, F. Rice Production and Food Security in Asian Mega Deltas—A Review on Characteristics, Vulnerabilities and Agricultural Adaptation Options to Cope with Climate Change. J. Agron. Crop Sci. 2020, 206, 491–503. [Google Scholar] [CrossRef]
- Litskas, V.D.; Migeon, A.; Navajas, M.; Tixier, M.-S.; Stavrinides, M.C. Impacts of Climate Change on Tomato, a Notorious Pest and Its Natural Enemy: Small Scale Agriculture at Higher Risk. Environ. Res. Lett. 2019, 14, 084041. [Google Scholar] [CrossRef]
- Kariyawasam, C.S.; Kumar, L.; Ratnayake, S.S. Potential Risks of Invasive Alien Plant Species on Agriculture under Climate Change Scenarios in Sri Lanka. Curr. Res. Environ. Sustain. 2021, 3, 100051. [Google Scholar] [CrossRef]
- Lobanova, A.; Didovets, I.; Menz, C.; Umirbekov, A.; Babagalieva, Z.; Hattermann, F.; Krysanova, V. Rapid Assessment of Climate Risks for Irrigated Agriculture in Two River Basins in the Aral Sea Basin. Agric. Water Manag. 2021, 243, 106381. [Google Scholar] [CrossRef]
- Ronco, P.; Zennaro, F.; Torresan, S.; Critto, A.; Santini, M.; Trabucco, A.; Zollo, A.L.; Galluccio, G.; Marcomini, A. A Risk Assessment Framework for Irrigated Agriculture under Climate Change. Adv. Water Resour. 2017, 110, 562–578. [Google Scholar] [CrossRef]
- Fuhrer, J.; Beniston, M.; Fischlin, A.; Frei, C.; Goyette, S.; Jasper, K.; Pfister, C. Climate Risks and Their Impact on Agriculture and Forests in Switzerland. Clim. Change 2006, 79, 79–102. [Google Scholar] [CrossRef]
- Wang, M.; Song, Y.; Zhang, X. Climate Risk and Green Total Factor Productivity in Agriculture: The Moderating Role of Climate Policy Uncertainty. Risk Anal. 2025, 45, 981–995. [Google Scholar] [CrossRef] [PubMed]
- Mahapatra, B.; Walia, M.; Rao, C.A.R.; Raju, B.M.K.; Saggurti, N. Vulnerability of Agriculture to Climate Change Increases the Risk of Child Malnutrition: Evidence from a Large-Scale Observational Study in India. PLoS ONE 2021, 16, e0253637. [Google Scholar] [CrossRef] [PubMed]
- Charalampopoulos, I.; Droulia, F. The Agro-Meteorological Caused Famines as an Evolutionary Factor in the Formation of Civilisation and History: Representative Cases in Europe. Climate 2021, 9, 5. [Google Scholar] [CrossRef]
- Siregar, P.R.; Crane, T.A. Climate Information and Agricultural Practice in Adaptation to Climate Variability: The Case of Climate Field Schools in Indramayu, Indonesia. Cult. Agric. Food Environ. 2011, 33, 55–69. [Google Scholar] [CrossRef]
- Tong, Q.; Swallow, B.; Zhang, L.; Zhang, J. The Roles of Risk Aversion and Climate-Smart Agriculture in Climate Risk Management: Evidence from Rice Production in the Jianghan Plain, China. Clim. Risk Manag. 2019, 26, 100199. [Google Scholar] [CrossRef]
- Musyoki, M.E.; Busienei, J.R.; Gathiaka, J.K.; Karuku, G.N. Linking Farmers’ Risk Attitudes, Livelihood Diversification and Adoption of Climate Smart Agriculture Technologies in the Nyando Basin, South-Western Kenya. Heliyon 2022, 8. [Google Scholar] [CrossRef] [PubMed]
- Sorvali, J.; Liu, X.; Kaseva, J. Climate Change Opportunities Reduce Farmers’ Risk Perception: Extension of the Value-Belief-Norm Theory in the Context of Finnish Agriculture. Front. Psychol. 2022, 13. [Google Scholar] [CrossRef] [PubMed]
- Zobeidi, T.; Yazdanpanah, M.; Bakhshi, A. Climate Change Risk Perception among Agriculture Students: The Role of Knowledge, Environmental Attitude, and Belief in Happening. J. Agric. Sci. Technol. 2020, 22, 43–55. [Google Scholar]
- Coe, R.; Stern, R.D. ASSESSING AND ADDRESSING CLIMATE-INDUCED RISK IN SUB-SAHARAN RAINFED AGRICULTURE: LESSONS LEARNED. Exp. Agric. 2011, 47, 395–410. [Google Scholar] [CrossRef]
- Ng’ombe, J.N.; Tembo, M.C.; Masasi, B. “Are They Aware, and Why?” Bayesian Analysis of Predictors of Smallholder Farmers’ Awareness of Climate Change and Its Risks to Agriculture. Agronomy 2020, 10, 376. [Google Scholar] [CrossRef]
- Diehl, D.; Sloan, N.; Garcia, E.; Gonzalez, S.; Dourte, D.; Fraisse, C. Climate-Related Risks and Management Issues Facing Agriculture in the Southeast: Interviews with Extension Professionals. J. Ext. 2017, 55. [Google Scholar] [CrossRef]
- Kissi, A.E.; Abbey, G.A.; Villamor, G.B. Perceptions of Climate Change Risk on Agriculture Livelihood in Savanna Region, Northern Togo. Climate 2023, 11, 86. [Google Scholar] [CrossRef]
- Khatri-Chhetri, A.; Regmi, P.P.; Chanana, N.; Aggarwal, P.K. Potential of Climate-Smart Agriculture in Reducing Women Farmers’ Drudgery in High Climatic Risk Areas. Clim. Change 2020, 158, 29–42. [Google Scholar] [CrossRef]
- Glemarec, Y. Addressing the Gender Differentiated Investment Risks to Climate-Smart Agriculture. AIMS Agric. Food 2017, 2, 56–74. [Google Scholar] [CrossRef]
- Li, L.; Huang, Y. Sustainable Agriculture in the Face of Climate Change: Exploring Farmers’ Risk Perception, Low-Carbon Technology Adoption, and Productivity in the Guanzhong Plain of China. Water 2023, 15, 2228. [Google Scholar] [CrossRef]
- Usman, M.; Ali, A.; Bashir, M.K.; Radulescu, M.; Mushtaq, K.; Wudil, A.H.; Baig, S.A.; Akram, R. Do Farmers’ Risk Perception, Adaptation Strategies, and Their Determinants Benefit towards Climate Change? Implications for Agriculture Sector of Punjab, Pakistan. Environ. Sci. Pollut. Res. 2023, 30, 79861–79882. [Google Scholar] [CrossRef] [PubMed]
- Ismayilzada, M.; Gahramanova, S.; Rahimova, K.; Karimova, V. Adaptation Strategies of Agriculture to Climate Change and Natural Disasters. Ekon. APK 2023, 30, 17–25. [Google Scholar] [CrossRef]
- Ceesay, S.; Lambarraa-Lehnhardt, F.; Ndiaye, M.B.O.; Thiaw, D.; Sawaneh, M.; Schuler, J. Farmers’ Perceptions of the Efficacy of Current Climate Risk Adaptation and Mitigation Strategies on Agriculture in The Gambia. Land 2025, 14, 622. [Google Scholar] [CrossRef]
- Ehsan, N.; Hoogenboom, G.; Qamar, M.K.; Wilkerson, C.J.; Wajid, S.A.; Aziz, F. Climate Change Risk Perception and Adaptation to Climate Smart Agriculture Are Required to Increase Wheat Production for Food Security. Ital. J. Agron. 2022, 17, 2129. [Google Scholar] [CrossRef]
- Ibrahim, M.A.; Johansson, M. Combating Climate Change – What, Where and How to Implement Adaptive Measures in the Agriculture Sector of Öland, Sweden, Keeping in View the Constraints of Carrying Capacities and Risk of Maladaptation. Land Use Policy 2022, 122, 106358. [Google Scholar] [CrossRef]
- Dayamba, D.S.; Ky-Dembele, C.; Bayala, J.; Dorward, P.; Clarkson, G.; Sanogo, D.; Diop Mamadou, L.; Traoré, I.; Diakité, A.; Nenkam, A.; et al. Assessment of the Use of Participatory Integrated Climate Services for Agriculture (PICSA) Approach by Farmers to Manage Climate Risk in Mali and Senegal. Clim. Serv. 2018, 12, 27–35. [Google Scholar] [CrossRef]
- Saqib, S.E.; Yaseen, M.; Yang, S.-H.; Ali, S.; Visetnoi, S. Farmers’ Adaptation to Climate Change in Pakistan: Can Their Climate Risk Management Strategies Lead to Sustainable Agriculture? J. Environ. Manag. 2025, 373, 123447. [Google Scholar] [CrossRef] [PubMed]
- Chen, W.-J.; Jan, J.-F.; Chung, C.-H.; Liaw, S.-C. Agriculture Risks and Opportunities in a Climate-Vulnerable Watershed in Northeastern Taiwan—The Opinions of Leisure Agriculture Operators. Sustainability 2023, 15, 15025. [Google Scholar] [CrossRef]
- Scherr, S.J.; Shames, S.; Friedman, R. From Climate-Smart Agriculture to Climate-Smart Landscapes. Agric. Food Secur. 2012, 1, 12. [Google Scholar] [CrossRef]
- Platform for Agricultural Risk Management (PARM) Agricultural and Climate Risk Insurance for Smallholder Value Chains: Identifying Common Challenges and Solutions. Available online: https://parm.org/wp-content/uploads/2024/03/INSURED_ChallengesAndSolutions_Web.pdf (accessed on 18 September 2026).
- Nidumolu, U.; Adusumilli, R.; Tallapragada, C.; Roth, C.; Hochman, Z.; Sreenivas, G.; Raji Reddy, D.; Ratna Reddy, V. Enhancing Adaptive Capacity to Manage Climate Risk in Agriculture through Community-Led Climate Information Centres. Clim. Dev. 2021, 13, 189–200. [Google Scholar] [CrossRef]
- Charalampopoulos, I.; Droulia, F. A Pathway towards Climate Services for the Agricultural Sector. Climate 2024, 12, 18. [Google Scholar] [CrossRef]
- Snyder, H. Literature Review as a Research Methodology: An Overview and Guidelines. J. Bus. Res. 2019, 104, 333–339. [Google Scholar] [CrossRef]
Figure 1.
Conceptual organization of this review, proceeding from climate hazard, exposure, and vulnerability to biophysical and socioeconomic impacts, farmer perception and constraints, agronomic and financial responses, and institutional and spatial enabling conditions. The figure summarizes how the sections of the paper connect hazard assessment to farm-level decisions and governance.
Figure 1.
Conceptual organization of this review, proceeding from climate hazard, exposure, and vulnerability to biophysical and socioeconomic impacts, farmer perception and constraints, agronomic and financial responses, and institutional and spatial enabling conditions. The figure summarizes how the sections of the paper connect hazard assessment to farm-level decisions and governance.
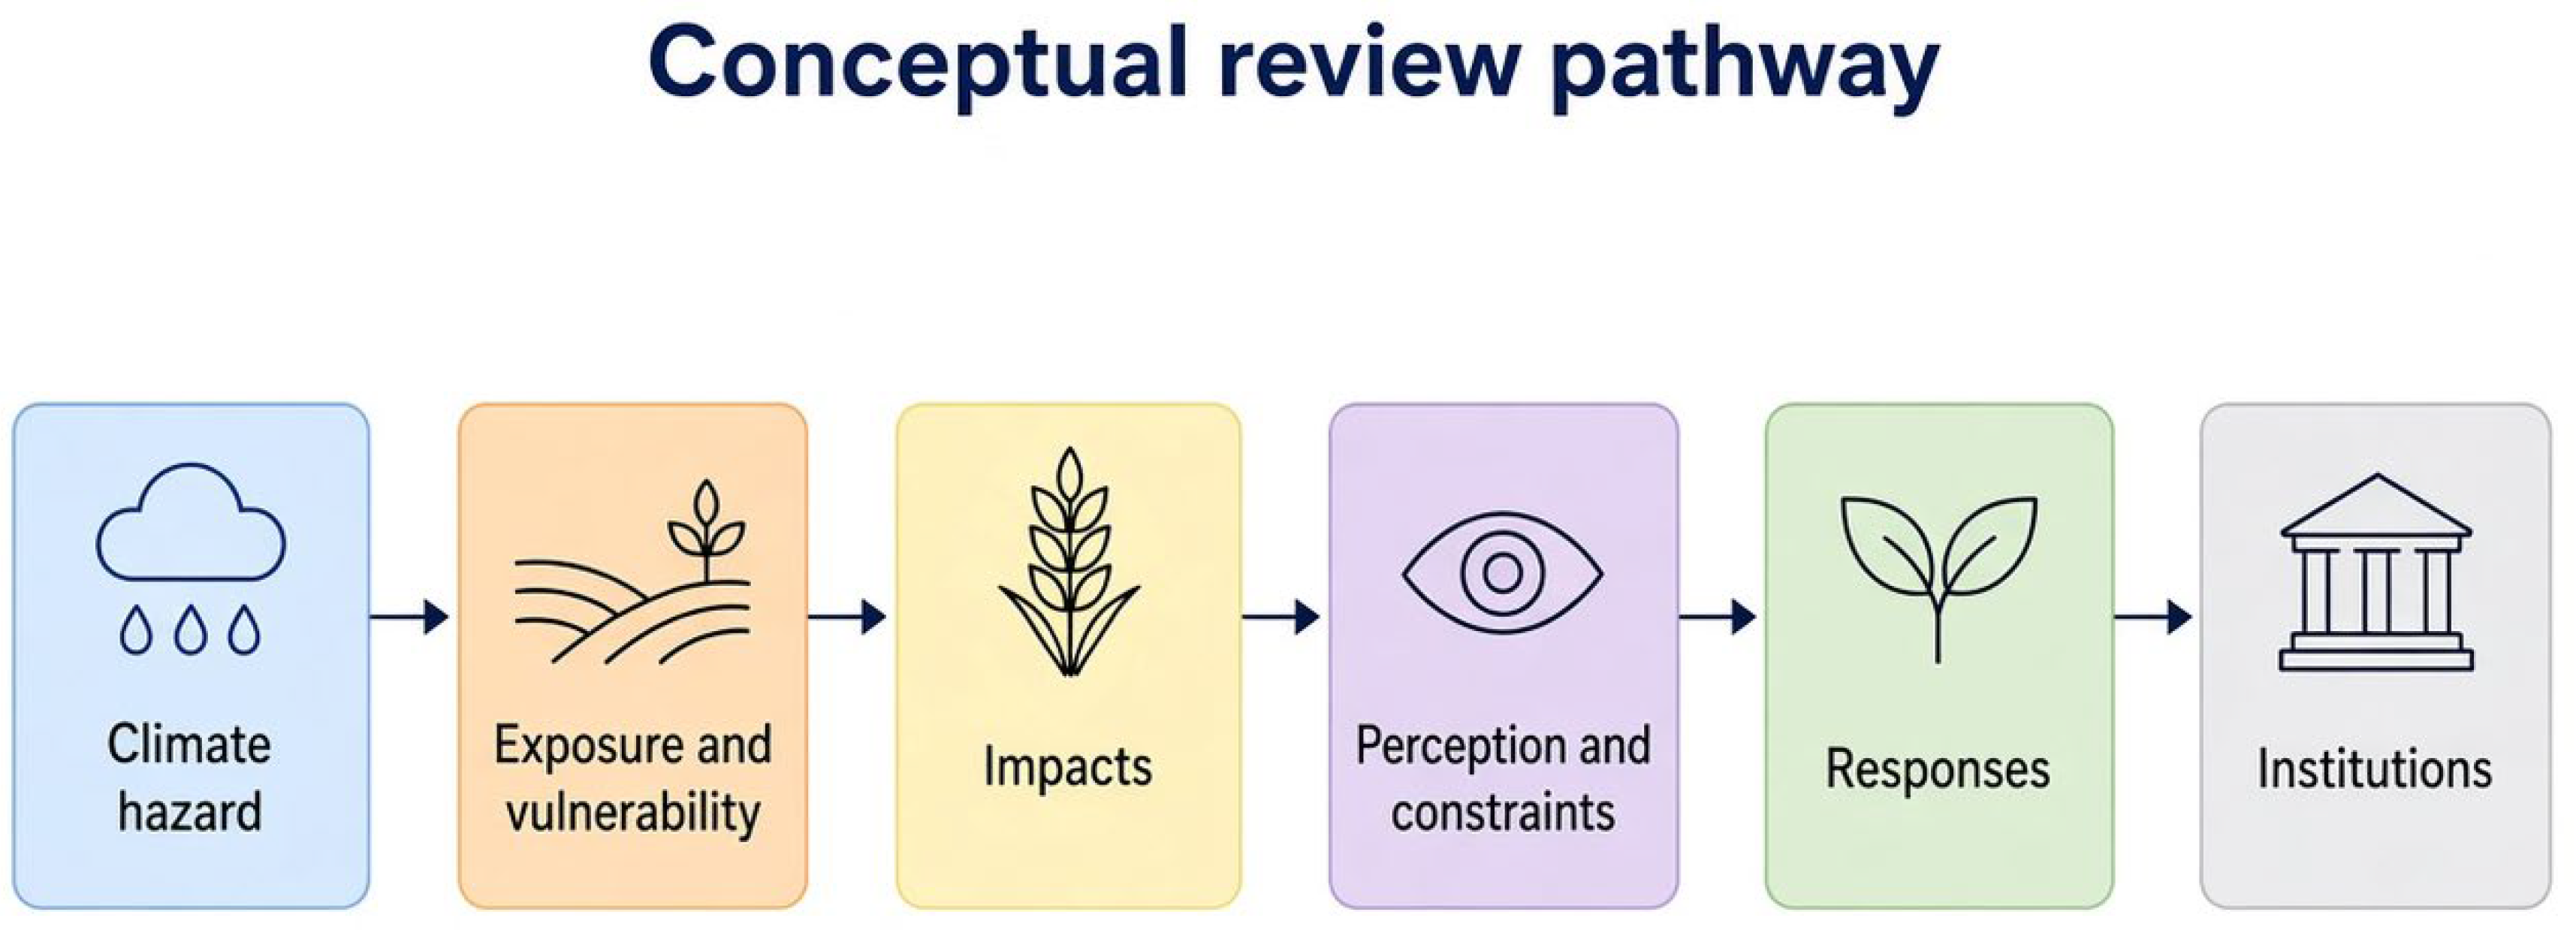
Figure 2.
Composition of agricultural climate risk: a climate hazard acts on exposed farm assets and on system vulnerability, and the outcome is a realized loss whose metric must be specified (for example yield, farm income, livestock performance, or food access). Assessments are comparable only when hazard, exposure, vulnerability, and the chosen loss object are defined together.
Figure 2.
Composition of agricultural climate risk: a climate hazard acts on exposed farm assets and on system vulnerability, and the outcome is a realized loss whose metric must be specified (for example yield, farm income, livestock performance, or food access). Assessments are comparable only when hazard, exposure, vulnerability, and the chosen loss object are defined together.
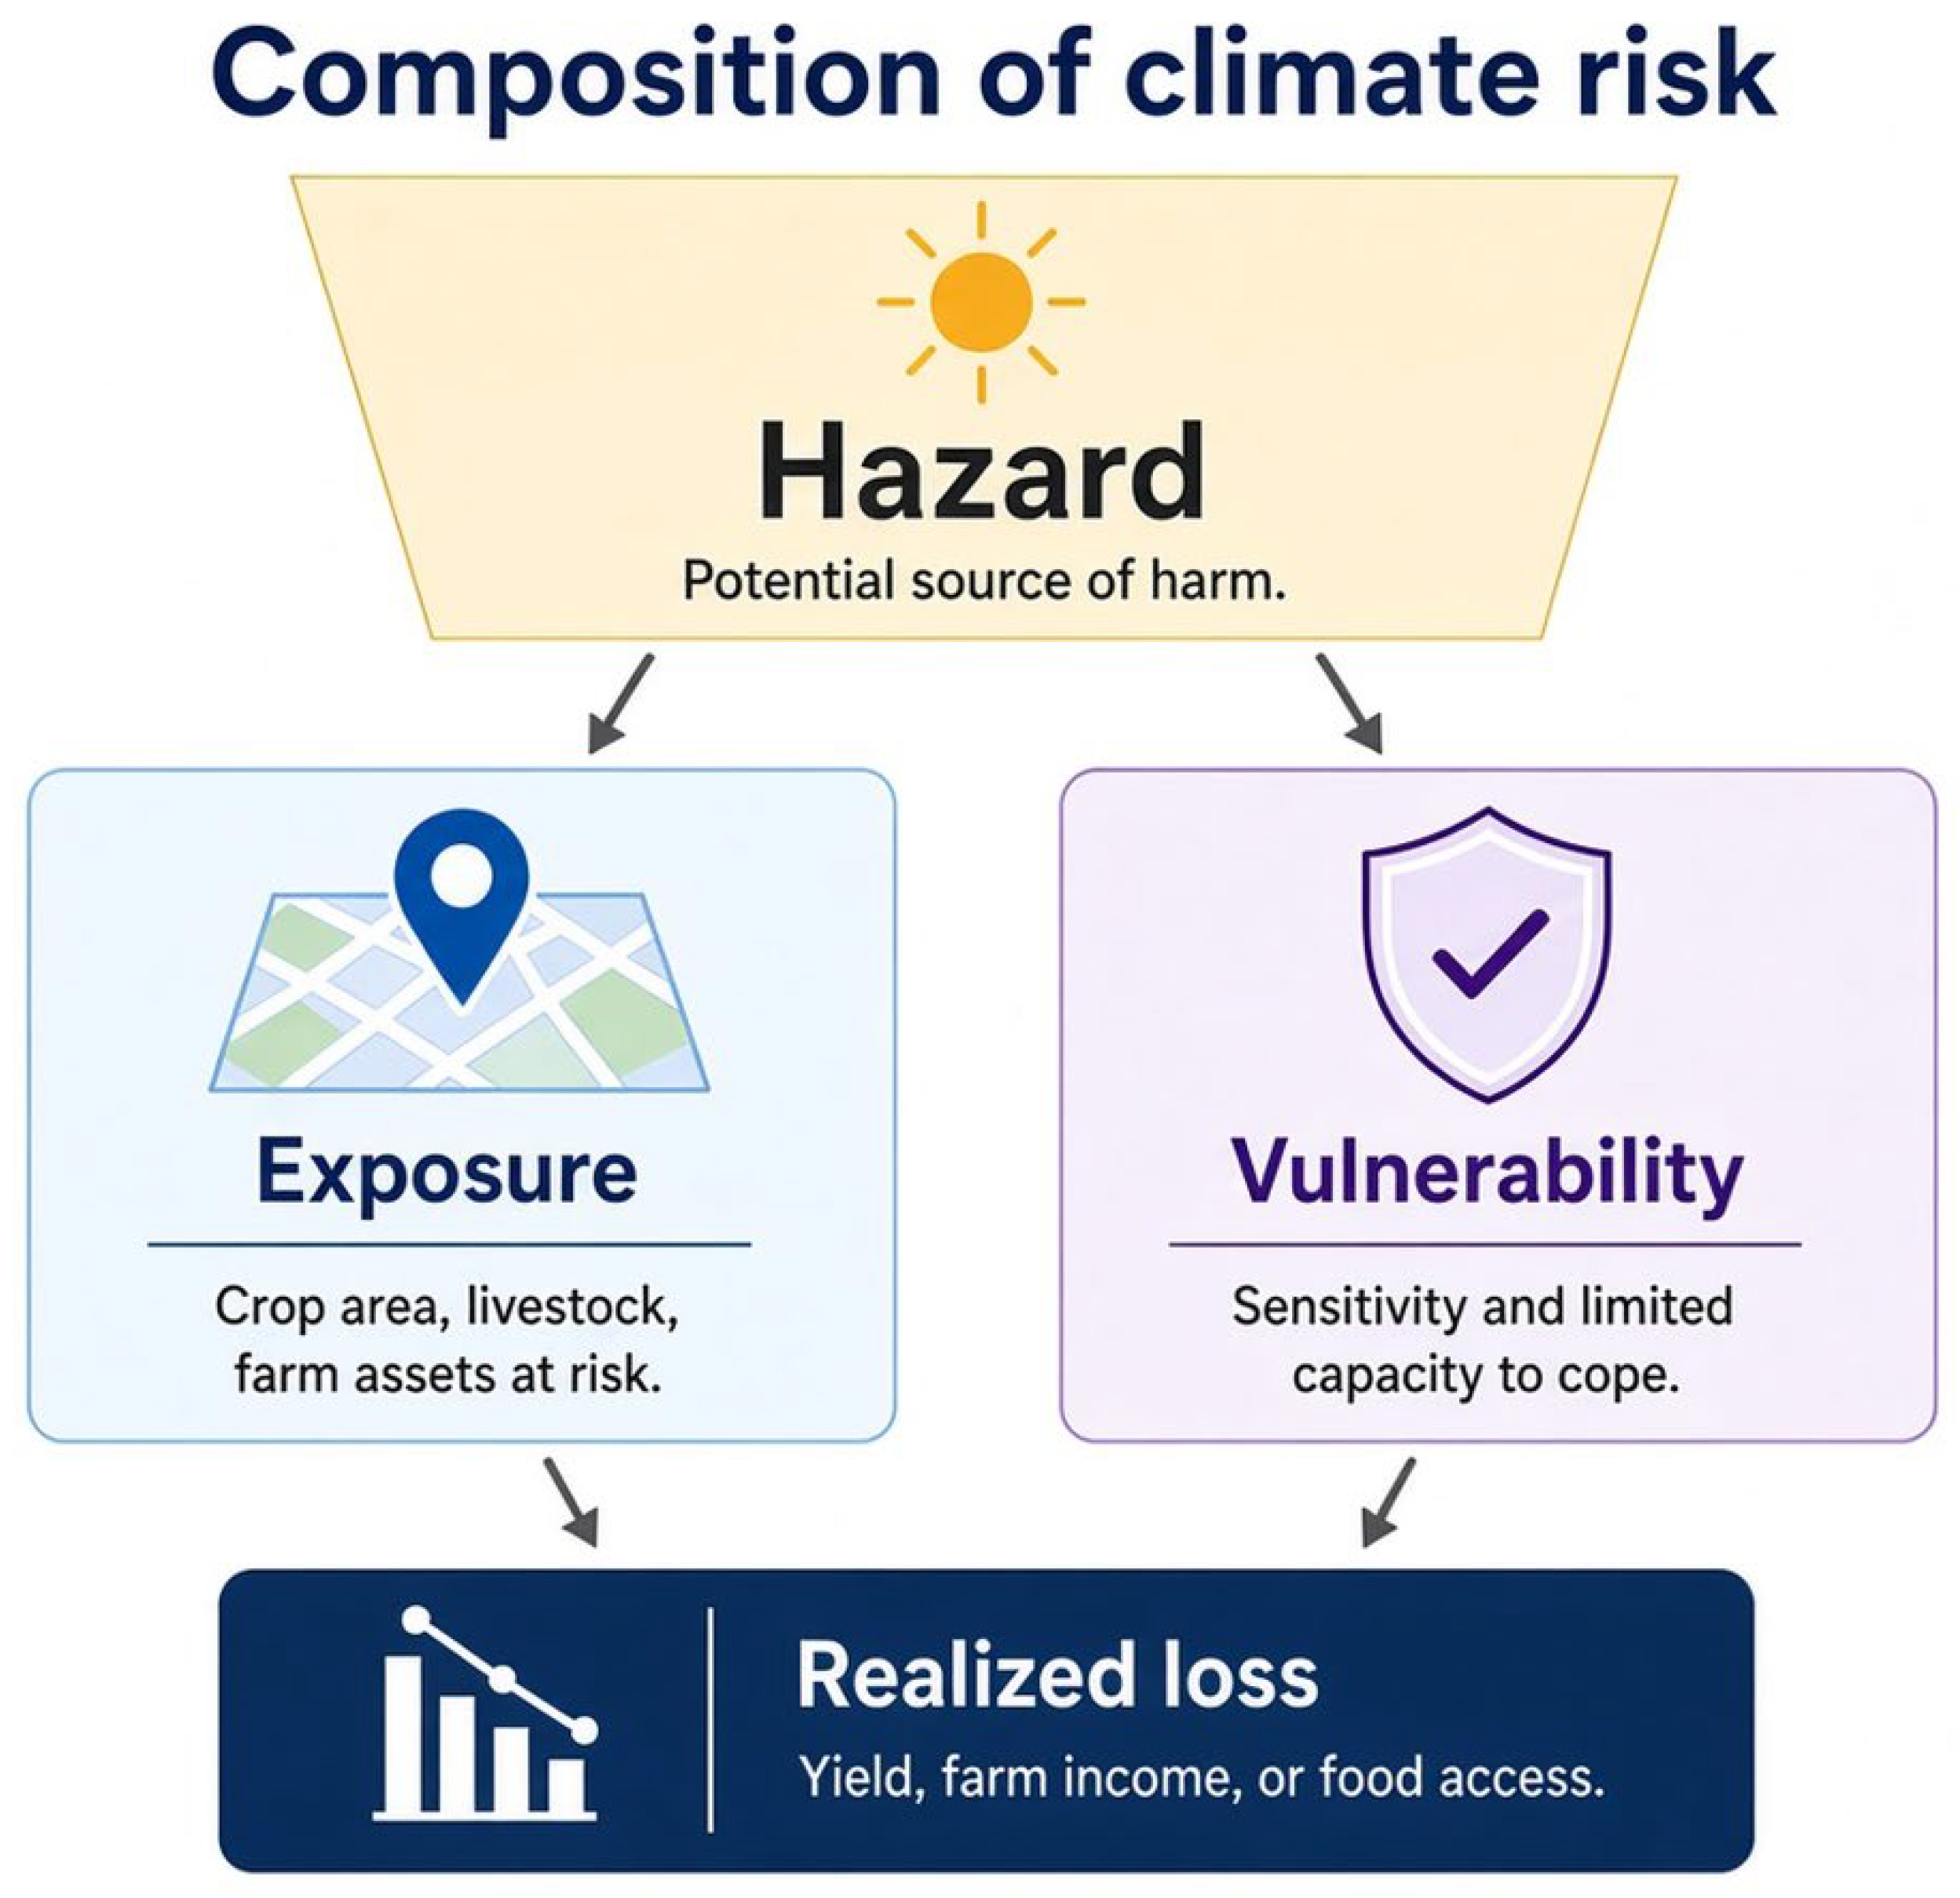
Figure 3.
Near and far assessment horizons for the same agricultural system, contrasting season-to-season variability and disaster risk management with multi-decadal climate change and adaptation of production systems.
Figure 3.
Near and far assessment horizons for the same agricultural system, contrasting season-to-season variability and disaster risk management with multi-decadal climate change and adaptation of production systems.
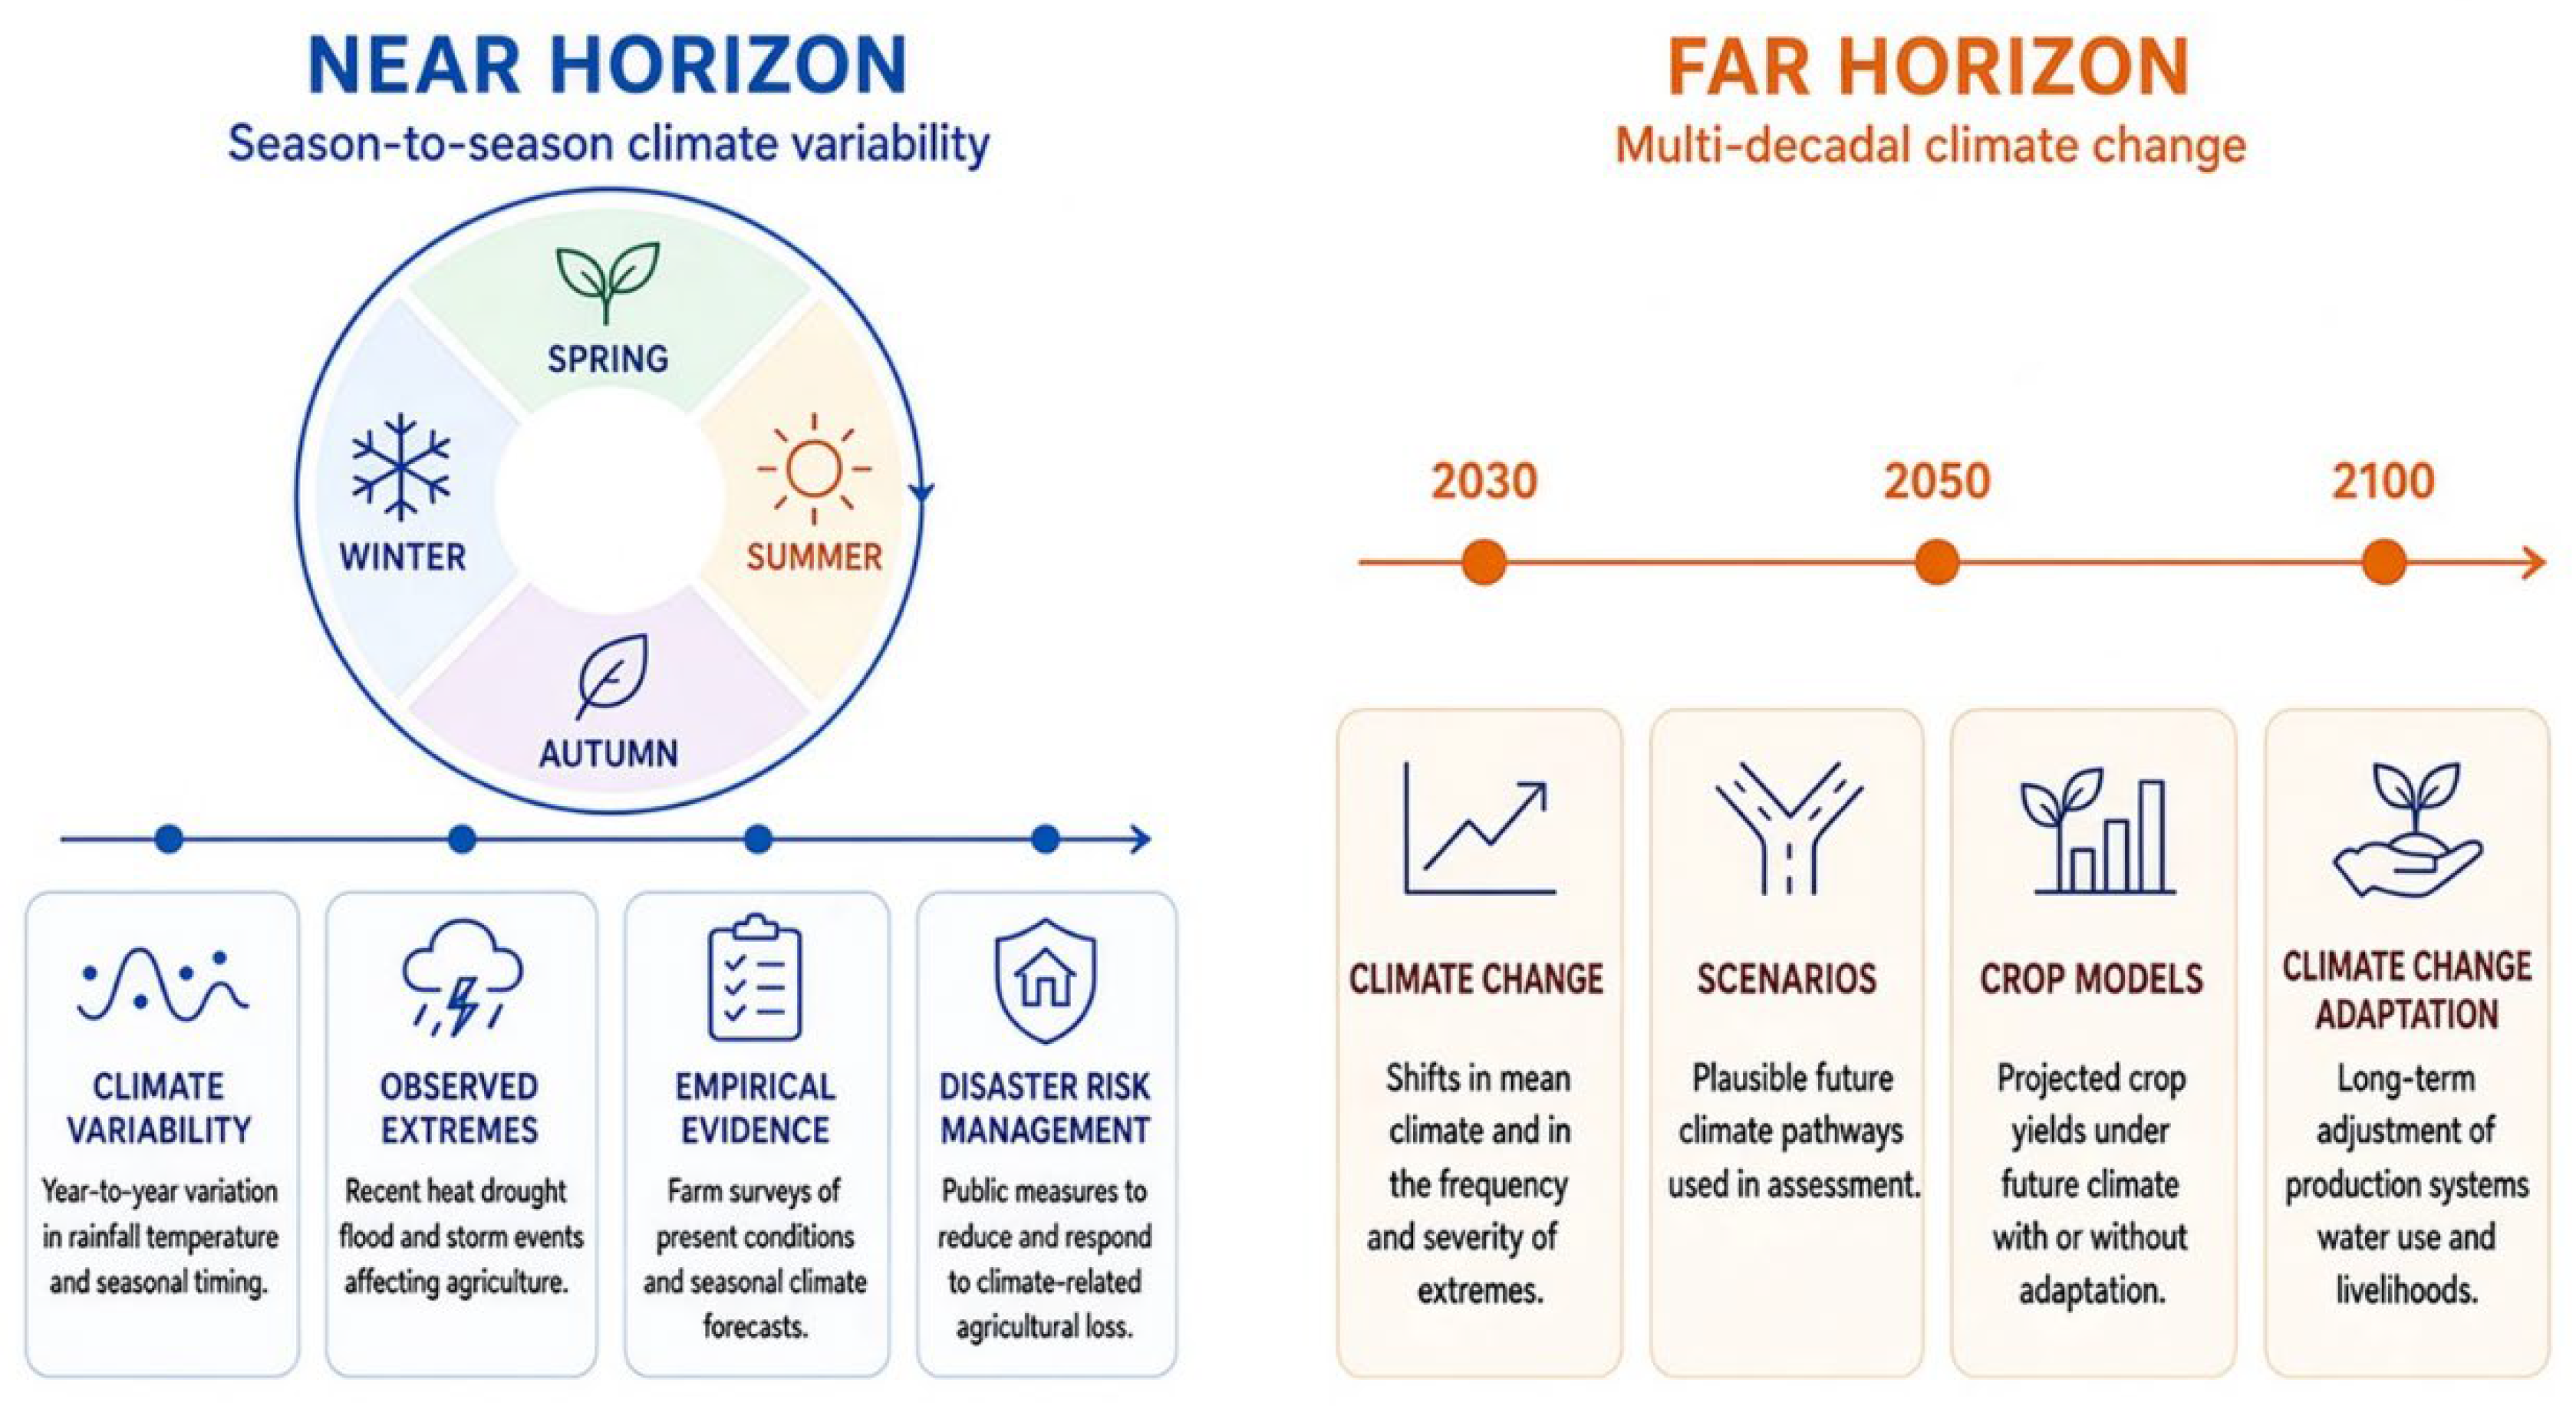
Figure 4.
Causal propagation of agricultural climate risk from biophysical stress to farm financial performance and food security.
Figure 4.
Causal propagation of agricultural climate risk from biophysical stress to farm financial performance and food security.
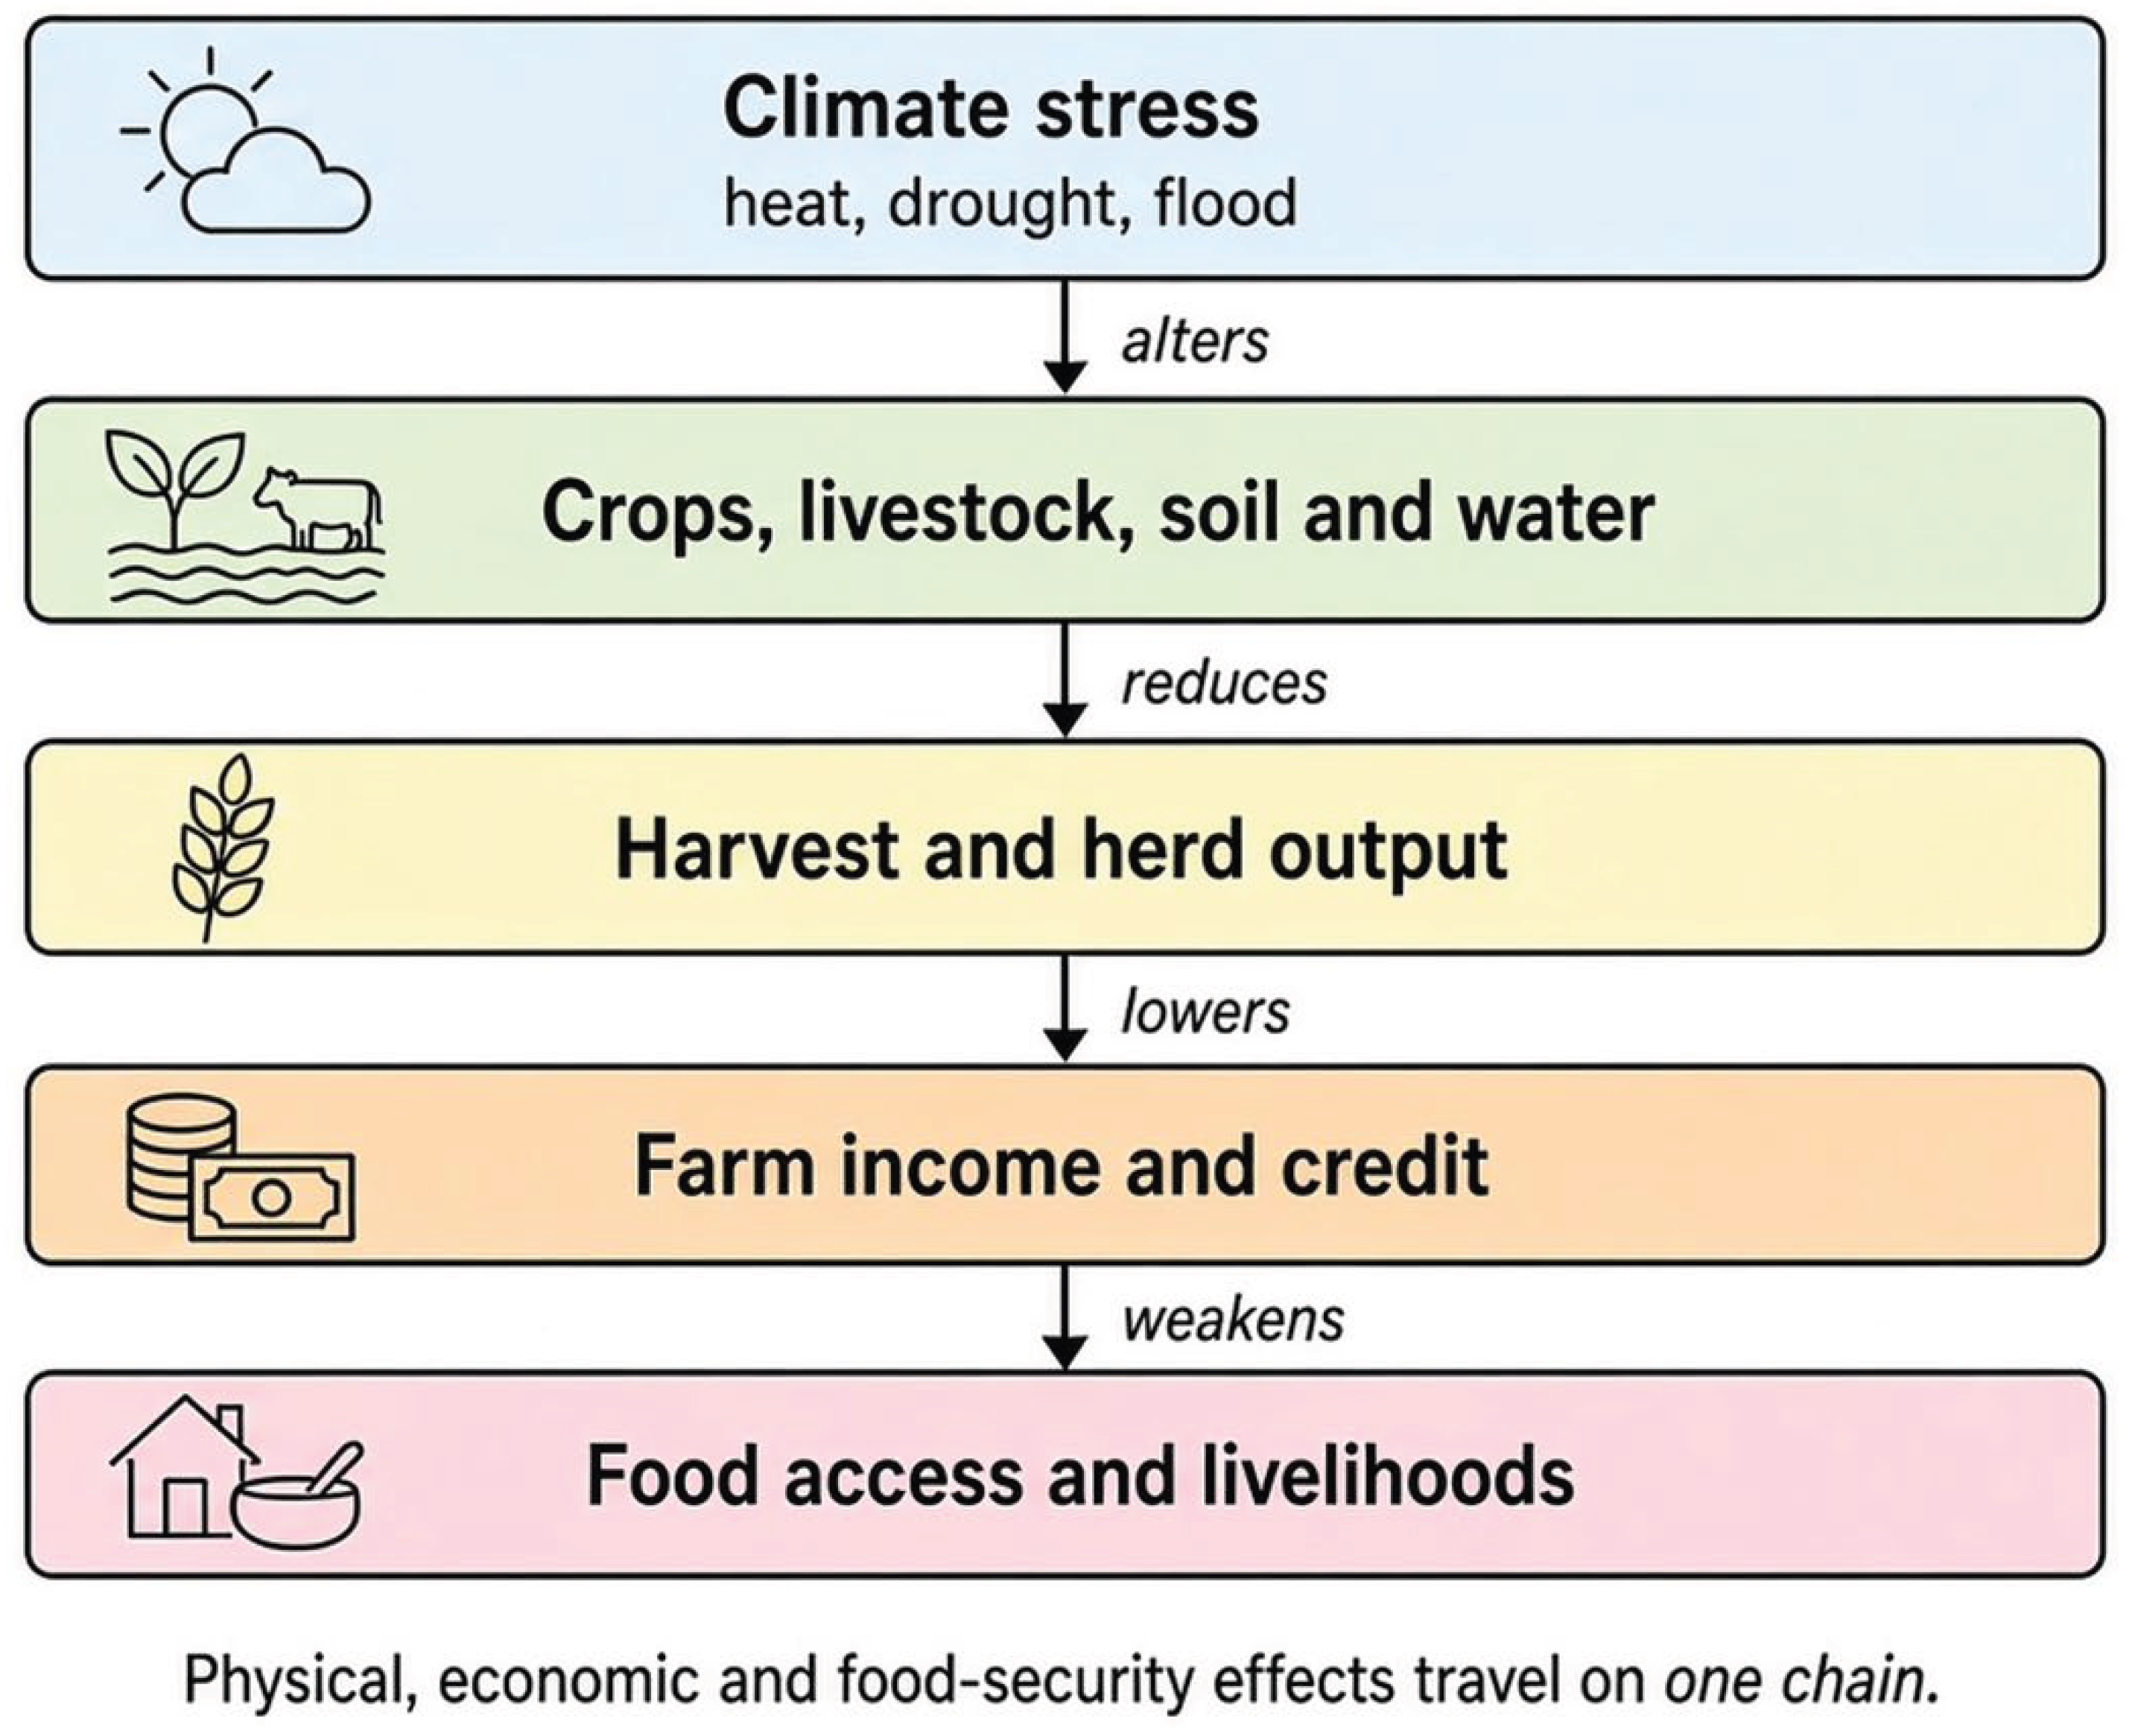

Table 1.
Main families of agricultural climate-risk assessment methods, the harm object each is constructed to quantify, and the temporal horizon, spatial unit, and metric they typically use. Results from different rows are not directly comparable unless the harm object, horizon, and unit coincide.
Table 1.
Main families of agricultural climate-risk assessment methods, the harm object each is constructed to quantify, and the temporal horizon, spatial unit, and metric they typically use. Results from different rows are not directly comparable unless the harm object, horizon, and unit coincide.
| Method family | Harm object | Typical horizon | Spatial unit | Typical metric |
|---|---|---|---|---|
| Process-based crop models | Crop growth and yield | Future scenarios against a historical baseline, with or without adaptation | Field to global grid | Simulated yield change |
| Statistical yield–weather models | Crop yield and agricultural revenue | Observed baseline and projections driven by climate ensembles | District | Yield or revenue distribution |
| Reduced-form crop emulators | Crop yield | Future scenarios | Spatially explicit grid | Probabilistic yield impacts and user-defined risk metrics |
| Threshold-based assessments | Harvest timing, livestock heat stress, disease, frost, income tail | Seasonal to future, depending on the threshold | Livestock numbers or crop area to national staple economy | Probability of exceeding an agronomic or economic threshold |
| Frequency and volatility indices | Production change | Observed variability | Regional, in rainfed systems | Frequency or volatility of production changes |
| Expert-based risk matrix | Impacts, adaptation, risk, and vulnerability | Varies | Local to regional, where crop simulation is unavailable | Qualitative risk ratings |
| Spatial maps and machine-learning rankings | Co-location of climatic stress, exposure, and social vulnerability | Mainly current conditions | Subnational to continental | Risk indices and hotspot classes |
| Farm household surveys | Farm household | Recent experience (near horizon) | Household | Perceived risk and reported practices |
| Financial metrics | Farm income, loan claims, water–energy use | Near horizon | Sector, farm, or loan portfolio | Income-at-risk, loan recoverability, and stochastic optimization |
| Seasonal decision-support software | Crop-management decisions | Coming season | Farm | Management options under forecast probabilities |
Disclaimer/Publisher’s Note: The statements, opinions and data contained in all publications are solely those of the individual author(s) and contributor(s) and not of MDPI and/or the editor(s). MDPI and/or the editor(s) disclaim responsibility for any injury to people or property resulting from any ideas, methods, instructions or products referred to in the content. |
© 2026 by the authors. Licensee MDPI, Basel, Switzerland. This article is an open access article distributed under the terms and conditions of the Creative Commons Attribution (CC BY) license.
Copyright: This open access article is published under a Creative Commons CC BY 4.0 license, which permit the free download, distribution, and reuse, provided that the author and preprint are cited in any reuse.