

Submitted:
02 November 2026
Posted:
03 November 2026
You are already at the latest version
Abstract
Tourists are increasingly using digital technologies to search for, book, stay and share about their experiences. Their environmental concern is generally not reflected in their actual travel behaviour. Digital technologies are increasingly influencing tourist decisions, but it is not clear whether they actually close the gap between pro-environmental attitudes and pro-environmental behaviour. This review looks at the mechanisms by which digital technologies can lead to changes in sustainable tourist behaviour, the strength of the evidence for each mechanism and when individual change results in net benefit at the system level. Following PRISMA 2020, we identify the digital mechanisms which lead to changes in sustainable tourist behaviour and assess the strength of the evidence for each. Scopus and Web of Science were searched for studies published between 2010 and 30 June 2026 with a supplementary citation search. A total of 156 studies were included and coded by touchpoint, design and outcome. They were graded for strength of evidence and synthesised thematically. The literature is very new with 95% of the studies published since 2020 and the vast majority (87%) reporting on stated intentions. Only 11 of the studies actually looked at a change in behaviour; these are largely field experiments in which the technology influenced behaviour at the moment of choice via real time feedback, digital defaults, recommenders, robot delivered prompts or app based rewards. Evidence for the use of social media, labels, immersive media and smart destinations is still emerging. AI agents can either promote or inhibit pro-environmental behaviour. Spillover, rebound and the technology’s own footprint are rarely measured. We propose a Technology-Mediated Sustainable Tourist Behaviour (TMSTB) model which links behavioural to system level outcomes and which sets six questions for future research.
Keywords:
smart tourism
; sustainable tourist behaviour
; pro-environmental behaviour
; digital nudging
; artificial intelligence
; real-time feedback
; rebound effect
; systematic review
1. Introduction
Tourism has fully recovered after the pandemic. International arrivals hit an estimated 1.52bn in 2025 (4% above 2024) and tourism export revenues reached a record $2.2tn (UN Tourism, 2026). In 2024 the sector accounted for around 10% of global GDP and 357m jobs (WTTC, 2025) and is referenced in the 2030 Agenda under targets 8.9, 12.b and 14.7 (United Nations, 2015). Its environmental cost is increasing faster than its efficiency. 2024 was the warmest year on record at 1.55 °C above pre-industrial levels (WMO, 2025) and we need a 42% reduction in global emissions by 2030 if we are to stay within the 1.5 °c limit (UNEP, 2024). Tourism emitted 5.2 Gtco2e in 2019 (8.8% of the global total) and over the previous decade emissions increased at 3.5% per year as demand grew at 3.8% per year, efficiency only improving by 0.3% per year (Sun et al., 2024).
Sustainable tourism (in the sense of taking full account of the economic, social and environmental impacts) is clearly the way forward (UNWTO and UNEP, 2005). The reality is that implementation is very much behind the ideal. Just 27% of the climate plans submitted have specific targets and none have reported any actual reductions (UN Tourism, 2024). So far, sustainable tourism has been about reducing the impact per trip or per room, not about reducing the absolute impact.
Absolute reductions are demand driven and hence demand driven by tourist behaviour. While 93% of travellers say they would like to make more sustainable choices (Booking.com, 2025), most leisure travellers don't in fact place any value on lower flight emissions when they are making their choice (Crosby et al., 2025). The attitude/behaviour gap is very much there. Environmental concern doesn't translate into behaviour as tourists are away from their normal routine and they don't typically pay for the resources they consume on holiday. Awareness campaigns make no difference in this respect, whereas changes to the structure of the decision do (Juvan and Dolnicar, 2014; Dolnicar et al., 2019). The real issue isn't so much what the tourist knows as how the choice is presented to them at the point of decision.
Digital technology is increasingly shaping those decisions. In 2024 68% of the world's population was online (ITU, 2024) and search, book, stay and share are all now mediated by platforms, apps, sensors and generative AI (Carvalho and Ivanov, 2024; Sigala et al., 2024). Field experiments have shown that digital tools can influence behaviour: real time feedback reduced hotel shower time by 25.8% (Pereira-Doel et al., 2025), pre-set offset amounts influenced the choices of over 11,000 airline customers (Berger et al., 2022), a conversational recommender successfully got tourists to avoid the busiest areas (Mitas et al., 2023) and guilt framed messages from a robot concierge led to increased towel and linen reuse in a randomised hotel trial (Alboqami and Agag, 2026). The same tools can also have the opposite effect. AI services and robots have been shown to reduce pro-environmental behaviour relative to human staff (Guan et al., 2025; Song et al., 2026) and frictionless, data driven travel can actually stimulate the very demand growth that negates any efficiency gains (Gössling, 2021). Whether digital technology is in fact closing the attitude–behaviour gap or actually widening the footprint and inequalities of tourism remains an open question.
There are three gaps in the literature which prevent it from answering the question. The first is that the evidence is scattered. The existing reviews either provide an overview of the whole field of smart tourism (Mehraliyev et al., 2020; Ye et al., 2020; Shasha et al., 2025), focus on a single sector (Gündüz Songur et al., 2023) or assess ICT without any behavioural framework (Gössling, 2021). There are reviews of nudges in tourism (Souza-Neto et al., 2022) and of AI-enabled nudging (Syah and Binesh, 2025), but we found no review that evaluated the behavioural evidence across the different digital technologies by study design and by outcome type. The second gap is that the studies stop at the individual. The vast majority of studies measure stated intentions or single choices and do not consider persistence, spillover, rebound or the technology's own footprint. A recent field study actually found that electricity consumption increased whilst water consumption decreased under the same intervention (MacAskill et al., 2026). The third gap is that the evidence is so very narrow. The smart tourism research is overwhelmingly concentrated in East Asia, Europe and North America with no country in Africa or Latin America in the top 10 most productive (Shasha et al., 2025). The research is also almost entirely focused on environmental behaviour with the social and economic aspects of smart tourism being almost entirely unexamined.
This review asks three questions:
RQ1. What are the mechanisms through which digital technologies are linked to sustainable tourist behaviour and how strong is the evidence for each?
RQ2. When do individual level behavioural gains translate into a net benefit for the system as a whole?
RQ3. How can these mechanisms and conditions be incorporated into a framework for research and practice?
It makes four contributions. To our knowledge it provides the first PRISMA-based, evidence graded synthesis of the empirical literature on digital technology and sustainable tourist behaviour (156 studies, 2010 to June 2026), disaggregating observed behaviour from stated intention. It develops the TMSTB model which rates each link and generates six future research questions. It proposes a net benefit test which balances the benefits of the behaviour against the costs of persistence, spillover, rebound and technology footprint. It also treats equity, ethics and SDG relevance as analytical dimensions. For destination managers, platform designers and policymakers it identifies which of the digital levers already have field evidence to support them (real time feedback, sustainable defaults, visitor redirection and well designed agent prompts) and which still require testing prior to investment.
2. Prior Reviews and the Contribution of This Review
Table 1 compares this review with the nearest earlier reviews. These cover the evolution and themes of smart tourism research, they look at one sector or they critique the ICT. None of the reviews we found assess behavioural evidence across the digital technologies and link that to system level outcomes.
Two clear patterns emerge. The bibliometric and systematic reviews show that the impact of technology on the tourist's perception and behaviour is by far the most researched theme in the smart tourism literature (Ye et al., 2020) and yet they make no inquiry as to whether that impact results in any gains in terms of sustainability. The reviews which do focus on sustainability either pre-date the current wave of AI and immersive technologies (Gössling, 2017) or are restricted to a single sector.
3. Method
This is a PRISMA 2020 statement compliant review (Page et al. 2021). Given the extreme heterogeneity of the study designs and outcomes, a meta-analysis was not feasible. The evidence has therefore been thematically synthesised and quality assessed by study design and outcome type. The review was not pre-registered.
3.1. Search Strategy
Two databases were searched. Scopus was searched in titles, abstracts and keywords using a string which combined three blocks of terms: tourism setting (e.g. touris*, hotel*, hospitality, destination*), sustainable behaviour (e.g. pro-environmental, sustainable behavio*, carbon offset*, food waste, overtourism, crowding) and digital technology (e.g. digital, smart, app, chatbot*, robot*, artificial intelligence, virtual reality, gamif*, nudg*, eco-feedback, recommender, social media, online booking, carbon label*). The Web of Science Core Collection was searched in the Topic field (titles, abstracts and keywords) with the same string. Both searches were restricted to English language journal articles published from January 2010 (the point at which smart tourism entered the academic literature) to 30 June 2026. All Web of Science records were exported (1,134 unique records from two exports made on the same day), of which 1,063 fell within the date range. Records in Web of Science which were not journal articles or not in English were removed prior to screening.
3.2. Eligibility Criteria and Study Selection
Studies were eligible if they (1) reported primary empirical research; (2) involved tourists, hotel guests, visitors or prospective tourists in a tourism, travel or hospitality setting; (3) examined a digital technology which either delivered or structured the intervention or was the exposure itself; and (4) measured an environmental, social or economic sustainability behaviour, intention or choice. Studies of employees, firms, residents or whole destinations; studies in which the technology was simply a means of measuring behaviour; non-digital interventions and reviews/conceptual papers were all excluded. Figure 1 illustrates the selection process. The searches returned 1,699 records within the date range (Scopus 636, Web of Science 1,063). Following the removal of 323 duplicates and 319 Web of Science records which were not journal articles (n=313) or not in English (n=6), 1,057 records were screened. Title screening excluded 816 (mainly due to them not being about tourist sustainable behaviour n=383, not being in a tourism context n=269 or not involving digital technology n=110). A further 94 were excluded at the abstract screening stage (mainly due to digital technology not being the exposure n=29, no sustainable behaviour outcome measured n=27 or participants not being tourists/guests/visitors n=24). This left 147 studies. The full texts of these were then assessed against the eligibility criteria with particular attention to the design, sample and outcome of those that appeared to meet the strong evidence criteria (Section 3.3). Two were excluded at this stage: one in which the field trial described in the abstract was not actually present in the full text and one in which the field experiment was a computational evaluation of route quality with no measurement of tourist behaviour. This left 145 studies (125 from Scopus, 81 of which were also in Web of Science and 20 from Web of Science only). Citation searching identified 11 further studies published by 30 June 2026 which were not picked up by the database searches (mainly because their titles and abstracts did not contain the search terms), bringing the total to 156 studies. Two authors independently screened all the records first on title and then on abstract and then compared their decisions. Any disagreements were discussed until a consensus was reached and the same process was followed for the full text screening, the coding of each study and its evidence grade. The decision and reason for each record (with the Scopus and Web of Science records merged into a single list) is provided in the Supplementary Material.
3.3. Data Extraction and Evidence Grading
For each study the touchpoint, sustainability dimension, design and outcome type were all coded. Outcome type is used to differentiate between observed behaviour (e.g. metered water use, recorded bookings) and hypothetical choice/stated intention/self-report as intentions only partly translate into behaviour (Sheeran and Webb, 2016).
Evidence was graded in two stages, following the logic of GRADE which rates a body of evidence on the basis of risk of bias and directness (Guyatt et al., 2008). At the study level three criteria were applied. C1 (directness): the study involved real tourists/guests in a tourism context. C2 (design): it was a field, quasi-field or incentive compatible experiment which minimises selection and hypothetical bias (Shadish et al., 2002; Harrison and List, 2004). C3 (outcome): it measured actual behaviour rather than self-report which is known to overstate the level of sustainable behaviour in tourism (Juvan and Dolnicar, 2016; Morales et al., 2017; Viglia and Dolnicar, 2020). Studies that met all three criteria and were confirmed against the full text were deemed 'strong' and all others were 'emerging'. 'Strong' in this context means that the study meets these operational criteria; it does not in any way imply high certainty in the full GRADE sense which also takes into account inconsistency, imprecision and publication bias and was not applied. Table 3 gives the primary threat to validity of each of the strong studies. At the link level each link in the TMSTB model received the highest grade of any of the studies that supported it and links with no tourism evidence were graded as untested. A sensitivity analysis was also carried out in which the links were graded only if they had at least two strong studies (see Table 6).
The studies were then thematically synthesised (Thomas and Harden, 2008) into the themes of Section 5 and the TMSTB model was developed abductively from the patterns and gaps.
3.4. Characteristics of the Included Studies
The field is very new and growing rapidly. 148 of the 156 studies (95%) were published from 2020 onwards and 98 of them were published in 2025 and the first half of 2026. Surveys are by far the most common (n=86), with scenario, online or lab experiments (n=38) and field or quasi-field experiments (n=18) coming next; the remainder (n=14) are qualitative or mixed methods. The vast majority of the studies measure intention or self report (n=136; 87%) with only 13 measuring actual behaviour and 7 measuring hypothetical choice. The evidence is overwhelmingly environmental (n=137); 23 look at social and 4 at economic outcomes. As a study can be looking at more than one of these dimensions the above figures overlap: 25 studies look at at least one of the social or economic outcomes and 2 of those look at both.
11 studies are rated as strong and 145 as emerging (Table 2). The strong evidence is predominantly in the areas of in-stay feedback (5 studies) and visitor flow tools (2 studies), with one study each in the areas of booking defaults, AI agents, apps and immersive media. None of the 60 studies on social and digital media or the 7 on smart destinations are rated as strong. The strong studies are presented as an evidence matrix in Table 3.

Table 2.
Included Studies by Touchpoint and Strength of Evidence (n = 156).
| Touchpoint | Studies | Typical technologies | Observed behaviour | Social or economic outcome | Strong |
| Booking interfaces, labels and choice prompts | 14 | Emission displays, defaults, green badges, digital nudges | 2 | 0 | 1 |
| In-stay feedback, metering and smart hotels | 11 | Real-time feedback, smart meters, smart-room technology | 5 | 0 | 5 |
| AI agents, chatbots and robots | 25 | Chatbots, service robots, generative AI, AI recommendations | 1 | 2 | 1 |
| Social and digital media | 60 | User-generated content, influencers, short video, live streaming | 1 | 15 | 0 |
| Visitor-flow tools and recommenders | 5 | Recommenders, real-time crowding information, queue systems | 2 | 4 | 2 |
| Gamification and apps | 11 | Eco-gamification, reward apps, mobile follow-up | 1 | 1 | 1 |
| Immersive media | 23 | VR, AR, metaverse, digital twins | 1 | 2 | 1 |
| Smart destinations and smart tourism experience | 7 | Smart destination features and experiences | 0 | 1 | 0 |
| Total | 156 | 13 | 25 | 11 |
Note: All columns count studies. The social or economic column counts studies with at least one social or economic outcome (25); because two studies address both, it is lower than the sum of social (23) and economic (4) outcomes in Section 3.4. Source: Authors' synthesis of the included studies.
Table 3.
Evidence Matrix of Studies Graded Strong.
| Study | Setting, design and sample | Technology | Observed outcome and effect | Main threat to validity |
| In-stay feedback and metering | ||||
| Warren et al. (2017) | Australia; four cottages; intervention vs control guests, not randomised; 759 guests, 304 days | Smart meters with eco-feedback and persuasive communication | Electricity, gas and water use significantly lower; satisfaction unaffected | Non-random assignment; bundled intervention |
| Tiefenbeck et al. (2019) | Switzerland; six hotels, 265 rooms; treatment vs control rooms; 19,596 showers | Smart shower meter | Shower energy use −11.4% | One behaviour; no follow-up after the stay |
| Pereira-Doel et al. (2019) | Spain; one city hotel; covert experiment, display vs sensor-only rooms; 1,962 showers | Shower feedback display | Shower time −12.1% | One hotel, 20 rooms; assignment method not described by the authors |
| Pereira-Doel et al. (2025) | Denmark, Spain, UK; six accommodations; covert true experiment; 17,500+ showers | Real-time shower timer ± messages | Water runtime −25.8% (95% CI 8.2–40.0%); messages added nothing | One behaviour; no follow-up |
| MacAskill et al. (2026) | Australia; one ecolodge; pre–post quasi-experiment; 1,139 guest nights | Signage with real-time feedback | Water −13.8%, hot water −31.5%; electricity +7.3% (n.s.) | Single site; time-based comparison |
| Booking, agents and apps | ||||
| Berger et al. (2022) | European airline website; six default levels assigned by quota, not fully randomised; 11,159 customers | Pre-set carbon offset amount | 43% kept the default; effect shrank with cost and approached zero near €800 | Only customers already offsetting; one booking |
| Alboqami and Agag (2026) | China; eight hotels; cluster-randomised field experiment, 12 weeks | Robot concierge messages | Guilt framing raised towel and linen reuse and housekeeping opt-outs | Few clusters limit inference |
| Mundi (2025) | India; randomised controlled trial, computer-generated assignment; 180 Indian tourists on 7-day trips abroad | Mobile app with financial rewards vs standard app | More frequent and varied sustainable activities and higher local spending during and after a 3-day incentive period (difference-in-differences, p < 0.001) | Activities and spending logged by participants in the app (receipts uploaded); only the rewarded group had an incentive to log |
| Visitor flows and real-time information | ||||
| Mitas et al. (2023) | Netherlands; holiday parks; randomised 2 × 2 field experiment | Conversational vs passive recommendations | More movement near less-visited attractions; experience unaffected | Short stays; no follow-up |
| Wielenga et al. (2024) | Netherlands, Wadden Sea; field observation | Tidal information pillar with real-time signage | About half of visitors who read it turned back at high tide | No control group; readers self-selected |
| Immersive media | ||||
| Coghlan (2022) | Australia; Great Barrier Reef tour boat; quasi-experiment with conditions on alternate days; 64 tourists (34 game, 30 video) | VR game vs 360° VR video | Most chose the AU$10 conservation donation as their thank-you gift in both groups; choice of gift did not differ significantly (χ²(2) = 4.68, p = .096) | Small sample; alternate-day assignment; immersive control condition |
Note: All studies meet criteria C1–C3 (Section 3.3). n.s. = not significant; CI = confidence interval. Source: Authors' synthesis.
4. Conceptual and Theoretical Background
4.1. Smart Tourism and Sustainable Tourist Behaviour
Smart tourism is an ecosystem in real time where data from the tourist, the provider, the infrastructure and the environment are sensed, processed and then fed back via apps, agents and immersive media (Buhalis and Amaranggana, 2015; Gretzel et al., 2015). It has three layers: the sensing layer (IoT sensors, GPS, apps and social media which generate data on behaviour and the environment), the processing layer (AI which takes that data and turns it into forecasts, recommendations and alerts) and the interaction layer (the apps, agents and displays through which the tourist receives and responds to the system). For the purpose of promoting sustainable behaviour it is the interaction layer that is of most importance as it is in this layer that the tourist is presented with prompts, defaults and information at the point of choice. The governance of this layer determines whose interests the data serves (Gretzel et al., 2015) and in this layer the tourist is a co-creator rather than a passive user (Femenia-Serra et al., 2019).
Sustainable tourist behaviour covers environmental (energy and water conservation, low carbon travel), social (respect for local people, avoiding the most crowded sites) and economic (buying local) aspects.
4.2. Theoretical Foundations
Four families of theory cover the various stages in one pathway (Figure 2). Adoption theories explain exposure: people will act on tools they find both useful and easy (Davis, 1989) and on information they find credible (Sussman and Siegal, 2003). Normative theories explain obligation: the theory of planned behaviour (Ajzen, 1991), value-belief-norm theory (Stern, 2000) and the norm activation model (Schwartz, 1977) all relate awareness of consequences and social norms to personal norms. Behaviour-design theories explain action: nudges can change behaviour by changing the choice architecture without in any way restricting the options (Thaler and Sunstein, 2008), behaviour requires motivation, ability and a prompt at the same time (Fogg, 2009) and external rewards can actually undermine intrinsic motivation (Deci et al., 1999). System level theories explain whether the individual gains add up: efficiency gains can be counteracted by induced consumption (Sorrell and Dimitropoulos, 2008) and innovations only matter if they reconfigure the wider regime (Geels, 2002).
There is no one theory that covers the entire pathway. Adoption theories will tell you who is exposed but not why exposure leads to a change in behaviour. Normative theories will tell you about the intentions of people but not about actual behaviour. Behaviour-design theories will explain the behaviour but not the aggregate impact. System theories will explain the aggregate impact but not the individual decision. TMSTB therefore brings the theories together rather than treating them as alternatives. Table 4 shows which of the links in the model each theory is responsible for. A digital intervention can therefore succeed on one link and fail on the next (e.g. it may be widely adopted but have no effect on intentions, or it may change behaviour but result in more travel).
Table 4.
Theoretical Foundations of the TMSTB Model.
| Theory | Core constructs | TMSTB link explained | Grade of link |
| Technology Acceptance Model (Davis, 1989) | Perceived usefulness; ease of use | Touchpoint → exposure; digital literacy as individual moderator | Emerging |
| Information Adoption Model (Sussman and Siegal, 2003) | Argument quality; source credibility | Information activation → behaviour | Strong (feedback, real-time information); emerging (labels) |
| Theory of planned behaviour (Ajzen, 1991) | Attitude; subjective norm; perceived control | Individual moderators; attitude–behaviour gap | Emerging |
| Value-belief-norm theory (Stern, 2000); norm activation model (Schwartz, 1977) | Values; awareness of consequences; personal norm | Normative activation → behaviour | Strong (one study) |
| Emotion and presence research (Ahn et al., 2014; Nelson et al., 2020) | Presence; moral and negative emotion | Affective activation → behaviour | Emerging |
| Nudge theory (Thaler and Sunstein, 2008); Fogg (2009) | Defaults; prompts; motivation and ability | Design moderators; timing of touchpoints | Strong |
| Self-determination theory (Deci et al., 1999) | Intrinsic motivation; crowding out | Reward design; persistence | Strong (short term); persistence untested |
| Rebound effect (Sorrell and Dimitropoulos, 2008); transitions (Geels, 2002) | Induced consumption; niche and regime | Behaviour → system outputs; feedback loop; context | Untested; feedback loop emerging |
Source: Authors' synthesis.
4.3. The Post-COVID-19 Context
The pandemic has accelerated the uptake of contactless and app-based services (Sigala, 2020) and has demonstrated just how rapidly tourism demand and its impacts can shift (Gössling et al., 2021). Adoption is not necessarily the same as sustainable behaviour and the shift has certainly deepened the exclusion of those who don't have access to digital technologies. The post-pandemic digital environment is therefore treated as a contextual condition within the TMSTB model.
5. Thematic Synthesis
5.1. Technology as an Enabler of Pro-Environmental Behaviour
5.1.1. Feedback, Carbon Information and Defaults
Real time feedback during the stay has the most evidence in this review. Smart shower meters reduced energy consumption by 11.4% in six Swiss hotels where guests had not opted in (Tiefenbeck et al., 2019). A covert field experiment using shower feedback devices reduced shower time by 12.1% (Pereira-Doel et al., 2019) and by 25.8% across six properties (Pereira-Doel et al., 2025) with the addition of persuasive messages making no difference. In an Australian ecolodge, signage with tablet and QR code feedback reduced water use by 13.8% (MacAskill et al., 2026). In self contained cottages, the use of persuasive communication in conjunction with smart meter eco-feedback reduced guest use of electricity, gas and water without any impact on satisfaction (Warren et al., 2017). Information alone (e.g. a leaflet on water scarcity) did not result in any reduction in use (Bas-Sarmiento et al., 2025).
These findings are in line with behaviour design theory. Real time feedback makes consumption visible at the point of consumption, acts as a prompt when both motivation and ability are present (Fogg, 2009) and operates without guests having to opt in or pay. Static information on the other hand comes either before or after the decision and competes with the hedonic aspects of the holiday. The lack of any additional effect from the persuasive messages suggests that once consumption is made visible, telling the guest why they should save makes very little difference (Pereira-Doel et al., 2025).
The information available at the point of booking is weak. Tourism carbon labels are rarely designed to influence choice (Gössling and Buckley, 2016). Emission labels and green badges do have an effect on hypothetical choices and booking intentions (Assaker and O'Connor, 2023; Godovykh et al., 2024; Meske et al., 2024; Khan et al., 2025) but the majority of leisure travellers don't care about lower emissions. In a choice experiment based on Google Flights, both business travellers and a subset of leisure travellers (approx 42%) who were emissions conscious were willing to pay for lower emissions, the price conscious majority were not (Crosby et al., 2025). Expressing emissions in terms of tangible equivalents rather than kg of CO2 actually reduced the intention to book high emission flights (Boeuf and Flipo, 2026). Badges work primarily when they are credible; perceived credibility increased green image and inspiration which in turn predicted booking intention (Khan et al., 2025). A working paper using real US booking data found that emissions displays made people about 22% more responsive to differences in emissions (Lohawala and Teng, 2026) (this is yet to be peer reviewed). So at the point of booking the information may work for a motivated minority but will require a structural lever (e.g. a default) to reach the majority.
Changing the default is more powerful. Of the over 11,000 airline customers who opted to offset, 43% simply went with the pre-set amount (Berger et al., 2022). The effect diminishes as the default cost increases and it approaches zero at around €800. The non-digital evidence is equally clear in that defaults and shared savings have an impact on behaviour whereas awareness appeals do not (Araña and León, 2013; Dolnicar et al., 2019). The same is true of the nudges in the online survey trials with students where no increase in actual offset purchases was observed in either of the two randomised trials (Tyers, 2018). We don't know whether these changes are sustained beyond a single stay or booking as none of the studies have followed up with their participants.
5.1.2. Gamification
Gamification generally has positive but context dependent effects (Hamari et al., 2014). The most robust evidence in the tourism literature comes from a randomised trial in which tourists who were given an app which provided financial rewards for engaging in environmentally friendly activities engaged in more such activities and spent more with local businesses than those who were given the standard app (mundi, 2025). The effect was still present for the two days after the rewards had ended (the activities were self reported by the participants). A hotel quasi-experiment also found a link between gamification affordances and green behaviour (Wang and Guo, 2025). Elsewhere, satisfaction with a gamified recycling app predicted actual recycling (aguiar-Castillo et al., 2019) but there is a risk that prize expectations can have a negative effect (Aguiar-Castillo et al., 2019) and gamification seems to be more effective at initiating a behaviour than at sustaining it. Both of the latter studies are reliant on self report and there is also the concern that rewards may undermine intrinsic motivation (Deci et al., 1999). A wildlife tour which used web and mobile follow up had very little impact on conservation action three months later apart from one social media action (Wheaton et al., 2016). Gamified and app based tools can therefore be effective at getting people to start a behaviour, but whether that effect lasts beyond the rewards is untested.
5.1.3. Social Norms, Agents and Robots
Descriptive norms are a powerful tool for influencing conservation behaviour. In a hotel setting, cards which simply described what previous guests had done in the same room (i.e. had they reused their towels) were very effective at increasing towel reuse (Goldstein et al., 2008). Digital channels are perfectly suited to deliver such normative information at the point of choice. The most robust evidence comes from a 12 week cluster randomised trial in Chinese hotels where guilt framed messages from a robot concierge (i.e. messages which implied that the guest would be guilty of not reusing their linen) led to significantly higher levels of towel and linen reuse and housekeeping opt-outs than neutral messages (Alboqami and Agag, 2026) via the mechanism of anticipated guilt and perceived social presence. Other work has looked at intention. Social feedback from a virtual assistant was found to increase normative intention (Tussyadiah and Miller, 2019) and green influencers were found to increase support for environmental initiatives (Ding et al., 2026).
The evidence on robots and AI agents is split. There are surveys which find a link between interactive robots and anthropomorphic chatbots and increased levels of reported pro-environmental behaviour. Interaction with service robots was found to increase guests' psychological ownership of the hotel, which in turn predicted pro-environmental behaviour (Duan et al., 2025). Interaction with chatbots was also linked to a greater willingness to engage in pro-environmental behaviour via hedonic motivation and the positive experience of using the chatbot (Singh and Kunja, 2026). Spoken robot feedback was found to be superior to on-screen text in some cases (Chang et al., 2025). On the other hand there is evidence that AI services can have the effect of reducing consumer social arousal and so reduce pro-environmental behaviour (Guan et al., 2025). Human service was found to outperform robot service (Song et al., 2026) and diners were found to waste more food when served by robot chefs (Wen and Huang, 2026). Replacing staff with AI may therefore have the effect of undermining the social accountability which underpins norms, unless the agent is specifically designed to do otherwise.
Social and digital media constitute the largest group of studies (60) and are all classified as emerging as they are based on surveys and scenarios. They are linked to stronger pro-environmental intentions (e.g. Han et al., 2018; Hussain et al., 2025) but the same media can also be used to normalise high-impact behaviour. Social media use is only weakly associated with overtourism via concentrated tourist flows (Song and Wondirad, 2023) and exposure to food content is shown to lead to conformity and irrational food consumption which in turn leads to waste (Zhang et al., 2025). Platforms are also able to use behavioural data to predict and influence behaviour (Gössling, 2021). Whether media exposure actually leads to a change in behaviour is as yet untested.
5.2. Ai-Driven Personalisation and Visitor Flows
Recommender systems have a huge influence on what tourists see and what they choose (Borràs et al., 2014). They can already take into account transport mode and crowding (Zheng et al., 2020), but the objectives of the platform are driven by commercial conversion and there has been no real-world testing of sustainability-weighted recommendations. The strongest evidence is around crowding and access. In a field experiment using a conversational recommender, tourists who were given recommendations to go to less-visited areas spent significantly more time in those areas and significantly less time in the more crowded areas, with no diminution in their level of satisfaction (Mitas et al., 2023). In the Wadden Sea there was a tidal information pillar which provided real time signage and about half of the visitors who read it simply turned around at high tide (Wielenga et al., 2024). Decoy options have been shown to have a greater impact on where people go than when (Chvirova et al., 2026) and access to real time crowding information on social media has been shown to increase willingness to change plans (Shen, 2025). It is not known whether the redistribution of people simply just moves the crowding to another location. Reservation and dynamic pricing systems may well leave those tourists who don't have a smartphone or are not digitally literate with the least desirable time slots (Minghetti and Buhalis, 2010).
Conversational agents can also extend their influence beyond the trip itself. A chatbot which was used to prompt tourists to engage in pro-environmental behaviour whilst on holiday was found to lead to increased use of sustainable transport at home (Majid et al., 2026). The control group in that study had not visited the destination and the data was self reported.
5.3. Digital Platforms and Immersive Media
IoT sensors allow for the continuous monitoring of resource consumption, air quality and levels of crowding (Novera et al., 2022) but in the main they are of benefit to the manager rather than the tourist. Where metres are linked to guest feedback they will lead to reduced resource use (Section 5.1.1); in the absence of such guest feedback the benefit is largely operational (e.g. leak detection). When smart water meters were providing feedback to the establishment rather than to the guest themselves, water use did not decrease (Padrón-Fumero et al., 2025).
AR is increasingly being used at heritage sites (tom Dieck and Jung, 2018) but the link to actual conservation behaviour has not been explored. In the tourism context 23 studies have looked at the relationship between immersive media and pro-environmental values/behaviour and in almost all cases the research has been conducted via survey or scenario experiment (e.g. Su et al., 2024; Zhu et al., 2025). The only field study to have a measured outcome compared a VR game with a VR video on reef tours and recorded the passengers' choice of a conservation donation as a thank you gift (Coghlan, 2022). In both the VR game and the VR video condition the majority of passengers chose the donation and the choice of gift did not differ significantly between the two groups (p = .096). As both conditions were immersive the study does not allow for any dissection of the effect of immersion. The results from other experiments are mixed. One lab study found that VR reduced paper use (Ahn et al., 2014) and a full VR experience with a negative framing led to the highest level of conservation donations (Nelson et al., 2020). In a field experiment however VR made no difference to conservation behaviour as compared to 2d video (Banerjee and Ferreira, 2024). The VR viewers in that study did engage more with the conservation content online three months later. Whether immersion leads to action rather than avoidance and whether it is justified in terms of its cost and footprint is still very much an open question.
5.4. Barriers, Paradoxes and System Effects
5.4.1. Spillover and Rebound
Efficiency gains won't lead to lower absolute impact if they are offset by increased consumption (Sorrell and Dimitropoulos, 2008). Aviation is a perfect example of this: efficiency has improved dramatically over the years, yet total emissions continue to climb (Peeters et al., 2016; IATA, 2025). The first tourism field evidence of a within-stay version has now emerged: guests reduced their water consumption in response to feedback, but their electricity consumption increased by 7.3% (not significant) (MacAskill et al., 2026). There is no tourism study that has looked at rebound in terms of travel frequency or hotel occupancy. Both are entirely plausible in fact. Digital booking reduces the time and search costs of travel and smart room efficiency could help hotels to achieve higher occupancy, so it's entirely possible that the absolute level of consumption would be unchanged even if consumption per stay had fallen. To measure these effects you need data at the destination or firm level rather than the individual guest level.
5.4.2. Equity, Privacy and Governance
Digital interventions are predicated on the assumption of smartphones, data and digital skills. 2.6 billion people are still off the grid (ITU, 2024) and of course there are persistent inequalities in both skills and benefits even where access does exist (Minghetti and Buhalis, 2010; van Deursen and van Dijk, 2019). Three groups are at particular risk:
- Older tourists (who may prefer the human element and thus be amenable to being excluded from the app-only information, timed entry and the eco incentives)
- Low income travellers where device/data/roaming costs, app-gated discounts and dynamic pricing can turn sustainable travel into a premium product.
- Tourists with low digital literacy or language barriers (where the interface and consent flows are too complex) simply won't use it. You can't nudge someone who doesn't understand the tool.
Equity sensitive design therefore requires non-digital channels for essential services, defaults that work without any user action required, multilingual and low bandwidth interfaces and monitoring of uptake by tourist segment. None of the robust studies report effects by age, income or digital literacy.
Personalisation is also predicated on data. In a survey of 685 travellers it was found that those with privacy concerns were still happy to share their behavioural data, whilst the willingness to share biometric data was contingent on the expected benefits (Ioannou et al., 2020); trust in the provider actually diminishes the impact of privacy concern on disclosure (Ioannou et al., 2021). Personalised sustainability nudges will therefore be likely to reach only those who trust the provider. Opaque algorithms will of course raise issues as to who is actually deciding what is 'sustainable' and whether the rankings can be greenwashed, and monitoring for sustainability can easily become surveillance (Kitchin, 2016; Gössling, 2021). Privacy by design, data aggregation by default, independent auditing of the sustainability rankings and restrictions on secondary use would all be in line with the governance aspect of smart tourism (Gretzel et al., 2015).
5.4.3. Autonomy and Transparency of Digital Nudges
Defaults and feedback are effective in part because they work without requiring any conscious thought on the part of the user. This brings with it a whole raft of ethical considerations. Nudges are ethically acceptable to the extent that they are transparent and do not eliminate any of the options (Thaler and Sunstein, 2008; Hansen, 2016). Digital nudges can be tailored, they can be continuous and they can be invisible. The EU AI Act now requires that people be made aware when they are interacting with an AI system (European Union, 2024) and this is obviously very pertinent to chatbots and AI concierges. Sustainability nudges in the tourism context should therefore be transparent, easy to reverse and subject to evaluation of any unintended consequences, including the potential for a loss of responsibility if AI agents take over from human staff (Song et al., 2026).
5.4.4. The Technology's Own Footprint
Data centres, networks, devices and AI models all have operational and embodied emissions (Belkhir and Elmeligi, 2018; Luccioni et al., 2024) though the estimates are very disparate (Freitag et al., 2021). A technology delivers net benefit only if the emissions it avoids, over the period the change lasts, exceed its lifecycle emissions and any rebound it induces:
NB = (ΔE × D) − (Lₘ + Lₒ) − R
All terms are in kg CO₂e over the same accounting period. ΔE is the emissions avoided per unit of use (e.g. per stay or per booking) net of any measured spillover to other resources; D is the number of units over which the change is sustained; Lₘ is the share of embodied emissions of the devices and infrastructure that are allocated to the intervention on the basis of lifetime and use; Lₒ is operational emissions over the same period; and R is emissions from induced consumption (rebound). Non-carbon outcomes (e.g. water saved, crowding reduced, local income) are reported as separate indicators rather than being converted into the equation. The test is a conceptual accounting framework rather than a validated measurement model. For example, a tool which avoids 2kg CO₂e per trip for 10,000 trips will save 20 tonnes per year; if it emits 5 tonnes and induces 5 tonnes of rebound then the net saving is halved to 10 tonnes; if the effect only lasts for half the trips then the saving is zero. Very few tourism studies report the terms after the first. In practice this tends to favour lightweight interventions (defaults and simple feedback) over more compute intensive experiences which have a similar effect, together with long hardware lifespans and low carbon hosting.
5.5. Generative and Agentic Ai
Generative AI is moving travel planning from a tool that helps you make a decision to an agent that actually makes the decision (Carvalho and Ivanov, 2024; Sigala et al., 2024). If the agent proposes one itinerary then that's the one that will be the default in terms of its objective function so whether it's carbon or crowding becomes a governance issue. There's as yet no study that looks at the impact of this on sustainable tourist behaviour and that's clearly a priority. The findings on defaults tell us why this is important: if a pre-selected offset can shift the choices of thousands of airline customers (Berger et al., 2022) then an AI agent that pre-selects an entire itinerary could shift far more in either direction.
5.6. Social and Economic Dimensions and Regional Balance
The evidence is also very unbalanced. Of the 156 studies, 137 look at environmental behaviour, 23 at social behaviour and only four at economic behaviour (e.g. spending with local businesses (Mundi, 2025)). Social outcomes are largely via the residents: smart destination development has been associated with increased resident life satisfaction (Wei et al., 2024) and platform intermediation can in fact be used to route revenue to global firms rather than local businesses (Gössling, 2021). So technologies that are designed to direct tourists to local businesses are of relevance, but their impact has not been measured in any of the studies. Geographically the bulk of the smart tourism literature (not just the sample in this review) is from East Asia, Europe and North America (Table 5). In this review, nine of the eleven high quality studies are from Europe, Australia or a European airline (Table 3); the other two are both from 2025/2026 and are from China with Indian tourists. Most of the Asian studies are still based on surveys and scenarios and there are very few from Africa and Latin America. Given the differences in infrastructure, payment systems and social norms across regions the ratings in this review should be treated as provisional when it comes to regions other than those in which the evidence was actually generated.
5.7. Cross-Cutting Synthesis
All eleven of the strong studies have one thing in common: the technology was acting on the decision environment at the point of action. Five provided real time feedback on resource use, two used the technology to redirect the user via recommendation or real time information, one used a default, one used a robot to deliver a prompt, one used an app to reward the behaviour and one placed a VR game just prior to the donation decision (though this had no effect). The evidence for labels, social media and smart destinations is all based on intention or self report. AI agents can be designed to either reinforce or undermine pro-environmental behaviour. Across the board persistence, spillover, rebound, footprint and distribution are almost never all measured. The field is therefore still unable to tell whether the technology is in fact undoing its own good.
6. The Tmstb Model
The TMSTB model (Figure 3) links technology touchpoints via three activation mechanisms to behavioural and system outputs, under design and individual moderators and a context and governance layer. A feedback loop captures spillover, rebound and footprint. Line styles indicate the evidence grade of each link.
6.1. Components and Evidence Grades
Touchpoints are all along the journey: pre-trip (booking defaults, carbon information, recommendations, VR previews), in-trip (feedback devices, agents, crowding information, apps) and post-trip (feedback, sharing, loyalty schemes). These are the interaction layer of the smart tourism ecosystem (Section 4.1).
Information activation (based on adoption theory) makes the impact of the information salient at the point of decision. It is strongly linked to behaviour in the case of real time feedback, recommendation and real time information (Tiefenbeck et al., 2019; Mitas et al., 2023; Wielenga et al., 2024; Pereira-Doel et al., 2025; MacAskill et al., 2026) but is predicated on intention for labels and badges. Normative activation (based on value-belief-norm theory and the norm activation model) relies on social reference points and agent presence; it is only strong in one field trial of robot delivered guilt appeals (Alboqami and Agag, 2026) and so would fall to emerging under the more stringent two study rule (Table 6). AI agents can also be capable of undermining norms (Guan et al., 2025). Affective activation (based on immersion and moral emotion) is still emerging as the only tourism field trial looked at two different immersive formats and found no significant difference in donation choice (Coghlan, 2022) and the other evidence is mixed and largely non-tourism in nature. The mechanisms can operate in tandem (e.g. a feedback display which includes a comparison to other guests) and so testing them in isolation would be a way of working out which of the mechanisms is responsible for the effect.
Design moderators (defaults, their cost and their financial reward) are all strong (Berger et al., 2022; Mundi, 2025) though each of those would be based on a single study if you were to look at defaults and rewards separately. Individual moderators (values, digital literacy, privacy concern and trust) are also emerging (Ioannou et al., 2020; Crosby et al., 2025). The model suggests that the individual moderators are most important for information-based touchpoints (those which require attention and motivation) and least important for defaults (which work without any user action at all).
Behavioural outputs are the tourist level outcomes (e.g. resource savings, low carbon choices, visiting less crowded sites). System outputs are the destination level outcomes (e.g. destination emissions, visitor distribution, host community benefit, equity, technology footprint). The link from behaviour to system outputs and the role of context is untested. The feedback loop is just beginning to emerge with one observation of negative spillover (MacAskill et al., 2026).
Table 6.
Sensitivity of Link Grades to the Grading Rule.
| TMSTB link | Strong studies | Main rule (≥ 1 strong study) | Stricter rule (≥ 2 strong studies) |
| Information activation: feedback, recommendations, real-time information | 7 | Strong | Strong |
| Information activation: labels and badges | 0 | Emerging | Emerging |
| Normative activation | 1 | Strong | Emerging |
| Affective activation | 1 (no significant effect) | Emerging | Emerging |
| Design moderators: defaults and rewards | 2 (1 each) | Strong | Strong; emerging if graded separately |
| Individual moderators | 0 | Emerging | Emerging |
| Feedback loop: spillover and rebound | 0 | Emerging | Emerging |
| Behaviour → system outputs; context | 0 | Untested | Untested |
Note: Strong studies are listed in Table 3. Source: Authors' synthesis.
The context and governance layer is all about regional infrastructure and institutional capacity, data governance and AI transparency, the post-pandemic digital landscape and the proliferation of generative and agentic AI. The context will determine both whether touchpoints are possible and who the beneficiaries will be. The key feature of the paired outputs and the feedback loop is that it means behaviour change is not equated with a sustainability gain.
6.2. Mapping to the Sdgs
Table 7 maps the model's outputs to the SDGs. Tourism is explicitly referenced in targets 8.9, 12.b and 14.7 and the monitoring tools examined here are potential instruments for target 12.b. The mapping is of a conceptual nature and highlights the potential for trade-offs (e.g. between digital infrastructure (SDG 9) and climate action (SDG 13)).
6.3. Future Research Questions
The questions stem from the grades: FRQ1 and FRQ2 are the strong links, FRQ3 to FRQ5 are the emerging links and FRQ6 is the untested system level link.
FRQ1. Do the effects of real time feedback and digital defaults carry on beyond the stay/booking and do the labels and badges change the observed bookings?
FRQ2. Do agent delivered norms change behaviour beyond the single trial and when do AI agents actually enhance rather than detract from pro-environmental behaviour?
FRQ3. When does immersive media lead to action rather than avoidance and does it beat out the cheaper media?
FRQ4. Are the effects unequal across digital literacy, age and income and do defaults or non-digital channels close the gap?
FRQ5. How do privacy concerns and trust influence who is exposed to personalised sustainability interventions?
FRQ6. Do the behavioural gains persist through spillover, rebound and technology footprint at the destination level and how does context influence this?
7. Implications
7.1. Theoretical Implications
The review makes three theoretical contributions. Firstly it brings together the adoption theory, the normative theory, the behaviour-design theory and the system theory into a single graded pathway, demonstrating that each of these accounts for a different stage in the process and that a technology can succeed at one stage and fail at another. Secondly it reframes the central question of the field from 'does it help?' to 'can we measure the net effect?' and the net-benefit test makes the relevant terms explicit. Thirdly it shows that the most powerful digital levers are those which operate on the decision environment and which require very little in the way of computational sophistication. The more sophisticated the tool (e.g. AI agents) the more likely it is to help or to backfire depending on the design. The implication is therefore that we should be looking at which technology is best suited to which decision environment. This is also the reason why earlier critical reviews have been so ambivalent (Gössling 2017, 2021).
7.2. Practical Implications
Accommodation providers should be focusing on real time feedback on resource use (this has the most consistent field evidence) and looking at whether savings on one resource are made up in another. Where AI agents or robots are interacting with guests, prompts that appeal to guilt or a sense of responsibility can lead to increased conservation (Alboqami and Agag, 2026). Operators should however test whether replacing staff actually diminishes the guest's sense of responsibility.
Platforms and designers should be using transparent green defaults at moderate cost (e.g. pre-selected offsets with a clear opt-out rather than just labels), favour lightweight designs over heavyweight ones and report footprint as well as behavioural effects.
Destination managers can use the recommenders and crowding data to re-distribute visitors, whilst still maintaining the non-digital channels and looking at the absolute outcomes rather than per visitor efficiency.
Policymakers should be demanding that booking sites provide transparent emissions data and auditable sustainability ratings. They should be restricting the use of behavioural data and the default objectives of AI travel agents should be a policy issue. There will need to be support for destinations that are at the lower end of the digital capability curve to avoid a further deepening of the regional divide.
7.3. Implications for Research Design
Five practices would strengthen the evidence base:
- measure observed behaviour, such as metered use, recorded bookings or tracked movement, alongside intention;
- follow participants beyond a single stay or trip to test persistence;
- meter several resources at once to detect spillover between behaviours;
- report the energy and emissions of the technology itself, so that net benefit can be estimated;
- report the effects separately by age, income and digital literacy and pre-register your hypotheses where possible.
8. Limitations and Research Agenda
Search and selection. The search and selection process was based on the two most comprehensive multidisciplinary databases, Scopus and Web of Science, which as a whole include the main tourism, hospitality and behavioural science journals (Mongeon and Paul-Hus, 2016). All the records obtained were examined, and citation searching was employed in order to include field studies that had been published in journals other than those specializing in tourism. Although limiting the evidence to peer-reviewed English-language articles improves the quality of the review, it also means that grey literature and studies not in English are not included.
Appraisal and synthesis. Instead of basing the assessment on the authors' own assertions, each study was evaluated using three clear criteria (directness, design and outcome), this approach distinguishing between observed behaviour and stated intention and ensures that each rating can be verified against the Supplementary Material. Since the designs and outcome measures differed greatly, the effect sizes were not combined; the synthesis thus determines the direction and strength of the evidence for each mechanism, which subsequent meta-analyses can use.
Nature of the evidence. the fact that most of the studies are intention-based and have short observation periods is itself a major conclusion of this review, which is also the reason why the TMSTB model assesses each link and why FRQ1 through FRQ6 give priority to field experiments involving follow-up. Strong evidence is mainly coming from Europe, Australia and Asia, so it should not be assumed that it can be transferred to other areas but rather needs to be tested.
Scope and timing. The scope and timeframe involve concentrating on digital technologies in the tourism sector, which sets a definite limit for the synthesis, the evidence that is not digital or related to tourism being used to explain the mechanisms instead of being employed to assess them. Since generative and agentic AI are developing more rapidly than the publication cycle, the model's focus on decision structures rather than on specific tools is especially appropriate.
Conceptual contribution. The TMSTB model and the net-benefit test are based on the evidence that has been reviewed and have been constructed to be tested; they offer specific, falsifiable propositions which form the research programme that follows.
The six research questions in Section 6.3 set the agenda and Table 8 maps each to an appropriate method. The four priorities that emerge are: 1) field experiments with observed outcomes and follow-up beyond a single stay/trip; 2) system level accounting applying the net benefit test (incorporating behavioural data with lifecycle assessment and rebound); 3) designs that report effects by age, income and digital literacy; 4) matched studies in Asia, Africa and Latin America and studies of social and economic behaviour (the latter being almost entirely absent). Studies of generative and agentic AI should be included as these tools enter into the booking and planning process, with a focus on the objectives they are designed to optimise and their energy consumption.
9. Conclusion
RQ1: Information, normative and affective activation link digital technology to behaviour. 11 of the 156 studies meet the strong evidence criteria (all of these involve technologies that are active at the point of decision), evidence for other technologies (including social media) is emerging and AI agents can either promote or inhibit behaviour depending on the design.
RQ2: Individual gains only become a net benefit if the avoided emissions over the lifetime of the change are greater than the spillover, rebound and the technology's footprint. The first tourism field evidence of negative spillover demonstrates that this condition cannot be taken for granted. The various terms involved are almost never measured together and equity, privacy and regional context all have a bearing on who actually benefits.
RQ3. The evidence-graded TMSTB model incorporates all of the above. It combines the behavioural and system outputs, grades each of the links and specifies six questions for research.
The key point of the review is that the most effective digital interventions are not necessarily the most technologically sophisticated. The field needs to be measuring system level outcomes before it can legitimately claim to have achieved any sustainability gains. For tourism to be a part of the required 42% cut in emissions by 2030 it will need to be changing behaviour at scale and in absolute terms rather than just on a per trip or per room basis.
Tourists are becoming increasingly 'smart'. Whether they become sustainable ones is going to be less to do with the sophistication of the technology and more to do with how the technology's decision structures are designed, governed and evaluated.
Author Contributions
Md. Sojib Hasan Choyon: conceptualization, methodology, data curation, original draft preparation, review and editing; and Hishamuddin Bin Ismail: visualization, supervision, review and editing. All authors have read and agreed to the published version of the manuscript.
Funding
No funding was obtained for carrying out the research.
Institutional Review Board Statement
Not applicable.
Informed Consent Statement
Not applicable.
Data Availability Statement
Since this paper is based on a review of existing literature, the authors did not collect or keep any primary data. All of the information that has been reviewed is obtained directly from the sources listed in the reference bibliography. The prisma material’s data are available upon legal request.
Conflicts of Interest
The authors have no potential conflict of interest.
References
- Aguiar-Castillo, L.; Clavijo-Rodriguez, A.; De Saa-Perez, P.; Perez-Jimenez, R. Gamification as an approach to promote tourist recycling behavior. Sustainability 2019, 11(8), 2201. [Google Scholar] [CrossRef]
- Aguiar-Castillo, L.; Rajendra-Teli, S.; Perez-Jimenez, R. Gamification and proenvironmental performance: could tourists return home with more sustainable habits? Journal of Hospitality and Tourism Technology 2023, 14(3), 444–459. [Google Scholar] [CrossRef]
- Ahn, S. J. G.; Bailenson, J. N.; Park, D. Short-and long-term effects of embodied experiences in immersive virtual environments on environmental locus of control and behavior. Computers in Human Behavior 2014, 39, 235–245. [Google Scholar] [CrossRef]
- Ajzen, I. The theory of planned behavior. Organizational behavior and human decision processes 1991, 50(2), 179–211. [Google Scholar] [CrossRef]
- Alboqami, H.; Agag, G. Can AI change how guests behave? Field experimental evidence on guilt appeals and sustainable choices in hotels. International Journal of Hospitality Management 2026, 139, 104778. [Google Scholar] [CrossRef]
- Araña, J. E.; León, C. J. Can defaults save the climate? Evidence from a field experiment on carbon offsetting programs. Environmental and Resource Economics 2013, 54(4), 613–626. [Google Scholar] [CrossRef]
- Assaker, G.; O’Connor, P. The importance of green certification labels/badges in online hotel booking choice: A conjoint investigation of consumers’ preferences pre-and post-COVID-19. Cornell Hospitality Quarterly 2023, 64(4), 401–414. [Google Scholar] [CrossRef]
- Banerjee, S.; Ferreira, A. Virtual reality is only mildly effective in improving forest conservation behaviors. Scientific Reports 2024, 14(1), 28532. [Google Scholar] [CrossRef] [PubMed]
- Belkhir, L.; Elmeligi, A. Assessing ICT global emissions footprint: Trends to 2040 & recommendations. Journal of cleaner production 2018, 177, 448–463. [Google Scholar] [CrossRef]
- Berger, S.; Kilchenmann, A.; Lenz, O.; Ockenfels, A.; Schlöder, F.; Wyss, A. M. Large but diminishing effects of climate action nudges under rising costs. Nature Human Behaviour 2022, 6(10), 1381–1385. [Google Scholar] [CrossRef] [PubMed]
- Boeuf, B.; Flipo, C. Carbon emissions tangibility and air travel preferences. Current Issues in Tourism 2026, 29(5), 821–825. [Google Scholar] [CrossRef]
- Booking.com. 2025 travel and sustainability report. 2025. Available online: https://transition-pathways.europa.eu/system/files/2025-05/2025travelampsustainabilityreport-booking.com2_.pdf.
- Borràs, J.; Moreno, A.; Valls, A. Intelligent tourism recommender systems: A survey. Expert systems with applications 2014, 41(16), 7370–7389. [Google Scholar] [CrossRef]
- Buhalis, D.; Amaranggana, A. Smart tourism destinations enhancing tourism experience through personalisation of services. In Information and communication technologies in tourism 2015: Proceedings of the international conference in Lugano, Switzerland, December 2014; Springer International Publishing, 3-6 February 2015; pp. 377–389. [Google Scholar]
- Carvalho, I.; Ivanov, S. ChatGPT for tourism: applications, benefits and risks. Tourism review 2024, 79(2), 290–303. [Google Scholar] [CrossRef]
- Chang, R.; Yang, D.; Lyu, D.; Cao, J.; Wei, Y.; Xiao, D. The linguistic feedback of tourism robots significantly influences visitors’ ecotourism behaviors. Scientific Reports 2025, 15(1), 16015. [Google Scholar] [CrossRef] [PubMed]
- Chvirova, D.; Keller, R.; Stöbe, L.; Wolf, L. Beyond choice architecture: toward understanding the role of the decoy effect in sustainable tourism recommender systems. Information Technology & Tourism 2026, 28(1), 5. [Google Scholar] [CrossRef]
- Coghlan, A. Can ecotourism interpretation influence reef protective behaviours? Findings from a quasi-experimental field study involving a virtual reality game. Journal of Ecotourism 2022, 21(2), 187–196. [Google Scholar] [CrossRef]
- Crosby, P.; Thompson, D.; Best, R. Air travellers’ attitudes towards carbon emissions: Evidence from the Google Flights interface. Journal of Sustainable Tourism 2025, 33(12), 2669–2692. [Google Scholar] [CrossRef]
- Davis, F.D. Perceived usefulness, perceived ease of use, and user acceptance of information technology; MIS Quarterly, 1989; Vol. 13, No. 3, pp. 319–340. [Google Scholar]
- Deci, E. L.; Koestner, R.; Ryan, R. M. A meta-analytic review of experiments examining the effects of extrinsic rewards on intrinsic motivation. Psychological bulletin 1999, 125(6), 627. [Google Scholar] [CrossRef] [PubMed]
- Ding, A.; Legendre, T. S.; Lee, H. S.; Min, J. The transferability of passion: how green influencers inspire tourists’ green initiative support. Journal of Sustainable Tourism 2026, 34(1), 42–59. [Google Scholar] [CrossRef]
- Dolnicar, S. Designing for more environmentally friendly tourism. Annals of Tourism Research 2020, 84, 102933. [Google Scholar] [CrossRef]
- Dolnicar, S.; Knezevic Cvelbar, L.; Grün, B. A sharing-based approach to enticing tourists to behave more environmentally friendly. Journal of Travel Research 2019, 58(2), 241–252. [Google Scholar] [CrossRef] [PubMed]
- Duan, Z.; Ding, Z.; Mou, Y.; Deng, X. "I am the 'owner' of the hotel: the impact of human-robot interactivity on guests' pro-environmental behavior in hotels"; Journal of Hospitality and Tourism Management, 2025; Vol. 62, pp. 284–293. [Google Scholar]
- El Archi, Y.; Benbba, B.; Kabil, M.; Dávid, L. D. Digital technologies for sustainable tourism destinations: State of the art and research agenda. Administrative Sciences 2023, 13(8), 184. [Google Scholar] [CrossRef]
- European Union. Regulation (EU) 2024/1689 of the European Parliament and of the Council of 13 June 2024 laying down harmonised rules on artificial intelligence (Artificial Intelligence Act). Official Journal of the European Union 2024, L series. Available online: http://data.europa.eu/eli/reg/2024/1689/oj.
- Femenia-Serra, F.; Neuhofer, B.; Ivars-Baidal, J. A. Towards a conceptualisation of smart tourists and their role within the smart destination scenario. The Service Industries Journal 2019, 39(2), 109–133. [Google Scholar] [CrossRef]
- Fogg, B. J. A behavior model for persuasive design. In Proceedings of the 4th international Conference on Persuasive Technology; April 2009; pp. 1–7. [Google Scholar]
- Freitag, C.; Berners-Lee, M.; Widdicks, K.; Knowles, B.; Blair, G. S.; Friday, A. The real climate and transformative impact of ICT: A critique of estimates, trends, and regulations. Patterns 2021, 2(9). [Google Scholar] [CrossRef] [PubMed]
- Geels, F. W. Technological transitions as evolutionary reconfiguration processes: a multi-level perspective and a case-study. Research policy 2002, 31(8-9), 1257–1274. [Google Scholar] [CrossRef]
- Godovykh, M.; Fyall, A.; Baker, C. Sustainable labels in tourism practice: The effects of sustainable hotel badges on guests’ attitudes and behavioral intentions. Sustainability 2024, 16(6), 2484. [Google Scholar] [CrossRef]
- Goldstein, N. J.; Cialdini, R. B.; Griskevicius, V. A room with a viewpoint: Using social norms to motivate environmental conservation in hotels. Journal of consumer Research 2008, 35(3), 472–482. [Google Scholar] [CrossRef] [PubMed]
- Gössling, S. Tourism, information technologies and sustainability: an exploratory review. Journal of Sustainable Tourism 2017, 25(7), 1024–1041. [Google Scholar] [CrossRef]
- Gössling, S. Tourism, technology and ICT: a critical review of affordances and concessions. Journal of sustainable tourism 2021, 29(5), 733–750. [Google Scholar] [CrossRef]
- Gössling, S.; Buckley, R. Carbon labels in tourism: persuasive communication? Journal of Cleaner Production, 2016; Vol. 111, pp. 358–369. [Google Scholar]
- Gössling, S.; Scott, D.; Hall, C. M. Pandemics, tourism and global change: a rapid assessment of COVID-19. Journal of sustainable tourism 2020, 29(1), 1–20. [Google Scholar] [CrossRef]
- Gretzel, U.; Sigala, M.; Xiang, Z.; Koo, C. Smart tourism: foundations and developments: U. Gretzel et al. Electronic markets 2015, 25(3), 179–188. [Google Scholar]
- Guan, B.; Li, X.; Luo, Z.; Liu, P. Can (A) I arouse you? The impact of AI services on consumer pro-environmental behavior. Journal of Hospitality & Tourism Research 2025, 49(5), 932–945. [Google Scholar] [CrossRef]
- Gunduz Songur, A.; Turktarhan, G.; Cobanoglu, C. Progress on green technology research in hotels: a literature review. Journal of Hospitality and Tourism Insights 2023, 6(5), 2052–2072. [Google Scholar] [CrossRef]
- Guyatt, G. H.; Oxman, A. D.; Vist, G. E.; Kunz, R.; Falck-Ytter, Y.; Alonso-Coello, P.; Schünemann, H. J. GRADE: an emerging consensus on rating quality of evidence and strength of recommendations. bmj 2008, 336(7650), 924–926. [Google Scholar] [CrossRef] [PubMed]
- Hamari, J.; Koivisto, J.; Sarsa, H. Does gamification work?--a literature review of empirical studies on gamification. In 2014 47th Hawaii international conference on system sciences; Ieee, January 2014; pp. 3025–3034. [Google Scholar]
- Han, W.; McCabe, S.; Wang, Y.; Chong, A. Y. L. Evaluating user-generated content in social media: an effective approach to encourage greater pro-environmental behavior in tourism? Journal of Sustainable Tourism 2018, 26(4), 600–614. [Google Scholar] [CrossRef]
- Hansen, P. G. The definition of nudge and libertarian paternalism: Does the hand fit the glove? European Journal of Risk Regulation 2016, 7(1), 155–174. [Google Scholar] [CrossRef]
- Harrison, G. W.; List, J. A. Field experiments. Journal of Economic literature 2004, 42(4), 1009–1055. [Google Scholar] [CrossRef]
- Hussain, K.; Stephenson, M. L.; Alagas, E. N.; Wong, P. P. W.; Salman, A.; Bostani, A. The contribution of social media influencers to sustainable travel behaviour: the mediating role of inspiration and involvement in sustainable travel practices. In Management & Sustainability: An Arab Review; 2025. [Google Scholar]
- IATA. "International Air Transport Association 2024 aviation emissions: Efficiency gains vs. rising totals. 2025. Available online: https://www.iata.org/en/iata-repository/publications/economic-reports/2024-aviation-emissions-efficiency-gains-vs.-rising-totals.
- Ioannou, A.; Tussyadiah, I.; Lu, Y. Privacy concerns and disclosure of biometric and behavioral data for travel. International Journal of Information Management 2020, 54, 102122. [Google Scholar] [CrossRef]
- Ioannou, A.; Tussyadiah, I.; Miller, G. That’s private! Understanding travelers’ privacy concerns and online data disclosure. Journal of Travel Research 2021, 60(7), 1510–1526. [Google Scholar] [CrossRef]
- ITU; International Telecommunication Union. Measuring digital development: Facts and figures 2024. 2024. Available online: https://www.itu.int/itu-d/reports/statistics/facts-figures-2024/.
- Juvan, E.; Dolnicar, S. The attitude–behaviour gap in sustainable tourism. Annals of tourism research 2014, 48, 76–95. [Google Scholar] [CrossRef]
- Juvan, E.; Dolnicar, S. Measuring environmentally sustainable tourist behaviour. Annals of Tourism Research 2016, 59, 30–44. [Google Scholar] [CrossRef]
- Khan, U.; Ali, F.; Ali, L.; Parvez, M. O.; Alotaibi, S. The effectiveness of sustainability badges in hospitality: Examining credibility and its impact on booking intentions. International Journal of Tourism Research 2025, 27(6), e70142. [Google Scholar] [CrossRef]
- Kitchin, R. The ethics of smart cities and urban science. Philosophical transactions. Series A, Mathematical, physical, and engineering sciences 2016, 374(2083), 20160115. [Google Scholar] [CrossRef] [PubMed]
- Lohawala, N.; Teng, X. 2026. Impact of Flight Emissions Information on Consumer Demand: Evidence from the US Airline Industry (No. 26-08). Resources for the Future. [Google Scholar]
- Bas-Sarmiento, P.; Julián-López, C.; Fernández-Gutiérrez, M.; Poza-Méndez, M.; Marín-Paz, A. J. Gamified eHealth interventions for health promotion and disease prevention in children and adolescents: a scoping review. Humanities and Social Sciences Communications 2025, 12(1), 397. [Google Scholar] [CrossRef]
- Luccioni, S.; Jernite, Y.; Strubell, E. Power hungry processing: Watts driving the cost of AI deployment? In Proceedings of the 2024 ACM conference on fairness, accountability, and transparency, June; 2024; pp. 85–99. [Google Scholar]
- MacAskill, S.; Becken, S.; Coghlan, A.; Warren, C.; Font, X. Smart-metre insights into ecolodge guests’ water and energy behaviours in a field quasi-experiment. Journal of Sustainable Tourism 2026, 1–21. [Google Scholar] [CrossRef]
- Majid, G. M.; Tussyadiah, I.; Kim, Y. R.; Chen, J. L. From destination to daily life: a longitudinal study on the effects of flashback nudging on pro-environmental behavior spillover. Journal of travel research 2026, 65(5), 1321–1359. [Google Scholar]
- Mehraliyev, F.; Chan, I. C. C.; Choi, Y.; Koseoglu, M. A.; Law, R. A state-of-the-art review of smart tourism research. Journal of Travel & Tourism Marketing 2020, 37(1), 78–91. [Google Scholar] [CrossRef]
- Meske, C.; Amojo, I.; Müller, C. Online flight booking: digital nudging to decrease aviation-related carbon emissions. Information Technology & People 2024, 37(1), 29–50. [Google Scholar] [CrossRef]
- Minghetti, V.; Buhalis, D. Digital divide in tourism. Journal of Travel Research 2010, 49(3), 267–281. [Google Scholar] [CrossRef]
- Mitas, O.; Badal, R.; Verhoeven, M.; Verstraten, K.; de Graaf, L.; Mitasova, H. , ... & Klijs, J. Tell me where to go: An experiment in spreading visitor flows in The Netherlands. International Journal of Environmental Research and Public Health 2023, 20(8), 5441. [Google Scholar] [CrossRef] [PubMed]
- Mongeon, P.; Paul-Hus, A. The journal coverage of Web of Science and Scopus: a comparative analysis. Scientometrics 2016, 106(1), 213–228. [Google Scholar] [CrossRef]
- Morales, A. C.; Amir, O.; Lee, L. Keeping it real in experimental research—Understanding when, where, and how to enhance realism and measure consumer behavior. Journal of Consumer Research 2017, 44(2), 465–476. [Google Scholar] [CrossRef]
- Mundi, H. S. Financial incentives and tourist motivation: Understanding drivers of sustainable tourism. Tourism Management Perspectives 2025, 58, 101403. [Google Scholar] [CrossRef]
- Nelson, K. M.; Anggraini, E.; Schlüter, A. Virtual reality as a tool for environmental conservation and fundraising. Plos one 2020, 15(4), e0223631. [Google Scholar] [CrossRef] [PubMed]
- Novera, C. N.; Ahmed, Z.; Kushol, R.; Wanke, P.; Azad, M. A. K. Internet of Things (IoT) in smart tourism: a literature review. Spanish Journal of Marketing-ESIC 2022, 26(3), 325–344. [Google Scholar] [CrossRef]
- Padrón-Fumero, N.; Bauluz, A.; Díaz-Hernández, J. J.; Diaz-Farina, E.; Hernández-Yumar, A. Unlocking water saving potential in tourism destinations using Smart Water Meters. Current Issues in Tourism 2025, 1–27. [Google Scholar] [CrossRef]
- Page, M. J.; McKenzie, J. E.; Bossuyt, P. M.; Boutron, I.; Hoffmann, T. C.; Mulrow, C. D. , ... & Moher, D.The PRISMA 2020 statement: an updated guideline for reporting systematic reviews. bmj 2021, 372. [Google Scholar] [CrossRef] [PubMed]
- Peeters, P.; Higham, J.; Kutzner, D.; Cohen, S.; Gössling, S. Are technology myths stalling aviation climate policy? Transportation Research Part D: Transport and Environment 2016, 44, 30–42. [Google Scholar] [CrossRef]
- Pereira-Doel, P.; Font, X.; Wyles, K.; Pereira-Moliner, J. Showering smartly. A field experiment using water-saving technology to foster pro-environmental behaviour among hotel guests. E-review of Tourism Research 2019, 17(3). [Google Scholar]
- Pereira-Doel, P.; Font, X.; Wyles, K.; Pereira-Moliner, J. Reducing shower duration in tourist accommodations: A covert true experiment of continuous real-time eco-feedback and persuasive messaging. Journal of Travel Research 2025, 64(5), 1100–1120. [Google Scholar] [CrossRef]
- Schwartz, S.H. Normative influences on altruism. In Advances in Experimental Social Psychology; Berkowitz, L., Ed.; Academic Press, 1977; Vol. 10, pp. 221–279. [Google Scholar]
- Anderson-Cook, C. M. Experimental and quasi-experimental designs for generalized causal inference; 2005. [Google Scholar]
- Shasha, Z. T.; Weideman, M.; Sun, H.; Liu, G. A bibliometric review of research progress, trends, and updates on smart tourism research. Businesses 2025, 5(3), 39. [Google Scholar] [CrossRef]
- Sheeran, P.; Webb, T. L. The intention–behavior gap. Social and personality psychology compass 2016, 10(9), 503–518. [Google Scholar] [CrossRef]
- Shen, C. Social media marketing and digital influence for visitor flow management in sustainable heritage tourism. Scientific Reports 2025, 15(1), 45767. [Google Scholar] [CrossRef] [PubMed]
- Sigala, M. Tourism and COVID-19: Impacts and implications for advancing and resetting industry and research. Journal of business research 2020, 117, 312–321. [Google Scholar] [CrossRef] [PubMed]
- Sigala, M.; Ooi, K.B.; Tan, G.W.H.; Aw, E.C.X.; Buhalis, D.; Cham, T.H.; Chen, M.M.; Dwivedi, Y.K.; Gretzel, U.; Inversini, A.; Jung, T.; Law, R.; Ye, I.H. Understanding the impact of ChatGPT on tourism and hospitality: trends, prospects and research agenda; Journal of Hospitality and Tourism Management, 2024; Vol. 60, pp. 384–390. [Google Scholar]
- Singh, D.A.; Kunja, S.R. Engaging guests for a greener tomorrow: examining the role of hotel chatbots in encouraging pro-environmental behavior; Tourism and Hospitality Research, 2026; Vol. 26, No. 4, pp. 872–886. [Google Scholar]
- Song, H.; Zhong, N.; Fan, D. X.; Wu, M. High-Tech or High-Touch? Effects of Tourism Service Mode on Tourists’ Pro-Environmental Behavior. Journal of Hospitality & Tourism Research 2025, 10963480261463297. [Google Scholar]
- Song, Q.; Wondirad, A. Demystifying the nexus between social media usage and overtourism: evidence from Hangzhou, China. Asia Pacific Journal of Tourism Research 2023, 28(4), 364–385. [Google Scholar] [CrossRef]
- Sorrell, S.; Dimitropoulos, J. The rebound effect: Microeconomic definitions, limitations and extensions. Ecological economics 2008, 65(3), 636–649. [Google Scholar] [CrossRef]
- Souza-Neto, V.; Marques, O.; Mayer, V. F.; Lohmann, G. Lowering the harm of tourist activities: A systematic literature review on nudges. Journal of Sustainable Tourism 2023, 31(9), 2173–2194. [Google Scholar] [CrossRef]
- Stern, P. C. New environmental theories: toward a coherent theory of environmentally significant behavior. Journal of social issues 2000, 56(3), 407–424. [Google Scholar] [CrossRef]
- Su, Z.; Lei, B.; Lu, D.; Lai, S.; Zhang, X. Impact of ecological presence in virtual reality tourism on enhancing tourists’ environmentally responsible behavior. Scientific Reports 2024, 14(1), 5939. [Google Scholar] [CrossRef] [PubMed]
- Sun, Y. Y.; Faturay, F.; Lenzen, M.; Gössling, S.; Higham, J. Drivers of global tourism carbon emissions. Nature Communications 2024, 15(1), 10384. [Google Scholar] [CrossRef] [PubMed]
- Sussman, S.W.; Siegal, W.S. Informational influence in organizations: an integrated approach to knowledge adoption; Information Systems Research, 2003; Vol. 14, No. 1, pp. 47–65. [Google Scholar]
- Syah, A.; Binesh, N. AI-enabled nudging in tourism and hospitality: A systematic review and research agenda through the lens of “MINDSPACE”. Tourism and Hospitality Research, 2025; p. 14673584251409417.
- Thaler, R. H.; Sunstein, C. R.; Milligan, S. Nudge: Improving decisions about health, wealth, and happiness; Penguin books, 2009; Vol. 47, p. 9. [Google Scholar]
- Thomas, J.; Harden, A. Methods for the thematic synthesis of qualitative research in systematic reviews. BMC medical research methodology 2008, 8(1), 45. [Google Scholar] [CrossRef] [PubMed]
- Tiefenbeck, V.; Wörner, A.; Schöb, S.; Fleisch, E.; Staake, T. Real-time feedback promotes energy conservation in the absence of volunteer selection bias and monetary incentives. Nature Energy 2019, 4(1), 35–41. [Google Scholar] [CrossRef]
- Tom Dieck, M. C.; Jung, T. A theoretical model of mobile augmented reality acceptance in urban heritage tourism. Current Issues in Tourism 2018, 21(2), 154–174. [Google Scholar] [CrossRef]
- Tussyadiah, I.; Miller, G. Nudged by a robot: Responses to agency and feedback. Annals of Tourism Research 2019, 78, 102752. [Google Scholar] [CrossRef]
- Tyers, R. Nudging the jetset to offset: Voluntary carbon offsetting and the limits to nudging. Journal of Sustainable Tourism 2018, 26(10), 1668–1686. [Google Scholar] [CrossRef]
- UN Tourism. Glasgow Declaration on Climate Action in Tourism: Implementation report 2023. 2024. Available online: https://www.oneplanetnetwork.org/sites/default/files/2023-12/Glasgow%20Declaration%20Implementation%20Report%202023%20Main%20Takeaways_fv.pdf.
- UN Tourism. World tourism barometer. 2026. Available online: https://www.untourism.int/news/international-tourist-arrivals-up-4-in-2025-reflecting-strong-travel-demand-around-the-world.
- UNEP; United Nations Environment Programme. Emissions gap report 2024: No more hot air … please! 2024. Available online: https://www.unep.org/resources/emissions-gap-report-2024.
- United Nations. Transforming our world: The 2030 Agenda for Sustainable Development; (A/RES/70/1), 2015; Available online: https://sdgs.un.org/2030agenda.
- UNWTO and UNEP. World Tourism Organization & United Nations Environment Programme Making tourism more sustainable: A guide for policy makers. 2005. Available online: https://wedocs.unep.org/20.500.11822/8741.
- Van Deursen, A. J.; Van Dijk, J. A. The first-level digital divide shifts from inequalities in physical access to inequalities in material access. New media & society 2019, 21(2), 354–375. [Google Scholar] [CrossRef] [PubMed]
- Viglia, G.; Dolnicar, S. A review of experiments in tourism and hospitality. Annals of tourism research 2020, 80, 102858. [Google Scholar] [CrossRef]
- Wang, Q.; Guo, Q. Green and gamification: a win-win combination for hotels and ant Forest. Current Issues in Tourism 2025, 1–31. [Google Scholar]
- Warren, C.; Becken, S.; Coghlan, A. Using persuasive communication to co-create behavioural change–engaging with guests to save resources at tourist accommodation facilities. In Marketing for sustainable tourism; Routledge, 2019; pp. 67–86. [Google Scholar]
- Wei, W.; Önder, I.; Uysal, M. Smart tourism destination (STD): developing and validating an impact scale using residents’ overall life satisfaction. Current Issues in Tourism 2024, 27(17), 2849–2872. [Google Scholar] [CrossRef]
- Wen, L.; Huang, L. Whispers of automation: Exploring the influence of service robots on food waste. International Journal of Hospitality Management 2026, 133, 104484. [Google Scholar] [CrossRef]
- Wheaton, M.; Ardoin, N. M.; Hunt, C.; Schuh, J. S.; Kresse, M.; Menke, C.; Durham, W. Using web and mobile technology to motivate pro-environmental action after a nature-based tourism experience. Journal of Sustainable Tourism 2016, 24(4), 594–615. [Google Scholar] [CrossRef]
- Wielenga, B.; Folmer, A.; Hartman, S.; Heslinga, J. H.; Middelhoek, N.; Groenhof, E. Nudging visitors into pro-environmental behaviour: Assessing the use of a tidal information pillar for effective dynamic zoning. Journal of Outdoor Recreation and Tourism 2024, 46, 100776. [Google Scholar] [CrossRef]
- WMO; World Meteorological Organization. WMO confirms 2024 as warmest year on record at about 1.55°C above pre-industrial level. 2025. Available online: https://wmo.int/news/media-centre/wmo-confirms-2024-warmest-year-record-about-155degc-above-pre-industrial-level.
- WTTC; World Travel; Tourism Council. Economic impact research 2025. 2025. Available online: https://wttc.org/news/global-travel-and-tourism-is-strong-despite-economic-headwinds.
- Ye, B. H.; Ye, H.; Law, R. Systematic review of smart tourism research. Sustainability 2020, 12(8), 3401. [Google Scholar] [CrossRef]
- Zhang, Y.; Hsu, F. C.; Gao, L. The role of social media in tourists’ conformity and irrational food consumption: Implications for food waste. International Journal of Gastronomy and Food Science 2025, 39, 101133. [Google Scholar] [CrossRef]
- Zheng, W.; Liao, Z.; Lin, Z. Navigating through the complex transport system: A heuristic approach for city tourism recommendation. Tourism management 2020, 81, 104162. [Google Scholar] [CrossRef]
- Zhu, Z.; Hall, C. M.; Li, Y.; Zhang, X. Exploring the impact of virtual reality on tourists’ pro-sustainable behaviors in heritage tourism. Sustainability 2025, 17(14), 6278. [Google Scholar] [CrossRef]
Figure 1.
PRISMA 2020 Flow Diagram of Study Selection. Source: Authors' own work, following Page et al. (2021).
Figure 1.
PRISMA 2020 Flow Diagram of Study Selection. Source: Authors' own work, following Page et al. (2021).
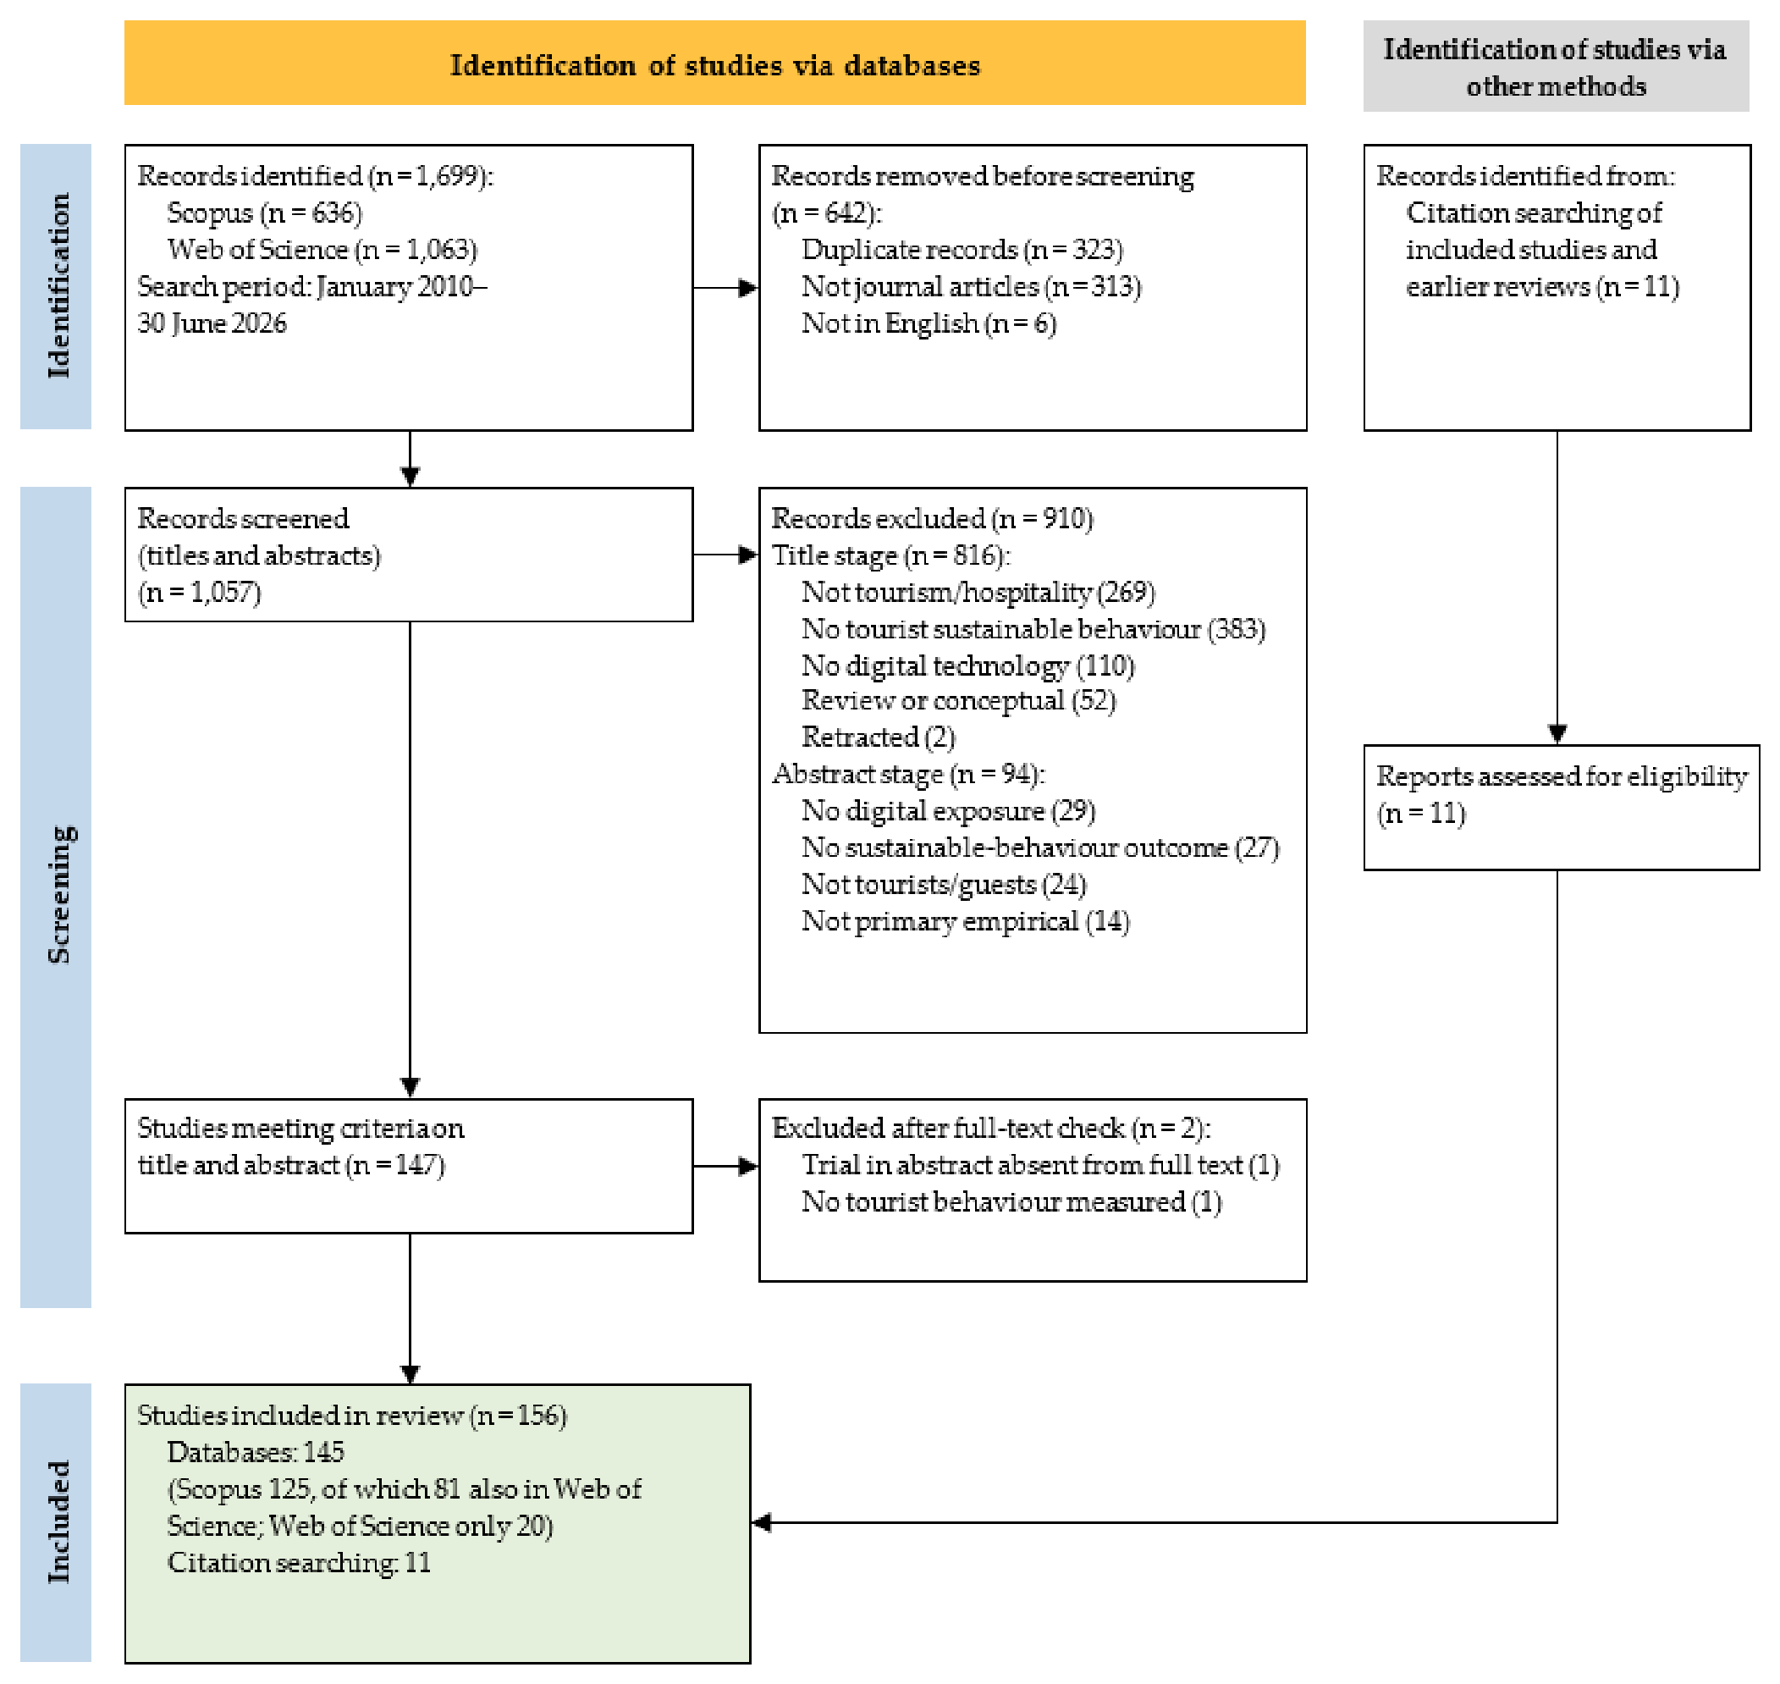
Figure 2.
Integrated Theoretical Pathway Underpinning the TMSTB Model. Source: Authors' own work.
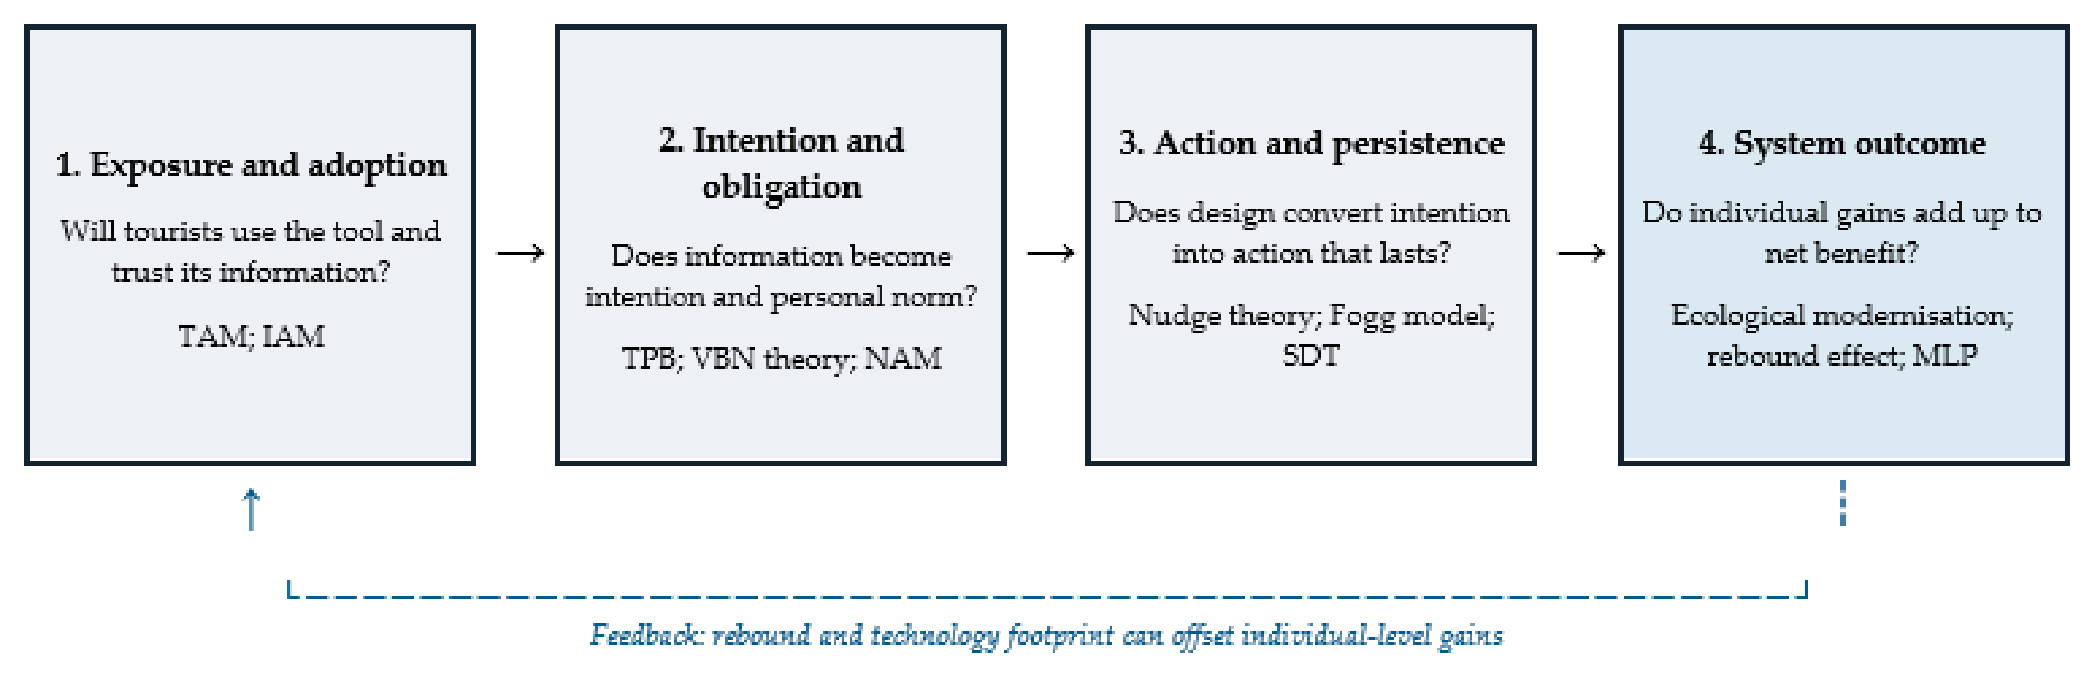
Figure 3.
The TMSTB Model, Graded by Strength of Evidence. Note: FRQ1–FRQ6 refer to the future research questions in Section 6.3. Source: Authors' own work.
Figure 3.
The TMSTB Model, Graded by Strength of Evidence. Note: FRQ1–FRQ6 refer to the future research questions in Section 6.3. Source: Authors' own work.
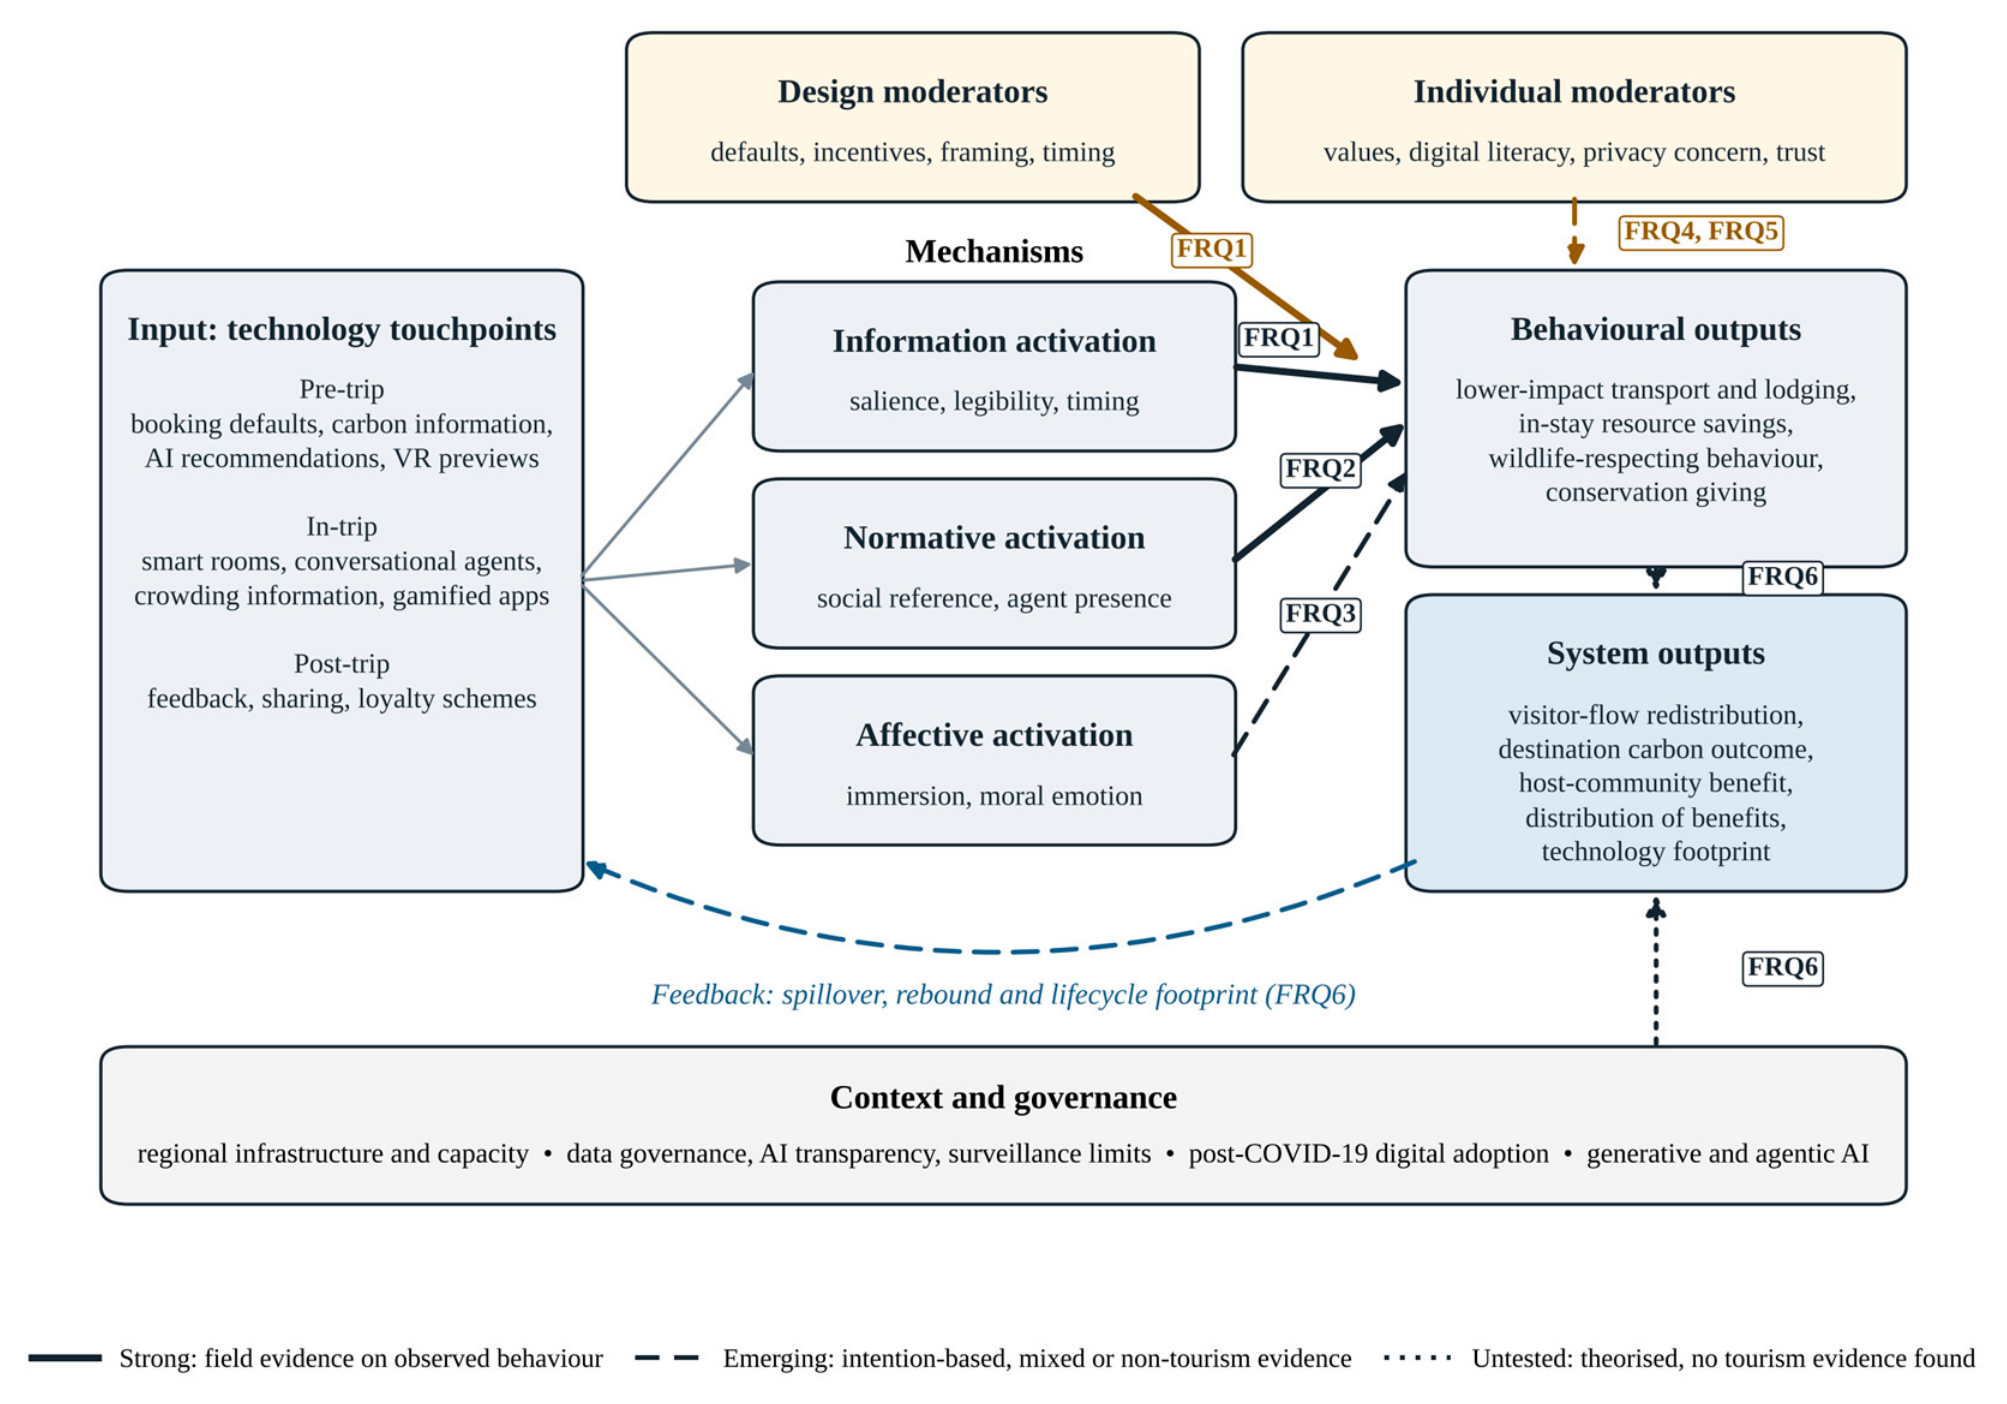
Table 1.
Prior Reviews and the Gap This Review Fills.
| Review | Scope | Main contribution | What remains open |
| Gössling (2017) | Exploratory review of IT and tourism sustainability | IT effects on sustainability are mixed, often ambivalent | No behavioural framework; predates current AI |
| Mehraliyev et al. (2020) | 86 smart tourism articles | Eleven themes, four knowledge domains | Sustainability not central |
| Ye et al. (2020) | 124 smart tourism articles | Technology's influence on tourists is the largest theme | Sustainability outcomes not assessed |
| Gössling (2021) | Critical review of ICT and tourism | Assessments are optimistic and monocausal | No mechanism-level synthesis |
| Gündüz Songur et al. (2023) | Green technology in hotels, 1999–2020 | Maps hotel green technology | Single sector; guest behaviour not central |
| El Archi et al. (2023) | 559 Scopus papers | Digital technology in sustainable destinations | Descriptive; no mechanisms |
| Souza-Neto et al. (2022) | 66 articles on nudges in tourism, 2008–2020 | Food waste and sustainability most studied; quasi-experiments common | Digital tools not central; evidence not graded |
| Syah and Binesh (2025) | 81 articles on AI-enabled nudging | MINDSPACE mapping of AI nudges | Strength of behavioural evidence not graded |
| Shasha et al. (2025) | 563 Web of Science articles, 2000–2024 | Growth, leading countries and themes | Descriptive; behaviour not integrated |
| This review | PRISMA 2020; 156 empirical studies, 2010–June 2026 | Evidence-graded TMSTB model; net-benefit test; SDG mapping | — |
Source: Authors' synthesis.
Table 5.
Regional Share of Smart Tourism Publications (15 Most Productive Countries).
| Region | Countries | Publications | Share |
| East Asia | China, South Korea, Taiwan, Japan | 208 | 44.9% |
| Europe | England, Spain, Italy, Germany, Netherlands | 103 | 22.2% |
| North America | USA, Canada | 96 | 20.7% |
| Other | Australia, India, Saudi Arabia, Singapore | 56 | 12.1% |
| Africa; Latin America | None in the top 15 | 0 | 0% |
Source: Calculated from Shasha et al. (2025), Web of Science, 563 articles, 2000–2024; shares of the 463 publications by the 15 most productive countries.
Table 7.
TMSTB Outcomes, SDGs and Trade-offs.
| TMSTB outcome | SDGs | Digital contribution | Trade-off |
| Low-carbon travel and lodging choices | 13, 12 | Defaults; carbon information | Rebound in travel frequency |
| In-stay resource savings | 6, 7, 12 | Real-time feedback | Spillover to other resources |
| Visitor-flow redistribution | 11, 8.9 | Recommenders; crowding information | Excluding offline visitors |
| Inclusive access | 10, 9.c | Offline and assisted channels | Widening divide |
| Technology footprint | 12, 13 | Lightweight design; low-carbon hosting | Compute-heavy AI and VR |
| Monitoring and governance | 12.b, 16, 17 | Auditable algorithms | Surveillance |
Source: Authors' synthesis.
Table 8.
Research Agenda Linked to the Future Research Questions.
| FRQ | Gap | Suggested methods |
| FRQ1 | Persistence of feedback and default effects; effects of labels on real bookings | Field trials with follow-up; platform A/B tests with ethics review |
| FRQ2 | Digital norms on observed behaviour; when AI agents help or harm | Field experiments in hotels and apps; agent-design experiments |
| FRQ3 | Immersion leading to action rather than avoidance | Field experiments comparing VR with low-cost media; follow-up measures |
| FRQ4 | Unequal effects across age, income and digital literacy | Stratified experiments; comparative ethnography |
| FRQ5 | Privacy, trust and exposure to personalised nudges | Choice experiments; conjoint analysis |
| FRQ6 | Spillover, rebound and footprint at destination level | Metered multi-resource studies; lifecycle assessment; rebound modelling |
Source: Authors' synthesis.
Disclaimer/Publisher’s Note: The statements, opinions and data contained in all publications are solely those of the individual author(s) and contributor(s) and not of MDPI and/or the editor(s). MDPI and/or the editor(s) disclaim responsibility for any injury to people or property resulting from any ideas, methods, instructions or products referred to in the content. |
© 2026 by the authors. Licensee MDPI, Basel, Switzerland. This article is an open access article distributed under the terms and conditions of the Creative Commons Attribution (CC BY) license (http://creativecommons.org/licenses/by/4.0/).
Copyright: This open access article is published under a Creative Commons CC BY 4.0 license, which permit the free download, distribution, and reuse, provided that the author and preprint are cited in any reuse.