

Submitted:
29 October 2026
Posted:
30 October 2026
You are already at the latest version
Abstract
Background/Objective. Metabolic dysfunction-associated steatotic liver disease (MASLD) is the most prevalent chronic liver condition often linked to metabolic disor-ders such as obesity, type 2 diabetes, and dyslipidemia. MASLD can progress to more severe conditions like metabolic dysfunction-associated steatohepatitis, cirrhosis, and hepatocellular carcinoma. While lifestyle changes are currently the main therapeutic strategy, emerging evidence suggests that dietary micronutrients, such as vitamin B6 (VB6), could play an important role in the development and progression of MASLD through their involvement in one-carbon (1C) metabolism. Methods: This study inves-tigated the impact of dietary VB6 levels on the progression of MASLD using a modified high-fat diet (HFD)-induced mouse model. Thirty-two male C57BL/6J mice were ran-domly assigned to either an AIN-93G-based control diet or an HFD containing varying levels of dietary VB6 for eight weeks. At the end of the dietary intervention, physical parameters, clinical markers, hepatic and fecal metabolites, and gut morphology were evaluated. Results: Our findings demonstrated that dietary VB6 deficiency significantly affected hepatic B6 levels, lipid accumulation, and key metabolites involved in the 1C metabolic pathway. Notably, HFD-fed animals receiving low VB6 levels exhibited re-duced plasma triglyceride levels, increased hepatic triglyceride content, and alterations in homocysteine and glycine levels, suggesting disruptions in both lipid and 1C metab-olism. Interestingly, fecal glycerol and 3-hydroxyisovalerate levels were elevated in HFD-fed groups compared with those in the control group. Conclusions: These findings suggest that dietary VB6 plays a crucial role in regulating MASLD progression, particu-larly in the context of diet-induced MASLD, providing insights into potential dietary interventions for disease management.
Keywords:
vitamin B6
; obesity
; MASLD
; one-carbon metabolism
; high-fat diet
; metabolomics
; lipid metabolism
; mouse model
1. Introduction
Metabolic dysfunction-associated steatotic liver disease (MASLD) is one of the most prevalent chronic liver conditions globally, affecting almost 30% of the adult population [1]. MASLD is strongly associated with several metabolic syndromes, encompassing a wide range of conditions, from obesity to dyslipidemia [2]. The increasing prevalence of these risk factors continues to drive the rise in MASLD cases, further exacerbating the burden on healthcare systems worldwide. It is estimated that liver-related diseases will cost the global economy $2.6 trillion between 2021 and 2050 [3]. In Canada, the estimated economic burden of cirrhosis and other chronic liver diseases, including MASLD, between 2021 and 2050 is $24.5 billion, while the corresponding annual estimates are $103 billion in the United States and $38 billion across four European countries—Germany, France, Italy, and the United Kingdom [3]. MASLD is generally asymptomatic, particularly at its earlier stage, which further complicates the management of the disease[4]. Pharmacological treatment options for MASLD remain limited. In the United States, resmetirom and semaglutide are currently approved for adults with noncirrhotic metabolic dysfunction-associated steatohepatitis (MASH) and moderate-to-advanced fibrosis [5]. Although both therapies have demonstrated efficacy in improving histological features of MASH, their therapeutic effects remain variable, and treatment is recommended alongside lifestyle modifications [6]. As such, lifestyle interventions, particularly dietary modification and weight loss, remain central to the management of MASH [7].
MASLD includes a spectrum of liver conditions, beginning with simple steatosis and potentially progressing to MASH, fibrosis, cirrhosis, and hepatocellular carcinoma (HCC). The initial stage is steatosis, which is characterized by the accumulation of triglyceride (TG)-rich lipids within hepatocytes, affecting more than 5% of liver cells [8]. This lipid buildup may be present as macrovesicular steatosis, in which large fat droplets displace the cell nucleus [9]. Steatosis develops when lipogenesis and fatty acid uptake exceed the liver’s capacity for TG export and fatty acid oxidation. Increased expression of genes involved in lipid synthesis and fatty acid transport, together with enhanced adipose tissue lipolysis, contributes to hepatic fat accumulation and insulin resistance. Steatosis can progress to more severe forms of MASLD, such as MASH [10], which is characterized by liver inflammation, hepatocyte injury (ballooning), and varying degrees of fibrosis. Inflammatory cell infiltration includes lymphocytes and resident liver macrophages (Kupffer cells). Hepatocyte ballooning, a key marker of cellular injury, distinguishes MASH from simple steatosis and is often accompanied by apoptotic bodies and necrosis [11]. The mechanisms driving the transition from steatosis to MASH include lipotoxicity from elevated free fatty acids and oxidative stress resulting from excessive fatty acid oxidation [12]. Cirrhosis represents an irreversible stage of MASLD, characterized by extensive fibrosis in which healthy liver tissue is replaced by scar tissue. This stage results from chronic liver injury and activation of hepatic stellate cells, which produce collagen. Due to the increasing prevalence of advanced MASLD stages, MASH-related cirrhosis is projected to become a leading indication for liver transplantation [13,14].
One-carbon (1C) metabolism is a central metabolic network responsible for the generation and transfer of 1C units required for essential physiological processes, including nucleotide biosynthesis, energy metabolism, redox homeostasis, and epigenetic regulation [15]. This network comprises three interconnected pathways: the folate cycle, the methionine cycle, and the transsulfuration pathway. Within the folate cycle, folate is reduced and activated to generate 5,10-methylene-tetrahydrofolate, a key intermediate that donates 1C units for nucleotide synthesis and methylation reactions. This reaction involves the interconversion of serine and glycine catalyzed by serine hydroxymethyltransferase, a VB6-dependent enzyme [16,17]. In the methionine cycle, methionine is activated to S-adenosylmethionine (SAM), the principal methyl donor for a wide range of cellular methylation reactions. Following methyl group transfer, SAM is converted to S-adenosylhomocysteine (SAH), which is subsequently hydrolyzed to homocysteine. Homocysteine can then be remethylated to methionine by methionine synthase, a vitamin B12-dependent enzyme. In the liver, SAM-derived methyl groups are required for the sequential methylation of phosphatidylethanolamine to phosphatidylcholine, a critical step in very-low-density lipoprotein (VLDL) assembly and hepatic TG export. In the transsulfuration pathway, homocysteine is irreversibly converted to cystathionine by cystathionine β-synthase (CBS), and subsequently to cysteine by cystathionine γ-lyase (CGL), with vitamin B6 (VB6) serving as an essential cofactor for both reactions [18]. Cysteine is the rate-limiting precursor for glutathione biosynthesis, making the transsulfuration pathway a critical determinant of cellular antioxidant capacity and redox homeostasis (Figure 1). Disruption of 1C metabolism can therefore impair both lipid metabolism and redox balance. Reduced SAM availability limits phosphatidylethanolamine methylation, compromising VLDL assembly and secretion and thereby promoting hepatic TG accumulation [19]. Simultaneously, impaired transsulfuration reduces cysteine availability, limiting glutathione synthesis and exacerbating oxidative stress. Together, these disturbances contribute to hepatocellular injury and disease progression, hallmark features of MASLD.
Among the vitamins involved in 1C metabolism, VB6 is of particular interest given its role as a cofactor not only for several enzymes within this pathway, but also for more than 140 enzymes involved in amino acid, glucose, and lipid metabolism [20]. VB6 deficiency may therefore disrupt both lipid homeostasis and glutathione biosynthesis, two processes central to the pathogenesis of MASLD. Consistent with this, VB6 deficiency has been shown to be associated with the development of MASLD [21]. Although overt VB6 deficiency is uncommon in high-income countries, marginal deficiency is relatively prevalent and may be exacerbated by chronic conditions such as obesity, gastrointestinal disorders, and certain cancers [22]. Canadian dietary data indicate that inadequate VB6 intake remains relatively common in some adult populations; in the 2015 Canadian Community Health Survey, approximately 29–41% of men aged ≥51 years and 23–54% of women aged ≥31 years had usual VB6 intakes below the Estimated Average Requirement [23]. While several studies have demonstrated that chronic metabolic diseases, including MASLD, are associated with lower B-vitamin status [7,21]. However, the mechanistic links underlying these associations remain incompletely understood. Given the increasing global prevalence of MASLD, further investigation into the role of dietary micronutrients, particularly VB6, in its pathophysiology is warranted. In the present study, we aimed to investigate the effects of dietary VB6 on 1C metabolism and the development of MASLD using a diet-induced animal model.
2. Materials and Methods
2.1. Animals and Diet
Thirty-two male C57BL/6J mice, aged three weeks, were obtained from Jackson Laboratory. All animal procedures were approved by the Institutional Animal Care Committee at Memorial University of Newfoundland (MUN) and conducted in accordance with the guidelines of the Canadian Council on Animal Care. Mice were housed in pairs under controlled humidity at 22°C on a reverse 12-hour light/dark cycle. Following a one-week acclimatization period on a standard chow diet, mice were randomly assigned to one of four dietary groups using a random number generation method: a control diet (DYET#105095; n=8); a modified high-fat diet (HFD) containing the recommended level of VB6 (HFD-OB6; 7 mg VB6/kg diet; DYET#105092; n=8); a HFD diet supplemented with a high level of VB6 (HFD-HB6; 70 mg VB6/kg diet; DYET#105094; n=8); or a HFD with no added VB6 (HFD-LB6; DYET#105093; n=8). All diets were obtained from Dyets Inc., and their compositions are provided in Table S1. Body weight was measured weekly, and fecal and urine samples were collected at baseline and the end of the experiment. One mouse in the HFD-OB6 group (mouse ID 27) died during week 7, prior to the scheduled study endpoint. A veterinary assessment and necropsy were performed but the cause of death could not be determined. At the end of the study, mice were fasted for 8 h and anesthetized with isoflurane (5% induction, 2% maintenance; 0.8 L/min O₂). Blood was collected by cardiac puncture once loss of the pedal reflex confirmed deep anesthesia, and mice were then euthanized by decapitation. Blood was collected into heparin tubes and centrifuged at 4,000 × g for 10 min at 4 °C to obtain plasma, which was stored at −80 °C until analysis. Liver tissues were snap-frozen in liquid nitrogen and stored at −80°C for subsequent analyses.
2.2. Biochemical Analyses
Biochemical assays, which constituted the primary outcomes of this study, were performed using plasma samples collected in heparin as the anticoagulant to assess multiple parameters, excluding insulin. Analyses were conducted on an Abbott Architect c16000 analyzer using the following reagent kits: TG, total cholesterol (TChol), high-density lipoprotein cholesterol (HDL-C), low-density lipoprotein cholesterol (LDL-C, calculated = TChol – HDL-C – (TG/2.2), alanine aminotransferase (ALT), aspartate aminotransferase (AST), alkaline phosphatase (ALP), albumin, creatinine, and glucose. Sample volumes for each assay were determined according to the manufacturer’s instructions, with a base sample volume of 50 µL. All the biochemical assays were conducted at the Division of Laboratory Medicine, MUN, St. John’s Canada.
2.3. Targeted Metabolites Analysis
VB6 concentrations in liver tissue were measured using a Waters Acquity Ultra-Performance Liquid Chromatography (UPLC) system coupled with a fluorescence detector, following a pre-column semicarbazide derivatization method [24]. Pyridoxal 5′-phosphate (PLP), the biologically active form of VB6, was extracted from liver tissue by homogenization in phosphate buffer (pH 7.2). The resulting supernatant was mixed with equal volumes of semicarbazide and glycine to form PLP–semicarbazide derivatives. The derivatized PLP was then separated on a C18 column using a mobile phase containing disodium hydrogen phosphate, methanol, and EDTA and detected at excitation and emission wavelengths of 380 and 450 nm, respectively. A chromatogram of PLP is depicted in Figure S1.
Targeted 1C metabolites were quantified at the Metabolomics Innovation Centre (Edmonton, Canada) using a liquid chromatography-mass spectrometry (LC-MS) platform with isotope-labeled internal standards as previously conducted [25]. Plasma samples were thawed on ice, vortexed, centrifuged (13,000 × g, 10 min), and derivatized with phenyl isothiocyanate following drying under nitrogen. The derivatized metabolites were extracted with 300 μL of extraction solvent and analyzed using an Agilent 1290 UHPLC system coupled to an AB Sciex 4000 QTRAP tandem mass spectrometer. Calibration standards and quality-control samples were included for analytical validation.
2.4. 1H-NMR Spectroscopy Metabolomics
Liver and fecal metabolites were analyzed by proton nuclear magnetic resonance (1H-NMR) spectroscopy using a method described previously [26]. Briefly, biological samples were extracted with phosphate buffer prepared in D2O by homogenization with silica beads. The homogenates were centrifuged at 12,000 × g for 15 min at 4°C. The pH of the resulting supernatant was adjusted to 7.0 with NaOH, when necessary, and the samples were subsequently filtered using Nanosep 10K centrifugal filters at 12,000 × g for 60 min. A 570-µL aliquot of the filtrate was transferred into a 5-mm NMR tube containing sodium azide (NaN3) and dimethylsilyl pentane sulfonate (DSS; NMR internal standard prepared in D2O). The final volume was adjusted to 700 µL, with a final DSS concentration of 0.5 mM. The samples were analyzed using a Bruker Avance 600 MHz NMR spectrometer (Bruker BioSpin, Milton, Canada).
2.5. Histological Analysis
Sections approximately 0.5 mm thick from the colon, jejunum, and liver were excised, rinsed with phosphate-buffered saline (PBS) to remove fecal contents, and fixed in 10% neutral buffered formalin for histological analysis. Tissue processing and slide preparation were performed by the Histology Laboratory, Faculty of Medicine, MUN. Hematoxylin and eosin (H&E) staining was used to evaluate tissue morphology. Liver lipid droplets, another primary outcome of the study, were quantified using ImageJ (version 1.53t; Java 1.8.0_345 [64-bit]). Histological parameters of the colon and jejunum were assessed using ToupView (version 4.11) according to laboratory-developed protocols [25]. All measurements were performed independently by two blinded investigators, and mean values were used for statistical analyses.
2.6. Statistical Analysis
All statistical analyses were conducted using IBM SPSS Statistics version 28.0.1.0, while GraphPad Prism version 9.5.1 was used exclusively for graph generation. One-way ANOVA was used to assess treatment effects. Data were log10-transformed when necessary to achieve normality; otherwise, raw data were used for statistical analyses. Post hoc comparisons were performed using Tukey’s test to identify significant differences between treatment groups. Metabolomic analyses of liver and fecal samples were conducted using MetaboAnalyst version 5.0. Metabolite data were normalized using quality control samples, followed by log transformation and mean centering. Principal component analysis (PCA) and partial least squares–discriminant analysis (PLS-DA) analysis were performed. Model validation, when required, was conducted using R² and Q² metrics with fivefold cross-validation [27]. A p-value < 0.05 was considered statistically significant for all analyses.
3. Results
3.1. Dietary VB6 Deficiency Influences Body Composition, Hepatic VB6 and Lipid Content and Gastrointestinal Morphology.
The growth of animals was significantly impacted by diet as well as the levels of dietary VB6 (Figure 2A). Quantitative analysis of hepatic PLP, a marker of VB6 status, confirmed a significant effect of dietary VB6 levels on hepatic VB6 concentrations. The HFD-LB6 group exhibited markedly lower hepatic VB6 levels compared with all other treatment groups (p < 0.001; Figure 2B), confirming successful induction of tissue VB6 deficiency. The reduction in tissue VB6 availability was associated with significant alterations in multiple physical parameters. Compared with the control and other treatment groups, the HFD-LB6 group showed a significant reduction in body weight (p < 0.001; Figure 2A). In contrast, relative liver weight (p < 0.001), brain weight (p < 0.001), and kidney weight (p = 0.022) were significantly increased in the HFD-LB6 group. Similarly, relative duodenojejunal length (p < 0.001), ileum length (p = 0.032), and total intestinal length (p < 0.001) were significantly altered in the HFD-LB6 group compared with the other groups. However, no significant treatment effects were observed for relative heart weight (p = 0.406) or colon length (p = 0.797; Supplementary Table 1) indicating neither HFD nor the dietary VB6 level have effects on these organs.
Histological examination revealed significant alterations in liver and specific gut tissues. In the liver, animals on the HFD diet had significantly higher levels of lipid droplet content compared to the control (p<0.001, Figure 2C-D). However, most parameters of gut histology were not affected, except jejunum villous width, which was slightly but significant increased (p=0.01) in HFD-groups regardless of VB6 levels, and jejunum crypt depth, which also slightly increased but significantly (p=0.038) in HFD-LB6 group compared to the other treatment groups (Table S3).
3.2. Dietary VB6 Modulates Clinical Markers Associated with MASLD
Clinical markers in plasma and liver after eight weeks of dietary intervention with varying VB6 levels are presented in Table 1. Hepatic TG levels differed significantly among treatment groups (p = 0.021), with higher concentrations in HFD-LB6 animals than in control animals. In contrast, plasma TG levels were significantly reduced in the HFD-LB6 group compared with all other groups (p = 0.004; Table 1). Total cholesterol levels were significantly increased in all HFD-fed groups compared with the control group (p < 0.001). Similarly, plasma LDL-C levels were higher in HFD-fed animals compared with control (p < 0.001). Unexpectedly, plasma liver enzyme levels differed among the HFD-fed groups: ALT levels were higher in the HFD-HB6 group, whereas AST levels were significantly lower in the HFD-LB6 group compared with the other treatment groups (p = 0.02). Plasma glucose levels were also lower in the HFD-LB6 group compared with all other treatments, whereas other clinical markers, including albumin and creatinine, were not significantly affected.
3.3. Dietary VB6 Deficiency Disrupts Intermediates of 1C Metabolism.
Dietary VB6 deficiency significantly altered several metabolites associated with 1C metabolism. Plasma levels of homocysteine (p = 0.006), glycine (p < 0.001), and serine (p = 0.028) were significantly elevated, whereas betaine (p = 0.016) and glutamic acid (p = 0.032) were significantly reduced in HFD-LB6 animals compared with the other treatment groups (Figure 3).
3.4. Dietary VB6 Deficiency Alters 1H-NMR-Based Liver and Fecal Metabolites.
The metabolic profile of liver samples was characterized using 1H-NMR spectroscopy, and the resulting spectra were processed using Bayesil.ca, identifying a total of 54 metabolites. PCA did not reveal clear separation among the treatment groups (Figure 4A). In contrast, PLS-DA showed modest separation of the HFD-LB6 group from the other treatment groups, while the HFD groups were positioned opposite to the control group. The first two components explained 36.7% of the total variance, with Component 1 and Component 2 accounting for 7.5% and 29.2% of the variance, respectively (Figure 4B). Variable importance in projection (VIP) analysis identified betaine and 2-hydroxyvalerate as the metabolites contributing most strongly to the observed group separation (Figure 4C–E). Betaine, an important metabolite involved in 1C metabolism, was significantly lower in the HFD-LB6 group than in the other treatment groups, suggesting an association between VB6 status and hepatic betaine metabolism. In contrast, 2-hydroxyisovalerate was significantly higher across all HFD groups, suggesting a predominant effect of the HFD. To further examine metabolic alterations associated with low VB6 status, the control group was excluded, and multivariate analyses were performed exclusively among the HFD groups with different levels of dietary VB6. PCA did not demonstrate clear separation among the HFD groups; however, PLS-DA showed distinct separation of the HFD-LB6 group from the other two HFD groups. The first two components accounted for 43.3% of the total variance, with Component 1 and Component 2 explaining 32.4% and 10.9% of the variance, respectively (Figure S2A–B). These findings suggest that low VB6 status alters hepatic metabolic profile. VIP scores plot identified serine and betaine, both of which are closely involved in 1C metabolism, as the metabolites contributing most strongly to the separation of the HFD-LB6 group. Serine was significantly higher, whereas betaine was significantly lower, in the HFD-LB6 group compared with the other HFD groups (Figure S2C–E).
Similar to the liver metabolomic analysis, a total of 70 1H-NMR-based metabolites were identified in fecal samples. The PCA scores plot showed modest separation of the control group from the HFD groups, with the first two principal components explaining 39.2% of the total variance (PC1: 25.0%; PC2: 14.2%, Figure 5A). This separation was more evident in the PLS-DA scores plot, in which the first two components explained 20.3% of the total variance (Component 1: 12.1%; Component 2: 8.2%, Figure 5B). VIP scores plot identified 3-hydroxyisovalerate and glycerol as the metabolites contributing most strongly to the separation between the control and HFD groups (Figure 5C–E). To further assess the effects of dietary VB6 levels on the fecal metabolic profile, multivariate analyses were performed exclusively among the HFD groups. PCA did not show clear separation among the treatment groups; however, PLS-DA demonstrated distinct separation of the HFD-LB6 group from the other HFD groups. The first two components explained 37.5% of the total variance, with Component 1 and Component 2 accounting for 15.9% and 21.6% of the variance, respectively (Figure S3A–B). Similar to the liver metabolites, these findings suggest that dietary VB6 status also alters fecal metabolic profile. VIP scores plot identified tryptophan and hippuric acid as the metabolites contributing most strongly to the separation among the HFD groups (Figure S3C–E). Notably, fecal tryptophan concentrations were significantly lower in the HFD group compared with the control group, but increased under low-VB6 conditions.
4. Discussion
MASLD is a multifactorial disease influenced by various metabolic disturbances. One of the key factors associated with its development is micronutrient status, particularly VB6, which plays a crucial role in 1C metabolism. VB6 deficiency has been shown to impair several metabolic processes, potentially contributing to liver dysfunction and MASLD development. In this study, we investigated how varying levels of dietary VB6, particularly in the context of HFD, affected clinical markers of liver health, metabolic pathways, and gut morphology. These findings provide new insights into the complex relationship between dietary VB6 status and MASLD development.
Our study showed that feeding C57Bl/6J male mice a HFD for eight weeks resulted in significant metabolic disturbances, particularly when combined with low dietary levels of VB6. Notably, the HFD-LB6 group exhibited significantly lower body weight compared to the control and other treatment groups, validating that a VB6 deficiency contributes to lower body weight [24,28] even fed with HFD. It is most likely due to lowered food intake and impaired nutrient metabolism specifically amino acid and lipid metabolism [24,29]. We also observed an increase in the percentage of liver weight in all HFD groups compared to the control. This suggests that the HFD itself is primarily responsible for the observed increase in liver weight, which aligns with the known effects of HFD on liver enlargement [30]. Interestingly, the HFD-LB6 group exhibited significantly higher relative brain and kidney weights than the other groups. Given the relatively stable growth and physiological importance of these organs, the increased relative weights may largely reflect the markedly lower body weight of the HFD-LB6 animals rather than an actual increase in organ mass. Nevertheless, the possibility that VB6 deficiency independently affects the development and functions of these organs cannot be excluded. VB6 deficiency can impair the synthesis of neuroactive compounds, including serotonin [31], reduces glucose utilization in the brain [32], and disrupts serotonin signaling in pancreatic islets in diabetic mice [33]. These metabolic and neuroendocrine disturbances may contribute to increased oxidative stress and inflammation during nutritional stress.
The impact of VB6 deficiency on gut morphology revealed that the HFD-LB6 group had a significantly greater total intestinal length, particularly in the duodenojejunal region, than all other treatment groups. This finding suggests that low dietary VB6 levels may contribute to increased intestinal length. Such elongation, particularly in the duodenojejunal region, may enhance nutrient absorption under conditions of limited dietary nutrient availability [34]. A longer gut could increase the time of luminal contents in contact with the intestinal lining, potentially enhancing nutrient absorption. Interestingly, while our study shows gut elongation in response to nutrient deficiency, other studies have demonstrated that prolonged nutrient excess, such as in genetically obese mice, also leads to increases in intestinal length and size as an adaptation to increased nutrient intake [35]. This highlights the intestine's ability to adapt structurally in response to varying nutritional states, whether due to deficiency or excess.
Our study also investigated the effects of varying dietary VB6 levels on several biochemical markers and revealed significant alterations among the treatment groups. We measured hepatic VB6 concentrations across all treatment groups. As expected, the HFD-LB6 group exhibited significantly lower hepatic VB6 levels than all other groups. Unexpectedly, hepatic VB6 levels in the HFD-OB6 group were significantly lower than those in the control group, despite both groups receiving similar dietary levels of VB6. The lower hepatic VB6 levels observed in the HFD-OB6 group may suggest that the physiological requirement for VB6 increases under metabolic insults such as obesity and related metabolic disorders including, fatty liver disease [36]. Plasma TG levels were significantly lower and liver TG levels were higher in the HFD-LB6 group compared to all other groups. This pattern is consistent with impaired hepatic TG export rather than reduced synthesis. One plausible mechanism linking VB6 status to this phenotype involves PC availability. VB6 deficiency lowers CBS activity and impairs transsulfuration [24]; restricted homocysteine clearance may lead to hepatic SAH accumulation and a decline in the SAM:SAH ratio[37]. PEMT activity is sensitive to this ratio, and PEMT-derived PC is required for normal VLDL assembly [38]. Consistent with this, PEMT−/− mice fed a high-fat, high-cholesterol diet accumulate hepatic TG and secrete less apoB100, with correspondingly lower plasma TG and apoB levels [39]. CBS and PEMT activities were not measured in the present study, so this mechanism remains inferential and warrants direct testing. Nonetheless, it provides a plausible explanation for the dissociation between p lasma and hepatic TG levels observed under VB6 restriction.
Moreover, total cholesterol levels were significantly higher in all HFD diet groups compared to the control group, indicating that the HFD diet itself is a primary driver of total cholesterol elevation. Interestingly, levels of HDL-C were lowered, and LDL-C were higher in HFD-LB6 animals compared to other groups fed with HFD diet, suggesting potential protective role of VB6 in improving cholesterol profile in HFD-fed animals. Previous studies have shown that VB6 deficiency lowered all lipid components, including HDL-C and total cholesterol [38]. In contrast, plasma ALT levels were elevated in HFD-HB6 group, indicating that high-dose VB6 supplementation provided no additional protective benefit. These findings suggest that an optimal level of dietary VB6 is necessary to maintain lipid homeostasis and normal liver enzyme levels.
Plasma glucose levels were significantly lower in the HFD-LB6 group compared to all other groups. Studies suggest that VB6 functions as a cofactor in several enzymes critical for carbohydrate metabolism, particularly in glycogenolysis and gluconeogenesis [40,41,42]. Glycogen can be made accessible to the cell by glycogen phosphorylase, a PLP-dependent enzyme that hydrolyzes α-1,4-glycosidic bonds to generate glucose-1-phosphate. Lower VB6 levels can impair glycogenolysis by inhibiting glycogen phosphorylase, reducing the body's ability to mobilize glucose from glycogen stores. Interestingly, pharmacological inhibition of glycogen phosphorylase has been investigated as a potential therapeutic approach for type 2 diabetes [20]. As such reducing hepatic glycogen breakdown may decrease hepatic glucose output and help improve glycemic control. Although the control and HFD diets differed slightly in carbohydrate composition, the lower plasma glucose levels observed in the HFD-LB6 group may be primarily associated with dietary VB6 restriction.
Our targeted LC-MS-based and 1H-NMR-based metabolites identified several significant metabolites impaired either due to HFD or dietary VB6 levels. It can be noted that 1C metabolism is a fundamental biochemical pathway that integrates essential metabolic reactions such as methylation, DNA synthesis, and lipid metabolism. Its role in maintaining liver function is particularly important, as disruptions in 1C metabolism can lead to imbalances in lipid handling and export, contributing to conditions like MASLD. The efficient transfer of 1C units is crucial for pathways like the methionine and folate cycles, which are directly linked to hepatic lipid homeostasis [43]. In our study, metabolites of 1C pathway such as homocysteine, serine, and glycine were elevated, while levels of betaine, and glutamic acid were reduced in HFD-LB6 animals compared to other groups. This indicates a disruption in the transsulfuration pathway due to VB6 deficiency [44]. This disruption compromised the conversion of homocysteine to cystathionine, leading to an accumulation of homocysteine, which is known to contribute to endothelial dysfunction, oxidative stress, and an increased risk of cardiovascular disease [18,45]. VB6 acts as a cofactor for CBS and CGL, enzymes involved in the transsulfuration pathway that converts homocysteine to cysteine [46] and lower hepatic levels of this vitamin might have resulted in the impairment of these two enzymes leading to the elevation of homocysteine. The accumulation of homocysteine likely resulted in decreased cysteine levels, a precursor for glutathione, thereby increasing oxidative stress in the liver [47]. Elevated oxidative stress is a key factor in the progression of MASLD, potentially exacerbating the transition from simple steatosis to steatohepatitis and fibrosis [48]. Additionally, the decrease in betaine levels in the HFD-LB6 group suggests impaired remethylation of homocysteine to methionine, a process crucial for maintaining cellular methylation capacity. This reduction in betaine and the subsequent impact on SAM levels could lead to global hypomethylation as well as the formation of VLDL for lipid export, thus contributing to the progression of liver diseases [18]. Interestingly, we also observed a significant elevation of liver 2-hydroxyisovalerate concentrations in most of the HFD groups irrespective of the VB6 levels. It is the breakdown product of branched chain amino acid valine and has been recently demonstrated to be negatively associated with obesity and related metabolic diseases [49,50].
Fecal metabolites serve as important indicators of gut microbial activity and an overall metabolic health. They provide valuable insights into the interactions between the gut microbiota and the host, particularly in conditions like MASLD, where the gut-liver-axis plays a critical role in disease progression. The analysis of fecal metabolites revealed significant changes in glycerol and 3-hydroxyisovalerate as the top metabolites significantly increased in all HFD groups compared to the control. It has been well documented that HFD increases fecal lipid excretion most likely due to the higher dietary fat that cannot be absorbed into the body excreted out of the body [51,52]. Recently, it has also been documented the higher presence of fecal 3-hydroxyisovalerate in animals fed with HFD [53], most likely resulting from increase breakdown of branch-chain amino acid such as leucine in the gut. We also found that fecal tryptophan concentrations were significantly lower in the HFD group compared with the control group, consistent with previous findings [54]. This reduction may be attributable to increased conversion of tryptophan through downstream pathways, such as serotonin and kynurenine metabolism in the gut, or increased conversion into microbial metabolites. Tryptophan metabolism is critically linked to the composition and activity of the gut microbiota, which can convert tryptophan into various metabolites that influence liver function and immune responses [55]. It can be noted that an increase in peripheral serotonin production in the intestinal cell can drive obesity [56], while higher concentration of kynurenine/kynurenic acid can also cause liver toxicity [57,58]. Interestingly, VB6 deficiency increased fecal tryptophan levels in the HFD group, indicating a potential limiting role of PLP in downstream tryptophan metabolism. VB6 also plays a crucial role as a cofactor in tryptophan-kynurenine pathway [59], and it’s deficiency can alter the gut microbiome [60], which may shift the abundance of tryptophan-degrading microbes. Overall, HFD and dietary VB6 independently affected host hepatic and fecal metabolites in this mouse model of MASLD.
We acknowledge several limitations of this study. First, we were unable to accurately measure food consumption because the food pellets disintegrated rapidly into crumbs that became mixed with the bedding, making it difficult to separate and quantify food intake accurately. Additionally, the study did not include a pair-feeding approach; therefore, we cannot exclude the possibility that differences in food intake contributed to the observed metabolic alterations. Second, body composition analysis using dual-energy X-ray absorptiometry (DXA) would have provided more detailed information on the lean and fat mass of the animals. Finally, we did not perform dietary VB6 repletion experiment, limiting our ability to determine whether the observed metabolic alterations are reversible following the restoration of adequate VB6 intake. These limitations highlight some of the practical challenges encountered during the study and could be addressed in future research.
5. Conclusions
This study highlights the importance of dietary VB6 status in modulating metabolic outcomes in the context of HFD-induced MASLD. As expected, animals in the HFD-LB6 group exhibited significantly lower hepatic VB6 levels. These animals also showed metabolic alterations, including lower plasma TG and glucose levels, together with elevated hepatic TG content, highlighting the potential role of VB6 in maintaining lipid homeostasis. Alterations in 1C metabolism were also evident, with significant changes in key metabolites, including homocysteine, glycine, and betaine, in both plasma and liver samples. In addition, altered fecal levels of glycerol and 3-hydroxyisovalerate were observed in HFD-fed groups, while fecal tryptophan levels were higher in HFD-LB6 animals, further suggesting gut metabolic disturbances associated with low VB6 status. Collectively, these findings underscore the importance of adequate dietary VB6 intake in maintaining lipid homeostasis, glucose regulation, and 1C metabolism during HFD-induced metabolic stress. Inadequate VB6 intake may contribute to metabolic dysregulation and exacerbate hepatic steatosis associated with MASLD.
Supplementary Materials
The following supporting information can be downloaded at the website of this paper posted on Preprints.org.
Author Contributions
investigation, formal analysis and data interpretation, writing original draft preparation A.R.; assistance with animal terminations, S.A. and K.S.H.; lipid-droplet quantification using ImageJ, K.S.H..; supervision in clinical markers analysis and review, E.R.; conceptualization, writing, review and editing, and funding acquisition, S.M.; All authors have read and agreed to the published version of the manuscript.
Funding
This research was funded by Natural Sciences and Engineering Research Council of Canada (NSERC), grant number RGPIN-2022-04076 and Memorial University of Newfoundland.
Institutional Review Board Statement
The animal study protocol was approved by the Institutional Review Board (Animal Care Committee) of MEMORIAL UNIVERSITY OF NEWFOUNDLAND (protocol code 22-01-SM; July 19, 2022).
Informed Consent Statement
Not applicable.
Data Availability Statement
The original contributions presented in this study are included in the article/supplementary material. Further inquiries can be directed to the corresponding author.
Acknowledgments
The authors acknowledge the technical support provided by the Histology Laboratory and the Division of Laboratory Medicine at Memorial University of Newfoundland, the Metabolomics Innovation Centre, and the Centre for Chemical Analysis, Research and Training at Memorial University of Newfoundland.
Conflicts of Interest
The authors declare no conflicts of interest. The funders had no role in the design of the study; in the collection, analyses, or interpretation of data; in the writing of the manuscript; or in the decision to publish the results.:
Abbreviations
The following abbreviations are used in this manuscript:
| 1C | One-carbon |
| 1H-NMR | 1 proton- nuclear magnetic resonance |
| ALP | Alkaline phosphatase |
| ALT | Alanine aminotransferase |
| AST | Aspartate aminotransferase |
| CBS | cystathionine β-synthase |
| CGL | cystathionine γ-lyase |
| CRP | C-reactive protein |
| GGT | Glutamyl transferase |
| HCC | Hepatocellular carcinoma |
| HDL-C | High-density lipoprotein cholesterol |
| HFD | High-fat diet |
| HFD-OB6 | High-fat diet- Optimum B6 |
| HFD-HB6 | High-fat diet-High B6 |
| HFD-LB6 | High-fat diet-Low B6 |
| LDL-C | Low-density lipoprotein cholesterol |
| MS | Metabolic syndromes |
| MASLD | Metabolic dysfunction-associated steatotic liver disease |
| MASH | Metabolic dysfunction-associated steatohepatitis |
| NASH | Non-alcoholic steatohepatitis |
| PLP | Pyridoxal phosphate |
| PC | Principal component |
| PCA | Principal component analysis |
| PLS-DA | Partial least squares-discriminant analysis |
| TG | Triglycerides |
| VB6 | Vitamin B6 |
| VLDL | Very low-density lipoprotein |
| VIP | Variable importance in projection |
References
- Younossi, Z.M.; Golabi, P.; Paik, J.M.; Henry, A.; Van Dongen, C.; Henry, L. The global epidemiology of nonalcoholic fatty liver disease (NAFLD) and nonalcoholic steatohepatitis (NASH): a systematic review. Hepatology 2023, 77, 1335–1347. [Google Scholar] [CrossRef]
- Almeda-Valdes, P.; Aguilar-Olivos, N.; Uribe, M.; Méndez-Sánchez, N. Common features of the metabolic syndrome and nonalcoholic fatty liver disease. Rev. Recent Clin. Trials 2014, 9, 148–158. [Google Scholar] [CrossRef]
- Zhang, R.; Li, J.; Gong, Y.; Mu, K.; Zheng, J.; Yin, X. The global economic burden of cirrhosis and other chronic liver diseases: A health-augmented macroeconomic modeling study. Hepatol. Commun. 2026, 10. [Google Scholar] [CrossRef]
- Wang, L.; Wang, Y. Non-Invasive Tests for the Detection of MASLD: Biomarkers and Imaging for Staging Steatosis, MASH, and Fibrosis. Int. J. General. Med. 2026, 19, 593387. [Google Scholar] [CrossRef]
- Qasim, A.; Alataa, R.; Veena, F.; Shehi, E. The new era of MASH pharmacotherapy: a comprehensive review of FDA-approved and emerging agents. Front. Gastroenterol. 2026, 5, 1850915. [Google Scholar] [CrossRef]
- Guirguis, E.; Dougherty, J.; Thornby, K.; Grace, Y.; Mack, K. Resmetirom: The First Food and Drug Administration-Approved Medication for Nonalcoholic Steatohepatitis (NASH). Ann. Pharmacother. 2025, 59, 162–173. [Google Scholar] [CrossRef]
- Alqahtani, S.A.; Schneider, C.V.; Schattenberg, J.M. Ageing liver in the era of MASLD: risks, mechanisms and treatment opportunities. Frontline Gastroenterol. 2026. [Google Scholar] [CrossRef]
- Takahashi, Y.; Fukusato, T. Histopathology of nonalcoholic fatty liver disease/nonalcoholic steatohepatitis. World J. Gastroenterol. 2014, 20, 15539–15548. [Google Scholar] [CrossRef]
- Tandra, S.; Yeh, M.M.; Brunt, E.M.; Vuppalanchi, R.; Cummings, O.W.; Ünalp-Arida, A.; Wilson, L.A.; Chalasani, N. Presence and significance of microvesicular steatosis in nonalcoholic fatty liver disease. J. Hepatol. 2011, 55, 654–659. [Google Scholar] [CrossRef]
- Basaranoglu, M.; Basaranoglu, G.; Sentürk, H. From fatty liver to fibrosis: a tale of "second hit. World J. Gastroenterol. 2013, 19, 1158–1165. [Google Scholar] [CrossRef]
- Li, Y.Y.; Zheng, T.L.; Xiao, S.Y.; Wang, P.; Yang, W.J.; Jiang, L.L.; Chen, L.L.; Sha, J.C.; Jin, Y.; Chen, S.D.; et al. Hepatocytic ballooning in non-alcoholic steatohepatitis: Dilemmas and future directions. Liver international: official journal of the International Association for the Study of the Liver 2023, 43, 1170–1182. [Google Scholar] [CrossRef]
- Rolo, A.P.; Teodoro, J.S.; Palmeira, C.M. Role of oxidative stress in the pathogenesis of nonalcoholic steatohepatitis. Free Radic. Biol. Med. 2012, 52, 59–69. [Google Scholar] [CrossRef]
- Anstee, Q.M.; Reeves, H.L.; Kotsiliti, E.; Govaere, O.; Heikenwalder, M. From NASH to HCC: current concepts and future challenges. Nat. Rev. Gastroenterol. Hepatol. 2019, 16, 411–428. [Google Scholar] [CrossRef]
- Taylor, R.S.; Taylor, R.J.; Bayliss, S.; Hagström, H.; Nasr, P.; Schattenberg, J.M.; Ishigami, M.; Toyoda, H.; Wai-Sun Wong, V.; Peleg, N.; et al. Association Between Fibrosis Stage and Outcomes of Patients With Nonalcoholic Fatty Liver Disease: A Systematic Review and Meta-Analysis. Gastroenterology 2020, 158, 1611–1625.e1612. [Google Scholar] [CrossRef]
- Radziejewska, A.; Muzsik, A.; Milagro, F.I.; Martínez, J.A.; Chmurzynska, A. One-Carbon Metabolism and Nonalcoholic Fatty Liver Disease: The Crosstalk between Nutrients, Microbiota, and Genetics. Lifestyle Genom. 2020, 13, 53–63. [Google Scholar] [CrossRef]
- Ducker, G.S.; Rabinowitz, J.D. One-Carbon Metabolism in Health and Disease. Cell Metab. 2017, 25, 27–42. [Google Scholar] [CrossRef]
- Selhub, J. Folate, vitamin B12 and vitamin B6 and one carbon metabolism. J. Nutr. Health Aging 2002, 6, 39–42. [Google Scholar]
- Yang, J.; Li, H.; Deng, H.; Wang, Z. Association of One-Carbon Metabolism-Related Vitamins (Folate, B6, B12), Homocysteine and Methionine With the Risk of Lung Cancer: Systematic Review and Meta-Analysis. Front. Oncol. 2018, 8, 493. [Google Scholar] [CrossRef]
- Rizki, G.; Arnaboldi, L.; Gabrielli, B.; Yan, J.; Lee, G.S.; Ng, R.K.; Turner, S.M.; Badger, T.M.; Pitas, R.E.; Maher, J.J. Mice fed a lipogenic methionine-choline-deficient diet develop hypermetabolism coincident with hepatic suppression of SCD-1. J. Lipid Res. 2006, 47, 2280–2290. [Google Scholar] [CrossRef]
- Parra, M.; Stahl, S.; Hellmann, H. Vitamin B₆ and Its Role in Cell Metabolism and Physiology. Cells 2018, 7. [Google Scholar] [CrossRef]
- Kobayashi, T.; Kessoku, T.; Ozaki, A.; Iwaki, M.; Honda, Y.; Ogawa, Y.; Imajo, K.; Yoneda, M.; Saito, S.; Nakajima, A. Vitamin B6 efficacy in the treatment of nonalcoholic fatty liver disease: an open-label, single-arm, single-center trial. J. Clin. Biochem. Nutr. 2021, 68, 181–186. [Google Scholar] [CrossRef]
- Bruins, M.J.; Bird, J.K.; Aebischer, C.P.; Eggersdorfer, M. Considerations for Secondary Prevention of Nutritional Deficiencies in High-Risk Groups in High-Income Countries. Nutrients 2018, 10. [Google Scholar] [CrossRef]
- Ahmed, M.; Praneet Ng, A.; L'Abbe, M.R. Nutrient intakes of Canadian adults: results from the Canadian Community Health Survey (CCHS)-2015 Public Use Microdata File. Am. J. Clin. Nutr. 2021, 114, 1131–1140. [Google Scholar] [CrossRef]
- Mayengbam, S.; Raposo, S.; Aliani, M.; House, J.D. Oral exposure to the anti-pyridoxine compound 1-amino d-proline further perturbs homocysteine metabolism through the transsulfuration pathway in moderately vitamin B6 deficient rats. J. Nutr. Biochem. 2015, 26, 241–249. [Google Scholar] [CrossRef]
- Hossain, K.S.; Rasouli, A.; Amarasena, S.; Kroezen, Z.; Kurysko, N.; Shanmuganathan, M.; Brunton, J.A.; Lamers, Y.; Tahlan, K.; Britz Mckibbin, P.; et al. Dietary Vitamin B-9 and B-12 Deficiencies Alter Gut Homeostasis in Sprague–Dawley Rats. J. Nutr. 2026, 156, 101385. [Google Scholar] [CrossRef]
- Mayengbam, S.; Lambert, J.E.; Parnell, J.A.; Tunnicliffe, J.M.; Nicolucci, A.C.; Han, J.; Sturzenegger, T.; Shearer, J.; Mickiewicz, B.; Vogel, H.J.; et al. Impact of dietary fiber supplementation on modulating microbiota-host-metabolic axes in obesity. J. Nutr. Biochem. 2019, 64, 228–236. [Google Scholar] [CrossRef]
- Mayengbam, S.; Raman, M.; Parnell, J.A.; Eksteen, B.; Lambert, J.E.; Eller, L.K.; Nicolucci, A.C.; Aktary, M.L.; Reimer, R.A. Effects of combined prebiotic fiber supplementation and weight loss counseling in adults with metabolic dysfunction-associated steatotic liver disease: a randomized controlled trial. Eur. J. Nutr. 2025, 64, 144. [Google Scholar] [CrossRef]
- Qian, B.; Shen, S.; Zhang, J.; Jing, P. Effects of Vitamin B6 Deficiency on the Composition and Functional Potential of T Cell Populations. J. Immunol. Res. 2017, 2017, 2197975. [Google Scholar] [CrossRef]
- Liu, G.; Sun, C.; Liu, H.; Li, F.; Zhu, Y.; Li, F. Effects of dietary supplement of vitamin B6 on growth performance and non-specific immune response of weaned rex rabbits. J. Appl. Anim. Res. 2018, 46, 1370–1376. [Google Scholar] [CrossRef]
- Varani, J.; McClintock, S.D.; Knibbs, R.N.; Harber, I.; Zeidan, D.; Jawad-Makki, M.A.H.; Aslam, M.N. Liver Protein Expression in NASH Mice on a High-Fat Diet: Response to Multi-Mineral Intervention. Front. Nutr. 2022, 9, 859292. [Google Scholar] [CrossRef]
- Allen, G.F.; Neergheen, V.; Oppenheim, M.; Fitzgerald, J.C.; Footitt, E.; Hyland, K.; Clayton, P.T.; Land, J.M.; Heales, S.J. Pyridoxal 5'-phosphate deficiency causes a loss of aromatic L-amino acid decarboxylase in patients and human neuroblastoma cells, implications for aromatic L-amino acid decarboxylase and vitamin B(6) deficiency states. J. Neurochem. 2010, 114, 87–96. [Google Scholar] [CrossRef]
- Wei, I.L.; Huang, Y.H.; Wang, G.S. Vitamin B6 deficiency decreases the glucose utilization in cognitive brain structures of rats. J. Nutr. Biochem. 1999, 10, 525–531. [Google Scholar] [CrossRef]
- Fields, A.M.; Welle, K.; Ho, E.S.; Mesaros, C.; Susiarjo, M. Vitamin B6 deficiency disrupts serotonin signaling in pancreatic islets and induces gestational diabetes in mice. Commun. Biol. 2021, 4, 421. [Google Scholar] [CrossRef]
- Weaver, L.T.; Austin, S.; Cole, T.J. Small intestinal length: a factor essential for gut adaptation. Gut 1991, 32, 1321–1323. [Google Scholar] [CrossRef]
- Stojanović, O.; Altirriba, J.; Rigo, D.; Spiljar, M.; Evrard, E.; Roska, B.; Fabbiano, S.; Zamboni, N.; Maechler, P.; Rohner-Jeanrenaud, F.; et al. Dietary excess regulates absorption and surface of gut epithelium through intestinal PPARα. Nat. Commun. 2021, 12, 7031. [Google Scholar] [CrossRef]
- Aasheim, E.T.; Hofsø, D.; Hjelmesaeth, J.; Birkeland, K.I.; Bøhmer, T. Vitamin status in morbidly obese patients: a cross-sectional study. Am. J. Clin. Nutr. 2008, 87, 362–369. [Google Scholar] [CrossRef]
- Barak, A.J.; Beckenhauer, H.C.; Mailliard, M.E.; Kharbanda, K.K.; Tuma, D.J. Betaine Lowers Elevated S-Adenosylhomocysteine Levels in Hepatocytes from Ethanol-Fed Rats. J. Nutr. 2003, 133, 2845–2848. [Google Scholar] [CrossRef]
- Bordoni, A.; Cabrini, L.; Marchetti, M.; Danesi, F.; Bochicchio, D.; Biagi, P.L.; Maranesi, M. Vitamin B6 deficiency and dietary fats: effects on lipid composition and glutathione peroxidase activity in rat liver. Ann. Nutr. Metab. 2006, 50, 305–312. [Google Scholar] [CrossRef]
- Zhao, Y.; Su, B.; Jacobs, R.L.; Kennedy, B.; Francis, G.A.; Waddington, E.; Brosnan, J.T.; Vance, J.E.; Vance, D.E. Lack of phosphatidylethanolamine N-methyltransferase alters plasma VLDL phospholipids and attenuates atherosclerosis in mice. Arterioscler. Thromb. Vasc. Biol. 2009, 29, 1349–1355. [Google Scholar] [CrossRef]
- Szymańska, E.; Jóźwiak-Dzięcielewska, D.A.; Gronek, J.; Niewczas, M.; Czarny, W.; Rokicki, D.; Gronek, P. Hepatic glycogen storage diseases: pathogenesis, clinical symptoms and therapeutic management. Arch. Med. Sci. AMS 2021, 17, 304–313. [Google Scholar] [CrossRef]
- Tran, J.U.; Brown, B.L. Structural Basis for Allostery in PLP-dependent Enzymes. Front. Mol. Biosci. 2022, 9, 884281. [Google Scholar] [CrossRef]
- Adeva-Andany, M.M.; González-Lucán, M.; Donapetry-García, C.; Fernández-Fernández, C.; Ameneiros-Rodríguez, E. Glycogen metabolism in humans. BBA Clin. 2016, 5, 85–100. [Google Scholar] [CrossRef]
- Spinelli, J.B.; Haigis, M.C. The multifaceted contributions of mitochondria to cellular metabolism. Nat. Cell Biol. 2018, 20, 745–754. [Google Scholar] [CrossRef]
- Field, D.T.; Cracknell, R.O.; Eastwood, J.R.; Scarfe, P.; Williams, C.M.; Zheng, Y.; Tavassoli, T. High-dose Vitamin B6 supplementation reduces anxiety and strengthens visual surround suppression. Hum. Psychopharmacol. 2022, 37, e2852. [Google Scholar] [CrossRef]
- Annibal, A.; Tharyan, R.G.; Schonewolff, M.F.; Tam, H.; Latza, C.; Auler, M.M.K.; Grönke, S.; Partridge, L.; Antebi, A. Regulation of the one carbon folate cycle as a shared metabolic signature of longevity. Nat. Commun. 2021, 12, 3486. [Google Scholar] [CrossRef]
- Conter, C.; Fruncillo, S.; Fernández-Rodríguez, C.; Martínez-Cruz, L.A.; Dominici, P.; Astegno, A. Cystathionine β-synthase is involved in cysteine biosynthesis and H(2)S generation in Toxoplasma gondii. Sci. Rep. 2020, 10, 14657. [Google Scholar] [CrossRef]
- Chen, Z.; Tian, R.; She, Z.; Cai, J.; Li, H. Role of oxidative stress in the pathogenesis of nonalcoholic fatty liver disease. Free Radic. Biol. Med. 2020, 152, 116–141. [Google Scholar] [CrossRef]
- Chen, M.; Zhang, H.; Ji, P. Therapeutic Potential of ACMSD Inhibitors in NAD+ Deficient Diseases. Drugs Drug Candidates 2025, 4, 7. [Google Scholar] [CrossRef]
- Vieira, J.P.P.; Ottosson, F.; Jujic, A.; Denisov, V.; Magnusson, M.; Melander, O.; Duarte, J.M.N. Metabolite Profiling in a Diet-Induced Obesity Mouse Model and Individuals with Diabetes: A Combined Mass Spectrometry and Proton Nuclear Magnetic Resonance Spectroscopy Study. Metabolites 2023, 13. [Google Scholar] [CrossRef]
- Venter, M.; Terburgh, K.; Lindeque, J.Z.; Ogasawara, E.; Janssen, M.C.H.; Smeitink, J.A.M.; Nakada, K.; Louw, R. Cross-species urinary metabolomics identifies 2-hydroxyisovalerate as a candidate biomarker for mtDNA-based disorders. Metabolomics 2026, 22, 140. [Google Scholar] [CrossRef]
- Murase, T.; Mizuno, T.; Omachi, T.; Onizawa, K.; Komine, Y.; Kondo, H.; Hase, T.; Tokimitsu, I. Dietary diacylglycerol suppresses high fat and high sucrose diet-induced body fat accumulation in C57BL/6J mice. J. Lipid Res. 2001, 42, 372–378. [Google Scholar] [CrossRef]
- Gao, Y.; Liu, N.; Wei, H.; Sun, T.; Xu, F.; Chen, L.; Qiu, J.; Dou, X. Raspberry aqueous extract ameliorates MAFLD in mice by regulating gut microbiota and purine metabolism. Front. Nutr. 2026, 13, 1818086. [Google Scholar] [CrossRef]
- Menezes, A.; Walter-Nuno, A.B.; Costa-Bartuli, E.; Moreira, D.; El-Bacha, T.; Méndez, A.P.; Amarante, A.; Kistenmacker, N.; Huaman, P.; Busch, M.; et al. A diet-induced obese and diabetic host phenotype reduces mosquito ZIKV infections and remodels gut metabolism. Front. Immunol. 2025, 16–2025. [Google Scholar] [CrossRef]
- Lin, H.; An, Y.; Hao, F.; Wang, Y.; Tang, H. Correlations of Fecal Metabonomic and Microbiomic Changes Induced by High-fat Diet in the Pre-Obesity State. Sci. Rep. 2016, 6, 21618. [Google Scholar] [CrossRef]
- Gao, K.; Mu, C.L.; Farzi, A.; Zhu, W.Y. Tryptophan Metabolism: A Link Between the Gut Microbiota and Brain. Adv. Nutr. 2020, 11, 709–723. [Google Scholar] [CrossRef]
- Wang, L.; Fan, X.; Han, J.; Cai, M.; Wang, X.; Wang, Y.; Shang, J. Gut-Derived Serotonin Contributes to the Progression of Non-Alcoholic Steatohepatitis via the Liver HTR2A/PPARγ2 Pathway. Front. Pharmacol. 2020, 11, 553. [Google Scholar] [CrossRef]
- Tan, Q.; Deng, S.; Xiong, L. Role of Kynurenine and Its Derivatives in Liver Diseases: Recent Advances and Future Clinical Perspectives. Int. J. Mol. Sci. 2025, 26. [Google Scholar] [CrossRef]
- Mor, A.; Tankiewicz-Kwedlo, A.; Krupa, A.; Pawlak, D. Role of Kynurenine Pathway in Oxidative Stress during Neurodegenerative Disorders. Cells 2021, 10. [Google Scholar] [CrossRef]
- Davis, I.; Liu, A. What is the tryptophan kynurenine pathway and why is it important to neurotherapeutics? Expert Rev. Neurother. 2015, 15, 719–721. [Google Scholar] [CrossRef]
- Mayengbam, S.; Chleilat, F.; Reimer, R.A. Dietary Vitamin B6 Deficiency Impairs Gut Microbiota and Host and Microbial Metabolites in Rats. Biomedicines 2020, 8, 469. [Google Scholar] [CrossRef]
Figure 1.
Roles of VB6 in 1C metabolism. DHF, dihydrofolate; THF, tetrahydrofolate; Met, methionine; SAM, S-adenosylmethionine; SAH, S-adenosylhomocysteine; Hcy, homocysteine; PtdEth, phosphatidylethanolamine; PtdChol, phosphatidylcholine; CDP-choline, cytidine-diphosphocholine.
Figure 1.
Roles of VB6 in 1C metabolism. DHF, dihydrofolate; THF, tetrahydrofolate; Met, methionine; SAM, S-adenosylmethionine; SAH, S-adenosylhomocysteine; Hcy, homocysteine; PtdEth, phosphatidylethanolamine; PtdChol, phosphatidylcholine; CDP-choline, cytidine-diphosphocholine.
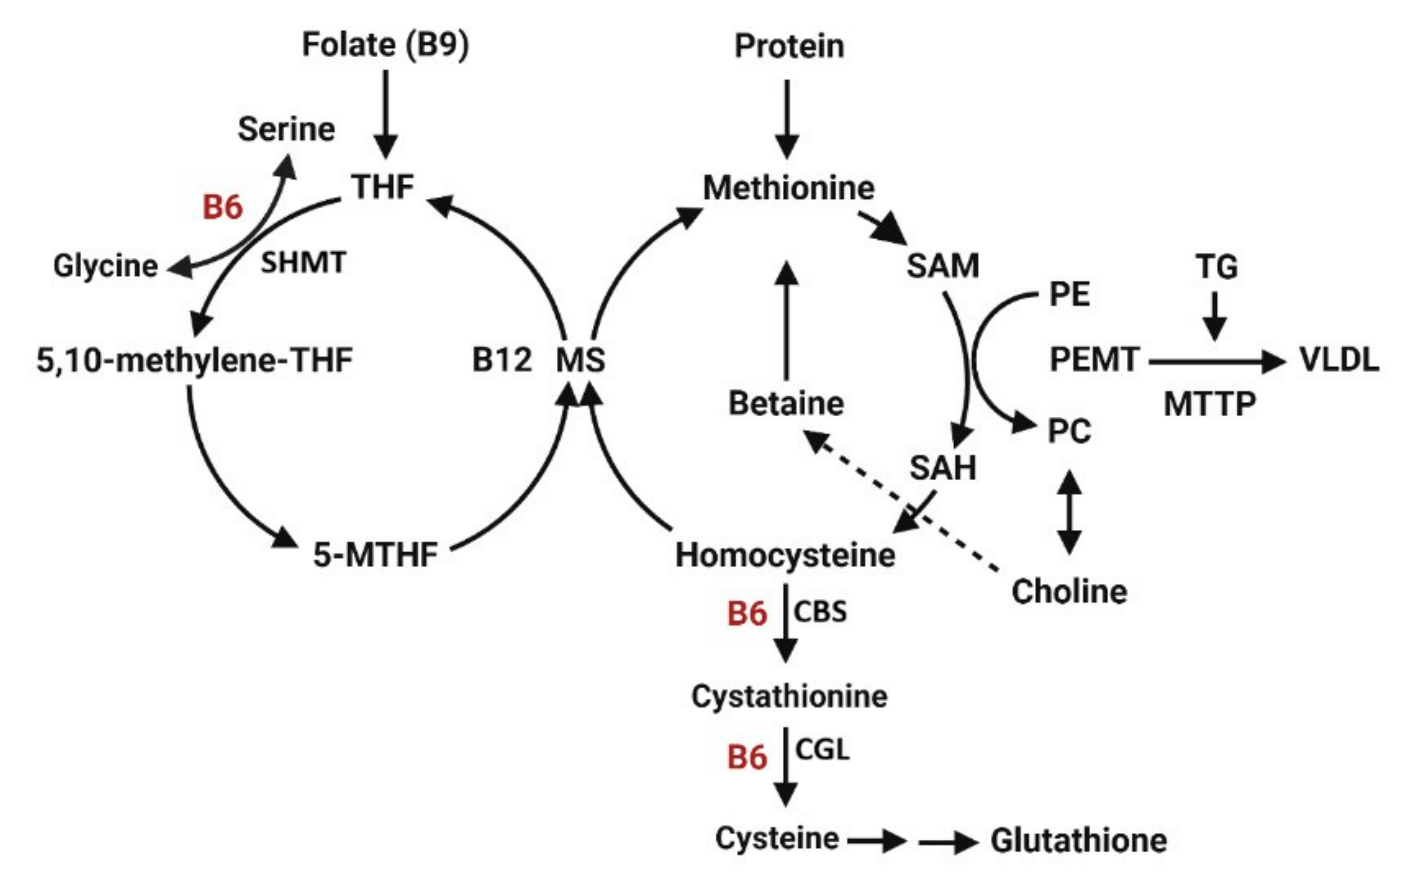
Figure 2.
Impact of dietary VB6 levels body growth (A), hepatic PLP (B), and lipid content (C-D). Values are expressed as mean ± SD. Groups with different letters (a, b, c) indicate significant differences determined by one-way ANOVA followed by Tukey’s post hoc test (p < 0.05). n=7-8/group.
Figure 2.
Impact of dietary VB6 levels body growth (A), hepatic PLP (B), and lipid content (C-D). Values are expressed as mean ± SD. Groups with different letters (a, b, c) indicate significant differences determined by one-way ANOVA followed by Tukey’s post hoc test (p < 0.05). n=7-8/group.
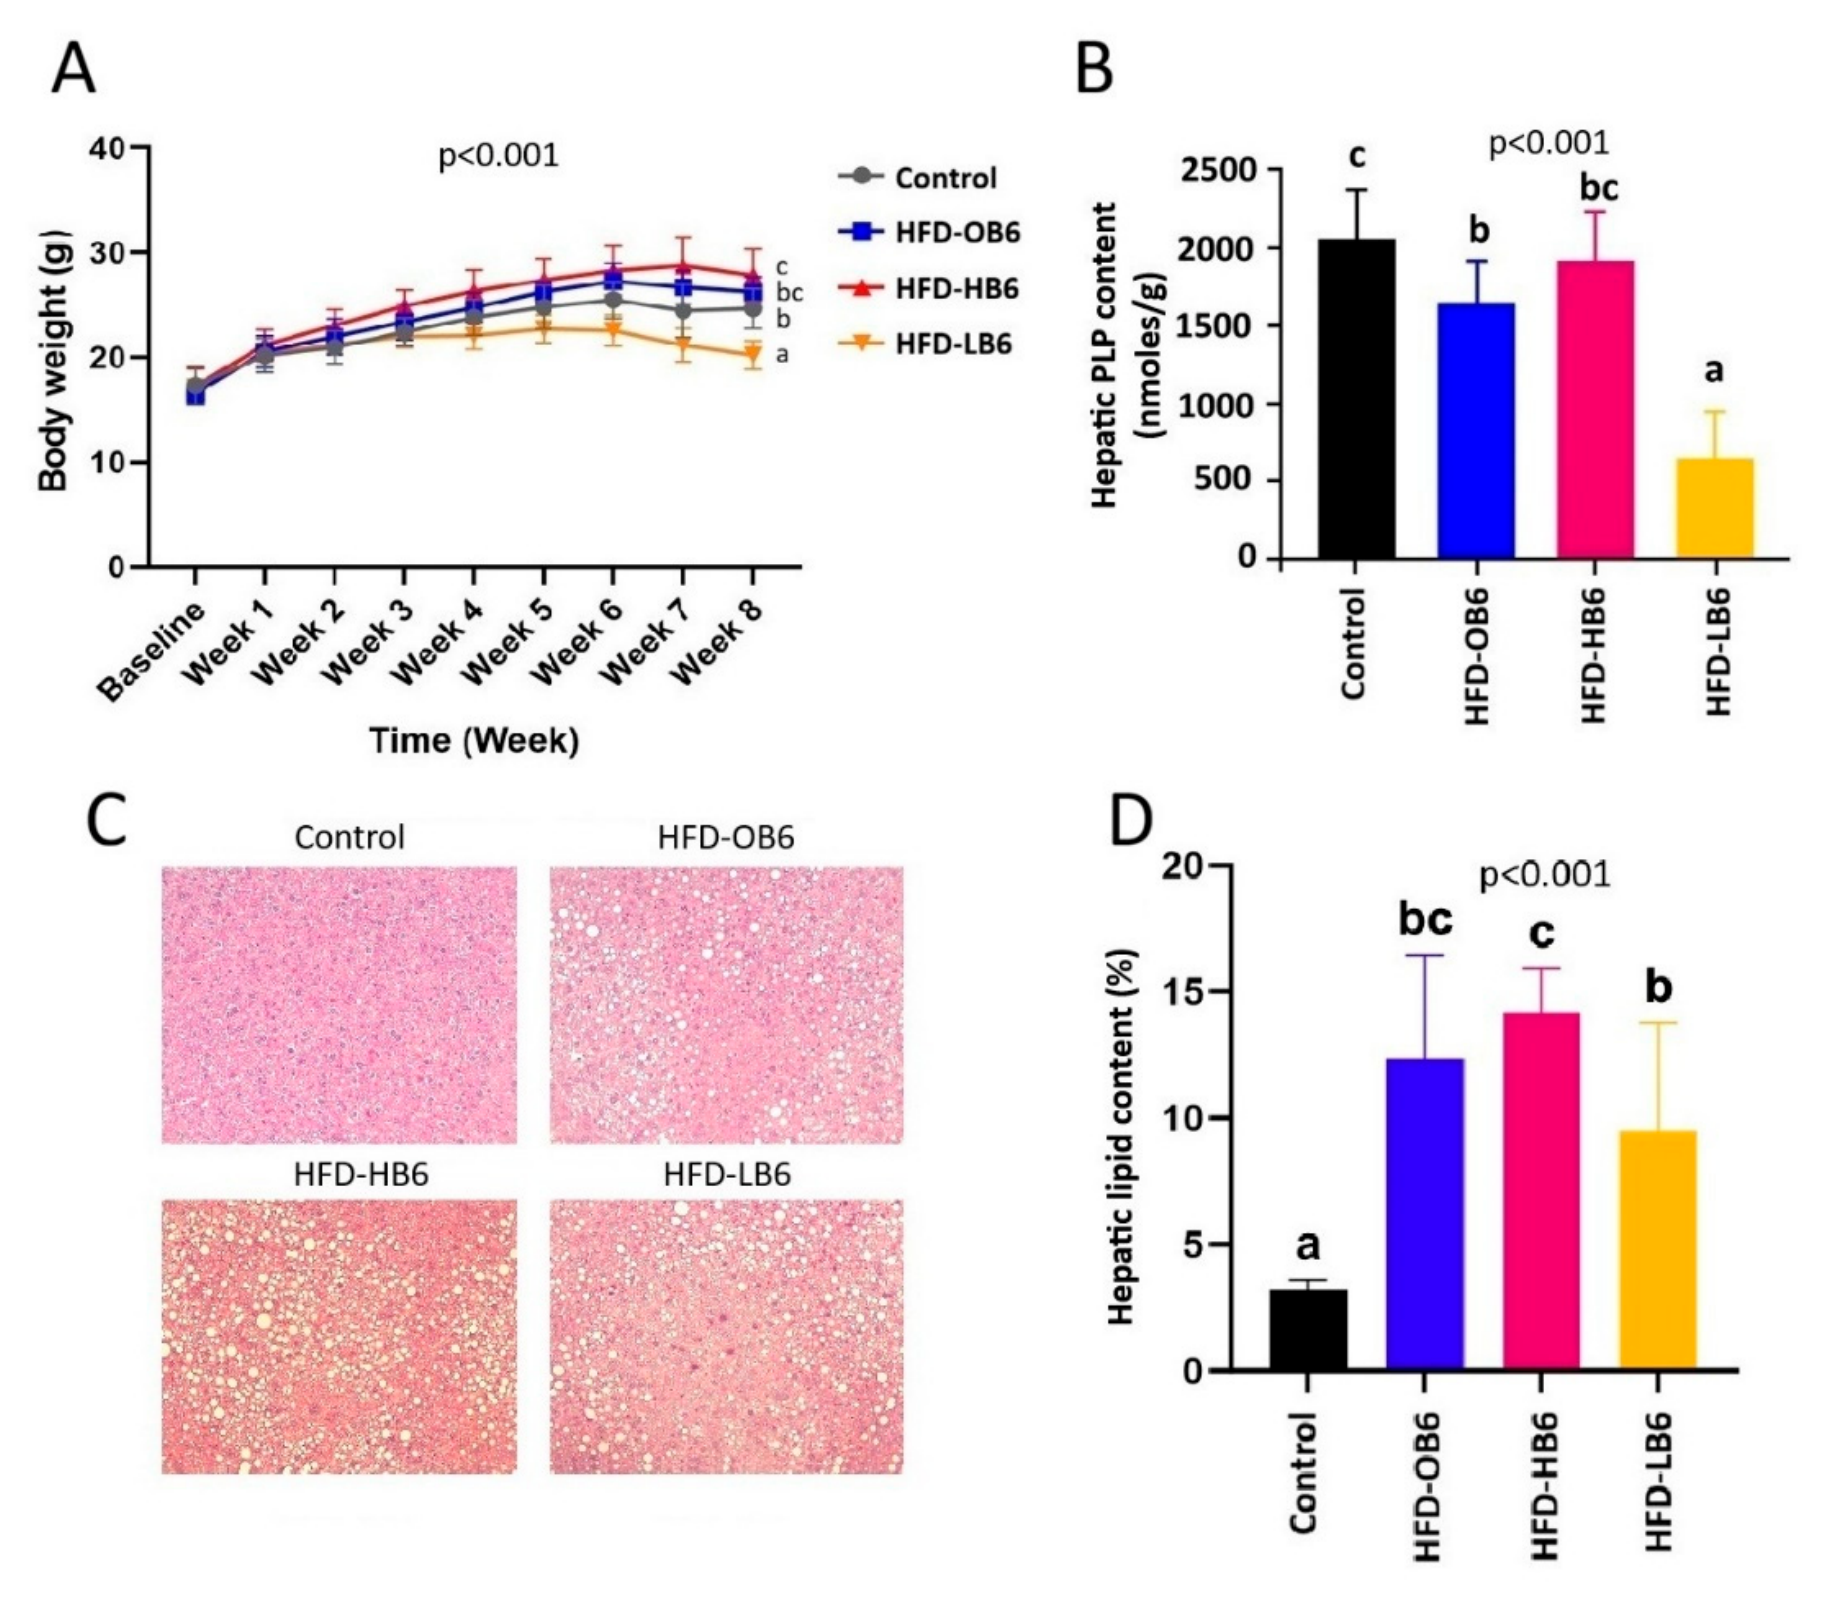
Figure 3.
Impact of dietary VB6 levels on plasma metabolites involved in 1C metabolism in animals after eight weeks of dietary intervention. Values are expressed as mean ± SD. Groups with different letters (a, b, c) indicate significant differences determined by one-way ANOVA followed by Tukey’s post hoc test (p < 0.05). n=7-8/group.
Figure 3.
Impact of dietary VB6 levels on plasma metabolites involved in 1C metabolism in animals after eight weeks of dietary intervention. Values are expressed as mean ± SD. Groups with different letters (a, b, c) indicate significant differences determined by one-way ANOVA followed by Tukey’s post hoc test (p < 0.05). n=7-8/group.
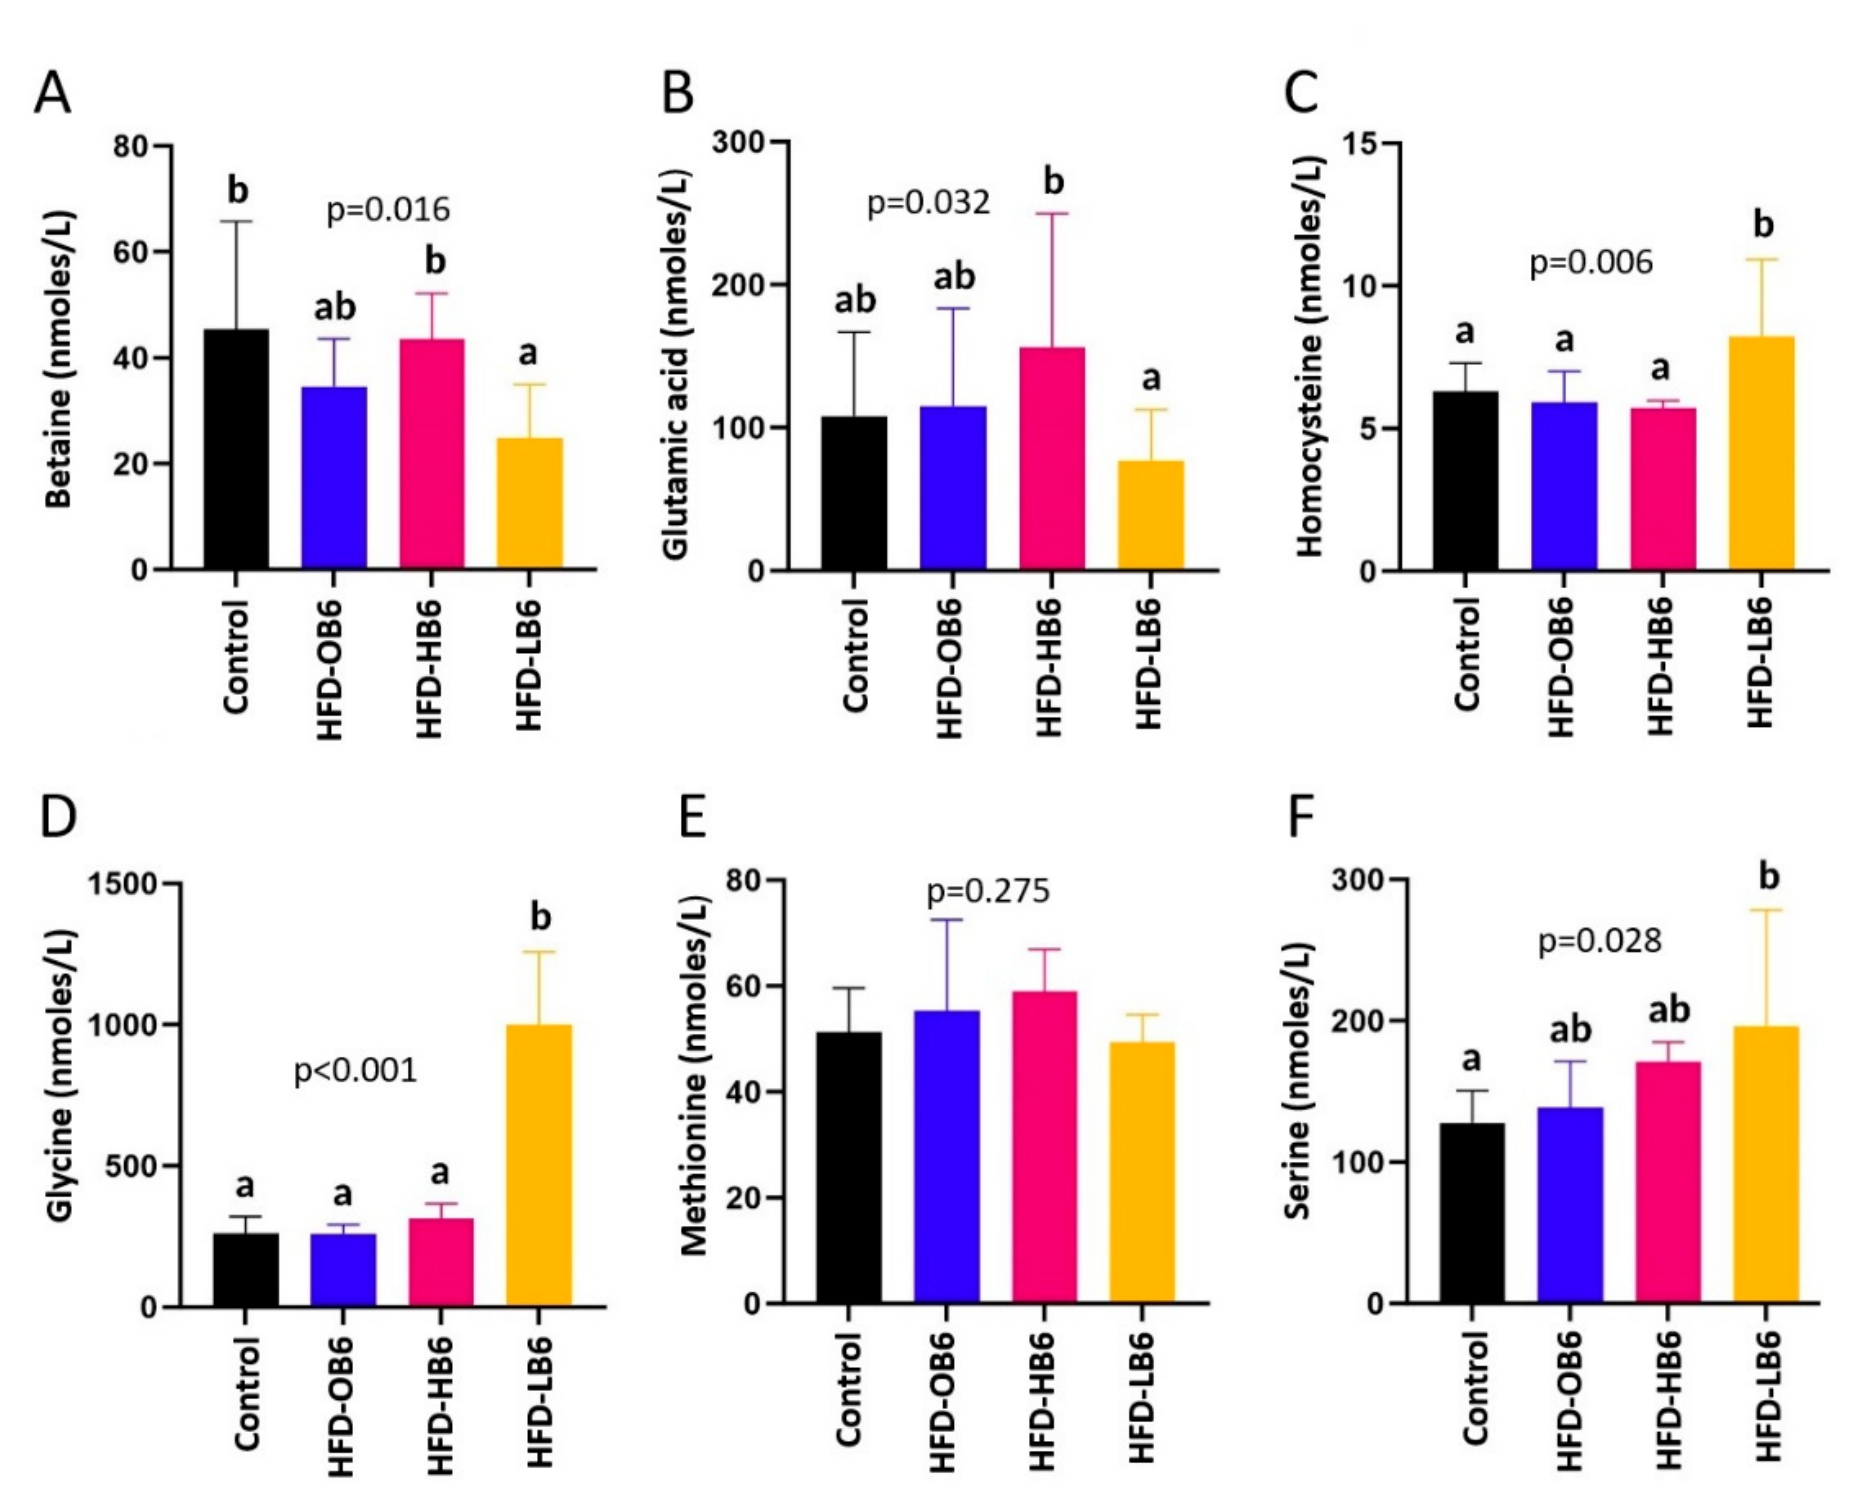
Figure 4.
Liver metabolites profile showing separation of treatment groups through PCA (A) and PLS-DA (B) analyses. VIP scores plot (C) identified betaine and 2-hydroxyisovalerate as the top metabolites differentiating the treatment groups. n=7-8/group.
Figure 4.
Liver metabolites profile showing separation of treatment groups through PCA (A) and PLS-DA (B) analyses. VIP scores plot (C) identified betaine and 2-hydroxyisovalerate as the top metabolites differentiating the treatment groups. n=7-8/group.
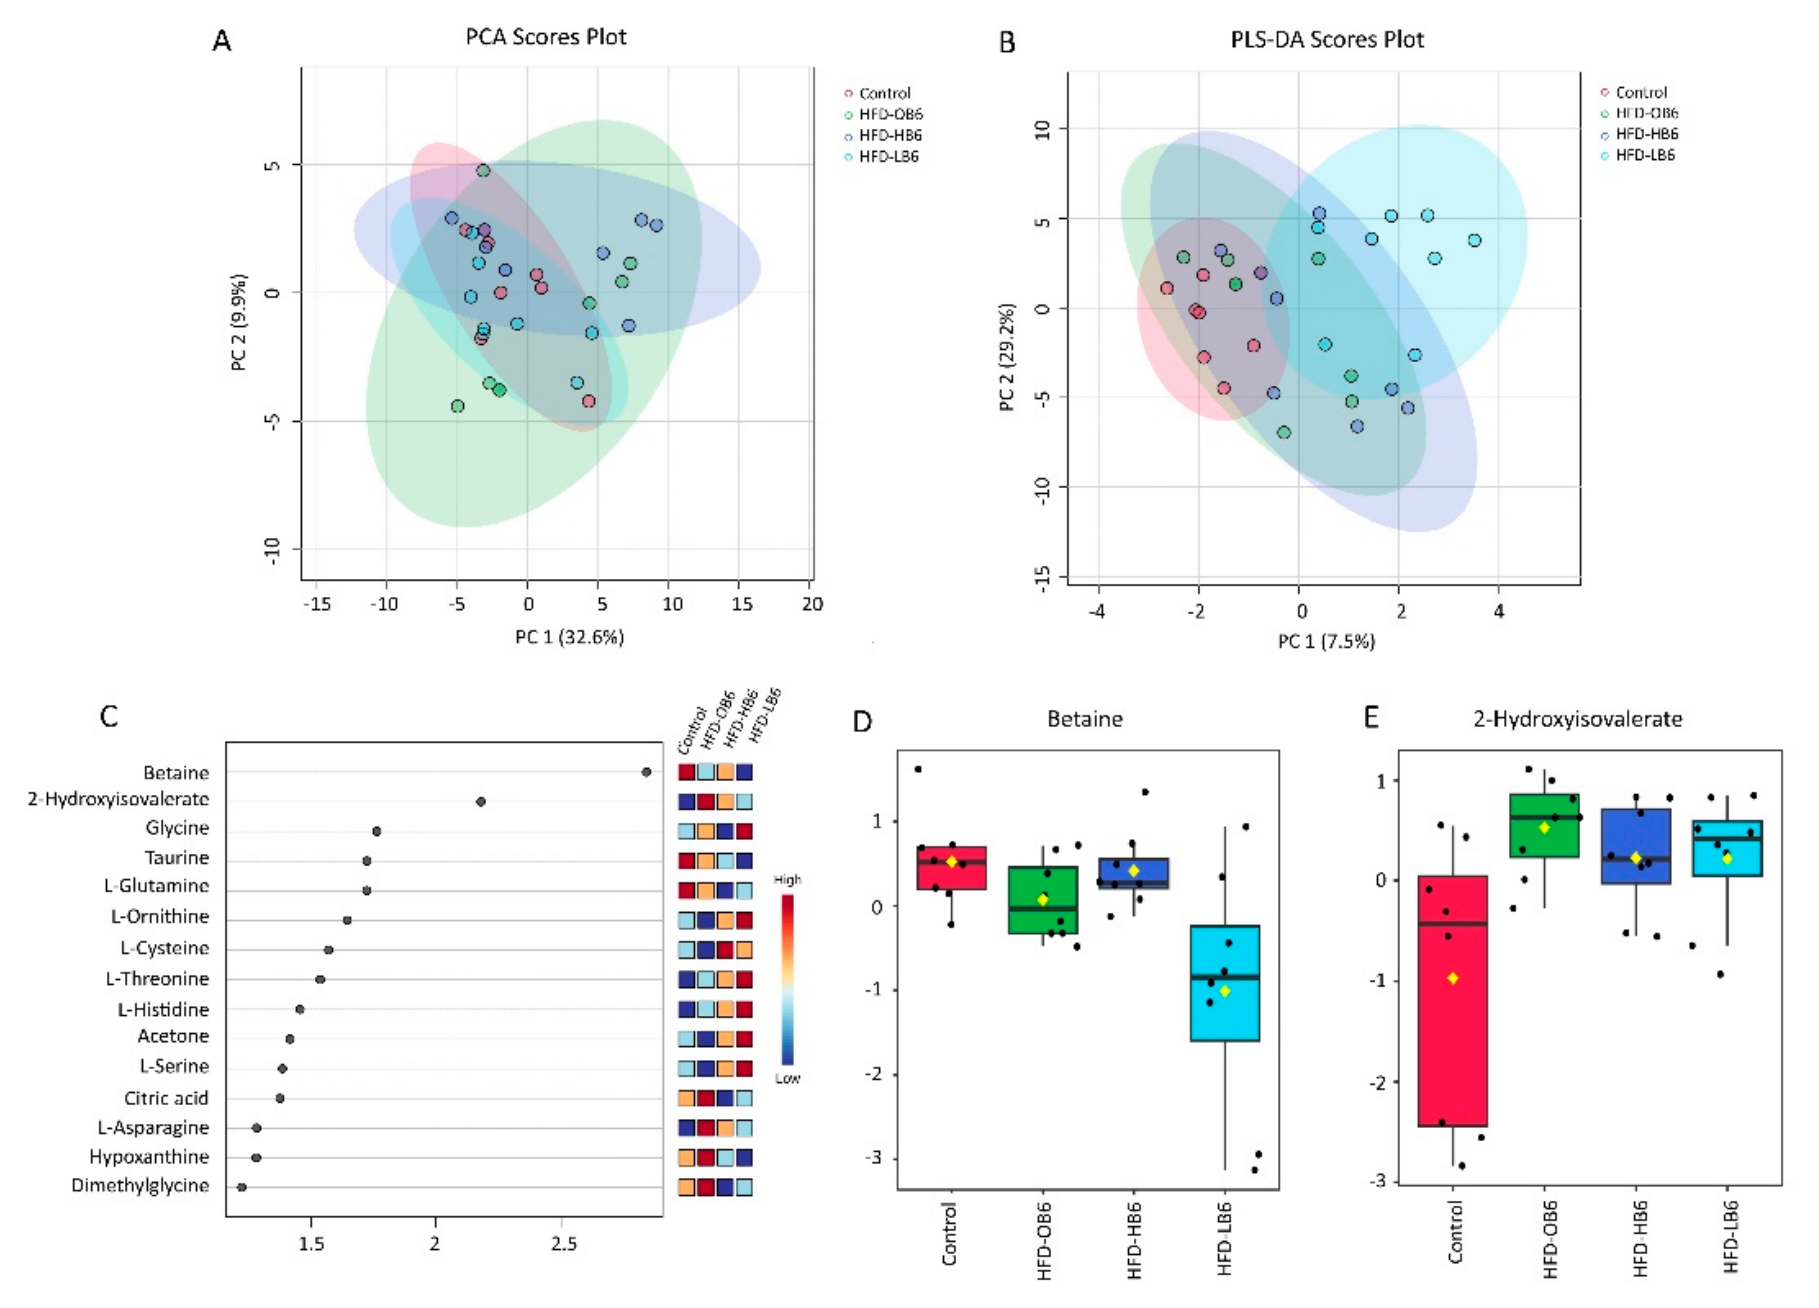
Figure 5.
Fecal metabolites profile showing separation of treatment groups through PCA (A) and PLS-DA (B) analyses. VIP scores plot (C) identified 3-Hydroxyisovalerate and Glycerol as the top metabolites differentiating the treatment groups. n=7-8/group.
Figure 5.
Fecal metabolites profile showing separation of treatment groups through PCA (A) and PLS-DA (B) analyses. VIP scores plot (C) identified 3-Hydroxyisovalerate and Glycerol as the top metabolites differentiating the treatment groups. n=7-8/group.
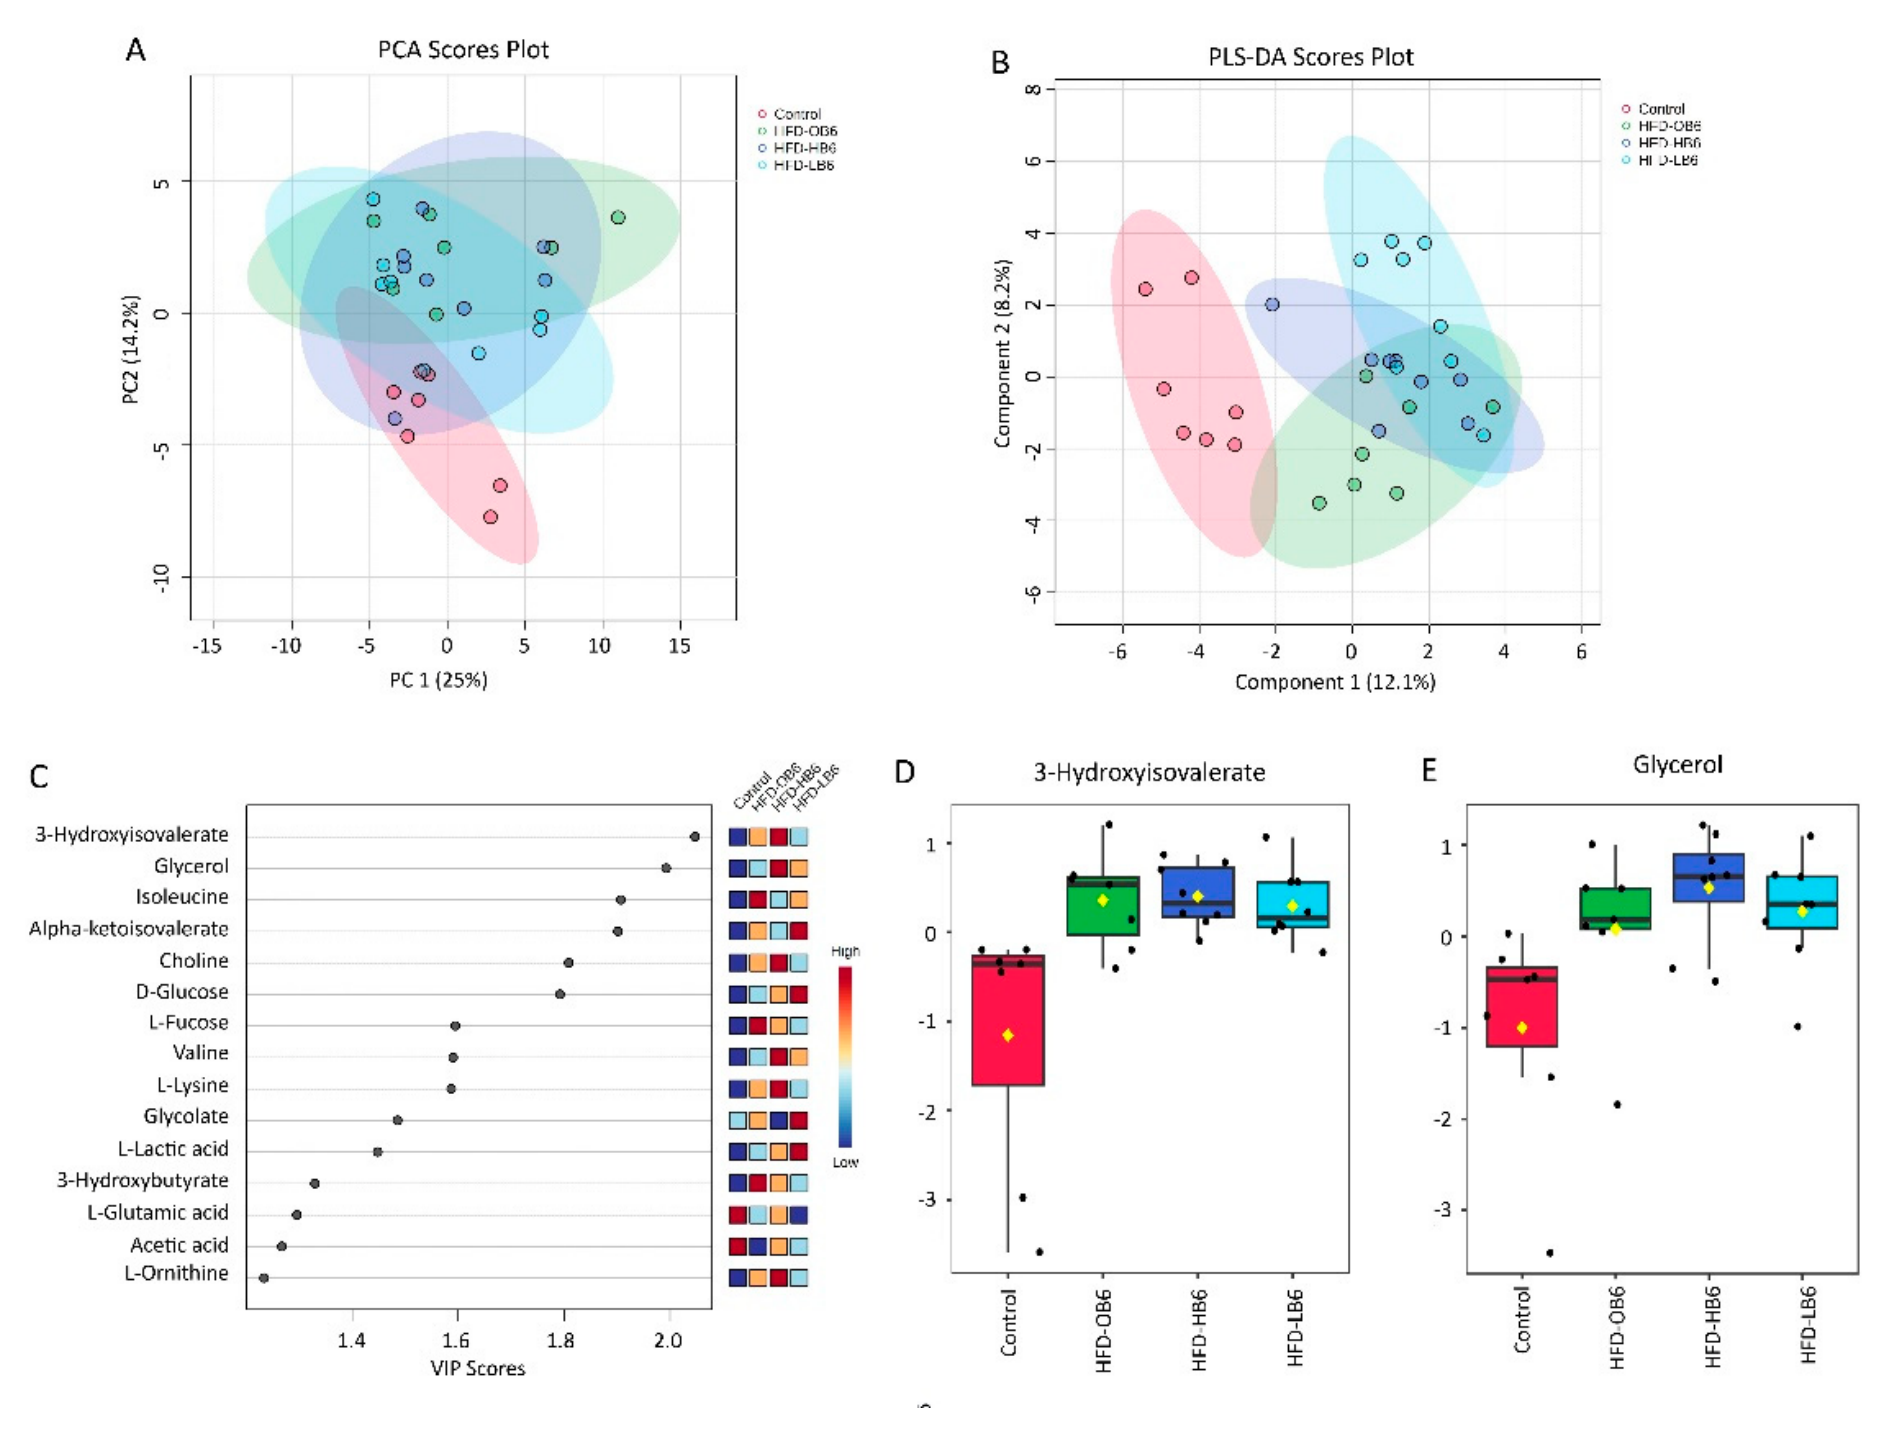

Table 1.
Clinical markers in plasma and liver of animals after eight weeks of dietary intervention*.
Table 1.
Clinical markers in plasma and liver of animals after eight weeks of dietary intervention*.
| Parameters | Control | HFD-OB6 | HFD-HB6 | HFD-LB6 | p-value |
|---|---|---|---|---|---|
| Liver TG (mg/g) | 139.6±54.4a | 176.7±21ab | 199.4±69 ab | 218.4±39 b | 0.021 |
| Plasma TG (mmol/L) | 0.8±0.3b | 1.1±0.4b | 0.9±0.3b | 0.6±0.2a | 0.004 |
| Total-Cholesterol (mmol/L) | 2.6±0.5a | 3.4±0.4b | 3.5±0.3b | 3.3±0.2b | <0.001 |
| HDL-C(mmol/L) | 1.5±0.2a | 1.8±0.3b | 2±0.2b | 1.6±0.3a | < 0.001 |
| LDL-C (mmol/L) | 1.1±0.2a | 1.6±0.5b | 1.4±0.3ab | 1.7±0.2b | <0.001 |
| ALT (U/L) | 185.1±185.3a | 169.9±130.9a | 444.3±237.2b | 57.6±28.1a | 0.001 |
| AST (U/L) | 792.8±496.2b | 808.7±507.5b | 908.3±614.2b | 198.2±62.9a | 0.022 |
| ALP (U/L) | 63.8±9b | 57.6±8.8b | 49.1±9.6a | 65.2±13.2b | 0.013 |
| Albumin (g/L) | 8.5±0.7 | 7.4±0.7 | 8.1±0.6 | 8.6±1.5 | 0.064 |
| Creatinine (umol/L) | 33.5±19.6 | 27.2±19.7 | 15±3.1 | 20±6 | 0.196 |
| Glucose (mmol/L) | 15.8±4.8b | 13.4±4.3b | 13.6±4.6b | 9.5±2.9a | 0.040 |
*Groups with different letters in the row are significantly different by one way ANOVA-test. Values are expressed as mean ± SD, n= 8 in Control, HFD-HB6, and HFD-LB6 and n=7 in HFD-OB6.
Disclaimer/Publisher’s Note: The statements, opinions and data contained in all publications are solely those of the individual author(s) and contributor(s) and not of MDPI and/or the editor(s). MDPI and/or the editor(s) disclaim responsibility for any injury to people or property resulting from any ideas, methods, instructions or products referred to in the content. |
© 2026 by the authors. Licensee MDPI, Basel, Switzerland. This article is an open access article distributed under the terms and conditions of the Creative Commons Attribution (CC BY) license (http://creativecommons.org/licenses/by/4.0/).
Copyright: This open access article is published under a Creative Commons CC BY 4.0 license, which permit the free download, distribution, and reuse, provided that the author and preprint are cited in any reuse.