

Submitted:
29 October 2026
Posted:
30 October 2026
You are already at the latest version
Abstract
Glioblastoma (GBM) remains one of the most aggressive primary brain tumors, with limited therapeutic options and a high rate of recurrence, highlighting the need for novel treatment strategies. Ixazomib (IXA), an orally bioavailable proteasome inhibitor, has demonstrated antitumor activity in preclinical models of GBM; however, the molecular mechanisms underlying its effects remain incompletely characterized. In the present study, we investigated the anti-glioblastoma activity of IXA with particular emphasis on apoptosis induction and cell cycle regulation across distinct GBM cell models. IXA treatment elicited substantial cytotoxic effects accompanied by activation of apoptotic signaling. Concurrent activation of caspase-8 and caspase-9 in several cell models indicated the involvement of both extrinsic and intrinsic apoptotic pathways. In parallel, IXA markedly altered cell cycle progression, although the nature and extent of these effects differed between cell lines, reflecting the molecular heterogeneity characteristic of GBM. These findings indicate that the cellular response to proteasome inhibition is strongly dependent on the molecular context of individual GBM models. Together with recent evidence demonstrating the proteasome dependence of recurrent GBM and the activity of IXA in patient-derived organoid and xenograft models, our results support further investigation of ixazomib as a potential therapeutic agent for GBM. In particular, elucidating cell-specific determinants of apoptotic and cell-cycle responses may facilitate the development of rational combination strategies aimed at enhancing the therapeutic efficacy of proteasome inhibition in glioblastoma.
Keywords:
glioblastoma
; ixazomib
; proteasome inhibitor
; apoptosis
; caspase-8
; caspase-9
; cell cycle
; therapeutic strategies
1. Introduction
Glioblastoma (GBM) is the most aggressive primary malignant tumor of the central nervous system and remains associated with a poor prognosis despite multimodal treatment. The current standard of care for newly diagnosed GBM consists of maximal safe surgical resection followed by radiotherapy with concomitant and adjuvant temozolomide [1]. Although this approach provides a clinically meaningful survival benefit compared with radiotherapy alone, disease recurrence remains almost inevitable, and effective treatment options for recurrent GBM remain limited [1]. The development of novel therapeutic strategies targeting specific biological vulnerabilities of GBM therefore remains a major unmet clinical need.
A defining feature of GBM is its pronounced molecular and cellular heterogeneity. Single-cell and integrative genomic studies have demonstrated that malignant cells within the same tumor can occupy distinct transcriptional and phenotypic states and retain substantial cellular plasticity [2,3,4]. The relative abundance of these cellular states varies between tumors and can be influenced by genetic alterations and the tumor microenvironment [2]. Such heterogeneity may contribute to differences in therapeutic response and represents an important challenge for the development of broadly effective treatments. Consequently, identification of molecular dependencies that can be therapeutically exploited across different GBM cellular contexts, as well as characterization of determinants of treatment sensitivity, remain important research objectives.
The ubiquitin–proteasome system (UPS) is a central regulator of intracellular protein homeostasis and controls the abundance of numerous proteins involved in proliferation, cell cycle progression, stress responses, DNA damage responses, and programmed cell death [5,6,7]. Proteasomal degradation is therefore essential for maintaining cellular homeostasis, whereas pharmacological inhibition of the proteasome can result in the accumulation of regulatory and damaged proteins and ultimately disrupt cellular survival mechanisms. Because malignant cells may experience increased proteotoxic stress and a greater dependence on efficient protein turnover, the proteasome has emerged as an established therapeutic target in oncology [5,6,7].
Proteasome inhibitors have demonstrated substantial clinical efficacy in hematological malignancies, particularly multiple myeloma, and their potential has subsequently been investigated in solid tumors [6,7]. In GBM, preclinical studies have demonstrated that proteasome inhibition can suppress proliferation and induce apoptosis and cell cycle perturbation. For example, treatment of human GBM cells with bortezomib markedly inhibited proliferation, induced G2/M cell cycle arrest, increased the expression of p21 and p27, altered the expression of several cell-cycle regulators, and induced apoptotic cell death [8]. Other studies have demonstrated that inhibition of the ubiquitin–proteasome system can induce both caspase-dependent and caspase-independent forms of cell death in GBM, with substantial differences in susceptibility between individual cell lines [9]. These findings provide a biological rationale for targeting the proteasome while simultaneously emphasizing the importance of cellular context in determining the response to proteasome inhibition.
Ixazomib (IXA; MLN9708) is an orally bioavailable, reversible 20S proteasome inhibitor that is rapidly converted to its biologically active form, MLN2238 [10,11]. The active compound preferentially inhibits the chymotrypsin-like β5 catalytic activity of the proteasome and thereby interferes with proteasome-dependent protein degradation [10,11]. IXA was developed as an orally administered proteasome inhibitor and has demonstrated clinical activity in multiple myeloma [10,11]. Its pharmacological properties and oral bioavailability provide a distinct therapeutic profile compared with earlier intravenously administered proteasome inhibitors and have stimulated investigation of its potential in other malignancies.
Importantly, there is now direct evidence supporting the feasibility of targeting GBM with IXA. A phase 0 clinical study demonstrated measurable concentrations of the biologically active form of IXA in tumor tissue obtained from patients with recurrent GBM following oral administration [12]. IXA concentrations of 2.03–7.88 ng/g were detected in brain tumor tissue in the three patients evaluated, demonstrating that the drug reaches the tumor compartment in vivo [12]. This finding is particularly relevant because insufficient penetration of systemically administered drugs into brain tumors represents an important limitation in GBM drug development. The demonstration of measurable IXA concentrations in GBM tissue therefore provides an important pharmacological rationale for further investigation of its biological activity.
Recent experimental findings have provided additional support for proteasome inhibition as a therapeutic strategy in recurrent GBM. Degorre and Tofilon reported that recurrent GBM xenografts displayed increased expression of proteasome-related genes and significantly higher proteasome activity than untreated tumors [13]. Notably, treatment with IXA following irradiation significantly prolonged survival in two glioma stem-like cell xenograft models, whereas IXA administered in the absence of prior irradiation did not significantly affect survival [13]. These observations suggest that proteasome dependence may become particularly relevant following therapeutic pressure and that the efficacy of IXA may be influenced by the biological state of recurrent tumors.
The therapeutic relevance of proteasome inhibition has also recently been demonstrated using patient-derived GBM tumor organoids. Jungwirth et al. performed automated high-throughput drug screening in tumor organoids generated from 11 patients with IDH-wild-type GBM and identified proteasome inhibitors, including carfilzomib, bortezomib, and ixazomib, among the compounds producing the strongest anti-glioma effects at the lowest tested concentrations [14]. The authors further demonstrated that the proteasome target PSMB5 was essential for GBM cell growth using RNA interference approaches [14]. These findings provide independent evidence that proteasome dependence can be detected in clinically derived GBM models and, importantly, directly support the investigation of IXA in the context of patient-derived disease. At the same time, the heterogeneous response of individual tumor organoids highlights the need to understand the cellular mechanisms underlying differential sensitivity to proteasome inhibition.
Apoptosis is one of the principal mechanisms through which anticancer agents eliminate malignant cells. Apoptotic signaling can be initiated through the extrinsic pathway, which involves death receptors and activation of the initiator caspase-8, or through the intrinsic mitochondrial pathway, which leads to apoptosome formation and activation of caspase-9 [15,16]. These pathways subsequently converge on executioner caspases and result in the characteristic biochemical and morphological changes associated with apoptotic cell death [15,16]. Proteasome inhibition can interfere with several prosurvival mechanisms and induce apoptosis in GBM cells [8,9]. Importantly, previous studies have demonstrated that the cellular response to proteasome inhibitors may differ substantially between GBM models, including differences in the relative contribution of apoptotic and non-apoptotic cell-death mechanisms [9]. Such observations raise the possibility that the molecular determinants of sensitivity to IXA may likewise differ between GBM cell lines.
Evidence from other tumor models indicates that ixazomib/MLN2238 can activate apoptotic signaling involving multiple caspases, including caspase-8 and caspase-9 [11]. However, direct characterization of these pathways following IXA exposure in GBM remains limited. Determining whether IXA induces activation of both extrinsic and intrinsic apoptotic signaling in GBM, and whether the relative contribution of these pathways differs between cellular models, may therefore provide important mechanistic insight into the response to proteasome inhibition.
In parallel with apoptosis, perturbation of cell cycle progression represents an important consequence of proteasome inhibition. The UPS regulates the abundance and activity of multiple proteins controlling cell cycle transitions, and inhibition of proteasomal degradation may consequently result in the accumulation of cell-cycle regulators and cell cycle arrest [5,8]. In GBM models, proteasome inhibition has been associated with G2/M arrest and alterations in the expression of proteins including p21, p27, cyclins, and cyclin-dependent kinases [8]. However, the specific cell-cycle response may vary depending on the cellular and molecular context [8,9]. Given the pronounced heterogeneity of GBM, characterization of cell-line-dependent changes in cell cycle progression may therefore be important for understanding the biological consequences of IXA treatment.
Despite increasing evidence supporting proteasome inhibition as a potential therapeutic strategy for GBM, the mechanisms underlying the response to IXA remain incompletely characterized. In particular, the extent to which IXA-induced cytotoxicity is associated with activation of distinct apoptotic pathways and perturbation of cell cycle progression, and whether these responses are conserved across different GBM models, remains insufficiently defined. Addressing this gap is particularly relevant in light of recent evidence demonstrating the activity of IXA in patient-derived GBM models and recurrent GBM xenografts [13,14].
Therefore, the aim of the present study was to characterize the anti-glioblastoma activity of IXA, with particular emphasis on apoptosis and cell cycle regulation in distinct GBM cell models. We investigated the activation of apoptotic signaling, including caspase-8- and caspase-9-dependent pathways, and evaluated changes in cell cycle distribution following IXA exposure. By comparing responses across different GBM models, we sought to determine whether IXA induces conserved cellular responses or whether its effects are strongly dependent on the cellular context. The present findings demonstrate substantial anti-glioblastoma activity of IXA and reveal pronounced cell-line-dependent differences in apoptotic and cell-cycle responses, providing further mechanistic support for the investigation of proteasome inhibition as a potential component of combination-based therapeutic strategies for GBM.
2. Materials and Methods
2.1. Reagents
Cell cultures: Dulbecco’s modified Eagle’s medium (DMEM), containing glucose (4.5 mg/mL) with GlutaMaxTM, fetal bovine serum Gold (FBS Gold), phosphate buffer saline (PBS), trypsin-EDTA, streptomycin and penicillin, was obtained from Gibco (San Diego, CA, USA) while 3-(4,5-dimethylthiazol-2-yl)-2,5-diphenyltetrazolium bromide was provided by Merck (St. Louis, MO, USA). Ixazomib was provided by MedChemExpress (NewYork city, NY, USA). The RIPA buffer and the Protease/Phosphatase Inhibitor Cocktail were products of Cell Signalling Technology (Boston, MA, USA).
Flow cytometry methods: The FITC Annexin V apoptosis detection Kit I was obtained from BD PharmingenTM (San Diego, CA, USA). The FAM-LEHD-FMK Caspase-9 Assay, FAM-LETD-FMK Caspase-8 Assay were purchased from ImmunoChemistry Technologies (Davis, CA, USA).
2.2. Cell Culture and Exposure to Ixazomib
The GBM cell lines: A172, LN229, T98G, and U118-MG were obtained from the American Type Culture Collection (ATCC). The cells were cultured in DMEM, supplemented with penicillin (100 U/mL), streptomycin (100 μg/mL) and 10% heat-inactivated fetal bovine serum Gold (FBS Gold), in accordance with the manufacturer’s recommendations. Cells were cultured at 37 oC in an atmosphere enriched with 5% CO2, provided by a Galaxy S+ incubator (RS Biotech, Irvine, UK). To wash cells, DPBS (pH 7.4) was used. At a density of about 2.5 × 10⁵ per well, cells were seeded in 2 mL of an appropriate medium in six-well plates. Confluent cells were detached with the use of 0.05% trypsin in 0.02% EDTA and counted in a Scepter Cell Counter (Millipore, MA,USA). The appropriate number of cells were seeded onto culture plates. After 24 h, culture media were replaced with fresh media containing ixazomib at IC₅₀ for A172 = 24.28 nM, IC₅₀ for LN-229 = 20.44 nM, IC₅₀ for T98G = 32.87 nM and IC₅₀ for U118-MG = 30.21 nM concentrations. Cells were incubated for 48 h at 37 oC in an atmosphere enriched with 5% CO2 and retained for further analyses. The number of passages performed did not exceeded 10.
2.3. Cell Viability
In order to analyze the effect that ixazomib has on cell viability, 3-(4,5-dimethylthiazol-2-yl)-2,5-diphenyltetrazolium bromide (MTT) was used according to the method of Carmichael [17]. The GBM cell lines: A172, LN229, T98G, and U118-MG were seeded in 24-well plates (0.5 × 10⁵ cells per well). Subsequently, confluent cells were cultured with wide range of ixazomib concentrations (6 to 600 nM) for 24 and 48 h. Afterwards, the cells were washed with PBS (three times) and incubated with 1 mL of the MTT solution (0.25mg/mL in PBS) for 1 h (37 oC, 5% CO2). The medium was removed, and 0.5 mL of 0.1 mol/L HCl in absolute isopropanol was added. The absorbance was measured on a microplate reader (Tecan, Mannedorf, Switzerland) at a wavelength of 570 nm. The viability of treated cells was calculated as a percentage of control, untreated cells. All the experiments were performed in triplicates in three different cultures.
2.4. Detection of Apoptosis and Necrosis
In order to evaluate the level of apoptosis and necrosis in A172, LN229, T98G, and U118-MG cells treated with ixazomib, the flow cytometry assay on an FACSCanto II cytometer (BD, San Diego, CA, USA) was used. The cells (2.0 × 10⁵) were seeded in six-well plates in 2 mL of culture media. After 48 h, the media were replaced with ixazomib at IC₅₀ for A172 = 24.28 nM, IC₅₀ for LN-229 = 20.44 nM, IC₅₀ for T98G = 32.87 nM and IC₅₀ for U118-MG = 30.21 nM concentrations, and incubated for 48 h (37 oC, 5% CO2). Subsequently, cells were detached and centrifuged (1000 rpm for 5 min at room temperature) in order to remove the culture media. Samples were then washed with DPBS (pH 7.4) and resuspended in a binding buffer. The cells were then stained with FITC Annexin V and PI (FITC Annexin V apoptosis detection Kit I, BD PharmingenTM, San Diego, CA, USA) in the dark for 15 min at room temperature. Data were analyzed using FACSDiva software (BD PharmingenTM, San Diego, CA, USA). Results were gathered from three different experiments.
2.5. Measurement of Caspase 8 and 9 Activity
Caspase-8 and caspase-9 activity was measured using the FAM-LETD-FMK Caspase-8 Assay and the FAM-LEHD-FMK Caspase-9 Assay (ImmunoChemistry Technologies). The A172, LN229, T98G, and U118-MG cells were cultured with ixazomib for 48 h. Measurement of caspase 8 and 9 activity was marked according to the method published earlier [18,19].
2.6. Cell Cycle Analysis
The distribution of the cell-cycle phases, DNA staining via PI, was analyzed by flow cytometry. The A172, LN229, T98G, and U118-MG cells were seeded onto 6-well plates (2.5×10⁵ cells per well) and treated with ixazomib for 48 h. After that, the cells were collected using trypsin, washed in DPBS and centrifuged at 400 x g for 5 min at 4◦C. Then, 70% ice-cold ethanol was used to fix the cells and storage at −20°C for at least 24h. Next, cancer cells were centrifuged at 400 x g at 4◦C for 5 min. The pellet cells were resuspended in DPBS, treated with 50 μg/mL of DNase-free RNase A (AppliChem, Darmstadt, Germany), and stained with 50 μg/mL of propidium iodide to be incubated in the dark at 37◦C for 30 min. The FACSCanto II flow cytometer was used to read the fluorescence, and the percentage of cells in each phase (subG1, G1, S and G2) was calculated using the FACSDiva software (ver. 6.1.3, BD Biosciences Systems, San Diego, CA, USA).
2.7. Statistical Analysis
Data were presented as means ± SD from three independent measurements. A statistical analysis was performed with the use of GraphPad Prism software version 9 (GraphPad Software, San Diego, CA, USA). Data were statistically analyzed depending on the data distribution assumptions, differences between groups were analyzed using one-way analysis of variance Anova with Tukey's post hoc test or Kruskal-Wallis test with Dunn's post hoc test or Student’s t-test with Welch’s correction or Sidak’s test.
3. Results
3.1. Effect of Ixazomib on Viability of Glioblastoma Cell Lines
To evaluate the antiproliferative effect of ixazomib, cell viability was assessed in four glioblastoma cell lines (A172, LN229, T98G, and U118-MG) following exposure to increasing concentrations of ixazomib (6–600 nM) for 24 and 48 h. Overall, ixazomib reduced cell viability in a concentration- and time-dependent manner, with the most pronounced effects observed after 48 h of treatment (Figure 1).
Ixazomib reduced cell viability in a concentration-dependent manner in all cell lines, with substantially stronger effects observed following 48 h of treatment (Figure 1). In A172 cells, viability remained relatively high after 24 h of exposure, whereas 48 h treatment resulted in a pronounced reduction, with viability decreasing to approximately 15–25% at concentrations of 50–600 nM. The calculated IC₅₀ after 48 h was 24.28 nM. LN229 cells showed a comparable time-dependent response, with viability decreasing to approximately 25–35% at 50–600 nM after 48 h and an IC₅₀ of 20.44 nM. T98G cells displayed a progressive decrease in viability upon increasing ixazomib concentrations, which was markedly enhanced after 48 h; viability was reduced to approximately 13–16% at 100–600 nM, corresponding to an IC₅₀ of 32.87 nM. U118-MG cells also exhibited a pronounced response after prolonged exposure, with viability decreasing to approximately 15–20% at 200–600 nM and an IC₅₀ of 30.21 nM. Statistical analysis further confirmed significant differences between selected treatment conditions, particularly following 48 h of exposure.
Taken together, these results demonstrate that ixazomib significantly decreases the viability of all four glioblastoma cell lines, with the inhibitory effect strongly enhanced by prolonged exposure to 48 h. The 48-h IC₅₀ values ranged from 20.44 to 32.87 nM, indicating a measurable but cell-line-dependent sensitivity to ixazomib. Among the tested models, the lowest IC₅₀ values were observed for LN229 and A172 cells, whereas higher concentrations were required to achieve a comparable inhibitory effect in T98G and U118-MG cells.
3.2. IXA Induces Apoptosis in Glioma Cell Lines
To investigate the mode of cell death induced by IXA, apoptosis and necrosis were assessed by flow cytometry using Annexin V-FITC/propidium iodide (PI) staining. The four glioblastoma cell lines: A172, LN229, T98G, and U118-MG were treated with IXA at concentrations of 24.25, 20.44, 30.21, and 32.87 nM, respectively, and compared with untreated controls. Representative flow-cytometric histograms and quantitative analyses are presented in Figure 2 A-L.
Treatment with IXA resulted in a significant increase in the proportion of apoptotic cells in all four glioma cell lines analyzed, although the magnitude of the response varied between cell lines. In A172 cells, the percentage of apoptotic cells increased from approximately 5.5% in control cultures to approximately 27.5% following IXA treatment (Figure 2 A,B). A significant, although less pronounced, increase in apoptosis was also observed in LN229 cells, from approximately 5.0% in untreated cells to approximately 10.0% following IXA exposure (Figure 2 D,E). In U118-MG cells, IXA markedly increased the apoptotic cell population from approximately 4.5% to 24.5% (Figure 2 G,H). Similarly, in T98G cells, the proportion of apoptotic cells increased from approximately 7.5% in the control group to approximately 26.5% following IXA treatment (Figure 2 J,K).
The effect of IXA on the necrotic cell population was less pronounced and differed among the cell lines. No statistically significant changes in the percentage of necrotic cells were observed in A172, LN229 and T98G cells following IXA treatment (Figure 2 C,F,L). In contrast, U118-MG cells exhibited a significant increase in the proportion of necrotic cells, from approximately 0.5% in the control group to approximately 2.9% following IXA exposure (Figure 2 I).
Overall, these findings demonstrate that IXA predominantly induced apoptosis rather than necrosis in the glioma cell lines investigated. The strongest apoptotic response was observed in A172, U118-MG, and T98G cells, whereas LN229 cells exhibited a comparatively weaker response. The limited increase in necrotic cells, detected only in U118-MG cells, further suggests that apoptosis represents the predominant mode of cell death induced by IXA under the experimental conditions used.
3.3. Activation of Caspase-8 Following IXA Treatment
To determine whether IXA induces activation of the extrinsic apoptotic pathway, the activity of caspase-8 was assessed by flow cytometry in four glioma cell lines: A172, LN229, U118-MG, and T98G. Cells were treated with IXA at concentrations of 24.25, 20.44, 30.21, and 32.87 nM, respectively, and compared with untreated controls. Representative flow-cytometric histograms and quantitative analyses are presented in Figure 3.
Treatment with IXA resulted in a marked increase in the proportion of cells positive for active caspase-8 in three of the four cell lines tested. In A172 cells, IXA significantly increased the percentage of cells with active caspase-8 compared with the control, reaching approximately 55–60% of the analyzed population (Figure 3 A,B). A significant increase was also observed in U118-MG cells, where IXA treatment increased the fraction of caspase-8-positive cells to approximately 8% compared with approximately 1–2% in untreated cells (Figure 3E,F). The most pronounced response among the cell lines, after A172, was observed in T98G cells. IXA increased the proportion of cells with active caspase-8 from approximately 1% in controls to approximately 25–30%, corresponding to a highly significant difference (Figure 3 G,H). In contrast, LN229 cells showed no statistically significant change in caspase-8 activation following IXA exposure (Figure 3 C,D).
Overall, these findings indicate that IXA induces activation of caspase-8 in a cell-line-dependent manner, with particularly pronounced effects observed in A172 and T98G cells. The lack of a significant response in LN229 cells suggests that activation of the caspase-8-dependent apoptotic pathway is not uniform across the investigated glioma models.
3.4. IXA Induces Activation of Caspase-9 in Selected Glioblastoma Cell Lines
To investigate whether IXA-induced cytotoxicity is associated with activation of the intrinsic apoptotic pathway, the level of active caspase-9 was assessed by flow cytometry in A172, LN229, U118-MG, and T98G glioblastoma cell lines. Cells were treated with IXA at concentrations corresponding to their respective IC₅₀ values (24.25 nM for A172, 20.44 nM for LN229, 30.21 nM for U118-MG, and 32.87 nM for T98G), and the percentage of cells positive for active caspase-9 was compared with untreated controls (Figure 4 A-H).
Treatment with IXA markedly increased the proportion of active caspase-9-positive cells in A172 cells. The percentage of cells exhibiting active caspase-9 increased from approximately 0.4% in the control group to 18.8% following IXA treatment, representing a statistically significant increase (Figure 4 A,B). In contrast, IXA did not significantly alter caspase-9 activation in LN229 cells. The proportion of active caspase-9-positive cells was approximately 1.1% in untreated cells and 1.0% following treatment with IXA, with no statistically significant difference between the groups (Figure 4 C,D). A pronounced increase in caspase-9 activation was also observed in U118-MG cells following IXA exposure. The proportion of active caspase-9-positive cells increased from approximately 1.8% in the control condition to 24.0% after treatment with IXA, corresponding to a statistically significant increase (Figure 4 E,F). The strongest response was observed in T98G cells. IXA treatment increased the proportion of cells positive for active caspase-9 from approximately 2.3% in the control group to 35.6%, representing a highly significant increase (Figure 4 G,H).
Overall, these data demonstrate that IXA induces caspase-9 activation in A172, U118-MG, and T98G glioblastoma cells, whereas this effect was not observed in LN229 cells. The differential response among the tested cell lines suggests that activation of the intrinsic apoptotic pathway may contribute to the cellular response to IXA in a cell-line-dependent manner.
3.5. IXA Alters Cell Cycle Distribution in Glioma Cell Lines
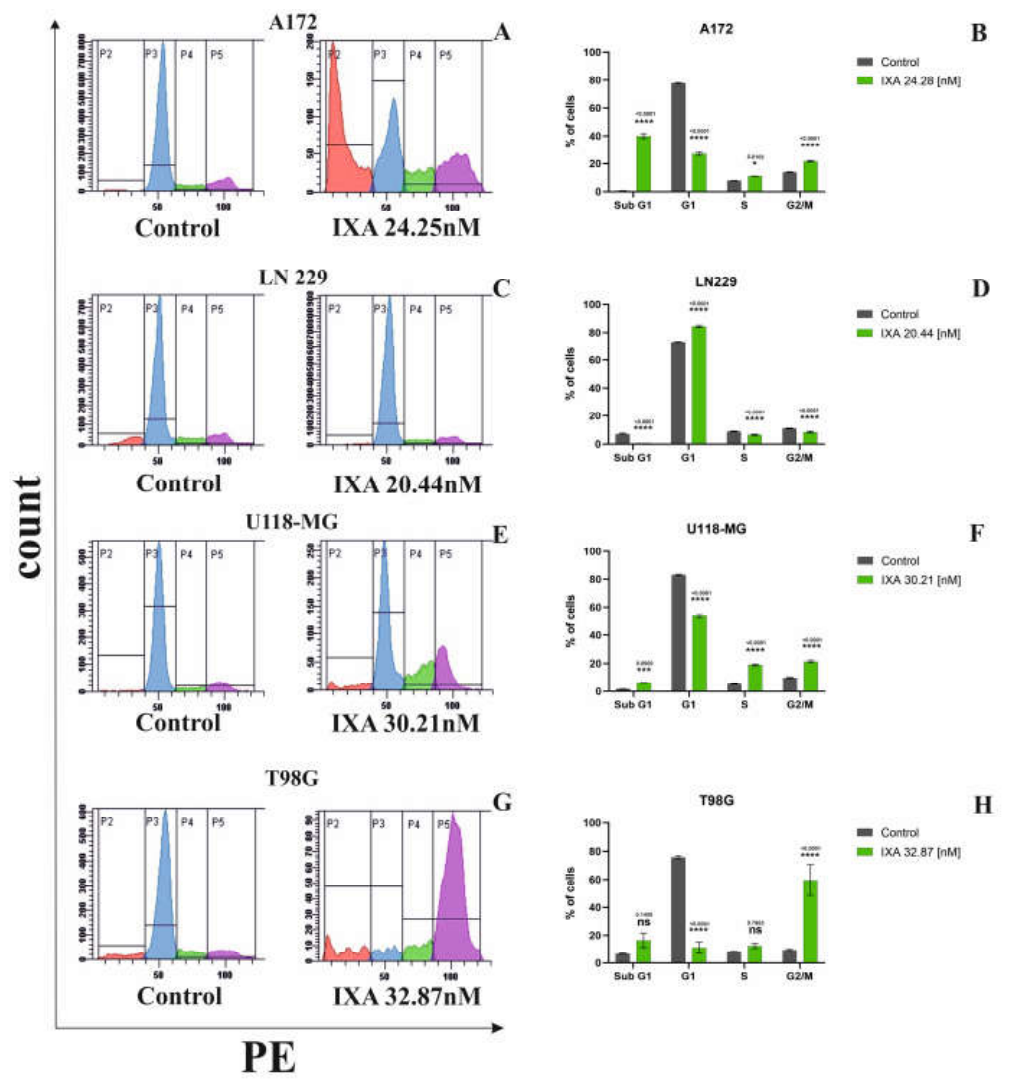
To determine whether IXA affects cell cycle progression, the distribution of glioma cells across the sub-G1, G1, S, and G2/M phases was analyzed in A172, T98G, LN229, and U118-MG cells. The response to IXA was cell-line dependent, with distinct changes in cell cycle distribution observed following treatment (Figure 5 A-H).
In A172 cells, the G1 population decreased from approximately 78% in control cells to 27% following IXA treatment, accompanied by an increase in the sub-G1 fraction from approximately 1% to 40%. The S-phase population increased modestly from approximately 8% to 11%, whereas the G2/M fraction increased from approximately 14% to 21% (Figure 5 A,B). In T98G cells, IXA treatment resulted in a marked reduction in the G1 population, from approximately 76% to 11%, with a concomitant increase in the G2/M fraction from approximately 9% to 60%. The sub-G1 population increased from approximately 7% to 16%, while the S-phase fraction increased modestly from approximately 8% to 12% (Figure 5 G,H). In LN229 cells, IXA treatment increased the proportion of cells in G1 from approximately 73% to 84%. This was accompanied by decreases in the sub-G1 fraction, from approximately 7% to 1%, the S-phase population, from approximately 9% to 6%, and the G2/M population, from approximately 11% to 8% (Figure 5 C,D). In U118-MG cells, IXA treatment decreased the G1 population from approximately 83% to 53%, with concomitant increases in the S-phase and G2/M fractions from approximately 5% to 19% and from approximately 10% to 21%, respectively. The sub-G1 population increased from approximately 2% to 6% (Figure 5 E,F).
Overall, the data demonstrate that IXA induced cell-line-specific changes in cell cycle distribution. A marked increase in the sub-G1 population was observed in A172 cells, whereas T98G cells showed a prominent accumulation in G2/M. U118-MG cells exhibited a reduction in G1 accompanied by increased S- and G2/M-phase populations. In contrast, LN229 cells showed an increase in the G1 population and a concomitant reduction in the other analyzed fractions. These findings suggest that the cellular response to IXA is heterogeneous among glioma cell lines and may involve distinct alterations in cell cycle progression.
4. Discussion
The present study demonstrates that ixazomib (IXA), a clinically approved proteasome inhibitor, exerts a pronounced cytotoxic effect against four glioblastoma cell lines, namely A172, LN229, T98G, and U118-MG. IXA reduced cell viability in a concentration- and time-dependent manner, with substantially greater effects after 48 h of exposure. The calculated 48-h IC50 values ranged from 20.44 to 32.87 nM, indicating that all four glioblastoma models were sensitive to proteasome inhibition, although the magnitude of the response differed between cell lines. Importantly, the observed reduction in viability was accompanied by an increase in apoptotic cells and activation of apoptotic caspases, together with marked and cell-line-specific changes in cell cycle distribution. Collectively, these findings support the concept that proteasome inhibition can interfere with several interconnected processes required for glioblastoma cell survival.
The concentration- and time-dependent reduction in viability observed in the present study is consistent with the biological consequences expected from proteasome inhibition. The ubiquitin–proteasome system is essential for maintaining protein homeostasis and regulating the abundance of proteins involved in proliferation, stress responses, apoptosis, and cell cycle progression. Consequently, pharmacological inhibition of the proteasome can produce proteotoxic stress and impair the ability of tumor cells to adapt to increased protein-folding and degradation demands [20,21]. Previous studies have demonstrated that glioblastoma cells can be particularly vulnerable to proteasome inhibition, and that this vulnerability may depend on the molecular background of individual tumors. In particular, PTEN deficiency and activation of PI3K/mTOR signaling have been associated with increased sensitivity to proteasome inhibitors, suggesting that the genetic context of GBM may influence the response to this class of compounds [22]. Thus, the differences in IC50 values observed among A172, LN229, T98G, and U118-MG may reflect, at least in part, intrinsic molecular heterogeneity between these models rather than differences in the general ability of IXA to inhibit glioblastoma cell growth.
The present findings are also relevant in the context of increasing evidence supporting proteasome inhibition as a therapeutic strategy for glioblastoma. A recent review emphasized that proteasome inhibitors can interfere with cell cycle progression and promote apoptosis through accumulation of proteasome-regulated proteins, including cell-cycle inhibitors, while simultaneously suppressing pro-survival signaling [21]. More recent experimental evidence further strengthens the rationale for targeting the proteasome in GBM. Degorre and Tofilon demonstrated that recurrent glioblastoma xenografts displayed increased proteasome activity and upregulation of multiple proteasome-related genes compared with untreated tumors; importantly, ixazomib administered after irradiation prolonged survival in two glioma stem-cell-derived xenograft models [13]. These findings suggest that proteasome dependence may become particularly relevant following therapeutic stress and recurrence. The present in vitro results extend this concept by showing that IXA can directly suppress the viability of established glioblastoma cell lines in the absence of prior irradiation, although the magnitude of this effect remains cell-line dependent.
An important finding of the present study is that IXA-induced loss of viability was associated predominantly with apoptosis rather than necrosis. Annexin V/PI analysis revealed a significant increase in apoptotic cells in all four models, whereas statistically significant increases in necrosis were detected only in U118-MG cells and remained relatively small. The strongest apoptotic responses were observed in A172, T98G, and U118-MG cells, whereas LN229 cells displayed a comparatively modest increase. This observation is consistent with the established relationship between proteasome inhibition and activation of regulated cell-death pathways. Proteasome inhibition can increase the accumulation of misfolded and damaged proteins, induce cellular stress, and alter the balance between pro-survival and pro-apoptotic signaling, ultimately favoring programmed cell death [21,23]. In glioblastoma, these mechanisms may be particularly relevant because malignant cells operate under substantial proteotoxic and metabolic stress and therefore may have a relatively limited capacity to tolerate additional perturbations of proteostasis.
The activation of caspase-8 observed following IXA treatment provides evidence that the extrinsic apoptotic machinery may contribute to the response to proteasome inhibition. IXA significantly increased the population of active caspase-8-positive cells in A172, U118-MG, and T98G cells, with the strongest response detected in A172 cells. In contrast, LN229 cells did not show a statistically significant increase in caspase-8 activation. This heterogeneity is notable because it indicates that the apoptotic response to IXA cannot be attributed to a single uniform mechanism across glioblastoma models. Although caspase-8 is classically associated with death-receptor-mediated apoptosis, proteasome inhibition can affect multiple signaling pathways capable of converging on caspase activation. Previous studies of ixazomib in other malignant models have reported activation of both extrinsic and intrinsic apoptotic pathways, including caspases-8 and -9 [24]. Therefore, the present data are compatible with a model in which IXA induces apoptosis through partially overlapping pathways whose relative contribution depends on the molecular characteristics of individual glioblastoma cells.
The activation of caspase-9 in A172, U118-MG, and T98G cells provides additional evidence for involvement of the intrinsic mitochondrial apoptotic pathway. The increase in active caspase-9 was particularly pronounced in T98G cells, followed by U118-MG and A172 cells, whereas LN229 cells showed no measurable increase. The simultaneous activation of caspase-8 and caspase-9 in several models suggests that IXA-induced apoptosis may involve crosstalk between extrinsic and intrinsic pathways rather than activation of a single linear cascade. Such crosstalk is biologically plausible because activation of caspase-8 can promote mitochondrial amplification of apoptotic signaling, while proteotoxic and endoplasmic-reticulum stress can independently contribute to mitochondrial dysfunction and intrinsic apoptosis [23,24]. Nevertheless, the current experiments demonstrate association rather than causality; therefore, inhibition or genetic depletion of caspase-8, caspase-9, or downstream executioner caspases would be required to establish the functional contribution of each pathway.
The observed effects on cell cycle progression provide a complementary explanation for the antiproliferative activity of IXA. The response was highly heterogeneous: A172 cells exhibited a substantial increase in the sub-G1 fraction, T98G cells showed pronounced accumulation in G2/M, U118-MG cells demonstrated redistribution from G1 toward S and G2/M phases, whereas LN229 cells accumulated predominantly in G1. The marked increase in the sub-G1 population in A172 is consistent with extensive DNA fragmentation associated with apoptosis, whereas the pronounced G2/M accumulation in T98G suggests that disruption of proteostasis may interfere with mechanisms controlling progression through mitosis. Proteasome inhibition has previously been associated with cell cycle arrest through altered stability of regulatory proteins such as p21 and p27 [21]. Experimental work with another proteasome inhibitor, MG132, similarly demonstrated G2/M arrest followed by apoptosis in glioblastoma cells [25]. The distinct cell-cycle phenotypes observed here therefore support the concept that proteasome inhibition interferes with cell cycle control, while also demonstrating that the precise response depends strongly on cellular context.
The relatively weak apoptotic and caspase responses observed in LN229 cells despite a low IC50 value are particularly interesting. This apparent discrepancy indicates that reduced metabolic viability does not necessarily correspond quantitatively to activation of the same apoptotic pathway. IXA may affect LN229 cells through alternative mechanisms, including cell cycle inhibition, proteotoxic stress, autophagy, senescence-like responses, or other forms of regulated cell death that were not directly assessed in the present study. This possibility is consistent with current evidence that glioblastoma cells can dynamically switch between apoptosis, autophagy, and other regulated cell-death programs in response to therapeutic stress [26]. Consequently, the lack of substantial caspase-8 or caspase-9 activation in LN229 cells should not be interpreted as resistance to IXA; rather, it suggests that the biological consequences of proteasome inhibition may be mechanistically distinct across GBM subtypes.
The translational relevance of these findings is supported by evidence that ixazomib can reach human glioblastoma tissue. In a phase 0 study of patients with recurrent GBM, measurable concentrations of the biologically active form of ixazomib were detected in tumor tissue following oral administration, demonstrating that the compound can reach intracranial tumor tissue [12]. However, delivery to the brain remains an important consideration for proteasome inhibitors, because the blood–brain barrier and intratumoral pharmacokinetics can limit effective drug exposure. Recent work has emphasized that inadequate brain delivery and therapeutic resistance remain major barriers to the clinical development of proteasome inhibitors for GBM, while nanoparticle-based delivery approaches are being investigated to improve tumor exposure [27]. Thus, the present in vitro activity should be considered encouraging mechanistic evidence but cannot by itself establish that the concentrations producing cytotoxicity in cultured cells can be safely and sustainably achieved throughout human glioblastoma tissue.
Recent patient-derived models provide further support for investigating proteasome inhibition beyond conventional two-dimensional cell lines. A 2026 study using patient-derived glioblastoma tumor organoids identified ixazomib, together with other proteasome inhibitors, among compounds producing strong anti-glioma effects in a personalized screening platform [14]. This observation is important because organoids preserve substantially more of the cellular and architectural heterogeneity characteristic of patient tumors than conventional monolayer cultures. In parallel, recent work in recurrent GBM xenografts suggests that proteasome activity may increase following radiation and that this state can create a therapeutically exploitable vulnerability to ixazomib [13]. Together, these studies suggest that the efficacy of proteasome inhibition may depend not only on intrinsic tumor genotype but also on treatment history, tumor state, and microenvironmental context.
Several limitations of the present study should be acknowledged. First, the experiments were performed exclusively in established glioblastoma cell lines, which do not fully reproduce the molecular heterogeneity, three-dimensional architecture, tumor microenvironment, or glioma stem-cell compartment of patient tumors. Second, although apoptosis was demonstrated using Annexin V/PI staining and associated with caspase-8 and caspase-9 activation, the experiments do not establish whether these caspases are necessary for IXA-induced cell death. Third, the study did not directly measure proteasome activity, accumulation of ubiquitinated proteins, endoplasmic-reticulum stress, mitochondrial membrane potential, or downstream executioner caspase activation. Consequently, the molecular sequence connecting proteasome inhibition with the observed apoptotic and cell-cycle phenotypes remains to be defined. Finally, the use of single IC50-based concentrations for the mechanistic experiments provides a useful comparative framework but does not capture the complete concentration-dependent biology of IXA.
Future studies should therefore investigate the molecular determinants underlying the differential sensitivity of A172, LN229, T98G, and U118-MG cells. Particular attention should be given to PTEN/PI3K/AKT/mTOR signaling, proteasome activity, ubiquitinated-protein accumulation, endoplasmic-reticulum stress, mitochondrial dysfunction, and the expression of BCL-2 family proteins. The contribution of autophagy should also be examined because proteasome inhibition and autophagy are closely interconnected components of the cellular proteostasis network, and compensatory autophagy may determine whether proteasome stress culminates in survival or cell death [26]. Combination studies with radiotherapy or temozolomide may be especially relevant, given evidence that proteasome dependence can increase after irradiation and that proteasome inhibition may represent a strategy for overcoming treatment resistance [13,27]. Validation in patient-derived glioblastoma stem-cell cultures, organoids, and orthotopic models will be necessary to determine whether the in vitro sensitivity observed here translates into therapeutic efficacy in clinically relevant systems.
5. Conclusions
Overall, the present findings indicate that IXA exerts substantial anti-glioblastoma activity through mechanisms involving apoptosis and cell cycle perturbation, but that the relative contribution of individual pathways is strongly cell-line dependent. The concurrent activation of caspase-8 and caspase-9 in several models suggests involvement of both extrinsic and intrinsic apoptotic signaling, whereas the divergent cell-cycle responses highlight the molecular heterogeneity of GBM. In the context of recent evidence supporting proteasome dependence in recurrent GBM and the activity of IXA in patient-derived organoid and xenograft models [13,14], these findings provide a rationale for further mechanistic and translational investigation of ixazomib as a potential component of combination-based therapeutic strategies for glioblastoma.
Author Contributions
Conceptualization, M.C.P. and R.K.; methodology, R.K. and M.C.P.; software, R.K. and N.T.; validation, A.J.T.; formal analysis, M.C.P.; investigation, R.K. and N.T.; resources, M.C.P.; data curation, M.C.P.; writing—original draft preparation, M.C.P.; writing—review and editing, M.C.P.; visualization, R.K. and N.T.; supervision, M.C.P.; project administration, M.C.P.; funding acquisition, M.C.P. All authors have read and agreed to the published version of the manuscript.
Funding
This research was supported by Medical University of Bialystok, project number: B.SUB.26.316.
Institutional Review Board Statement
Not applicable.
Informed Consent Statement
Not applicable.
Data Availability Statement
The data presented in this study are available on request from the corresponding author.
Conflicts of Interest
The authors declare no conflicts of interest.
References
- Stupp, R.; Mason, W.P.; van den Bent, M.J.; et al. Radiotherapy plus Concomitant and Adjuvant Temozolomide for Glioblastoma. N. Engl. J. Med. 2005, 352, 987–996. [Google Scholar] [CrossRef] [PubMed]
- Neftel, C.; Laffy, J.; Filbin, M.G.; et al. An Integrative Model of Cellular States, Plasticity, and Genetics for Glioblastoma. Cell 2019, 178, 835–849.e21. [Google Scholar] [CrossRef] [PubMed]
- Patel, A.P.; Tirosh, I.; Trombetta, J.J.; et al. Single-cell RNA-seq highlights intratumoral heterogeneity in primary glioblastoma. Science 2014, 344, 1396–1401. [Google Scholar] [CrossRef] [PubMed]
- Yabo, Y.A.; Heiland, D.H. Understanding Glioblastoma at the Single-Cell Level: Recent Advances and Future Challenges. PLoS Biol. 2024, 22, e3002640. [Google Scholar] [CrossRef] [PubMed]
- Kim, Y.J.; Lee, Y.; Shin, H.; et al. Ubiquitin-proteasome system as a target for anticancer treatment—an update. Arch. Pharm. Res. 2023, 46, 573–597. [Google Scholar] [CrossRef] [PubMed]
- Richardson, P.G.; Mitsiades, C.; Hideshima, T.; Anderson, K.C. Proteasome inhibition in the treatment of cancer. Cell Cycle 2005, 4, 290–296. [Google Scholar] [CrossRef] [PubMed]
- Manasanch, E.E.; Orlowski, R.Z. Proteasome inhibitors in cancer therapy. Nat. Rev. Clin. Oncol. 2017, 14, 417–433. [Google Scholar] [CrossRef] [PubMed]
- Yin, D.; Zhou, H.; Kumagai, T.; et al. Proteasome inhibitor PS-341 causes cell growth arrest and apoptosis in human glioblastoma multiforme (GBM). Oncogene 2005, 24, 344–354. [Google Scholar] [CrossRef] [PubMed]
- Foti, C.; Florean, C.; Pezzutto, A.; et al. Characterization of caspase-dependent and caspase-independent deaths in glioblastoma cells treated with inhibitors of the ubiquitin-proteasome system. Mol. Cancer Ther. 2009, 8, 3140–3150. [Google Scholar] [CrossRef] [PubMed]
- Richardson, P.G.; Moreau, P.; Laubach, J.P.; et al. The investigational proteasome inhibitor ixazomib for the treatment of multiple myeloma. Future Oncol. 2015, 11, 1153–1168. [Google Scholar] [CrossRef] [PubMed]
- Chauhan, D.; Tian, Z.; Zhou, B.; et al. In vitro and in vivo selective antitumor activity of a novel orally bioavailable proteasome inhibitor MLN9708 against multiple myeloma cells. Clin. Cancer Res. 2011, 17, 5311–5321. [Google Scholar] [CrossRef] [PubMed]
- Quillin, J.; Patel, R.; Herzberg, E.; et al. A phase 0 analysis of ixazomib in patients with glioblastoma. Mol. Clin. Oncol. 2020, 13, 43. [Google Scholar] [CrossRef] [PubMed]
- Degorre, C.; Tofilon, P.J. The Proteasome Is Revealed as a Therapeutic Target in Recurrent Glioblastoma Xenografts. Mol. Cancer Ther. 2026, 25, 967–975. [Google Scholar] [CrossRef] [PubMed]
- Jungwirth, G.; Paul, A.; Wöllner, A.; et al. Automated and personalized glioblastoma tumor organoid drug screening platform exposes sensitivity to proteasome and HDAC inhibitors. npj Precis. Oncol. 2026, 10, 228. [Google Scholar] [CrossRef] [PubMed]
- Taylor, R.C.; Cullen, S.P.; Martin, S.J. Apoptosis: controlled demolition at the cellular level. Nat. Rev. Mol. Cell Biol. 2008, 9, 231–241. [Google Scholar] [CrossRef] [PubMed]
- Elmore, S. Apoptosis: A Review of Programmed Cell Death. Toxicol. Pathol. 2007, 35, 495–516. [Google Scholar] [CrossRef] [PubMed]
- Carmichael, J.; DeGraff, W.G.; Gazdar, A.F.; Minna, J.D.; Mitchell, J.B. Evaluation of a tetrazolium-based semiautomated colorimetric assay: Assessment of chemosensitivity testing. Cancer Res. 1987, 47, 936–942. [Google Scholar]
- Krętowski, R.; Cechowska-Pasko, M. The reduced graphene oxide induces apoptosis, autophagy and cell cycle arrest in breast cancer cells. Int. J. Mol. Sci. 2022, 23, 9285. [Google Scholar] [CrossRef] [PubMed]
- Kozak, Y.; Finiuk, N.; Czarnomysy, R.; Gornowicz, A.; Pinyazhko, R.; Lozynskyi, A.; Holota, S.; Klyuchivska, O.; Karkhut, A.; Polovkovych, S.; Klishch, M.; Stoika, R.; Lesyk, R.; Bielawski, K.; Bielawska, A. Juglone-bearing thiopyrano[2,3-d]thiazoles induce apoptosis in colorectal adenocarcinoma cells. Cells 2025, 14, 465. [Google Scholar] [CrossRef] [PubMed]
- Liu, S.J.; Raleigh, D.R.; de Groot, J.F. Proteasome inhibition for glioblastoma: Lessons learned and new opportunities. Neuro-Oncol. 2024, 26, 1683–1684. [Google Scholar] [CrossRef] [PubMed]
- Gozdz, A. Proteasome Inhibitors against Glioblastoma-Overview of Molecular Mechanisms of Cytotoxicity, Progress in Clinical Trials, and Perspective for Use in Personalized Medicine. Curr. Oncol. 2023, 30, 9676–9688. [Google Scholar] [CrossRef]
- Benitez, J. A.; Finlay, D.; Castanza, A.; Parisian, A. D.; Ma, J.; Longobardi, C.; Campos, A.; Vadla, R.; Izurieta, A.; Scerra, G.; Koga, T.; Long, T.; Chavez, L.; Mesirov, J. P.; Vuori, K.; Furnari, F. PTEN deficiency leads to proteasome addiction: a novel vulnerability in glioblastoma. Neuro-Oncol. 2021, 23, 1072–1086. [Google Scholar] [CrossRef] [PubMed]
- Kusaczuk, M.; Tyszka, N.; Krętowski, R.; Cechowska-Pasko, M. The Proteasome Inhibitor Marizomib Evokes Endoplasmic Reticulum Stress and Promotes Apoptosis in Human Glioblastoma Cells. Pharmaceuticals 2024, 17, 1089. [Google Scholar] [CrossRef] [PubMed]
- Muz, B.; Ghazarian, R. N.; Ou, M.; Luderer, M. J.; Kusdono, H. D.; Azab, A. K. Spotlight on ixazomib: potential in the treatment of multiple myeloma. Drug Des. Devel. Ther. 2016, 10, 217–226. [Google Scholar] [CrossRef] [PubMed]
- Zanotto-Filho, A.; Braganhol, E.; Battastini, A.M.; Moreira, J.C. Proteasome inhibitor MG132 induces selective apoptosis in glioblastoma cells through inhibition of PI3K/Akt and NFkappaB pathways, mitochondrial dysfunction, and activation of p38-JNK1/2 signaling. Invest New Drugs 2012, 30, 2252–62. [Google Scholar] [CrossRef] [PubMed]
- Mishchenko, T. A.; Olajide, O. J.; Gorshkova, E. N.; Vedunova, M. V.; Krysko, D. V. Regulated cell death modalities: breaking resistance of temozolomide glioblastoma therapy. Trends Cancer 2025, 11, 430–432. [Google Scholar] [CrossRef] [PubMed]
- Rahman, M. A.; Yadab, M. K.; Apu, E. H.; Ali, M. M. Nanoparticle-Based delivery of proteasome inhibitors for glioblastoma Therapy: Strategies to overcome Blood-Brain barrier and therapeutic resistance. Biochem. Pharmacol. 2026, 251, 118058. [Google Scholar] [CrossRef] [PubMed]
Figure 1.
Effect of ixazomib on glioblastoma cell viability. A172, LN229, T98G, and U118-MG cells were treated with increasing concentrations of ixazomib (6–600 nM) for 24 or 48 h. Cell viability was expressed as a percentage of the untreated control. Dose–response curves obtained after 48 h of treatment were used to calculate IC₅₀ values. Results are shown as the mean ± SD of three independent experiments, each performed in triplicate. Statistical analyses were selected according to the distribution of the data and included one-way ANOVA followed by Tukey's post hoc test or the Kruskal–Wallis test followed by Dunn's multiple comparisons post hoc test, as appropriate. *p < 0.05, **p < 0.01, ***p < 0.001, ****p < 0.0001; ns, not significant (p > 0.05).
Figure 1.
Effect of ixazomib on glioblastoma cell viability. A172, LN229, T98G, and U118-MG cells were treated with increasing concentrations of ixazomib (6–600 nM) for 24 or 48 h. Cell viability was expressed as a percentage of the untreated control. Dose–response curves obtained after 48 h of treatment were used to calculate IC₅₀ values. Results are shown as the mean ± SD of three independent experiments, each performed in triplicate. Statistical analyses were selected according to the distribution of the data and included one-way ANOVA followed by Tukey's post hoc test or the Kruskal–Wallis test followed by Dunn's multiple comparisons post hoc test, as appropriate. *p < 0.05, **p < 0.01, ***p < 0.001, ****p < 0.0001; ns, not significant (p > 0.05).
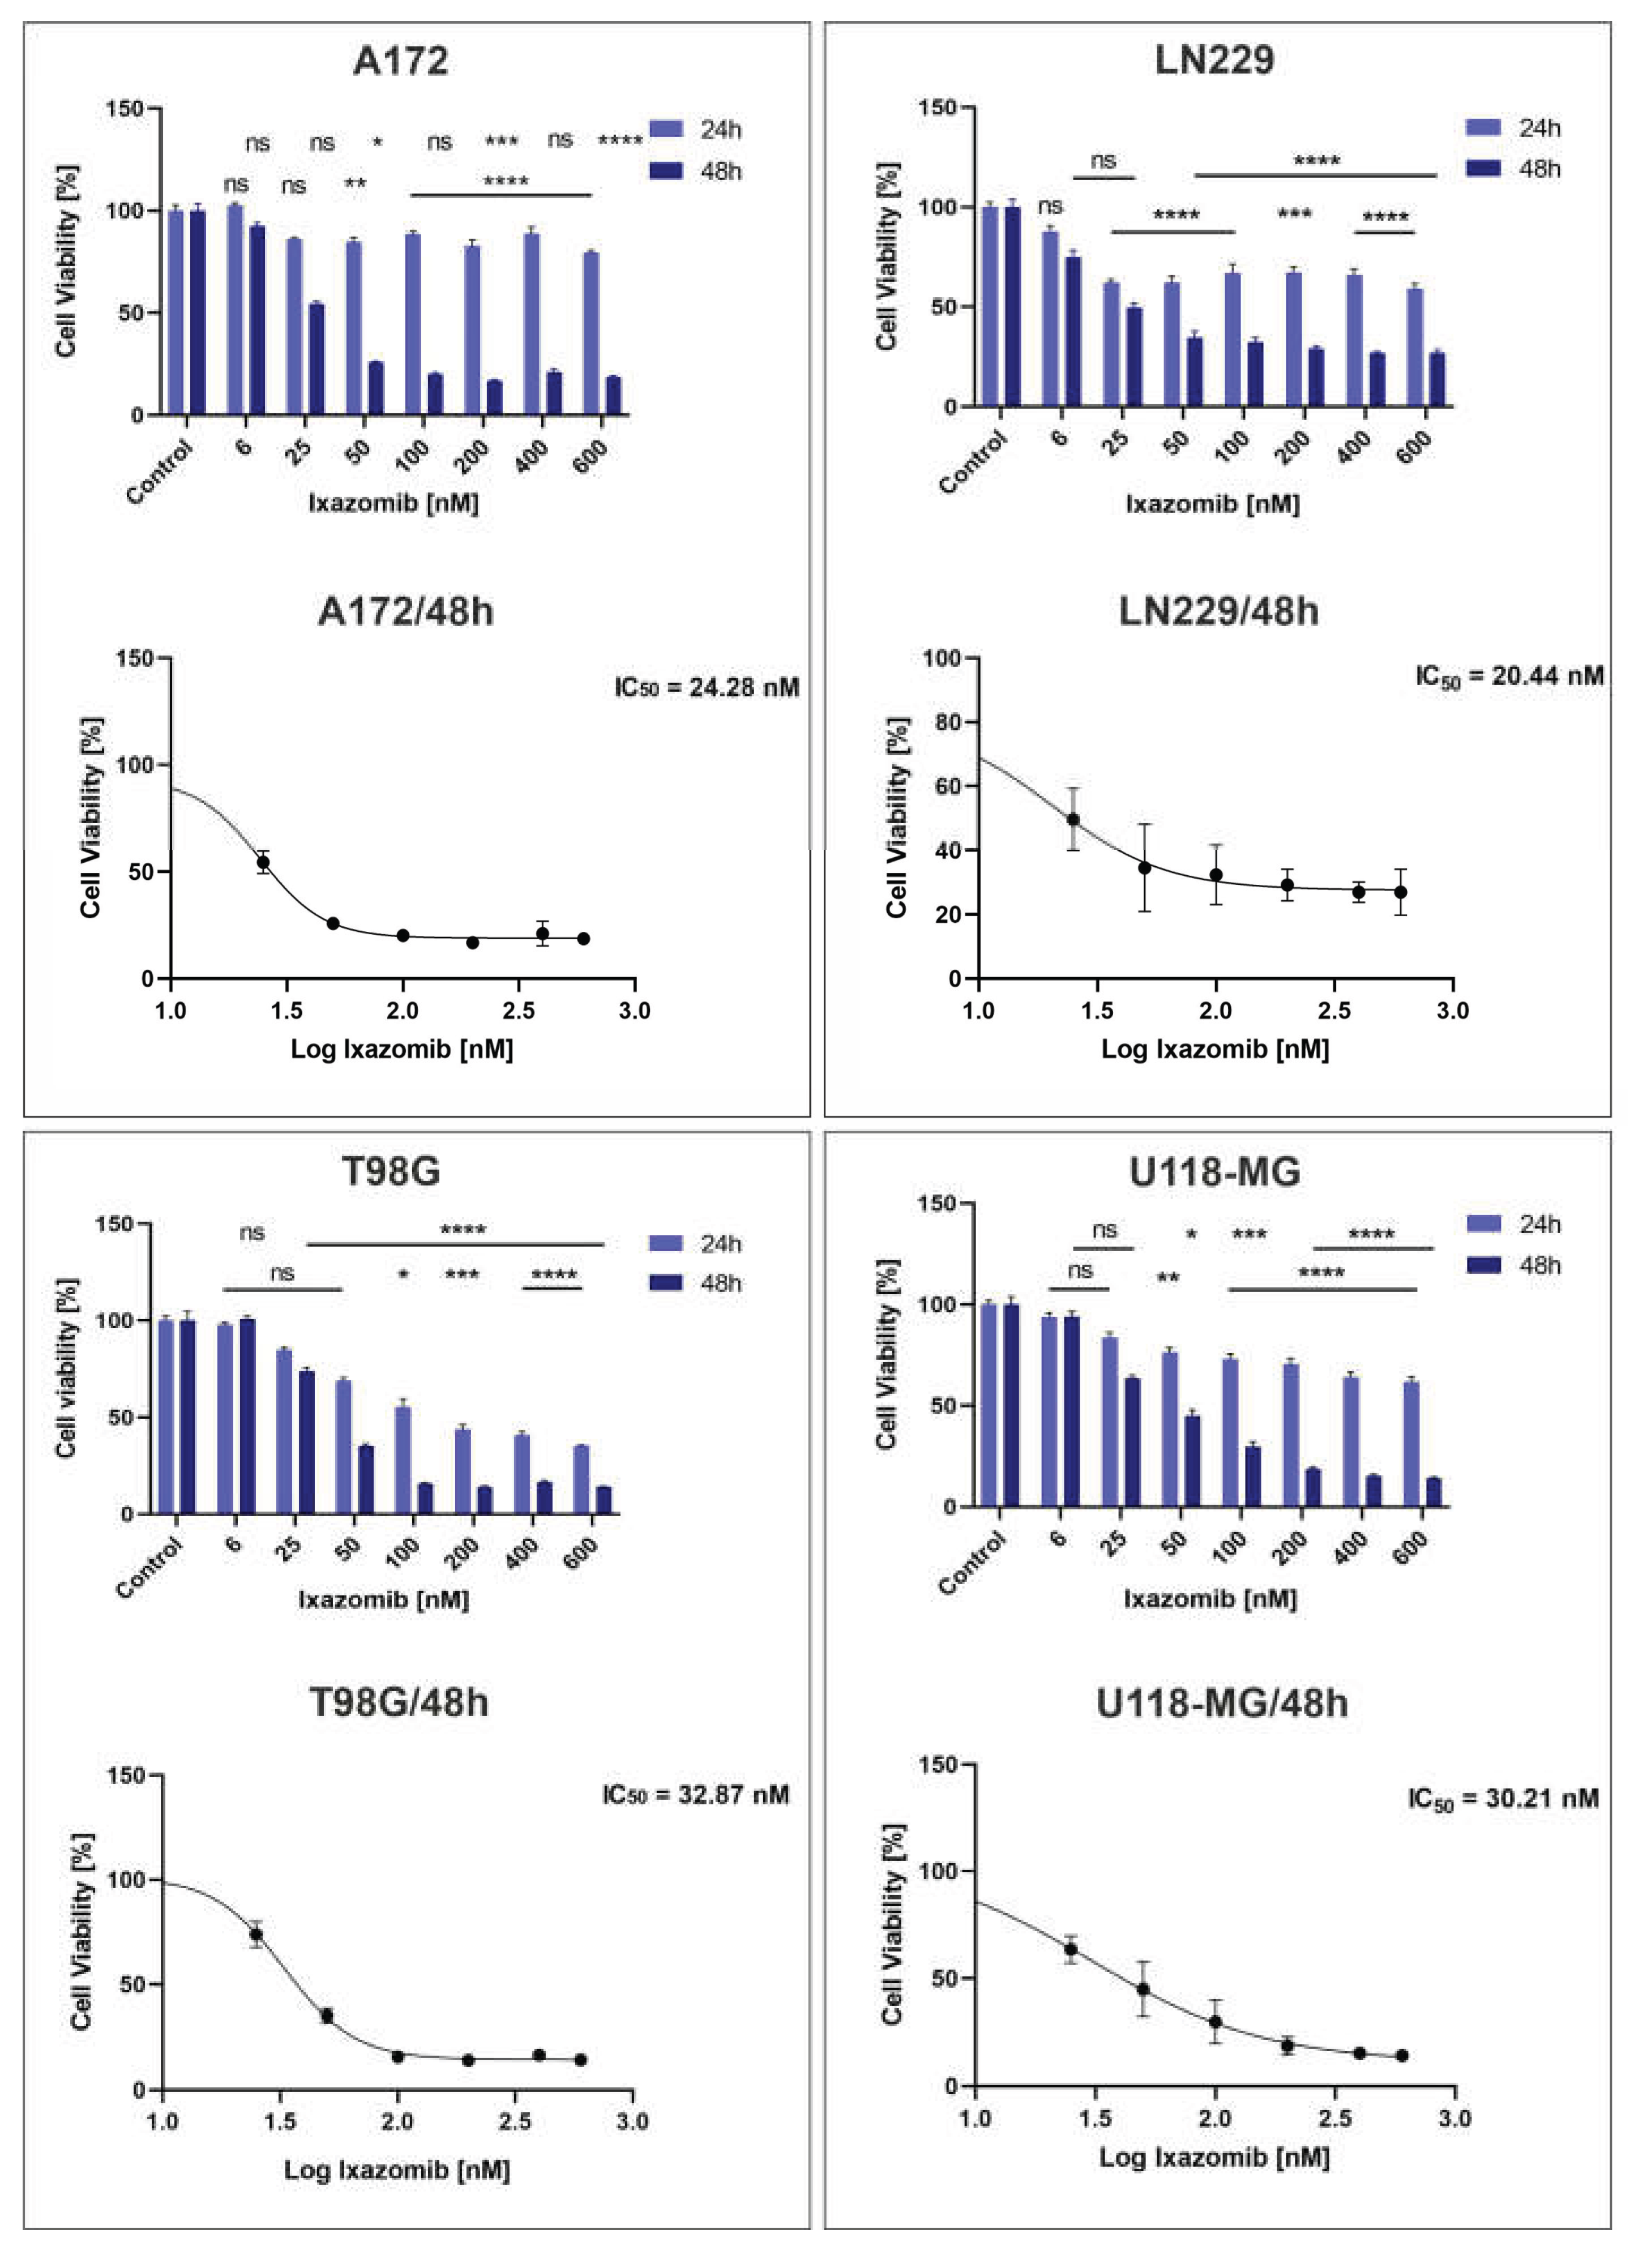
Figure 2.
IXA induces apoptosis in glioma cell lines. The effects of IXA treatment on apoptosis and necrosis were evaluated in A172 (A), LN229 (D), U118-MG (G), and T98G (J) glioma cells using Annexin V-FITC/PI staining followed by flow cytometric analysis. The percentages of apoptotic: A172 (B), LN229 (E), U118-MG (H), and T98G (K) and necrotic: A172 (C), LN229 (F), U118-MG (I), and T98G (L) cells are presented for control and IXA-treated cells. Results are shown as the mean ± SD of three independent experiments, each performed in triplicate. Statistical significance was determined using Student’s t-test with Welch’s correction. * p < 0.05; ****p < 0.0001; ns, not significant.
Figure 2.
IXA induces apoptosis in glioma cell lines. The effects of IXA treatment on apoptosis and necrosis were evaluated in A172 (A), LN229 (D), U118-MG (G), and T98G (J) glioma cells using Annexin V-FITC/PI staining followed by flow cytometric analysis. The percentages of apoptotic: A172 (B), LN229 (E), U118-MG (H), and T98G (K) and necrotic: A172 (C), LN229 (F), U118-MG (I), and T98G (L) cells are presented for control and IXA-treated cells. Results are shown as the mean ± SD of three independent experiments, each performed in triplicate. Statistical significance was determined using Student’s t-test with Welch’s correction. * p < 0.05; ****p < 0.0001; ns, not significant.
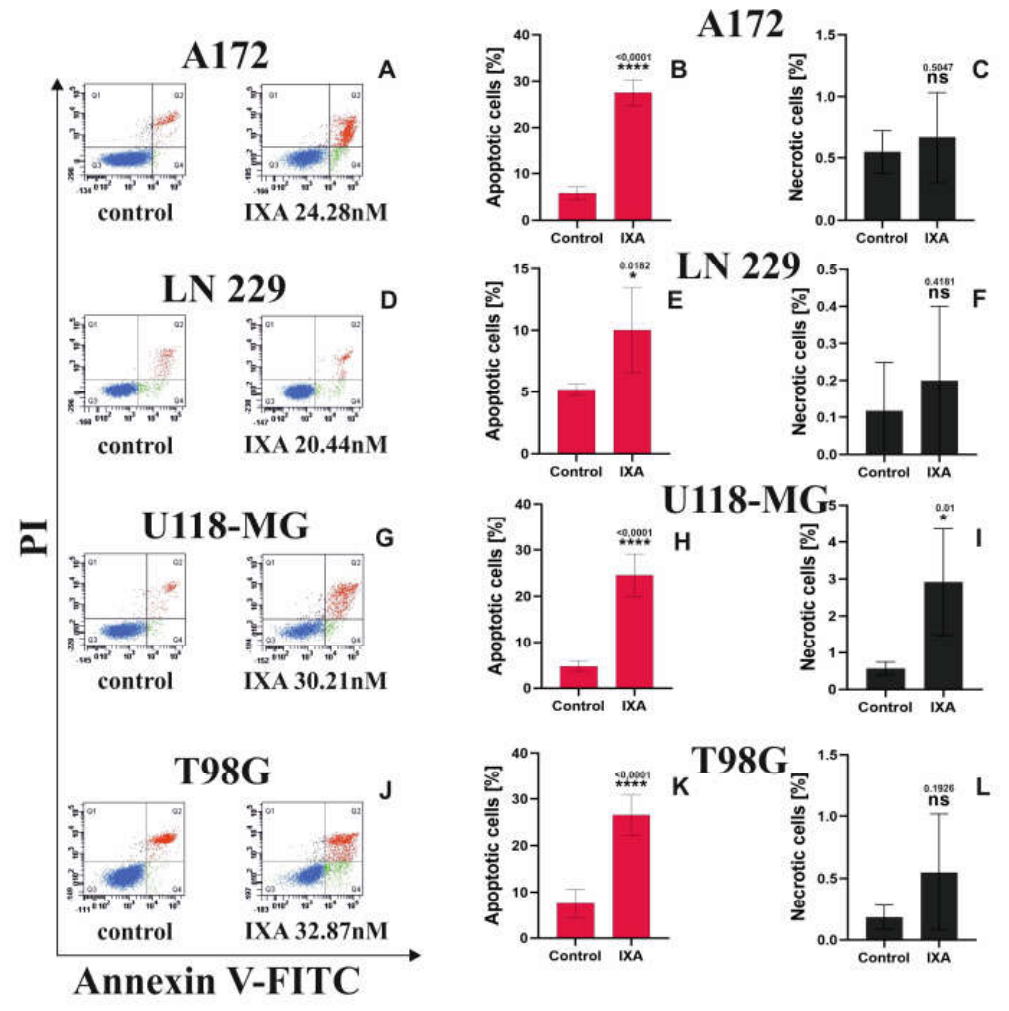
Figure 3.
IXA induces activation of caspase-8 in glioblastoma cell lines. Representative flow cytometry histograms showing active caspase-8 levels in A172 (A), LN229 (C), U118-MG (E), and T98G (G) cells under control conditions and following treatment with IXA at the indicated concentrations. Active caspase-8 was detected using FAM-LETD-FMK Caspase-8 and analyzed by flow cytometry. The corresponding quantification of the percentage of cells positive for active caspase-8 is shown for A172 (B), LN229 (D), U118-MG (F), and T98G (H). Results are shown as the mean ± SD of three independent experiments, each performed in triplicate. Statistical significance was determined using Student’s t-test with Welch’s correction. * p = 0.0130; *** p = 0.0002; **** p < 0.0001; ns, not significant.
Figure 3.
IXA induces activation of caspase-8 in glioblastoma cell lines. Representative flow cytometry histograms showing active caspase-8 levels in A172 (A), LN229 (C), U118-MG (E), and T98G (G) cells under control conditions and following treatment with IXA at the indicated concentrations. Active caspase-8 was detected using FAM-LETD-FMK Caspase-8 and analyzed by flow cytometry. The corresponding quantification of the percentage of cells positive for active caspase-8 is shown for A172 (B), LN229 (D), U118-MG (F), and T98G (H). Results are shown as the mean ± SD of three independent experiments, each performed in triplicate. Statistical significance was determined using Student’s t-test with Welch’s correction. * p = 0.0130; *** p = 0.0002; **** p < 0.0001; ns, not significant.
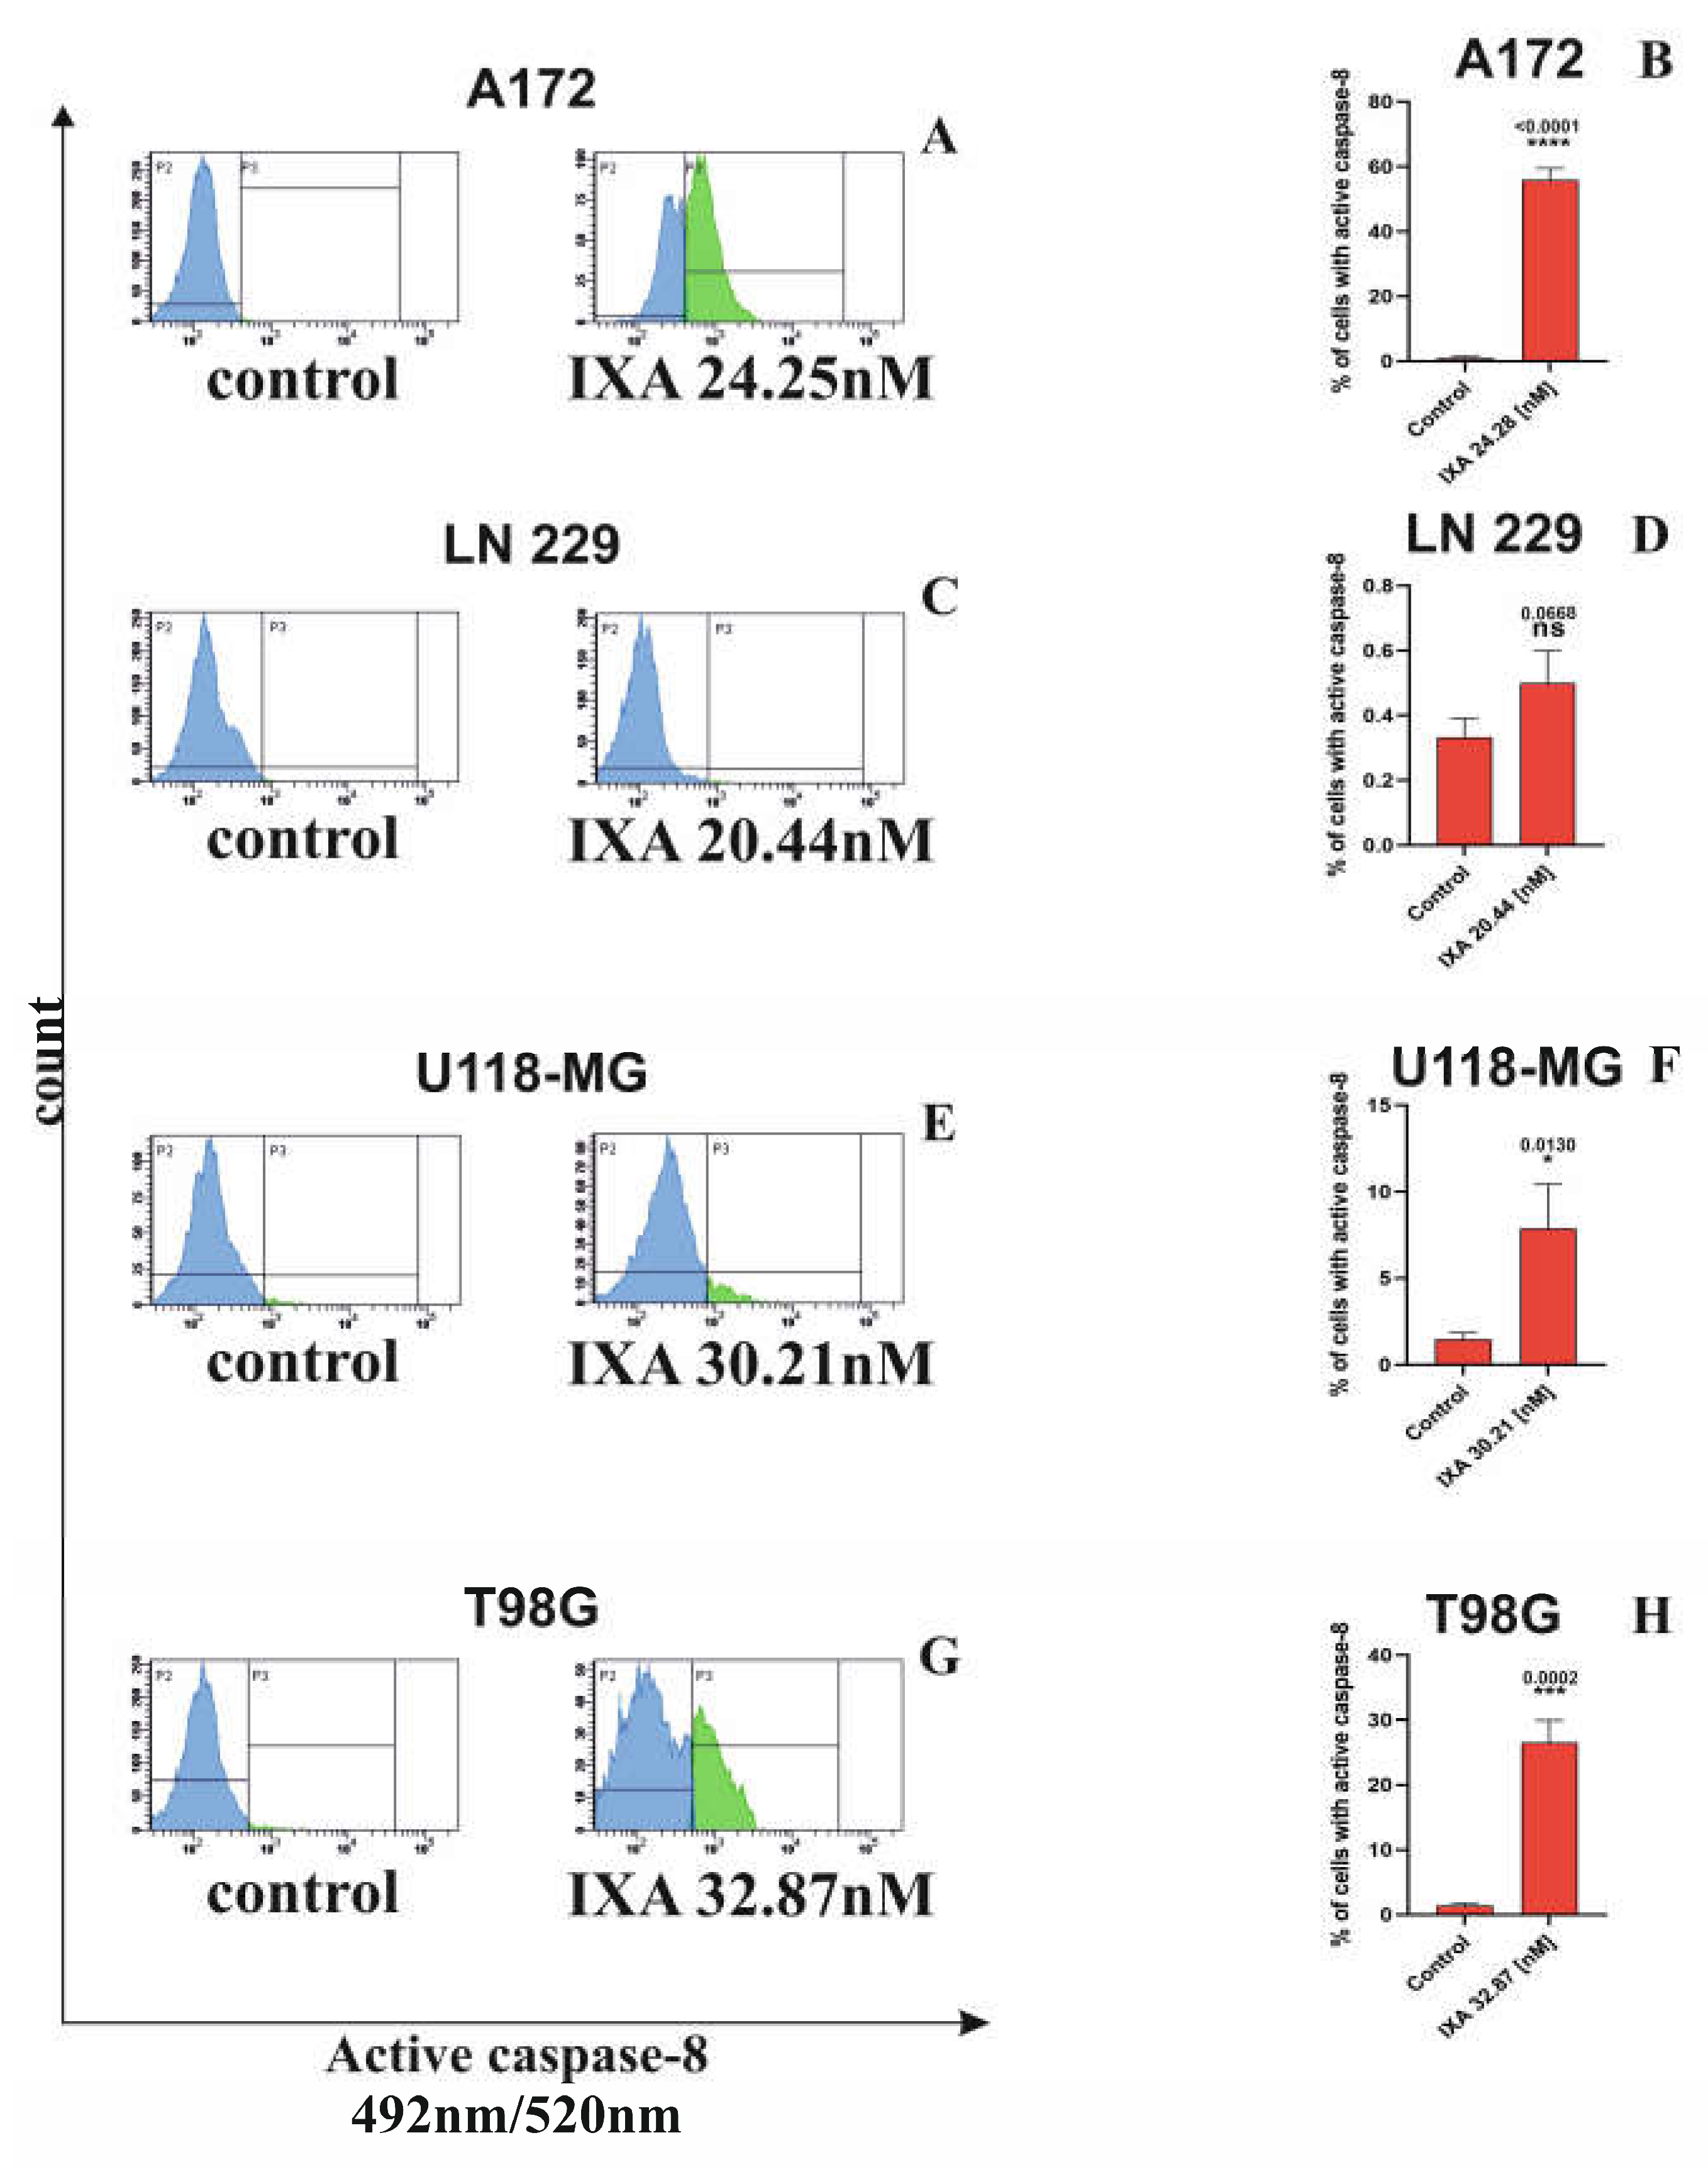
Figure 4.
IXA induces activation of caspase-9 in glioblastoma cell lines. Representative flow cytometry histograms showing active caspase-9 levels in A172 (A), LN229 (C), U118-MG (E), and T98G (G) cells under control conditions and following treatment with IXA at the indicated concentrations. Active caspase-9 was detected using FAM-LEHD-FMK Caspase-9 and analyzed by flow cytometry. The corresponding quantification of the percentage of cells positive for active caspase-9 is shown in A172 (B), LN229 (D), U118-MG (F), and T98G (H). Results are shown as the mean ± SD of three independent experiments, each performed in triplicate. Statistical significance was determined using Student’s t-test with Welch’s correction. * p = 0.0125; *** < 0.05; ns, not significant.
Figure 4.
IXA induces activation of caspase-9 in glioblastoma cell lines. Representative flow cytometry histograms showing active caspase-9 levels in A172 (A), LN229 (C), U118-MG (E), and T98G (G) cells under control conditions and following treatment with IXA at the indicated concentrations. Active caspase-9 was detected using FAM-LEHD-FMK Caspase-9 and analyzed by flow cytometry. The corresponding quantification of the percentage of cells positive for active caspase-9 is shown in A172 (B), LN229 (D), U118-MG (F), and T98G (H). Results are shown as the mean ± SD of three independent experiments, each performed in triplicate. Statistical significance was determined using Student’s t-test with Welch’s correction. * p = 0.0125; *** < 0.05; ns, not significant.
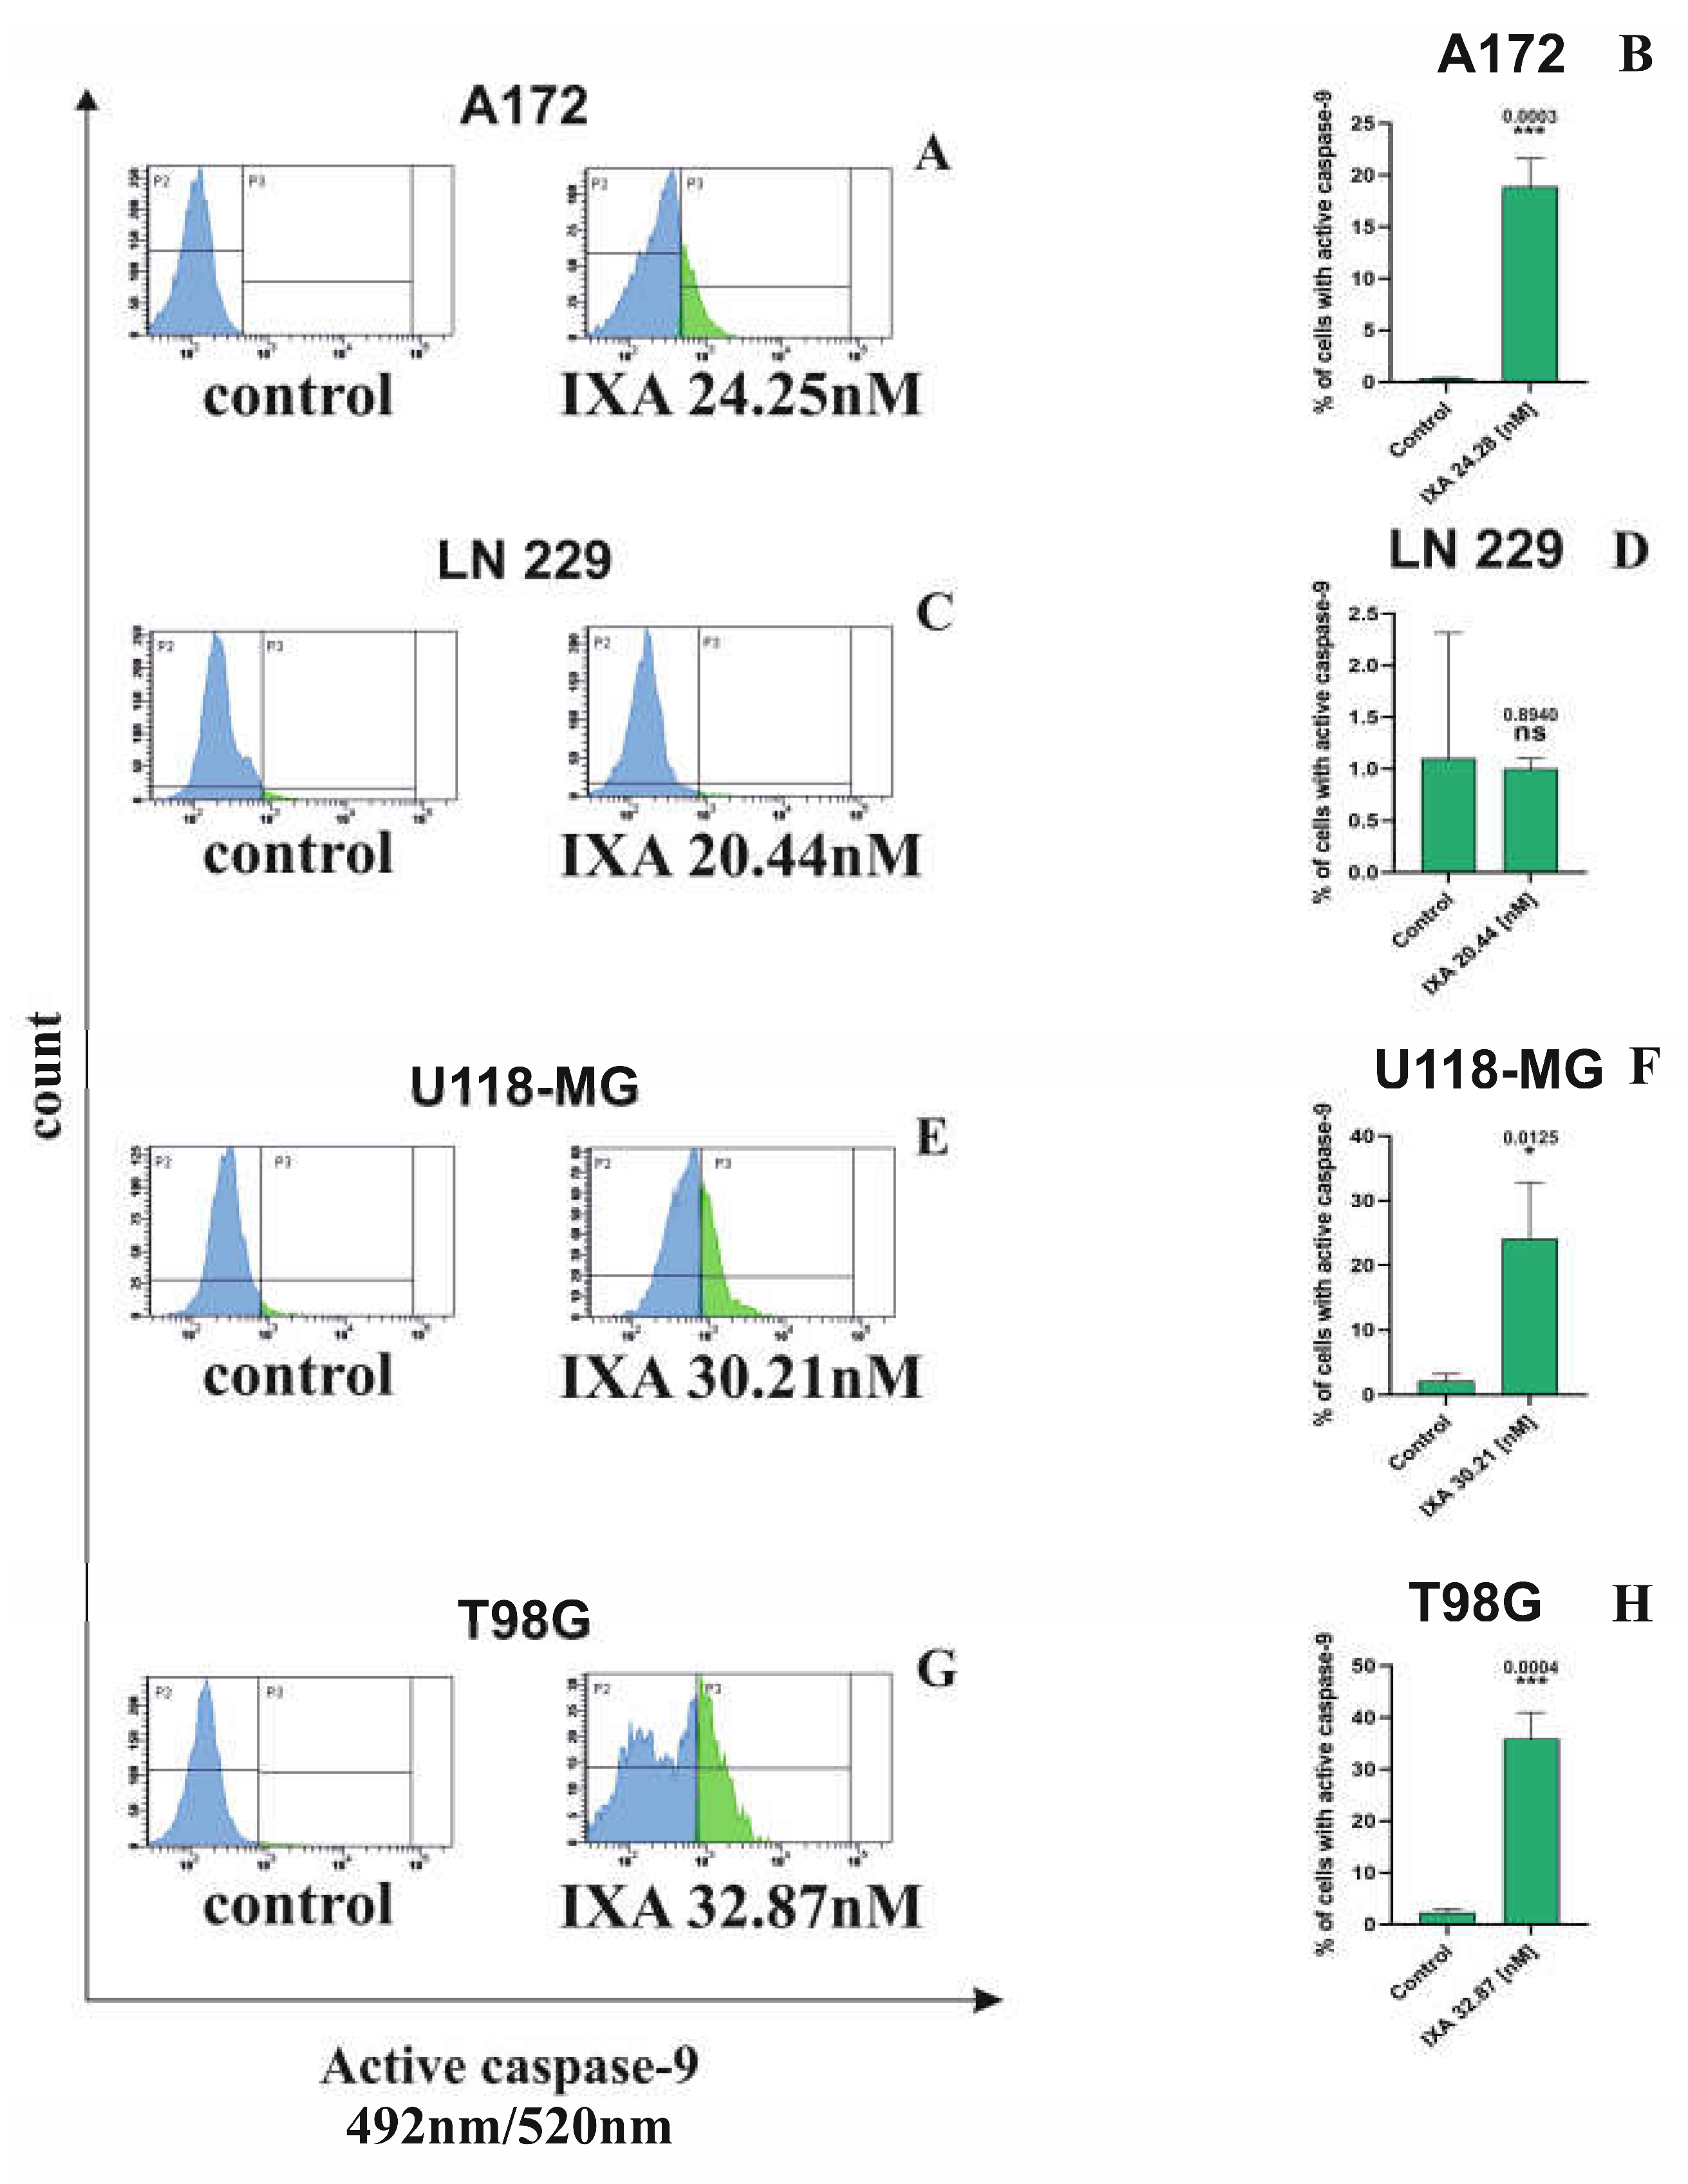
Figure 5.
Effect of IXA treatment on cell cycle distribution in glioma cell lines. Cell cycle distribution was analyzed in A172 (A), LN229 (C), U118-MG (E), and T98G (G) cells following treatment with IXA. The percentages of cells in the sub-G1, G1, S, and G2/M phases were determined and compared with untreated control cells in A172 (B), LN229 (D), U118-MG (F), and T98G (H). Results are shown as the mean ± SD of three independent experiments, each performed in triplicate. Statistical analyses were selected according to the distribution of the data and included two-way ANOVA followed by Sidak’s post hoc test. *p = 0.0105, ***p =< 0.0009, ****p < 0.0001; ns, not significant (p > 0.05).
Figure 5.
Effect of IXA treatment on cell cycle distribution in glioma cell lines. Cell cycle distribution was analyzed in A172 (A), LN229 (C), U118-MG (E), and T98G (G) cells following treatment with IXA. The percentages of cells in the sub-G1, G1, S, and G2/M phases were determined and compared with untreated control cells in A172 (B), LN229 (D), U118-MG (F), and T98G (H). Results are shown as the mean ± SD of three independent experiments, each performed in triplicate. Statistical analyses were selected according to the distribution of the data and included two-way ANOVA followed by Sidak’s post hoc test. *p = 0.0105, ***p =< 0.0009, ****p < 0.0001; ns, not significant (p > 0.05).
Disclaimer/Publisher’s Note: The statements, opinions and data contained in all publications are solely those of the individual author(s) and contributor(s) and not of MDPI and/or the editor(s). MDPI and/or the editor(s) disclaim responsibility for any injury to people or property resulting from any ideas, methods, instructions or products referred to in the content. |
© 2026 by the authors. Licensee MDPI, Basel, Switzerland. This article is an open access article distributed under the terms and conditions of the Creative Commons Attribution (CC BY) license.
Copyright: This open access article is published under a Creative Commons CC BY 4.0 license, which permit the free download, distribution, and reuse, provided that the author and preprint are cited in any reuse.