

Submitted:
28 October 2026
Posted:
29 October 2026
You are already at the latest version
Abstract
Background:
Metabolic reprogramming toward aerobic glycolysis, commonly referred to as the Warburg effect, is a hallmark of cancer. Such metabolic alterations may lead to aberrant expression and release of glycolytic and mitochondrial proteins, which can act as tumor-associated antigens and elicit humoral immune responses. However, whether patients with esophageal carcinoma (EC) develop a broad autoantibody response against these metabolic proteins, and whether such an autoantibody profile has diagnostic or prognostic relevance, has not been systematically investigated.
Objective:
To determine (1) whether serum autoantibodies against 18 proteins involved in glucose metabolism and mitochondrial pathways are broadly elevated in patients with EC and have diagnostic potential; (2) whether combining selected autoantibodies improves diagnostic discrimination; and (3) whether individual or combined autoantibody profiles show exploratory associations with postoperative overall survival.
Methods:
Serum autoantibody levels against 18 metabolic proteins (SLC2A1, ASPSCR1, GK2, ALDOA, TPI1, GAPDH, PGK1, PGK2, ENO1, PGAM1, PKM, PDHB, PCK1, LDHA, SDHB, FH, IDH, and ATP5B) were measured in 191 patients with EC and 96 healthy donors using AlphaLISA. For diagnostic combination analysis, a multivariable logistic regression model combining ENO1-Ab, PDHB-Ab, and ALDOA-Ab was evaluated in the complete-case cohort. In 91 surgically treated patients, exploratory overall survival analyses were performed using Kaplan–Meier curves and log-rank tests after dichotomization of antibody levels.
Results:
All 18 autoantibodies were significantly elevated in patients with EC compared with healthy donors (all P < 0.05), with individual AUC values ranging from 0.593 for SDHB-Ab to 0.735 for ENO1-Ab. The three-autoantibody model combining ENO1-Ab, PDHB-Ab, and ALDOA-Ab achieved an AUC of 0.812 (95% CI, 0.751–0.873), with a sensitivity of 68.1% and a specificity of 83.9%, and showed significantly greater diagnostic discrimination than the individual autoantibodies evaluated in the same cohort. In exploratory postoperative overall survival analyses, PCK1-Ab and SDHB-Ab showed significant differences in overall survival by log-rank testing. Several combined autoantibody profiles were also associated with survival differences, including high ENO1-Ab/low PGAM1-Ab, high SDHB-Ab/low FH-Ab, high ALDOA-Ab/high TPI1-Ab, and high PCK1-Ab/high SDHB-Ab versus low PCK1-Ab/low SDHB-Ab.
Conclusions:
The consistent elevation of autoantibodies against all 18 evaluated metabolic proteins suggests the presence of a broad humoral immune response to metabolic antigens in patients with EC. A three-autoantibody model combining ENO1-Ab, PDHB-Ab, and ALDOA-Ab improved diagnostic discrimination compared with individual markers. Exploratory analyses also identified individual and combined autoantibody profiles associated with postoperative overall survival, warranting further validation in independent cohorts.
Keywords:
glycolytic enzyme
; glycolysis
; TCA cycle
; esophageal carcinoma
; AlphaLISA
1. Introduction
Esophageal carcinoma (EC) remains a major global health challenge because of its aggressive biological behavior and poor prognosis [1]. Despite advances in surgical techniques and multimodal treatment, long-term outcomes remain unsatisfactory, largely because of advanced disease at diagnosis, recurrence, and treatment resistance [2]. Therefore, the identification of reliable biomarkers for the early detection and clinical characterization of EC remains an important unmet need.
Our group has investigated a variety of serum biomarkers for cancer diagnosis, clinicopathological characterization, and outcome assessment [3,4,5,6,7]. In particular, we previously performed large-scale screening for EC-associated antigens using serological identification of antigens by recombinant expression cloning (SEREX) [8,9]. These studies identified several tumor-associated antigens and demonstrated that serum autoantibody levels against selected antigens were significantly elevated in patients with cancer compared with healthy donors [10,11,12,13,14].
One emerging area of cancer biology is metabolic reprogramming, particularly the Warburg effect, in which cancer cells preferentially rely on aerobic glycolysis even in the presence of adequate oxygen [15,16,17]. This metabolic phenotype supports tumor growth by providing ATP and biosynthetic intermediates and has been associated with cancer progression and adverse clinical outcomes [18]. These observations raise the possibility that proteins involved in glycolysis and related metabolic pathways may act not only as functional components of tumor metabolism but also as tumor-associated antigens capable of eliciting humoral immune responses.
In the present study, we therefore focused on serum autoantibodies against 18 proteins involved in glucose transport, glycolysis, gluconeogenesis, the tricarboxylic acid (TCA) cycle, and oxidative phosphorylation. The analyzed proteins comprised ASPSCR1, SLC2A1, and GK2, which are associated with glucose transport and early glucose metabolism; ALDOA, TPI1, GAPDH, PGK1, and PGK2, which participate in the intermediate steps of glycolysis; PGAM1, ENO1, and PKM, which function in late glycolysis; PDHB and PCK1, which link glycolytic and gluconeogenic metabolism with the TCA cycle; LDHA, which is involved in lactate production; and SDHB, FH, IDH, and ATP5B, which are involved in mitochondrial metabolism and oxidative phosphorylation.
Autoantibodies against intracellular metabolic proteins may arise as a consequence of tumor-associated antigen overexpression, release of intracellular proteins during tumor cell death, or immune recognition of aberrantly expressed antigens [19,20]. Because autoantibodies can be amplified through the host immune response, they may be detectable even when circulating antigen concentrations are low, providing a potential advantage for cancer detection. Previous studies have demonstrated humoral immune responses against metabolic enzymes such as ENO1 [10] and FH [12], and have suggested that antibodies against metabolic proteins may have biomarker potential in gastrointestinal malignancies. Glycolytic and mitochondrial proteins may therefore represent a broad class of immunogenic tumor-associated antigens rather than merely intracellular metabolic components [21,22,23,24].
In this study, we systematically characterized serum autoantibody responses against 18 proteins involved in glucose transport, glycolysis, the TCA cycle, and mitochondrial metabolism in patients with EC. We evaluated the diagnostic performance of individual autoantibodies and investigated whether selected combinations could improve discrimination between patients with EC and healthy donors. We also examined associations with clinicopathological characteristics and performed exploratory analyses of postoperative overall survival. To our knowledge, this is the first study to comprehensively profile autoantibodies spanning these interconnected metabolic pathways within a single EC cohort.
2. Materials and Methods
2.1. Study Population
A total of 191 patients with esophageal carcinoma (EC) were enrolled in this study. Among them, 91 underwent radical surgery with or without neoadjuvant chemotherapy or chemoradiotherapy at Toho University Omori Medical Center between June 2010 and February 2016. All serum samples were collected before treatment, and the patients were followed until July 2018 or death. Serum samples from 96 healthy donors were collected at Port Square Kashiwado Clinic. Clinical data, including age, sex, tumor stage, laboratory findings, tumor marker levels, and clinical outcomes, were retrospectively obtained from medical records.
All study participants provided written informed consent for the use of their blood samples for research purposes before enrollment. The study protocol was approved by the Ethics Committee of Toho University (approval no. T2024-2081, Ota-ku, Tokyo, Japan) and Port Square Kashiwado Clinic, Kashiwado Memorial Foundation (approval no. 2012-001). The study was registered in the UMIN Clinical Trials Registry (UMIN000014530; registration date: July 11, 2014) and was conducted in accordance with the Declaration of Helsinki and the Japanese Ethical Guidelines for Clinical Research.
Before treatment, blood samples were collected and centrifuged at 3,000 × g for 10 min, and the serum supernatants were stored at −80 °C until analysis.
2.2. Expression and Purification of Recombinant Antigenic Proteins
cDNA clones of ASPSCR1, SLC2A1 [9], ALDOA [12,25], GAPDH, ENO1 [10], PCK1 [26], FH [12,25], IDH, and ATP5B were isolated by SEREX screening and cloned into the prokaryotic expression vectors pGEX-4T-1, -2, or -3 (GE Healthcare Life Sciences, Pittsburgh, PA). Full-length cDNA clones of GK2, TPI1, PGK1, PGK2, PGAM1, PKM, PDHB, LDHA, and SDHB cloned into pGEX-4T-1 were purchased from GenScript (Piscataway, NJ). Escherichia coli BL-21 cells (Nippon Gene, Tokyo, Japan) were transformed with the expression plasmids and cultured for 3 h at 37 °C in 200 mL Luria broth containing 0.1 mM isopropyl β-D-thiogalactopyranoside (IPTG; Wako Pure Chemicals, Osaka, Japan). Cells were lysed by sonication in BugBuster Protein Extraction Reagent (Merck Millipore, Darmstadt, Germany), and GST-tagged proteins were purified by affinity chromatography using glutathione-Sepharose columns (Glutathione Sepharose®, Cytiva, Pittsburgh, PA), as previously described [27,28,29,30].
2.3. Measurement of Serum Antibody Levels of Glycolytic Proteins by Amplified Luminescence Proximity Homogeneous Assay-Linked Immunosorbent Assay and Conventional Serum Markers
Serum antibody titers against glycolytic proteins were measured using an amplified luminescence proximity homogeneous assay-linked immunosorbent assay (AlphaLISA™, Revvity, Inc., Waltham, MA). AlphaLISA assays are homogeneous, no-wash immunoassays with high analytical sensitivity and a wide dynamic range. AlphaLISA measurements were performed using Anti-Human HA Acceptor Beads (cat. no. AL170M), AlphaScreen GSH Donor Beads (cat. no. 6765301), and AlphaLISA buffer (cat. no. AL000F) in 384-well microtiter plates (white opaque OptiPlate™, Revvity, Inc.). Each well contained 2.5 μL of 1:100-diluted serum and 2.5 μL of 10 μg/mL control glutathione S-transferase (GST), GST-ASPSCR1, GST-SLC2A1, GST-GK2, GST-ALDOA, GST-TPI1, GST-GAPDH, GST-PGK1, GST-PGK2, GST-PGAM1, GST-ENO1, GST-PKM, GST-PDHB, GST-PCK1, GST-LDHA, GST-SDHB, GST-FH, GST-IDH, or GST-ATP5B in AlphaLISA buffer (25 mM HEPES, pH 7.4, 0.1% casein, 0.5% Triton X-100, 1 mg/mL dextran-500, and 0.05% ProClin-300), as previously described [31]. The reaction mixture was incubated at 25 °C for 6–8 h. Next, anti-human IgG-conjugated acceptor beads (2.5 μL of 40 μg/mL) and glutathione-conjugated donor beads (2.5 μL of 40 μg/mL) were added, and the mixture was further incubated for 7–28 days at room temperature in the dark. Luminescence emission at 607–623 nm (Alpha photon counts) was measured using an EnSpire™ Alpha microplate reader (Revvity, Inc.), as previously described [3,4,5,6,7,10,11,12,13,14,27,28,29,30]. Specific antibody reactivity was calculated by subtracting the Alpha photon counts of GST controls from those of the corresponding GST-fusion proteins.
2.4. Autoantibody Detection
Recombinant human proteins corresponding to 18 metabolic proteins involved in glycolysis, gluconeogenesis, and related metabolic pathways were selected for AlphaLISA-based autoantibody quantification, as described in Section 2.3. The target panel was categorized as follows:
Glucose transport and early glycolysis: SLC2A1, ASPSCR1, and GK2
Middle glycolysis: ALDOA, TPI1, GAPDH, PGK1, and PGK2
Late glycolysis: ENO1, PGAM1, and PKM
Link between glycolysis/gluconeogenesis and the TCA cycle: PDHB and PCK1
Lactate production: LDHA
TCA cycle and oxidative phosphorylation: SDHB, FH, IDH, and ATP5B
The metabolic positions of these proteins are illustrated in Supplementary Figure S1.
2.5. Statistical Analysis
The Mann–Whitney U test was used to compare antibody titers between patients with EC and healthy donors. For each autoantibody, receiver operating characteristic (ROC) curve analysis was performed to evaluate its ability to discriminate patients with EC from healthy donors. The area under the ROC curve (AUC) was calculated, and the optimal cutoff value was determined using the Youden index. In clinicopathological analyses, categorical variables were compared using Fisher’s exact test.
Based on the individual ROC analyses, ENO1-Ab, PDHB-Ab, ALDOA-Ab, and SLC2A1-Ab were selected as candidate markers for combination analysis, taking into account both their individual diagnostic performance and their representation of distinct steps within glucose and related metabolic pathways. A preliminary multivariable logistic regression model including all four markers was examined; because inclusion of SLC2A1-Ab did not improve the diagnostic performance of the model, the final model consisted of ENO1-Ab, PDHB-Ab, and ALDOA-Ab. The combination analysis was restricted to participants with complete data for all three markers (93 healthy donors and 94 patients with EC; n = 187). Predicted probabilities derived from the final logistic regression model were used to construct the ROC curve. The optimal cutoff was determined using the Youden index, and sensitivity, specificity, positive predictive value (PPV), and negative predictive value (NPV) were calculated with 95% confidence intervals.
For direct comparison with the three-marker model, the diagnostic performance of the individual candidate markers was recalculated using the same complete-case cohort. The AUCs of the three-marker model and the individual autoantibodies were compared using the paired DeLong test. Accordingly, cutoff values, sensitivity, specificity, and AUC estimates obtained in the complete-case cohort may differ slightly from those obtained from the individual ROC analyses using all available samples.
For exploratory postoperative survival analyses, antibody levels were dichotomized using cutoffs derived from ROC analysis of vital status. Kaplan–Meier survival curves were generated for the high- and low-antibody groups, and differences were assessed using the log-rank test. Because the number of deaths was small and the observed deaths included deaths from causes unrelated to esophageal carcinoma, these analyses were considered exploratory and reflect all-cause rather than cancer-specific survival. Multivariable survival analysis was not performed because of the limited number of events. Selected biologically related antibody combinations were also explored.
Statistical analyses were performed using EZR (version 1.54) [34], and two-sided P values < 0.05 were considered statistically significant.
3. Results
3.1. Patient Characteristics
The EC patient cohort included 153 men and 38 women, with a median age of 68 years (range, 43–84 years). Among the 91 surgically treated patients, 70 were men and 21 were women, with a median age of 67 years (range, 43–74 years). Most patients had squamous cell carcinoma. The median follow-up duration was 36 months. During follow-up, 13 patients died, including deaths from causes unrelated to esophageal carcinoma.
3.2. Comparison of Autoantibody Levels Between Patients with Ec and Healthy Donors
Serum levels of autoantibodies targeting glycolytic and mitochondrial proteins were compared between patients with EC and healthy donors (Figure 1). All 18 autoantibodies showed significantly higher titers in patients with EC than in healthy donors. The median antibody titers in healthy donors versus patients with EC, together with the corresponding Mann–Whitney U test P values, were as follows: ASPSCR1 (3,841 vs. 5,047, P < 0.001), SLC2A1 (13,667 vs. 21,989, P < 0.001), GK2 (5,489 vs. 7,174, P = 0.004), ALDOA (46,141 vs. 60,773, P < 0.001), TPI1 (7,125 vs. 9,468, P < 0.001), GAPDH (141 vs. 5,377, P < 0.001), PGK1 (32,771 vs. 37,830, P < 0.001), PGK2 (−1,568 vs. 298, P = 0.03), PGAM1 (24,664 vs. 34,191, P < 0.001), ENO1 (15,793 vs. 26,854, P < 0.001), PKM (41,680 vs. 59,013, P < 0.001), PDHB (29 vs. 4,528, P < 0.001), PCK1 (20,834 vs. 28,720, P < 0.001), LDHA (54,145 vs. 82,665, P < 0.001), SDHB (6,077 vs. 8,663, P = 0.03), FH (21,894 vs. 25,361, P = 0.004), IDH (28,888 vs. 47,773, P < 0.001), and ATP5B (3,699 vs. 5,314, P < 0.001).
Individual ROC curve analyses were subsequently performed to evaluate the diagnostic performance of each autoantibody (Figure 2 and Table 1). The AUCs ranged from 0.593 for SDHB-Ab to 0.735 for ENO1-Ab. ENO1-Ab showed the highest individual AUC (0.735; 95% CI, 0.676–0.793), followed by PDHB-Ab (AUC, 0.698; 95% CI, 0.623–0.774), LDHA-Ab (AUC, 0.688; 95% CI, 0.612–0.763), ALDOA-Ab (AUC, 0.686; 95% CI, 0.622–0.750), and SLC2A1-Ab (AUC, 0.685; 95% CI, 0.609–0.761). The optimal cutoff values and corresponding sensitivities and specificities for all 18 autoantibodies are summarized in Table 1. Based on these findings and pathway representation, ENO1-Ab, PDHB-Ab, ALDOA-Ab, and SLC2A1-Ab were further evaluated as candidate markers for combination analysis.
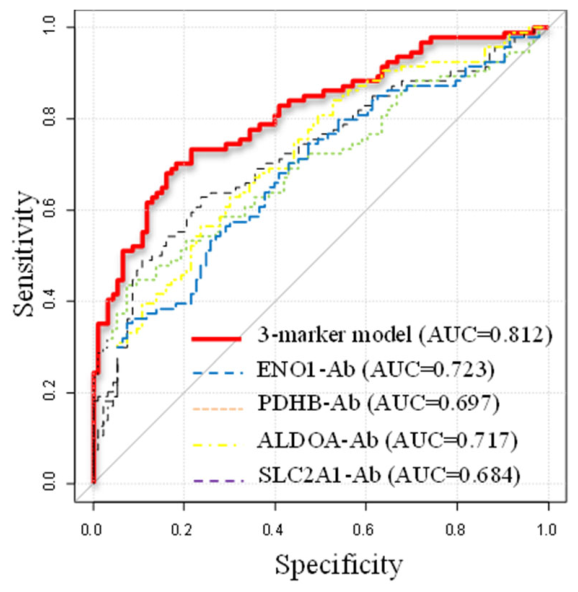
In the complete-case diagnostic cohort comprising 93 healthy donors and 94 patients with EC, a three-autoantibody logistic regression model combining ENO1-Ab, PDHB-Ab, and ALDOA-Ab achieved an AUC of 0.812 (95% CI, 0.751–0.873), with a sensitivity of 68.1% and a specificity of 83.9% at the optimal cutoff. The AUC of the combined model was significantly higher than those of ENO1-Ab (AUC, 0.723; P = 0.0024), PDHB-Ab (AUC, 0.697; P < 0.001), ALDOA-Ab (AUC, 0.717; P = 0.0019), and SLC2A1-Ab (AUC, 0.684; P < 0.001) alone (Figure 2B and Table 2).
Transcript expression levels of the glycolytic and mitochondrial genes were evaluated using publicly available TCGA esophageal carcinoma data obtained through the University of Alabama at Birmingham Cancer Data Analysis Portal (UALCAN) [35] (Supplementary Figure S2). Compared with normal esophageal tissues, transcript expression levels were higher in EC tissues for most of the evaluated genes. Data were not available for GK2, PKM, and IDH. These findings suggest that the broadly elevated serum autoantibody levels observed in patients with EC may, at least in part, be associated with increased expression of the corresponding antigens in tumor tissues.
Figure 1.
Comparison of serum autoantibody levels between patients with esophageal carcinoma and healthy donors.Serum autoantibody levels in patients with esophageal carcinoma (EC) and healthy donors (HD) were measured using AlphaLISA and are presented as box-and-whisker plots. Boxes indicate the 25th, 50th, and 75th percentiles, and the whiskers indicate the 90th percentile range. Differences between the two groups were assessed using the Mann–Whitney U test, with P < 0.05 considered statistically significant. A, ASPSCR1-Ab; B, SLC2A1-Ab; C, GK2-Ab; D, ALDOA-Ab; E, TPI1-Ab; F, GAPDH-Ab; G, PGK1-Ab; H, PGK2-Ab; I, PGAM1-Ab; J, ENO1-Ab; K, PKM-Ab; L, PDHB-Ab; M, PCK1-Ab; N, LDHA-Ab; O, SDHB-Ab; P, FH-Ab; Q, IDH-Ab; and R, ATP5B-Ab.
Figure 1.
Comparison of serum autoantibody levels between patients with esophageal carcinoma and healthy donors.Serum autoantibody levels in patients with esophageal carcinoma (EC) and healthy donors (HD) were measured using AlphaLISA and are presented as box-and-whisker plots. Boxes indicate the 25th, 50th, and 75th percentiles, and the whiskers indicate the 90th percentile range. Differences between the two groups were assessed using the Mann–Whitney U test, with P < 0.05 considered statistically significant. A, ASPSCR1-Ab; B, SLC2A1-Ab; C, GK2-Ab; D, ALDOA-Ab; E, TPI1-Ab; F, GAPDH-Ab; G, PGK1-Ab; H, PGK2-Ab; I, PGAM1-Ab; J, ENO1-Ab; K, PKM-Ab; L, PDHB-Ab; M, PCK1-Ab; N, LDHA-Ab; O, SDHB-Ab; P, FH-Ab; Q, IDH-Ab; and R, ATP5B-Ab.
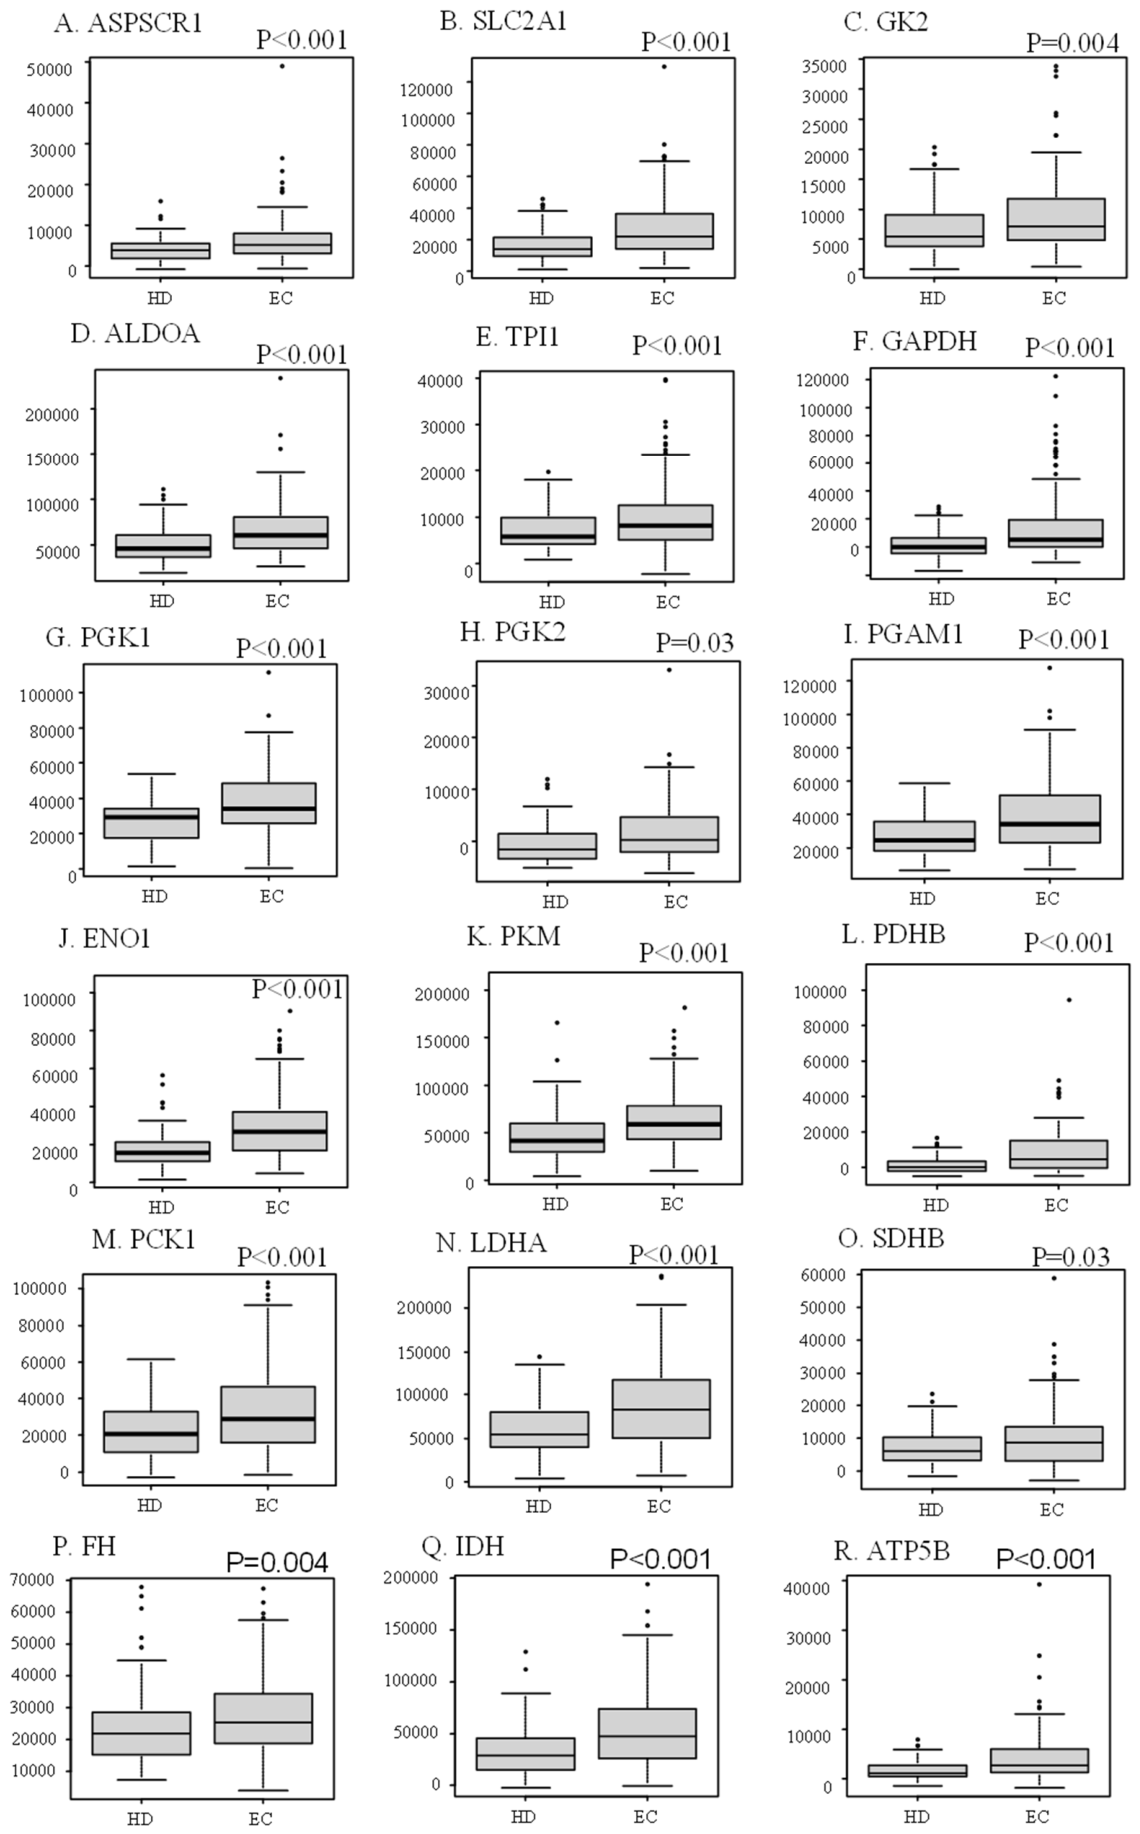
Figure 2.
Receiver operating characteristic curves for discrimination between patients with esophageal carcinoma and healthy donors.Receiver operating characteristic (ROC) curve analysis was performed for each autoantibody to evaluate its ability to discriminate patients with esophageal carcinoma (EC) from healthy donors (HD). The indicated point on each ROC curve represents the optimal cutoff determined using the Youden index, and the values in parentheses indicate specificity and sensitivity, respectively. A, ASPSCR1-Ab; B, SLC2A1-Ab; C, GK2-Ab; D, ALDOA-Ab; E, TPI1-Ab; F, GAPDH-Ab; G, PGK1-Ab; H, PGK2-Ab; I, PGAM1-Ab; J, ENO1-Ab; K, PKM-Ab; L, PDHB-Ab; M, PCK1-Ab; N, LDHA-Ab; O, SDHB-Ab; P, FH-Ab; Q, IDH-Ab; and R, ATP5B-Ab.
Figure 2.
Receiver operating characteristic curves for discrimination between patients with esophageal carcinoma and healthy donors.Receiver operating characteristic (ROC) curve analysis was performed for each autoantibody to evaluate its ability to discriminate patients with esophageal carcinoma (EC) from healthy donors (HD). The indicated point on each ROC curve represents the optimal cutoff determined using the Youden index, and the values in parentheses indicate specificity and sensitivity, respectively. A, ASPSCR1-Ab; B, SLC2A1-Ab; C, GK2-Ab; D, ALDOA-Ab; E, TPI1-Ab; F, GAPDH-Ab; G, PGK1-Ab; H, PGK2-Ab; I, PGAM1-Ab; J, ENO1-Ab; K, PKM-Ab; L, PDHB-Ab; M, PCK1-Ab; N, LDHA-Ab; O, SDHB-Ab; P, FH-Ab; Q, IDH-Ab; and R, ATP5B-Ab.
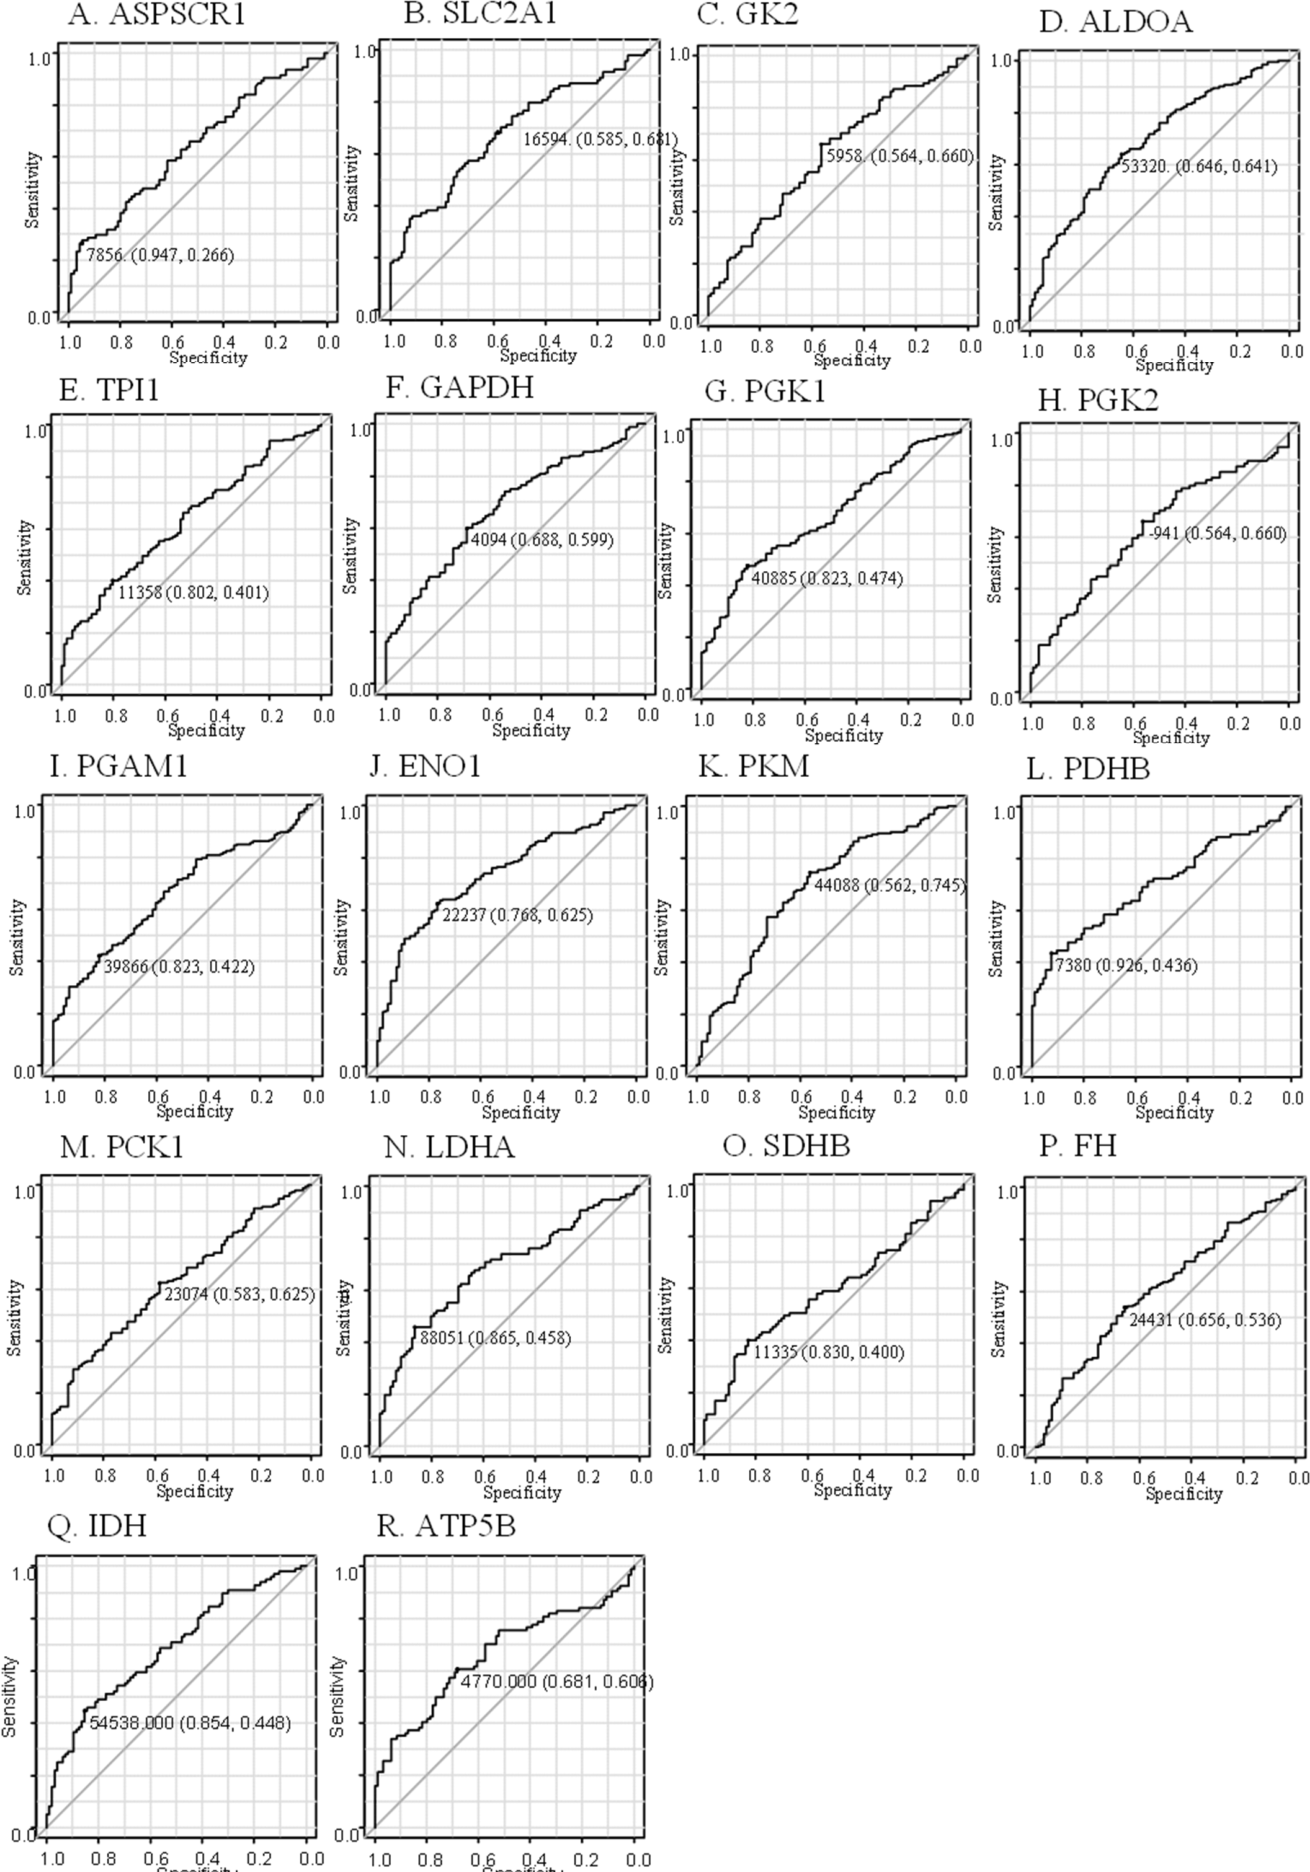
Figure 2.
B. Receiver operating characteristic curves of the three-autoantibody model and individual autoantibodies for discriminating patients with esophageal carcinoma from healthy donors. The three-marker model consisted of ENO1-Ab, PDHB-Ab, and ALDOA-Ab. The area under the receiver operating characteristic curve (AUC) was 0.812 for the three-marker model, compared with 0.723 for ENO1-Ab, 0.717 for ALDOA-Ab, 0.697 for PDHB-Ab, and 0.684 for SLC2A1-Ab.
Figure 2.
B. Receiver operating characteristic curves of the three-autoantibody model and individual autoantibodies for discriminating patients with esophageal carcinoma from healthy donors. The three-marker model consisted of ENO1-Ab, PDHB-Ab, and ALDOA-Ab. The area under the receiver operating characteristic curve (AUC) was 0.812 for the three-marker model, compared with 0.723 for ENO1-Ab, 0.717 for ALDOA-Ab, 0.697 for PDHB-Ab, and 0.684 for SLC2A1-Ab.
3.3. Comparison of Autoantibody Levels According to Postoperative Vital Status
We next evaluated whether pretreatment autoantibody levels differed between patients who were alive and those who died during follow-up (median follow-up, 36 months; censored at July 2018 or death). No statistically significant differences were observed in any individual autoantibody titer between the two groups (P > 0.05 for all comparisons; Figure 3). Because the observed deaths included deaths from causes unrelated to esophageal carcinoma, this analysis reflects all-cause postoperative survival rather than cancer-specific mortality.
3.4. Associations Between Serum Autoantibody Levels and Clinicopathological Characteristics
When patients were stratified according to pathological stage (stage 0 to IVa), no clear trends or statistically significant differences in autoantibody titers were observed across disease stages (Figure 4).
Fisher’s exact tests were also performed to evaluate associations between the high- and low-antibody groups, as defined for the exploratory survival analyses, and clinicopathological characteristics. No consistent associations were observed with sex, age, tumor location, tumor depth, lymph node metastasis, white blood cell count, neutrophil count, lymphocyte count, hemoglobin, C-reactive protein, albumin, lactate dehydrogenase, HbA1c, SCC-Ag, or s-p53-Abs (Table 3). Cutoff values for routine laboratory parameters were based on commonly used clinical reference values.
3.5. Exploratory Overall Survival Analysis Based on Individual Autoantibody Titers
To explore associations with postoperative overall survival, cutoff values for each autoantibody were determined using the Youden index based on vital status, and Kaplan–Meier survival curves were compared between the high- and low-antibody groups. PCK1-Ab (P = 0.043) and SDHB-Ab (P = 0.035) showed nominally significant differences in overall survival, whereas ALDOA-Ab showed a non-significant trend (P = 0.078) (Figure 5).
Survival associations of the corresponding metabolic genes were also examined using publicly available TCGA esophageal carcinoma data through the UALCAN portal [35] (Supplementary Figure S3). No statistically significant survival associations were observed for the evaluated genes. Data were not available for GK2, PKM, and IDH. In the UALCAN analysis, high- and low-expression groups were defined according to the median transcript expression level provided by the portal.
3.6. Exploratory Overall Survival Analysis Based on Combined Autoantibody Profiles
Exploratory analysis of selected autoantibody combinations identified nominal differences in postoperative overall survival (Figure 6). High ALDOA-Ab/high TPI1-Ab (P = 0.005), high ENO1-Ab/low PGAM1-Ab (P = 0.004), and high SDHB-Ab/low FH-Ab (P = 0.040) were associated with longer overall survival by log-rank testing. In addition, patients with high PCK1-Ab/high SDHB-Ab showed longer overall survival than those with low PCK1-Ab/low SDHB-Ab (P = 0.0067).
4. Discussion
It has long been recognized that cancer cells undergo metabolic reprogramming characterized by enhanced glycolysis, commonly referred to as the Warburg effect [15,16,17,18]. In our previous SEREX screening studies of esophageal carcinoma, several glycolytic enzymes were identified as autoantigens [8,9]. Building on these observations, we investigated serum autoantibody responses against 18 proteins involved in glycolysis, related metabolic pathways, and mitochondrial metabolism in patients with EC.
All 18 autoantibody levels were significantly elevated in patients with EC compared with healthy donors (all P < 0.05), with individual AUC values ranging from 0.593 for SDHB-Ab to 0.735 for ENO1-Ab. The consistent elevation of autoantibodies against all 18 evaluated metabolic proteins suggests the presence of a broad humoral immune response to glycolytic and mitochondrial antigens. Although the diagnostic performance of individual autoantibodies was modest to moderate, the consistent elevation across multiple metabolic targets suggests that a pathway-wide autoantibody response may provide useful diagnostic information beyond that obtained from any single marker.
In contrast, autoantibody levels showed no consistent associations with pathological stage or other clinicopathological characteristics (Figure 4 and Table 3). These findings suggest that the observed autoantibody response may not be closely related to conventional measures of tumor burden or clinicopathological progression and may instead reflect a distinct aspect of the host immune response to metabolic alterations in EC.
The diagnostic performance was further improved by combining selected autoantibodies. The three-marker model combining ENO1-Ab, PDHB-Ab, and ALDOA-Ab achieved an AUC of 0.812, which was significantly higher than the AUCs of the individual autoantibodies evaluated in the same complete-case cohort, including ENO1-Ab, PDHB-Ab, ALDOA-Ab, and SLC2A1-Ab. The model also achieved a sensitivity of 68.1% and a specificity of 83.9%, indicating improved overall discrimination compared with the individual markers. These findings suggest that autoantibodies targeting distinct steps of glucose metabolism, including glycolysis and the metabolic link between glycolysis and the TCA cycle, may provide complementary diagnostic information when assessed in combination.
Serum autoantibodies against intracellular metabolic proteins may arise through several mechanisms, including increased tumor-associated antigen expression, release of intracellular antigens during tumor cell death, and host immune recognition of overexpressed or aberrantly expressed proteins [19,20]. Consistent with this possibility, transcript analysis of TCGA data via UALCAN [35] showed that the mRNA levels of most of the evaluated metabolic genes were higher in EC tissues than in normal esophageal tissues (Supplementary Figure S2). These findings raise the possibility that increased tumor expression of metabolic proteins contributes, at least in part, to the elevated circulating autoantibody levels observed in patients with EC. However, the present study did not directly assess correlations between tumor gene expression and serum autoantibody titers. In addition, circulating autoantibody levels are influenced by multiple factors, including antigen release, antigen processing, and host immune responsiveness. Therefore, the relationship between tumor transcript expression and circulating autoantibody levels should be interpreted cautiously.
Among individual autoantibodies, PCK1-Ab (P = 0.043) and SDHB-Ab (P = 0.035) showed nominal associations with postoperative overall survival in the exploratory analysis (Figure 5).
Exploratory analysis of combined autoantibody profiles also identified differences in overall survival (Figure 6). In particular, high ENO1-Ab/low PGAM1-Ab, high SDHB-Ab/low FH-Ab, high ALDOA-Ab/high TPI1-Ab, and high PCK1-Ab/high SDHB-Ab profiles were associated with longer overall survival. ENO1 is a multifunctional protein that not only catalyzes a late step of glycolysis but also has non-glycolytic functions related to tumor progression, invasion, and immune escape [23]. ENO1 overexpression has been reported in multiple cancers and has been implicated in avoidance of immune destruction and other tumor-promoting processes [23]. Thus, the ENO1-Ab/PGAM1-Ab profile may reflect differences in host immune recognition of tumors with altered glycolytic and ENO1-related functions, although the present study cannot establish a direct mechanistic relationship.
SDHB and FH are sequentially linked to succinate and fumarate metabolism in the TCA cycle. SDH catalyzes the conversion of succinate to fumarate, and both succinate and fumarate have increasingly been recognized as immunometabolites capable of modulating the tumor immune microenvironment [36]. Succinate accumulation can promote immunosuppressive changes, including T-cell dysfunction, while fumarate also exerts immunomodulatory effects [36]. More recently, increased SDHB activity and fumarate production have been linked to T-cell exhaustion in a tumor model, suggesting that the SDHB–fumarate axis may influence antitumor immunity [37]. However, serum SDHB-Ab and FH-Ab levels do not directly represent intratumoral enzyme activity or metabolite concentrations, and the biological basis of the observed antibody combination therefore remains uncertain.
Interestingly, patients with high levels of both PCK1-Ab and SDHB-Ab showed longer overall survival than those with low levels of both antibodies. PCK1 and SDHB are involved in distinct but interconnected aspects of cellular energy metabolism, linking gluconeogenic, mitochondrial, and TCA-cycle-related pathways. The high PCK1-Ab/high SDHB-Ab profile may therefore reflect a coordinated host immune response against metabolic alterations in tumor cells rather than increased activity of the corresponding enzymes themselves. However, the biological basis of this association remains unclear, and this finding should be interpreted as exploratory.
ALDOA and TPI1 participate in closely connected steps of triose-phosphate metabolism. Perturbation of this pathway can alter intracellular dihydroxyacetone phosphate (DHAP) levels and influence cellular senescence and growth arrest. In particular, TPI1 loss has been shown to cause DHAP accumulation and induce a senescence phenotype in cancer cells [38]. Although this observation suggests that altered triose-phosphate metabolism may influence tumor behavior, the present antibody data do not permit inference of intracellular metabolite flux, and the association of the ALDOA-Ab/TPI1-Ab profile with survival should therefore be interpreted as exploratory.
Importantly, circulating autoantibody levels do not necessarily parallel expression or enzymatic activity of the corresponding proteins within tumor cells. Accordingly, these combined antibody profiles may reflect differences in host immune recognition of metabolically altered tumors rather than direct effects of the metabolic enzymes themselves. Given the limited number of events, inclusion of non-cancer-related deaths, data-driven cutoff selection, and evaluation of multiple antibody combinations without adjustment for multiple testing, these findings should be regarded as hypothesis-generating.
A major limitation of the survival analysis is the small number of events. Among the 91 surgically treated patients, 13 deaths occurred during follow-up, including deaths from causes unrelated to esophageal carcinoma. Accordingly, the endpoint reflects all-cause postoperative survival rather than cancer-specific survival. In addition, antibody cutoff values were selected in a data-driven manner using ROC analysis based on binary vital status, which does not account for survival time or censoring. Multiple individual autoantibodies and antibody combinations were also explored without adjustment for multiple testing, increasing the risk of overfitting and type I error. Therefore, the survival findings should be regarded as exploratory and require validation in an independent cohort with a larger number of cancer-related events using time-to-event methods that appropriately account for censoring.
5. Conclusion
Serum autoantibodies against glycolytic and mitochondrial metabolic proteins showed potential diagnostic utility for esophageal carcinoma, and a three-marker model combining ENO1-Ab, PDHB-Ab, and ALDOA-Ab improved diagnostic discrimination compared with individual markers. Exploratory analyses also identified several individual and combined autoantibody profiles associated with postoperative overall survival.
Supplementary Materials
The following supporting information can be downloaded at the website of this paper posted on Preprints.org.
Author Contributions
MI, SY, TH, and HS conceived and designed the present study. SY, TS, YO, MS, and FS ; analyzed the data. TH developed the AlphaLISA™ system. HT, SY, YO, and FS acquired serum ; samples. SYL, BSZ, YY, and TM analyzed patient data and drafted the manuscript. HS and SY ; confirm the authenticity of all the raw data. All authors read and approved the final manuscript.
Funding
This work was supported by the Project for Cancer Research and Therapeutic Evolution from the Japan Agency for Medical Research and Development, AMED (grant no. 21cm0106403h0006), research grants from the Japan Science and Technology Agency (JST Exploratory Research; grant no. 14657335) and Grants-in-Aid for Scientific Research from the Japan Society for the Promotion of Science (grant nos. 15K10117, 16K10520, 21K08695, 20K16396, 20K17953 and 22K07273).
Institutional Review Board Statement
The study protocol was approved by the Ethics Committee of Toho University, Graduate School of Medicine (approval no. T2024-2081, Ota-ku, Tokyo, Japan) and Port Square Kashiwado Clinic, Kashiwado Memorial Foundation (approval no. 2012-001). All participants provided written informed consent before enrollment. The study was registered in the UMIN Clinical Trials Registry (UMIN000014530; registration date: July 11, 2014) and was conducted in accordance with the Declaration of Helsinki and the Japanese Ethical Guidelines for Clinical Research.
Acknowledgments
We thank all patients and healthy donors who participated in this study. We are grateful to Seiko Otsuka for assistance with sample collection and data.
Conflicts of Interest
The authors declare no competing interests.
References
- Rustgi, A.K.; El-Serag, H.B. Esophageal carcinoma. N. Engl. J. Med. 2014, 371, 2499–2509. [Google Scholar] [CrossRef] [PubMed]
- Yang, H.; Wang, F.; Hallemeier, C.L.; Lerut, T.; Fu, J. Oesophageal cancer. Lancet 2024, 404(10466), 1991–2005. [Google Scholar] [CrossRef] [PubMed]
- Ito, M.; Hiwasa, T.; Oshima, Y.; Yajima, S.; Suzuki, T.; Nanami, T.; Sumazaki, M.; Shiratori, F.; Funahashi, K.; Li, S.Y.; Iwadate, Y.; Yamagata, H.; Jambaljav, B.; Takemoto, M.; Yokote, K.; Takizawa, H.; Shimada, H. Association of Serum Anti-PCSK9 Antibody Levels with Favorable Postoperative Prognosis in Esophageal Cancer. Front Oncol. 2021, 11, 708039. [Google Scholar] [CrossRef] [PubMed]
- Ito, M.; Hiwasa, T.; Oshima, Y.; Yajima, S.; Suzuki, T.; Nanami, T.; Sumazaki, M.; Shiratori, F.; Funahashi, K.; Takizawa, H.; Kashiwado, K.; Tochigi, N.; Shimada, H. Identification of serum anti-striatin 4 antibodies as a common marker for esophageal cancer and other solid cancers. Mol. Clin. Oncol. Epub. 2021, 15(5), 237. [Google Scholar] [CrossRef] [PubMed]
- Ito, M.; Hiwasa, T.; Yajima, S.; Suzuki, T.; Oshima, Y.; Nanami, T.; Sumazaki, M.; Shiratori, F.; Li, S.Y.; Iwadate, Y.; Sugimoto, K.; Mori, M.; Kuwabara, S.; Takizawa, H.; Shimada, H. Low anti-CFL1 antibody with high anti-ACTB antibody is a poor prognostic factor in esophageal squamous cell carcinoma. Esophagus Epub. 2022, 19(4), 617–625. [Google Scholar] [CrossRef] [PubMed]
- Ito, M.; Yajima, S.; Suzuki, T.; Oshima, Y.; Nanami, T.; Sumazaki, M.; Shiratori, F.; Wang, H.; Hu, L.; Takizawa, H.; Li, S.Y.; Iwadate, Y.; Hiwasa, T.; Shimada, H. The combination of positive anti-WDR1 antibodies with negative anti-CFL1 antibodies in serum is a poor prognostic factor for patients with esophageal carcinoma. Med. Int. (Lond) 2023, 3(2), 11. [Google Scholar] [CrossRef] [PubMed]
- Ito, M.; Yajima, S.; Suzuki, T.; Oshima, Y.; Nanami, T.; Sumazaki, M.; Shiratori, F.; Takizawa, H.; Li, S.Y.; Zhang, B.S.; Yoshida, Y.; Matsutani, T.; Hiwasa, T.; Shimada, H. Combination of high anti-SKI and low anti-TMED5 antibody levels is preferable prognostic factor in esophageal carcinoma. Cancer Sci. 2024, 115(7), 2209–2219. [Google Scholar] [CrossRef] [PubMed]
- Nakashima, K.; Shimada, H.; Ochiai, T.; Kuboshima, M.; Kuroiwa, N.; Okazumi, S.; et al. Serological identification of TROP2 by recombinant cDNA expression cloning using sera of patients with esophageal squamous cell carcinoma. Int. J. Cancer 2004, 112, 1029–35. [Google Scholar] [CrossRef] [PubMed]
- Kuboshima, M.; Shimada, H.; Liu, T.; Nakashima, K.; Nomura, F.; Takiguchi, M.; et al. Identification of a novel SEREX antigen, SLC2A1/GLUT1, in esophageal squamous cell carcinoma. Int. J. Oncol. 2006, 28, 463–8. [Google Scholar] [CrossRef]
- Yajima, S.; Ito, M.; Suzuki, T.; Oshima, Y.; Sumazaki, M.; Shiratori, F.; Takizawa, H.; Li, S.Y.; Zhang, B.S.; Yoshida, Y.; Matsutani, T.; Hiwasa, T.; Shimada, H. Application of serum anti-ENO1 and anti-SSNA1 antibody biomarkers in predicting the prognosis of gastric cancer. Oncol. Lett. 2025, 30(1), 360. [Google Scholar] [CrossRef] [PubMed]
- Hiwasa, T.; Yoshida, Y.; Kubota, M.; Li, S.Y.; Zhang, B.S.; Matsutani, T.; Mine, S.; Machida, T.; Ito, M.; Yajima, S.; Shirouzu, M.; Yokoyama, S.; Sata, M.; Yamagishi, K.; Iso, H.; Sawada, N.; Tsugane, S.; Takemoto, M.; Hayashi, A.; Yokote, K.; Kobayashi, Y.; Matsushita, K.; Tatsumi, K.; Takizawa, H.; Tomiyoshi, G.; Shimada, H.; Higuchi, Y. Serum anti-KIAA0513 antibody as a common biomarker for mortal atherosclerotic and cancerous diseases. Med. Int. (Lond) 2024, 4(5), 45. [Google Scholar] [CrossRef] [PubMed]
- Sasajima, N.; Sumazaki, M.; Oshima, Y.; Ito, M.; Yajima, S.; Takizawa, H.; Wang, H.; Li, S.Y.; Zhang, B.S.; Yoshida, Y.; Hiwasa, T.; Shimada, H. Stage-Specific Alteration and Prognostic Relationship of Serum Fumarate Hydratase Autoantibodies in Gastric Cancer. Int. J. Mol. Sci. 2024, 25(10), 5470. [Google Scholar] [CrossRef] [PubMed]
- Zhang, B.S.; Zhang, X.M.; Ito, M.; Yajima, S.; Yoshida, K.; Ohno, M.; Nishi, E.; Wang, H.; Li, S.Y.; Kubota, M.; Yoshida, Y.; Matsutani, T.; Mine, S.; Machida, T.; Takemoto, M.; Yamagata, H.; Hayashi, A.; Yokote, K.; Kobayashi, Y.; Takizawa, H.; Kuroda, H.; Shimada, H.; Iwadate, Y.; Hiwasa, T. JMJD6 Autoantibodies as a Potential Biomarker for Inflammation-Related Diseases. Int. J. Mol. Sci. 2024, 25(9), 4935. [Google Scholar] [CrossRef] [PubMed]
- Sumazaki, M.; Yajima, S.; Ito, M.; Suzuki, T.; Oshima, Y.; Shiratori, F.; Takizawa, H.; Li, S.Y.; Zhang, B.S.; Yoshida, Y.; Matsutani, T.; Hiwasa, T.; Shimada, H. Serum anti-POTEE antibodies as a novel serological biomarker for early detection and prognostic stratification in gastrointestinal cancers. BMC Cancer 2026. [Google Scholar] [CrossRef]
- Warburg, O. On the origin of cancer cells. Science 1956, 123, 309–314. [Google Scholar] [CrossRef] [PubMed]
- Barba, I.; Carrillo-Bosch, L.; Seoane, J. Targeting the Warburg Effect in Cancer: Where Do We Stand? Int. J. Mol. Sci. 2024, 25(6), 3142. [Google Scholar] [CrossRef] [PubMed]
- Justus, C.R.; Sanderlin, E.J.; Yang, L.V. Molecular Connections between Cancer Cell Metabolism and the Tumor Microenvironment. Int. J. Mol. Sci. 2015, 16(5), 11055–86. [Google Scholar] [CrossRef] [PubMed]
- Vazquez, A.; Kamphorst, J.J.; Markert, E.K.; Schug, Z.T.; Tardito, S.; Gottlieb, E. Cancer metabolism at a glance. J. Cell Sci. 2016, 129, 3367–3373. [Google Scholar] [CrossRef] [PubMed]
- Järås, K.; Anderson, K. Autoantibodies in cancer: prognostic biomarkers and immune activation. Expert Rev. Proteom. 2011, 8(5), 577–89. [Google Scholar] [CrossRef] [PubMed]
- Nolen, B.M.; Lokshin, A.E. Autoantibodies for cancer detection: still cause for excitement? Cancer Biomark. 2010, 6(5-6), 229–45. [Google Scholar] [CrossRef] [PubMed]
- Pająk, B.; Zieliński, R.; Priebe, W. The Impact of Glycolysis and Its Inhibitors on the Immune Response to Inflammation and Autoimmunity. Molecules 2024, 29(6), 1298. [Google Scholar] [CrossRef] [PubMed]
- Gill, K.S.; Fernandes, P.; O’Donovan, T.R.; McKenna, S.L.; Doddakula, K.K.; Power, D.G.; Soden, D.M.; Forde, P.F. Glycolysis inhibition as a cancer treatment and its role in an anti-tumour immune response. Biochim Biophys. Acta Epub. 2016, 1866(1), 87–105. [Google Scholar] [CrossRef] [PubMed]
- Huang, C.K.; Sun, Y.; Lv, L.; Ping, Y. ENO1 and Cancer. Mol. Ther. Oncolytics 2022, 24, 288–298. [Google Scholar] [CrossRef] [PubMed]
- Cappello, P.; Principe, M.; Bulfamante, S.; Novelli, F. Alpha-Enolase (ENO1), a potential target in novel immunotherapies. Front Biosci. (Landmark Ed) 2017, 22(5), 944–959. [Google Scholar] [CrossRef] [PubMed]
- Wang, H.; Lu, H.; Zhang, X.M.; Goto, K.I.; Kobayashi, E.; Yoshida, Y.; Adachi, A.; Matsutani, T.; Iwadate, Y.; Mine, S.; Machida, T.; Sata, M.; Yamagishi, K.; Iso, H.; Sawada, N.; Tsugane, S.; Kamitsukasa, I.; Wada, T.; Aotsuka, A.; Sugimoto, K.; Takizawa, H.; Kashiwado, K.; Shin, H.; Tomiyoshi, G.; Nakamura, R.; Shinmen, N.; Kuroda, H.; Xu, A.; Hiwasa, T. Association of serum levels of antibodies against ALDOA and FH4 with transient ischemic attack and cerebral infarction. BMC Neurol. 2021, 21(1), 274. [Google Scholar] [CrossRef] [PubMed]
- Namiki, T.; Takemoto, M.; Hayashi, A.; Yamagata, H.; Ishikawa, T.; Yokote, K.; Li, S.Y.; Kubota, M.; Zhang, B.S.; Yoshida, Y.; Matsutani, T.; Mine, S.; Machida, T.; Kobayashi, Y.; Terada, J.; Naito, A.; Tatsumi, K.; Takizawa, H.; Nakamura, R.; Kuroda, H.; Iwadate, Y.; Hiwasa, T. Serum anti-PCK1 antibody levels are a prognostic factor for patients with diabetes mellitus. BMC Endocr. Disord. 2023, 23(1), 239. [Google Scholar] [CrossRef] [PubMed]
- Wang, H.; Zhang, X.M.; Tomiyoshi, G.; Nakamura, R.; Shinmen, N.; Kuroda, H.; Kimura, R.; Mine, S.; Kamitsukasa, I.; Wada, T.; et al. Association of serum levels of antibodies against MMP1, CBX1, and CBX5 with transient ischemic attack and cerebral infarction. Oncotarget 2017, 9, 5600–5613. [Google Scholar] [CrossRef] [PubMed]
- Yoshida, Y.; Zhang, X.M.; Wang, H.; Machida, T.; Mine, S.; Kobayashi, E.; Adachi, A.; Matsutani, T.; Kamitsukasa, I.; Wada, T.; et al. Elevated levels of autoantibodies against DNAJC2 in sera of patients with atherosclerotic diseases. Heliyon 2020, 6, e04661. [Google Scholar] [CrossRef] [PubMed]
- Hiwasa, T.; Wang, H.; Goto, K.I.; Mine, S.; Machida, T.; Kobayashi, E.; Yoshida, Y.; Adachi, A.; Matsutani, T.; Sata, M.; et al. Serum anti-DIDO1, anti-CPSF2, and anti-FOXJ2 antibodies as predictive risk markers for acute ischemic stroke. BMC Med. 2021, 19, 131. [Google Scholar] [CrossRef] [PubMed]
- Sumazaki, M.; Shimada, H.; Ito, M.; Shiratori, F.; Kobayashi, E.; Yoshida, Y.; Adachi, A.; Matsutani, T.; Iwadate, Y.; Mine, S.; et al. Serum anti-LRPAP1 is a common biomarker for digestive organ cancers and atherosclerotic diseases. Cancer Sci. 2020, 111, 4453–4464. [Google Scholar] [CrossRef] [PubMed]
- Beaudet, L.; Rodriguez-Suarez, R.; Venne, M.H.; et al. AlphaLISA immunoassays: the no-wash alternative to ELISAs for research and drug discovery. Nat. Methods 2008, 5, an8–an9. [Google Scholar] [CrossRef]
- Shimada, H.; Takeda, A.; Arima, M.; Okazumi, S.; Matsubara, H.; Nabeya, Y.; Funami, Y.; Hayashi, H.; Gunji, Y.; Suzuki, T.; Kobayashi, S.; Ochiai, T. Serum p53 antibody is a useful tumor marker in superficial esophageal squamous cell carcinoma. Cancer 2000, 89(8), 1677–83. [Google Scholar] [CrossRef] [PubMed]
- Suzuki, T.; Yajima, S.; Okamura, A.; Yoshida, N.; Taniyama, Y.; Murakami, K.; Ohkura, Y.; Nakajima, Y.; Yagi, K.; Fukuda, T.; Ogawa, R.; Hoshino, I.; Kunisaki, C.; Narumiya, K.; Tsubosa, Y.; Yamada, K.; Shimada, H. Prognostic Impact of Serum SCC Antigen in the 566 Upfront Surgery Group of Esophageal Squamous Cell Carcinoma: A Multi-Institutional Study of the Japan Esophageal Society. Ann. Thorac. Cardiovasc Surg. 2024, 30(1), 24–00028. [Google Scholar] [CrossRef] [PubMed]
- Kanda, Y. Investigation of the freely available easy-to-use software ‘EZR’ for medical statistics. Bone Marrow Transplant. 2013, 48(3), 452–8. [Google Scholar] [CrossRef] [PubMed]
- Chandrashekar, D.S.; Bashel, B.; Balasubramanya, S.A.H.; Creighton, C.J.; Ponce-Rodriguez, I.; Chakravarthi, B.V.S.K.; Varambally, S. UALCAN: A Portal for Facilitating Tumor Subgroup Gene Expression and Survival Analyses. Neoplasia 2017, 19(8), 649–658. [Google Scholar] [CrossRef] [PubMed]
- Pfefer, T.; Bessenyei, A.H.; O’Neill, L.A. Immunometabolites and cancer: the role of 2-hydroxyglutarate, succinate, fumarate and itaconate in tumour development and anti-tumour immunity. Immunol. Lett. 2026, 279, 107153. [Google Scholar] [CrossRef] [PubMed]
- Huang, F.; Li, C.; Chen, Y.; et al. Succinate dehydrogenase B palmitoylation promotes T cell exhaustion through the H3K27ac-PD1 axis in pancreatic cancer. Cancer Lett. 2026, 642, 218277. [Google Scholar] [CrossRef] [PubMed]
- Liu, C.; Wu, S.; Wang, C.; Zhou, Z.; Cai, T.; Tao, W.; Zuo, S.; Zhang, C.; Dong, Y.; Feng, Y.; Huang, Q.; Wang, B.; Ma, X.; Ma, H.; Zhang, X.; Huang, Y. TPI1 Loss Triggers a Metabolite-Driven Mitochondrial Redox Vulnerability via the SARM1-cADPR-Ca2+ Axis. Adv. Sci. (Weinh) Epub ahead of print. 2026, e76614. [Google Scholar] [CrossRef] [PubMed] [PubMed Central]
Figure 3.
Comparison of autoantibody levels according to postoperative vital status in patients with esophageal carcinoma.Pretreatment serum autoantibody levels were compared between patients who were alive and those who had died during follow-up after surgery. Data are presented as box-and-whisker plots. Boxes indicate the 25th, 50th, and 75th percentiles, and the whiskers indicate the 90th percentile range. Differences between the groups were assessed using the Mann–Whitney U test, with P < 0.05 considered statistically significant. No significant differences were observed for any of the 18 autoantibodies. Alive, patients alive at the last follow-up; dead, patients who died during follow-up. A, ASPSCR1-Ab; B, SLC2A1-Ab; C, GK2-Ab; D, ALDOA-Ab; E, TPI1-Ab; F, GAPDH-Ab; G, PGK1-Ab; H, PGK2-Ab; I, PGAM1-Ab; J, ENO1-Ab; K, PKM-Ab; L, PDHB-Ab; M, PCK1-Ab; N, LDHA-Ab; O, SDHB-Ab; P, FH-Ab; Q, IDH-Ab; and R, ATP5B-Ab.
Figure 3.
Comparison of autoantibody levels according to postoperative vital status in patients with esophageal carcinoma.Pretreatment serum autoantibody levels were compared between patients who were alive and those who had died during follow-up after surgery. Data are presented as box-and-whisker plots. Boxes indicate the 25th, 50th, and 75th percentiles, and the whiskers indicate the 90th percentile range. Differences between the groups were assessed using the Mann–Whitney U test, with P < 0.05 considered statistically significant. No significant differences were observed for any of the 18 autoantibodies. Alive, patients alive at the last follow-up; dead, patients who died during follow-up. A, ASPSCR1-Ab; B, SLC2A1-Ab; C, GK2-Ab; D, ALDOA-Ab; E, TPI1-Ab; F, GAPDH-Ab; G, PGK1-Ab; H, PGK2-Ab; I, PGAM1-Ab; J, ENO1-Ab; K, PKM-Ab; L, PDHB-Ab; M, PCK1-Ab; N, LDHA-Ab; O, SDHB-Ab; P, FH-Ab; Q, IDH-Ab; and R, ATP5B-Ab.
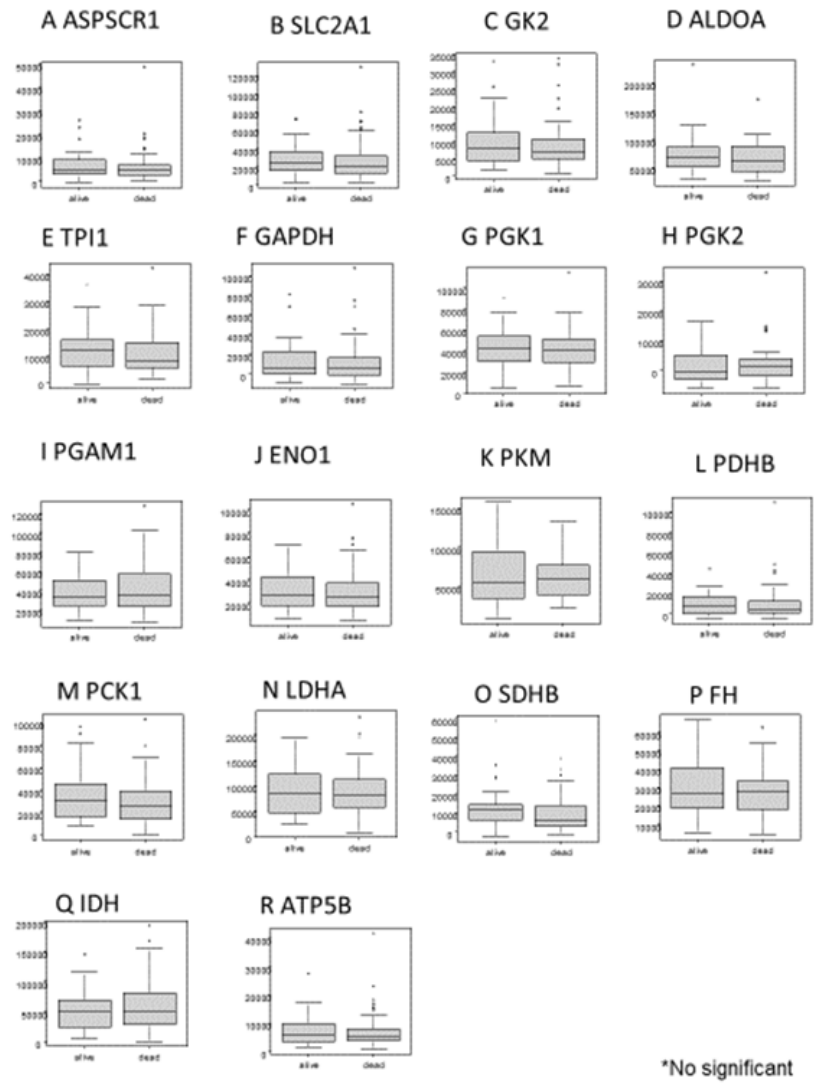
Figure 4.
Comparison of serum autoantibody levels according to pathological stage in patients with esophageal carcinoma.Pretreatment serum autoantibody levels were compared across pathological stages 0 to IVa, classified according to the Japan Esophageal Society criteria. Data are presented as box-and-whisker plots. Boxes indicate the 25th, 50th, and 75th percentiles, and whiskers indicate the range shown in each plot. Differences among stages were assessed using the Kruskal–Wallis test. No statistically significant differences were observed for any of the 18 autoantibodies. A, ASPSCR1-Ab; B, SLC2A1-Ab; C, GK2-Ab; D, ALDOA-Ab; E, TPI1-Ab; F, GAPDH-Ab; G, PGK1-Ab; H, PGK2-Ab; I, PGAM1-Ab; J, ENO1-Ab; K, PKM-Ab; L, PDHB-Ab; M, PCK1-Ab; N, LDHA-Ab; O, SDHB-Ab; P, FH-Ab; Q, IDH-Ab; and R, ATP5B-Ab.
Figure 4.
Comparison of serum autoantibody levels according to pathological stage in patients with esophageal carcinoma.Pretreatment serum autoantibody levels were compared across pathological stages 0 to IVa, classified according to the Japan Esophageal Society criteria. Data are presented as box-and-whisker plots. Boxes indicate the 25th, 50th, and 75th percentiles, and whiskers indicate the range shown in each plot. Differences among stages were assessed using the Kruskal–Wallis test. No statistically significant differences were observed for any of the 18 autoantibodies. A, ASPSCR1-Ab; B, SLC2A1-Ab; C, GK2-Ab; D, ALDOA-Ab; E, TPI1-Ab; F, GAPDH-Ab; G, PGK1-Ab; H, PGK2-Ab; I, PGAM1-Ab; J, ENO1-Ab; K, PKM-Ab; L, PDHB-Ab; M, PCK1-Ab; N, LDHA-Ab; O, SDHB-Ab; P, FH-Ab; Q, IDH-Ab; and R, ATP5B-Ab.
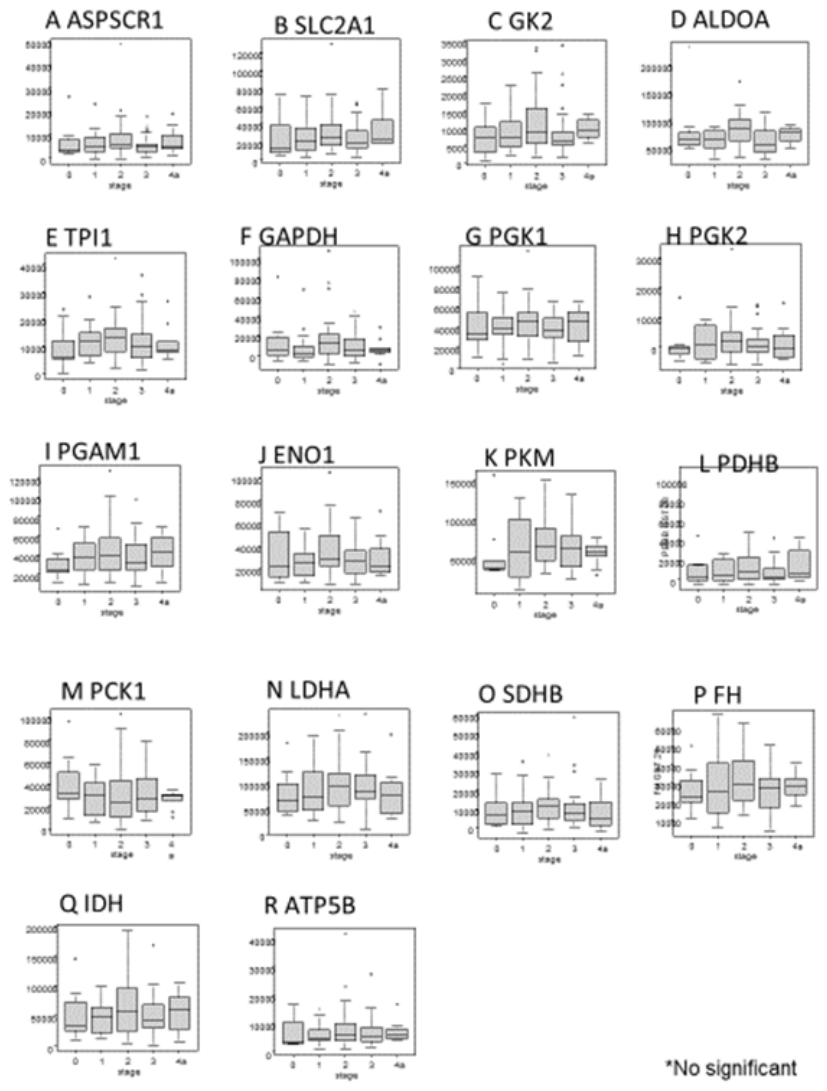
Figure 6.
Exploratory Kaplan–Meier overall survival curves based on combined autoantibody profiles.Overall survival was compared among selected autoantibody-profile groups in surgically treated patients with esophageal carcinoma. Each autoantibody was dichotomized into high- and low-level groups using cutoff values derived from ROC analysis of vital status. Kaplan–Meier curves are shown for (A) high ALDOA-Ab/high TPI1-Ab versus low ALDOA-Ab/low TPI1-Ab, (B) high ENO1-Ab/low PGAM1-Ab versus low ENO1-Ab/high PGAM1-Ab, (C) high SDHB-Ab/low FH-Ab versus low SDHB-Ab/high FH-Ab, and (D) high PCK1-Ab/high SDHB-Ab versus low PCK1-Ab/low SDHB-Ab. The horizontal axis indicates months after surgery, and the vertical axis indicates overall survival probability. Differences between groups were assessed using the log-rank test.
Figure 6.
Exploratory Kaplan–Meier overall survival curves based on combined autoantibody profiles.Overall survival was compared among selected autoantibody-profile groups in surgically treated patients with esophageal carcinoma. Each autoantibody was dichotomized into high- and low-level groups using cutoff values derived from ROC analysis of vital status. Kaplan–Meier curves are shown for (A) high ALDOA-Ab/high TPI1-Ab versus low ALDOA-Ab/low TPI1-Ab, (B) high ENO1-Ab/low PGAM1-Ab versus low ENO1-Ab/high PGAM1-Ab, (C) high SDHB-Ab/low FH-Ab versus low SDHB-Ab/high FH-Ab, and (D) high PCK1-Ab/high SDHB-Ab versus low PCK1-Ab/low SDHB-Ab. The horizontal axis indicates months after surgery, and the vertical axis indicates overall survival probability. Differences between groups were assessed using the log-rank test.
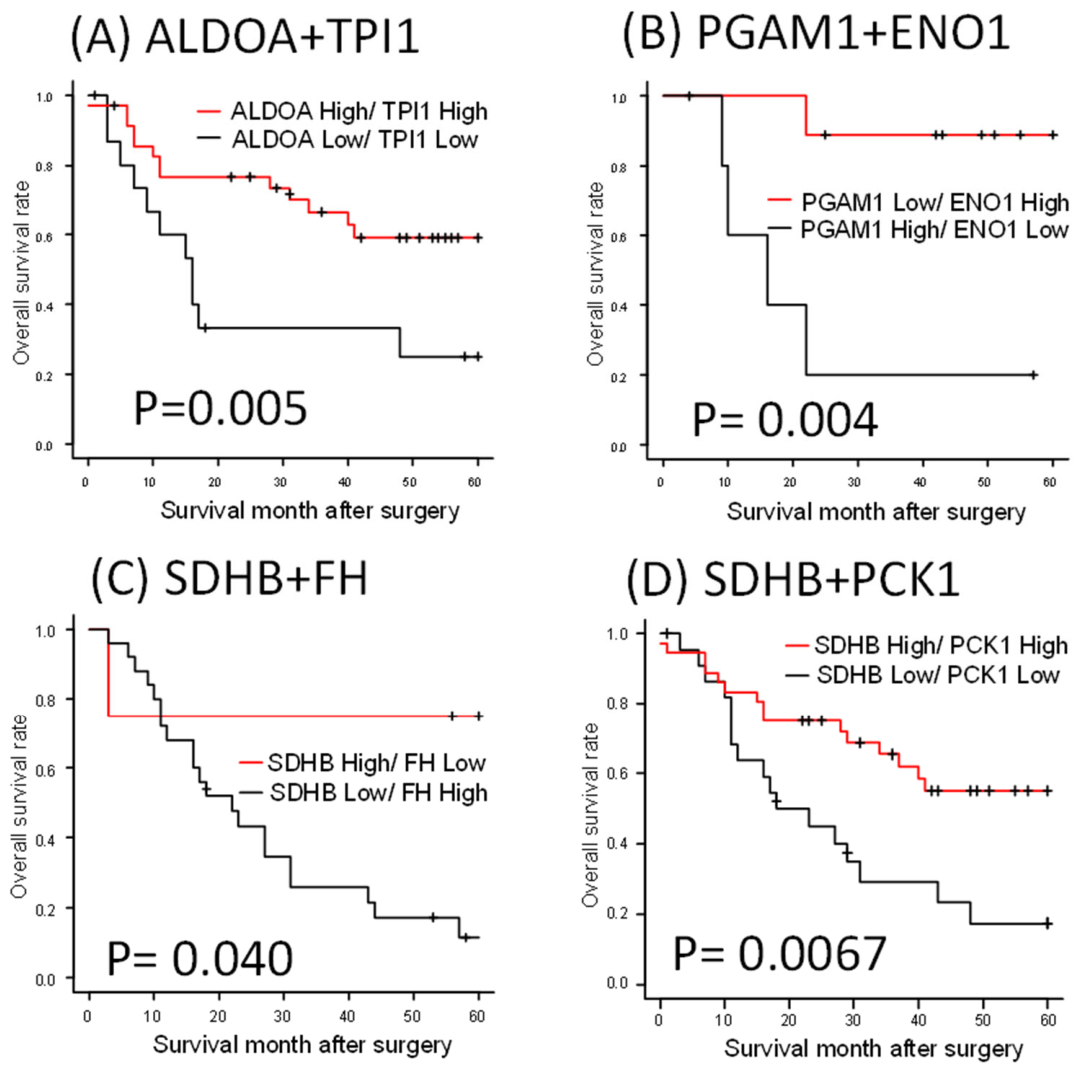

Table 1.
ROC curve analysis of individual autoantibodies for discriminating patients with esophageal carcinoma from healthy donors.
Table 1.
ROC curve analysis of individual autoantibodies for discriminating patients with esophageal carcinoma from healthy donors.
| ASPSCR1 | SLC2A1 | GK2 | ALDOA | TPI1 | GAPDH | PGK1 | PGK2 | PGAM1 | |
|---|---|---|---|---|---|---|---|---|---|
| AUC | 0.639 | 0.685 | 0.62 | 0.686 | 0.63 | 0.677 | 0.663 | 0.625 | 0.656 |
| 95% CI | 0.561–0.718 | 0.609–0.761 | 0.540-0.700 | 0.622-0.750 | 0.564-0.696 | 0.614-0.741 | 0.599-0.726 | 0.545-0.705 | 0.593-0.720 |
| cutoff value | >7856 | >16594 | >5958 | >53320 | >11358 | >4094 | >40885 | >-941 | >39866 |
| sensitivity (%) | 26.6 | 68.1 | 66 | 64.1 | 40.1 | 59.9 | 47.4 | 66 | 42.2 |
| specificity (%) | 94.7 | 58.5 | 56.4 | 64.6 | 80.2 | 68.8 | 82.3 | 56.4 | 82.3 |
| ENO1 | PKM | PDHB | PCK1 | LDHA | SDHB | FH | IDH | ATP5B | |
| AUC | 0.735 | 0.676 | 0.698 | 0.63 | 0.688 | 0.593 | 0.604 | 0.684 | 0.66 |
| 95% CI | 0.676-0.793 | 0.610-0.743 | 0.623-0.774 | 0.564-0.696 | 0.612-0.763 | 0.512–0.675 | 0.536-0.673 | 0.609-0.759 | 0.581–0.74 |
| cutoff value | >22237 | >44088 | >7380 | >23074 | >88051 | >11335 | >24431 | >54538 | >4770 |
| sensitivity (%) | 62.5 | 74.5 | 43.6 | 62.5 | 45.8 | 40 | 53.6 | 44.8 | 60.6 |
| specificity (%) | 76.8 | 56.2 | 92.6 | 58.3 | 86.5 | 83 | 65.6 | 85.4 | 68.1 |
| AUC, area under the receiver operating characteristic curve; CI, confidence interval. Cutoff values were determined using the Youden index. Sensitivity and specificity were calculated at the corresponding optimal cutoff values. | |||||||||
Table 2.
Diagnostic performance of individual autoantibodies and the three-autoantibody model in the complete-case cohort.
Table 2.
Diagnostic performance of individual autoantibodies and the three-autoantibody model in the complete-case cohort.
| Marker / model | Cutoff | Sensitivity, % (95% CI) | Specificity, % (95% CI) | PPV, % (95% CI) | NPV, % (95% CI) | AUC (95% CI) | P vs 3-marker |
|---|---|---|---|---|---|---|---|
| ENO1-Ab | 22,304.50 | 62.8 (52.7-71.9) | 76.3 (66.8-83.8) | 72.8 (62.3-81.3) | 67.0 (57.6-75.2) | 0.723 (0.650-0.796) | 0.00242 |
| PDHB-Ab | 7,289.50 | 43.6 (34.0-53.7) | 92.5 (85.3-96.3) | 85.4 (72.8-92.8) | 61.9 (53.6-69.5) | 0.697 (0.621-0.773) | 0.000326 |
| ALDOA-Ab | 60,678 | 56.4 (46.3-66.0) | 76.3 (66.8-83.8) | 70.7 (59.6-79.8) | 63.4 (54.2-71.7) | 0.717 (0.644-0.790) | 0.00194 |
| SLC2A1-Ab | 31,489.50 | 35.1 (26.2-45.2) | 92.5 (85.3-96.3) | 82.5 (68.1-91.3) | 58.5 (50.4-66.2) | 0.684 (0.608-0.760) | 0.000152 |
| ENO1 + PDHB + ALDOA | 0.533 | 68.1 (58.1-76.6) | 83.9 (75.1-90.0) | 81.0 (71.0-88.1) | 72.2 (63.1-79.8) | 0.812 (0.751-0.873) | Reference |
| Values for individual markers in this table were recalculated using the same complete-case cohort as the three-marker model; therefore, they differ slightly from those shown in Table 1, which were based on all available samples for each marker. | |||||||
Table 3.
Clinicopathological associations of individual autoantibodies assessed using Fisher’s exact test.
Table 3.
Clinicopathological associations of individual autoantibodies assessed using Fisher’s exact test.
| Variables | ASPSCR1 | SLC2A1 | GK2 | ALDOA P value | TPI1 | GAPDH | PGK1 | PGK2 | PGAM1 | ENO1 | PKM | PDHB | PCK1 | LDHA | SDHB | FH | IDH | ATP5B | |
|---|---|---|---|---|---|---|---|---|---|---|---|---|---|---|---|---|---|---|---|
| p value | p value | P value | P value | P value | P value | p value | P value | P value | P value | P value | P value | p value | p value | P value | p value | p value | |||
| Sex | Male | 0.31 | >0.999 | 0.253 | 0.776 | 0.32 | 0.625 | 0.188 | 0.45 | 0.755 | 0.154 | 0.199 | 0.305 | 0.208 | 0.609 | >0.999 | 0.324 | 0.102 | >0.999 |
| Female | |||||||||||||||||||
| Age | >65 | >0.999 | 0.829 | >0.999 | 0.811 | >0.999 | 0.671 | 0.655 | 0.388 | 0.439 | 0.473 | 0.51 | 0.384 | 0.669 | >0.999 | >0.999 | 0.045 | 0.652 | 0.256 |
| ≤65 | |||||||||||||||||||
| Location | Upper | >0.999 | 0.383 | 0.738 | >0.999 | 0.157 | >0.999 | 0.535 | 0.401 | >0.999 | 0.505 | 0.763 | 0.37 | 0.572 | 0.566 | 0.555 | >0.999 | 0.763 | 0.764 |
| Lower | |||||||||||||||||||
| Tumor depth | T1 | 0.644 | 0.365 | 0.801 | 0.304 | 0.266 | 0.661 | 0.634 | 0.363 | 0.162 | 0.608 | 0.034 | 0.489 | 0.364 | 0.651 | 0.647 | 0.07 | 0.337 | 0.475 |
| T2-T4 | |||||||||||||||||||
| Tumor depth | T1-T2 | 0.512 | 0.388 | 0.811 | 0.141 | 0.831 | >0.999 | 0.495 | 0.83 | 0.596 | 0.328 | 0.043 | 0.508 | 0.131 | 0.831 | >0.999 | 0.389 | 0.493 | 0.502 |
| T3-T4 | |||||||||||||||||||
| Lymph node metastasis | N0 | >0.999 | 0.669 | 0.148 | 0.629 | 0.678 | >0.999 | 0.658 | >0.999 | 0.429 | 0.031 | 0.278 | 0.2 | 0.834 | 0.288 | 0.831 | 0.26 | 0.822 | 0.378 |
| N1 | |||||||||||||||||||
| WBC (/μl) | >8000 | 0.51 | 0.314 | >0.999 | 0.137 | 0.537 | 0.525 | 0.098 | >0.999 | 0.686 | 0.723 | 0.508 | 0.513 | >0.999 | 0.345 | 0.514 | >0.999 | >0.999 | >0.999 |
| ≤8000 | |||||||||||||||||||
| Neutrophil (%) | >70 | 0.788 | 0.062 | 0.378 | 0.076 | 0.798 | 0.125 | 0.165 | 0.193 | 0.343 | 0.772 | 0.792 | 0.105 | 0.436 | 0.433 | 0.6 | >0.999 | 0.593 | 0.589 |
| ≤70 | |||||||||||||||||||
| Lymphocyte (%) | >35 | >0.999 | >0.999 | 0.765 | 0.061 | 0.789 | 0.18 | 0.567 | 0.175 | 0.094 | 0.355 | 0.583 | 0.597 | 0.281 | 0.415 | >0.999 | 0.287 | 0.779 | >0.999 |
| ≤35 | |||||||||||||||||||
| Hemoglobin (g/dl) | >12 | 0.644 | 0.651 | 0.205 | 0.305 | 0.504 | 0.127 | >0.999 | >0.999 | >0.999 | >0.999 | >0.999 | 0.248 | 0.822 | 0.823 | 0.82 | 0.24 | 0.814 | 0.812 |
| ≤12 | |||||||||||||||||||
| CRP (mg/dl) | >0.3 | 0.239 | 0.49 | 0.604 | 0.801 | 0.502 | 0.659 | >0.999 | >0.999 | >0.999 | 0.606 | >0.999 | 0.638 | >0.999 | >0.999 | 0.249 | 0.133 | 0.225 | 0.473 |
| ≤0.3 | |||||||||||||||||||
| Albumin (g/dl) | >3.5 | 0.456 | >0.999 | >0.999 | 0.582 | 0.813 | 0.636 | 0.608 | >0.999 | 0.224 | 0.098 | >0.999 | 0.803 | 0.631 | 0.626 | 0.625 | 0.752 | 0.445 | 0.206 |
| ≤3.5 | |||||||||||||||||||
| LDH (U/l) | >230 | >0.999 | >0.999 | >0.999 | 0.539 | 0.583 | 0.274 | 0.768 | >0.999 | 0.297 | 0.539 | 0.248 | 0.775 | 0.407 | >0.999 | 0.785 | 0.456 | 0.769 | 0.776 |
| ≤230 | |||||||||||||||||||
| HbA1c (JDS) (%) | ≥6.1 | >0.999 | 0.432 | >0.999 | >0.999 | 0.458 | 0.433 | 0.09 | 0.709 | 0.337 | 0.67 | 0.227 | 0.393 | 0.443 | 0.693 | 0.117 | 0.071 | 0.428 | 0.412 |
| <6.1 | |||||||||||||||||||
| SCC-Ag (ng/ml) | >1.5 | >0.999 | 0.177 | 0.125 | 0.608 | >0.999 | 0.51 | 0.478 | 0.364 | 0.564 | 0.44 | 0.035 | 0.247 | >0.999 | >0.999 | 0.822 | 0.074 | 0.146 | >0.999 |
| ≤1.5 | |||||||||||||||||||
| p53-Abs (U/ml) | >1.30 | 0.78 | 0.586 | 0.757 | 0.755 | 0.589 | 0.595 | 0.566 | 0.581 | >0.999 | 0.543 | >0.999 | 0.405 | 0.185 | 0.278 | 0.587 | >0.999 | 0.406 | >0.999 |
| ≤1.30 | |||||||||||||||||||
| N0, no lymph node metastasis; N1, lymph node metastasis present. Tumors located proximal to the tracheal bifurcation were defined as “upper,” whereas those located distal to the tracheal bifurcation were defined as “lower.” WBC, white blood cell count; CRP, C-reactive protein; LDH, lactate dehydrogenase; SCC-Ag, squamous cell carcinoma antigen; Abs, antibodies. | |||||||||||||||||||
Disclaimer/Publisher’s Note: The statements, opinions and data contained in all publications are solely those of the individual author(s) and contributor(s) and not of MDPI and/or the editor(s). MDPI and/or the editor(s) disclaim responsibility for any injury to people or property resulting from any ideas, methods, instructions or products referred to in the content. |
© 2026 by the authors. Licensee MDPI, Basel, Switzerland. This article is an open access article distributed under the terms and conditions of the Creative Commons Attribution (CC BY) license (http://creativecommons.org/licenses/by/4.0/).
Copyright: This open access article is published under a Creative Commons CC BY 4.0 license, which permit the free download, distribution, and reuse, provided that the author and preprint are cited in any reuse.