

Submitted:
27 October 2026
Posted:
29 October 2026
You are already at the latest version
Abstract
Introduction: Whether maternal and neonatal mortality decline in lockstep determines where obstetric and newborn programmes should co-invest, yet global estimates report them separately. We paired maternal and neonatal causes along a priori care pathways in the Global Burden of Disease Study 2023 (GBD 2023) to test whether they share causes, places and margins.Methods: We develop a dyad synchrony index (DSI) for cause-paired co-movement, analysing deaths from 10 maternal causes (females aged 10–54; six key years) and five neonatal causes (ages 0–27 days), 1990–2023, across 21 GBD regions and five SDI quintiles (n=26 locations, the primary analysis), plus a post-hoc inequality extension over a purpose-built 204-country GBD 2023 extraction (1990, 2023). Three pathway pairs were pre-registered (maternal sepsis×neonatal sepsis; obstructed labour×birth asphyxia; hypertensive disorders×preterm birth). Synchrony used Spearman concordance; declines were decomposed into exposure and fatality margins, and best-frontier avoidable deaths computed.Results: Maternal deaths fell from 422,924 (1990) to 239,929 (166,628–334,199)* in 2023 (−43.3%); neonatal five-cause deaths from 2,841,581 to 1,474,021 (1,168,225–1,840,930*; −48.1%). All three pairs were level-concordant (r≈0.91–0.93), largely reflecting the shared development gradient; synchrony evidence lay in co-movement of change: 1990–2023 declines (Spearman ρ 0.77, 0.57, 0.80) and first differences (ρ 0.58, 0.49, 0.62; p≤2.3×10⁻⁹). Declines ran predominantly on the fatality margin (95.2% of the obstructed-labour decline; exposure contributed 10.9% of the preterm-birth decline). At the 2023 best-SDI frontier, 92.2% (region-frontier sensitivity 97.8%) of maternal direct-cause deaths and 73.5% (sensitivity 92.8%) of neonatal deaths were avoidable (upper bound). Central Asia was the extreme orphan pathway: maternal infection deaths fell 70.2% while neonatal sepsis deaths rose 62.2%.Conclusions: Maternal and neonatal mortality share causes, places and margins; most of the joint toll is avoidable at already-observed performance, and orphan pathways mark where dyad logic breaks. Ending Preventable Maternal Mortality (EPMM) and the Every Newborn Action Plan (ENAP) should be monitored as one dyad with two targets.
Keywords:
maternal mortality
; neonatal mortality
; Global Burden of Disease
; cause of death
; mother–neonate dyad
; avoidable mortality
1. Introduction
Mothers and newborns die along a single continuum of care, yet the statistical systems that count them keep two separate ledgers. In the Global Burden of Disease Study 2023 (GBD 2023), maternal deaths fell from 422,924 in 1990 to 239,929 in 2023 (−43.3%, driven above all by haemorrhage, −65.9%); the independent UN MMEIG series is concordant at a different calibre (≈260,000 deaths in 2023; pandemic-era peak ≈322,000 in 2021; 2023 maternal mortality ratio (MMR) ≈197 per 100,000 live births, far above the Sustainable Development Goal (SDG) 3.1 target of 70) [2]. Deaths from the five neonatal-disorder causes analysed here fell from 2,841,581 to 1,474,021 over the same span (−48.1%), while total neonatal deaths plateaued around 2.3 million a year in the UN IGME series [4]. The descriptive geography of both ledgers is settled [1,2,5]; this paper claims no descriptive novelty on either side. Policy already treats the two ledgers as one continuum with shared 2030 targets — Ending Preventable Maternal Mortality (EPMM) alongside the Every Newborn Action Plan (ENAP) [6,7,8] — and integrated maternal–newborn packages have been modelled to avert up to 2.9 million maternal, stillbirth and neonatal deaths annually [9].
Yet the claim that mothers and newborns die of linked failures of the same care system rests on thin cause-level evidence; five gaps persist. First, no cause-paired mother–neonate dyad analysis exists within any GBD round: the nearest neighbours are aggregate: a five-phase obstetric transition model linking the ledgers through ratios of UN-calibre totals across 151 countries [3] and a country-level correlation of r = 0.59 between declines in maternal death rates and in all-cause DALY rates among infants under 1 year, the strongest of any childhood age group (eFigure 11) [10] — and within-round comparative designs pair syndromes on one side of the ledger, not across it. Second, exposure- versus fatality-margin variance decomposition has never been applied to a maternal panel: we do not know whether mothers die where complications are common or where they are lethal. Third, no avoidable-death counterfactual exists for the joint dyad toll. Fourth, adolescents aged 10–19 are the shared blind spot of both frameworks: the all-cause U-shaped adolescent curve is documented [11], but no cause-specific adolescent MMR series exists and the adolescent-mother/early-neonatal linkage is untested even ecologically. Fifth, GBD-incidence-calibre morbidity:mortality ratios are unreported for maternal causes and, as GBD estimates no near-miss events, must not be read as near-miss ratios.
2. Methods
2.1. Data Sources and Version
All estimates derive from the Global Burden of Disease Study 2023 (GBD 2023; Results Tool version 8352), downloaded from the Institute for Health Metrics and Evaluation (IHME) GBD Results Tool on 20 August 2026 [12]; GBD 2023 estimates causes of death by Cause of Death Ensemble modelling with garbage-code redistribution and non-fatal outcomes by DisMod-MR 2.1, with 95% uncertainty intervals (UIs) from the 2.5th and 97.5th percentiles of posterior draws [13,14]. Every aggregation was author-computed from the raw extraction files (Supplementary Data S1): no number was transcribed from any article, no estimate from any previous GBD round enters any table, figure or trend, and external systems (e.g., MMEIG) serve only as side-by-side calibration references, never mixed with GBD-calibre values [1,2].
2.2. Study Units and Panel Structure
The downloaded set comprised 27 units — the Global aggregate, 21 GBD regions and five Socio-demographic Index (SDI) quintiles; the analytic panel is the 26 non-Global locations (Global a reference marker only), and, with the exception of the post-hoc 204-country inequality extension described in §3.8, no country-level estimates were extracted or referred to. Maternal estimates pertain to females aged 10–54 years in nine five-year bands for six key years (1990, 2000, 2010, 2019, 2021, 2023); all maternal temporal statements are interval changes, with no annualised trend coefficient. Neonatal deaths and (where available) incidence cover the early (0–6 days) and late (7–27 days) periods, both sexes combined, annual 1990–2023. Crude rates are used throughout, live-birth denominators back-calculated from deaths and MMRs within each location–age–year cell, so age standardisation was neither possible nor interpretable. The sole exception is the post-hoc country-level extension reported in Section 3.8; all other analyses remain at the 26-location panel.
2.3. Cause Set and the a Priori Pathway Pairing
Ten maternal causes and five neonatal causes were paired along care pathways registered before any correlation was computed (identifiers and indicator availability: Table S4). Three pairs carried directional priors: Pair A (infection/hygiene), maternal sepsis and other pregnancy-related infections (368) × neonatal sepsis and other neonatal infections (383), bound by delivery-hygiene and postnatal infection determinants; Pair B (intrapartum care), obstructed labour and uterine rupture (370) × neonatal encephalopathy from birth asphyxia and trauma (382), bound by intrapartum monitoring and timely caesarean delivery; and Pair C (placental/preterm), hypertensive disorders of pregnancy (369) × preterm birth complications (381), bound by shared placental pathology — because preterm birth is multifactorial, Pair C was pre-registered as the weakest expected pairing, so a moderate result confirms rather than disappoints the prior. The other seven maternal and two neonatal causes have no a priori partner and are analysed as orphan pathways; haemorrhage is flagged a semi-orphan because antepartum bleeding can precipitate preterm birth. Falsifiability rule: the three prior pairs must occupy the top ranks of their rows and columns in the full 10 × 5 concordance matrix; dominance by an off-diagonal pair would weaken the framework and be reported as such.
2.4. Indicator Calibres and Known Asymmetries
The MMR denominator is live births (deaths per 100,000); cause-specific MMRs are additive within but not across age bands. Incidence and MMRs exist for the seven direct maternal causes only — indirect (375), late (376) and HIV-aggravated (741) deaths have neither — so any seven-cause aggregate is a lower bound of all-cause deaths. On the neonatal side, fine-age incidence exists only for cause 383; causes 381, 382 and 384 carry under-5-aggregate incidence, treated as the birth-cohort episode count (episodes occur essentially at birth); other neonatal disorders (385) is deaths-only; cause 383 carries no pathogen attribution. GBD excludes severe-morbidity and near-miss sources, so every morbidity-to-mortality ratio here is GBD-incidence-calibre and must never be read as a near-miss ratio (Text S9).
2.5. Dyad Synchrony: The Dyad Synchrony Index (DSI)
All synchrony analyses use rates per 100,000 live births on both ledgers: the cause-specific MMR on the maternal side (recomputed as summed deaths over summed implied live births × 100,000 within each location and year) and cause-specific deaths ÷ implied live births × 100,000 on the neonatal side. The seven direct maternal causes return identical implied denominators within every cell (within-cell coefficient of variation = 0). Death-count calibres are sensitivity only.
For a cause pair (m, n), the primary DSI is the Spearman rank correlation across the 26 locations, computed per key year and summarised by its median and range (n = 26 per year); a pooled variant (26 × 6 years, n = 156) is reference only (observations autocorrelated, p values anti-conservative). Spearman is primary (ranks resist extreme percentage swings on small counts); Pearson on log rates is sensitivity. Level and decline correlations (concordance of rates at a given year vs of 1990→2023 interval changes) are distinct constructs, reported separately; every synchrony statistic is labelled by construct and by n.
2.6. Full 10 × 5 Concordance Matrix and Multiple-Testing Control
The full 10 × 5 pairing matrix (all 50 maternal–neonatal cause combinations) was computed in both constructs of §2.5, with Benjamini–Hochberg control at q = 0.05 per family of 50 tests [15] and the falsifiability rule of §2.3 evaluated on within-row and within-column ρ ranks in both constructs (detail in Text S11). The 2023 level matrix appears in Figure 1A; complete matrices with q values: Figure S1, Table S1.
2.7. Synchrony Robustness: Detrended Residuals and First Differences
Because both ledgers’ rates trend with the SDI development gradient, two robustness analyses on the death-count (sensitivity) calibre separate genuine co-movement from common trend (construction in Text S11): (a) detrended-residual synchrony (pooled n = 156, reference only; year-by-year n = 26); and (b) first-difference co-movement of Δlog deaths over the five consecutive intervals (1990→2000, 2000→2010, 2010→2019, 2019→2021, 2021→2023; 5 × 26 = 130 paired observations per pair, Spearman). The first-difference construct is the primary evidence that improvement paces move together within a location; detrended attenuation indicates that level correlations largely reflect the shared gradient.
2.8. Two-Margin Log Decomposition
For each cause with paired deaths and incidence, change was decomposed along Δlog Deaths = Δlog Incidence + Δlog CFR, the case-fatality ratio (CFR)-type term (deaths per 1,000 episodes) being an episode-fatality margin distinct in calibre from the per-live-birth MMR. Exposure-margin and fatality-margin shares of the log change sum to 100% by construction; for causes 381, 382 and 384 the under-5 incidence denominators bias CFR-type indicators downward (§2.4). The morbidity-to-mortality ratio (inverse CFR) is reported only under the §2.4 disclaimer.
2.9. Counterfactual Frontier and Avoidable Deaths
For 2023 the frontier was the lowest cause-specific CFR among the five SDI quintiles — High SDI for every cause. Avoidable deaths equal observed deaths minus the counterfactual from applying the frontier CFR to each quintile’s observed incidence (truncated at zero), summed across quintiles: how much of the 2023 toll would not occur, exposure held fixed, at best already-observed fatality performance. Every figure therefore carries the permanent label “upper-bound marker of unattained performance”, not a programme target. Causes without incidence (375, 376, 741, 385) cannot enter. A region-level frontier sensitivity (lowest 2023 cause-specific CFR among the 21 regions, the frontier region registering at least ten deaths from that cause, so near-zero-count regions cannot set the frontier) is systematically more aggressive; results are ranges across both definitions (decision record: Text S7).
2.10. Pandemic Breakpoints and Recovery Windows
Three windows are distinguished per cause and location: shock (2019→2021), recovery (2021→2023) and net (2019→2023, 2019 indexed to 100). Only cause- and region-specific heterogeneity is reported; aggregate COVID-era maternal mortality has been characterised elsewhere [1,2]. Every recovery statement is bound to the qualifier “through 2023, a modelled low-data year” and juxtaposed with its shock-window value, the two segments never quoted in isolation (full tables: Table S2; Text S8).
2.11. Uncertainty Propagation and Reporting Compliance
All 95% UIs originate in the GBD posterior draws (§2.1); where numbers are summed across ages, causes or locations, point values are exact sums but intervals are naive sums of cell UIs — wider than formal joint-draw propagation — flagged “UI not propagated for sums” wherever they appear. Analyses used Python 3.11; no new GBD model runs were undertaken; no significance claim derives from compositional shares or rankings. Reporting follows GATHER (condensed checklist in Text S10) [16]; ethics and consent statements appear in the Declarations.
3. Results
All estimates derive from the GBD 2023 Results Tool (version 8352) [12], author-aggregated for the 26-location panel of §2.2 (Global reference only; no national granularity); uncertainty intervals (UIs) for summed cells are naive sums (“UI not propagated for sums”), and all 2023 and recovery statements refer to a modelled, low-data year. The exception is the post-hoc country-level analysis reported in Section 3.8.
3.1. The Dyad Landscape, 1990–2023
Table S5 and Figure S4 place the two ledgers side by side across the six key years (cause-by-cause detail in Text S5). In 2023 the maternal ledger recorded an estimated 239,929 deaths (95% UI 166,628–334,199, ten causes) and the neonatal ledger 1,474,021 (1,168,225–1,840,930, five causes) — a joint toll of 1,713,950 (UI 1,334,854–2,175,129; UI not propagated for sums), roughly 4,700 dyad deaths per day. Since 1990, deaths fell 43.3% on the maternal ledger (from 422,924) and 48.1% on the neonatal (from 2,841,581); haemorrhage ceded its historical dominance (36.1% to 21.7% of maternal deaths) while birth asphyxia rose from 30.3% to 36.4% of neonatal deaths (with preterm birth, 74.9%), and deaths concentrated ever earlier in the neonatal period (0–6-day share 83.6% to 86.3%). The toll remained steeply graded: 2023 implied all-cause MMRs spanned 164-fold (606.8 per 100,000 live births in Central Sub-Saharan Africa to 3.7 in Western Europe; SDI gradient 14.7-fold, Low 329.5 vs High 22.4), the Low SDI quintile alone carried 68.7% of maternal deaths (164,896), and South Asia 34.5% of neonatal deaths (508,008).
3.2. Pathway Concordance: The Dyad Synchrony Index
Across the 26-location panel (Figure 1), level concordance of the three registered pairs (§2.3) was high on the death-count sensitivity calibre (Spearman ρ ≈ 0.91–0.93: per-year cross-location medians 0.910–0.932, n = 26; pooled 26 × 6 values 0.908–0.936, reference-only, repeated years non-independent); on the primary rate calibre of §2.5 the three pairs’ per-year level medians span 0.82–0.89 (Figure 1a). Levels carry little pathway information on either calibre: detrended within-location residual concordance was null for Pair 1 (ρ = 0.035, p = 0.67), marginal for Pair 2 (ρ = 0.18, p = 0.024) and weak for Pair 3 (ρ = 0.24, p = 0.003). The primary synchrony evidence is co-movement of change: first differences of log deaths moved together for all three pairs (n = 130 location-intervals; ρ = 0.584, 0.494 and 0.618; all p ≤ 2.3×10⁻⁹), and 1990→2023 declines correlated at ρ = 0.773, 0.567 and 0.797. Pair 2 remains the pre-announced dual-calibre exception: its Pearson decline correlation was null (r = −0.103, p = 0.617), distorted by extreme percentage changes on tiny bases (Andean Latin America obstructed-labour deaths ≈1 to 41 over 1990→2023), so Spearman ρ (p = 0.003) is primary and Pearson r sensitivity.
The full 10 × 5 cross-cause matrix sharpens the verdict (Figure S1; Table S1, Benjamini–Hochberg correction across all 50 cells). Level correlations were uniformly high (per-year ρ medians 0.779–0.967; all 50 pairs significant after correction) — significance without specificity. On the decline calibre 45 of 50 pairs remained significant, and the falsifiability rule is only partially met: Pair 3 ranked first within both row (1/5) and column (1/10), Pair 1 first within its column (1/10; row 4/5), but Pair 2 last within its row (5/5); the HIV-aggravated row was wholly non-significant (ρ −0.16 to 0.12, q 0.46–0.86).
Shock-window (2019→2021) co-movement was weak and non-significant for all three pairs (ρ 0.11–0.36), but the 2021→2023 recovery was synchronous on the two finest-calibre pathways (Pair 1 ρ = 0.61, p = 0.001; Pair 3 ρ = 0.53, p = 0.006; Pair 2 ρ = 0.26, p = 0.194), through 2023, a modelled low-data year.
3.3. Orphan Pathways: Where the Dyad Logic Does Not Bind
We screened all three pairs for locations where the maternal side improved faster than the median while the neonatal side stagnated or worsened (Figure 2; full ranking in Text S6). The most extreme orphan pattern occurred in Central Asia: maternal infection deaths fell 70.2% over 1990→2023 while neonatal sepsis deaths rose 62.2% (857 to 1,390, peaking at 1,620 in 2020) — a 132.3-point divergence, the panel’s largest — and the region’s placental pathway was also orphaned (hypertensive deaths −68.2% vs preterm deaths −5.1%); during 2019→2021 all three Central Asian pairs deteriorated on both sides at once.
The next-largest divergences were Australasia’s intrapartum pair (obstructed labour −76.6% vs birth asphyxia −8.6%; 68.0 points, on very small counts — 148.8 birth-asphyxia deaths in 2023 [95% UI 127.8–168.4] within 493 neonatal deaths) and the population-weighted intrapartum pairs of South Asia and Low-middle SDI (46.1 and 42.5 points; Text S6).
A distinct orphan signal comes from deaths-only causes: indirect maternal deaths in Eastern Europe surged ≈1,110% in 2019→2021 (30 [95% UI 20–43] to 363 [272–442]; intervals do not overlap) and, despite a 78.8% recoil, remained 2.6 times the 2019 level in 2023 — a spike consistent with large-scale classification of COVID-19-related deaths as indirect maternal deaths (§3.7).
3.4. Two Margins of the Dyad: Exposure and Fatality
For the seven direct maternal causes and four neonatal causes with incidence, we decomposed the 1990→2023 change in deaths into the exposure and fatality margins of §2.8 (Figure 3). Maternal declines were carried predominantly by the fatality margin (shares of the log-change decomposition: obstructed labour 95.2%, hypertensive disorders 85.9%, haemorrhage 65.5%); the share exceeded 100% for sepsis (120.2%) and abortion/miscarriage (109.9%), exposure rising (+9.5% and +8.5%) against the decline; other direct causes deteriorated through exposure instead (exposure +23.7%, fatality −5.8%, deaths +16.6%); and ectopic pregnancy was the only direct cause whose fatality margin itself worsened (case fatality 3.63 to 5.41 per 1,000 episodes, +49.1%).
Neonatal margins were more evenly balanced (fatality shares: preterm 89.1%, jaundice 73.2%, asphyxia 53.9%, sepsis 49.7%). The asphyxia fatality proxy exceeded 500 per 1,000 episodes throughout (663.7 in 1990; 514.0 in 2023) under GBD’s narrow incidence definition of neonatal encephalopathy as moderate-to-severe clinical events, and its 2023 SDI gradient was non-monotonic (Low-middle 904.3 vs Low 586.6), plausibly case-definition and ascertainment artefacts plus the under-5 aggregate denominator; the maternal gradient was steep and monotone (haemorrhage 7.63 vs 0.27 per 1,000, Low vs High SDI, 28-fold).
A cross-sectional variance decomposition across the 26 locations (Var[log rate] = Var[log exposure] + Var[log fatality] + 2·Cov; Figure 3a) qualifies this temporal picture: covariance shares were mostly negative on the maternal ledger (ectopic pregnancy −64%, obstructed labour −70%; only hypertensive disorders positive, +13%) but positive for all four neonatal causes in the 2023 cross-section (+11% to +30%); in 1990 the neonatal covariance was not yet uniformly positive, the sepsis and jaundice shares being negative (−8% and −5%). The two margins thus trade off across locations for maternal causes — inequality concentrating in the fatality margin — whereas for neonatal causes they now stack. This cross-sectional covariance is distinct from the temporal decomposition above.
3.5. The Adolescent Window, Ages 10–19
Maternal mortality in 2023 was J-shaped across the reproductive ages (Figure S2). Against the minimum at 25–29 years (MMR 129.7 per 100,000 live births), the MMR was 370.2 at 10–14 years (2.85-fold) and 314.2 at 15–19 years (2.42-fold), rising to 16.6-fold at 50–54 years (2,154.7) — an asymmetric J consistent with the documented U-shaped curve [11]. The 10–14 elevation rests on a very small, strongly selected implied live-birth denominator (≈0.4 million births globally in 2023 vs ≈10 million at 15–19 years); that band is descriptive only.
Adolescent declines lagged the reference bands (1990→2023: −40.2% at 10–14 years, −49.6% at 15–19 years, vs −56.5% at 20–24 years). Two cause-specific signals stood out at 15–19 years: the ectopic-pregnancy MMR doubled (9.6 to 19.3 per 100,000, +100.4%, the steepest rise of any age–cause cell), and the hypertensive-disorders MMR (65.2) exceeded the band’s haemorrhage MMR (60.7) while declining only 15.3% since 1990 — just over half the 27.9% pace at 25–29 years, a stalled adolescent placental pathway. During the pandemic shock the all-cause MMR rose in the three youngest bands — 15–19 (+2.6%), 20–24 (+1.0%) and 25–29 (+1.7%) — and was flat or falling at ages 30 and above. The ledgers also move together in adolescence: maternal deaths at 15–19 years correlated with same-location, same-year neonatal deaths at ρ = 0.938 (per-year 0.917–0.949; decline ρ = 0.797), and at 10–14 years ρ = 0.913 (exploratory; near-zero counts in high-income regions) — levels that largely track the SDI gradient (Figure S2C, hypothesis-generating).
3.6. The Avoidable Dyad: Best-Frontier Counterfactual
Avoidable deaths at the 2023 best-frontier fatality rates (§2.9; Table 1; Figure 4) are upper-bound markers of unattained performance, not programme targets, holding exposure fixed and excluding causes without incidence (375/376/741/385; §2.9).
On the maternal ledger, 190,766 of 207,003 direct-cause deaths across the five quintiles — 92.2% — would not have occurred at frontier fatality rates (upper bound); avoidable fractions were nearly total (94.9–97.7% for haemorrhage, sepsis, obstructed labour, ectopic pregnancy and abortion/miscarriage) and lowest for other direct causes (81.5%; Table 1). On the neonatal ledger, 963,052 of 1,310,301 deaths from the four causes with incidence data — 73.5% — were avoidable (upper bound): 88.6% for jaundice, 81.8% for birth asphyxia and 78.6% for sepsis, but only 63.4% for preterm birth, whose frontier fatality rate (9.9 per 1,000 episodes) remains comparatively high even in High SDI settings. The Low SDI quintile alone carried 73.6% of avoidable maternal deaths (140,438) and 60.8% of avoidable neonatal deaths (585,127). A region-frontier sensitivity (§2.9) raised the shares to 97.8% (maternal) and 92.8% (neonatal) — same direction, larger magnitude (Table S3; Text S7); unconstrained, the maternal frontier for six of the seven causes fell on Australasia, a near-zero-count artefact (Text S7). Fractions are reported as point patterns without significance claims, UI propagation across quintiles being approximate.
3.7. Pandemic Shock and Recovery Heterogeneity
We report only cause- and region-specific shock/recovery heterogeneity (aggregate COVID-era mortality: [1,2]), through 2023, a modelled low-data year (Figure S3; full 15 × 26 matrix, ten slowest-recovering cells in bold: Table S2; Text S8). Globally, one maternal cause failed to recover: indirect deaths rose 30.2% in 2019→2021 (20,439 to 26,612) and remained 12.7% above 2019 in 2023; late deaths rose 13.2% before partially receding (−8.2%). No neonatal cause rebounded, but neonatal sepsis fell only 1.0% during the shock, the slowest decline on either ledger.
The ten slowest-recovering cause–region cells (Table S2, per-cell shock and net values) paired sharp 2019→2021 shocks with partial recoil and concentrated in the reclassification-prone indirect/HIV/late cluster rather than the direct obstetric or neonatal core — worst were indirect deaths in Eastern Europe (§3.3) and Oceania (+104.2% net 2019→2023) and HIV-aggravated deaths in Eastern Europe, with neonatal jaundice in Australasia (+45.1% net) the only neonatal cell. The pattern is consistent with service-disruption scarring or residual COVID-19 death reclassification (Limitations); all recovery statements are provisional pending the next estimation round with observed 2020–2021 data.
3.8. Socio-Demographic Inequality of the Dyad: Slope and Concentration Indices
To quantify how the dyad burden is graded across the socio-demographic spectrum, we computed the slope index of inequality (SII) and the concentration index (CII) for each ledger, regressing quintile-level rates on live-birth-weighted SDI ridit scores (live births back-calculated within age bands from paired deaths and MMR cells; 1,000-replicate bootstrap 95% CIs; Table S6). Because the raw extractions carry no SDI values for the 21 GBD regions, the inequality units are the five SDI quintiles — an ecological, quintile-level complement to the 26-location panel. Joinpoint regression was not applicable to this panel (six key-year points per series).
Absolute inequality in the maternal ledger halved between 1990 and 2023: the SII of the ten-cause MMR narrowed from −826.7 (95% CI −945.8 to −192.4) to −438.3 (−475.1 to −81.8) deaths per 100,000 live births across the low-to-high SDI ridit, while relative concentration persisted (CII −0.410 [−0.511 to −0.117] in 1990 vs −0.354 [−0.461 to −0.089] in 2023). The neonatal ledger showed the same pattern in smaller calibre: SII of the five-cause NMR narrowed from −36.2 (−38.9 to −10.1) to −21.3 (−23.5 to −5.4) deaths per 1,000 live births, with CII essentially unchanged (−0.267 [−0.331 to −0.058] vs −0.280 [−0.441 to −0.062]). Both ledgers therefore remain disproportionately concentrated among low-SDI populations even as absolute gradients contracted — the dyad’s synchrony operates within a stubbornly pro-poor distribution.
Country-level extension and inequality trajectory. Upgrading the inequality estimands from five quintile units to national granularity, we obtained a purpose-built country-level GBD 2023 extraction (204 countries and territories: ten-cause maternal deaths by five-year age band, all-ages cause-specific MMR, and five-cause neonatal deaths, 1990 and 2023; country ranking by GBD 2023 SDI values; raw files archived in 04_Supplementary/external_data/) and recomputed both indices over the 204 country units with year-specific SDI ridit ordering, live-birth weighting and a 1,000-replicate bootstrap (sii_cii_country_dyad.csv; country-level map data country_estimates_dyad.csv). The country-level analysis corroborates the quintile-level pattern with materially tighter intervals: the maternal SII narrowed from −848.4 (95% CI −1102.3 to −573.9) in 1990 to −479.5 (−612.8 to −323.8) deaths per 100,000 live births in 2023, with relative concentration persisting (CII −0.436 [−0.544 to −0.285] vs −0.417 [−0.513 to −0.303]); the neonatal SII narrowed from −36.2 (−41.1 to −23.2) to −21.4 (−24.8 to −15.3) deaths per 1,000 live births (CII −0.277 [−0.344 to −0.185] vs −0.302 [−0.415 to −0.194]). The 204-country death sums reproduce the Global totals of the aggregate extraction within 0.1% in both years, anchoring the finer granularity to the primary panel. Within the quintile units we also traced the full inequality trajectory across all six panel years (sii_cii_trend_dyad.csv). The absolute gradient narrowed monotonically in both ledgers: maternal SII moved from −826.7 (95% CI −945.8 to −192.4) in 1990 through −730.5 (−821.0 to −175.4) in 2000, −566.8 (−623.3 to −129.2) in 2010, −485.1 (−511.1 to −83.3) in 2019 and −439.4 (−470.3 to −82.9) in 2021 to −438.3 (−475.1 to −81.8) in 2023; neonatal SII moved from −36.2 (−38.9 to −10.1) through −30.9 (−34.1 to −8.6), −27.3 (−30.0 to −6.9), −23.7 (−25.8 to −5.6) and −22.2 (−24.4 to −5.6) to −21.3 (−23.5 to −5.4). Relative concentration, by contrast, showed no secular improvement (maternal CII −0.410 to −0.354; neonatal CII −0.267 to −0.280, all CIs overlapping), confirming that the pro-poor concentration of the dyad burden is structural rather than transitional (Tables S7–S8).
4. Discussion
Principal Findings
In this first cause-paired dyad analysis within a single GBD round, the two ledgers prove bound in how fast deaths fall, but the binding is specific. All three a priori pathway pairs were concordant in 1990–2023 declines (Spearman ρ 0.773, 0.567 and 0.797), while level correlations carried no pathway specificity (all 50 pairings in a ρ 0.78–0.97 band; detrended residual correlations collapsed), so pair specificity survived only on the decline margin, and only partially (the placental pair topped both row and column, the infection pair its column only, the intrapartum pair neither). Maternal-side decline ran predominantly through the fatality margin, orphan pathways locate the breaks (starkly in Central Asia), and at the best-observed 2023 fatality frontier an estimated 92.2% of direct maternal and 73.5% of neonatal deaths would not have occurred (an upper-bound marker of unattained performance).
Two Margins, One Investment
Temporally, the 1990–2023 decomposition attributes maternal-side gains predominantly to survival conditional on complication, not prevention; where exposure moved the wrong way the fatality margin carried more than the whole decline (sepsis episodes rose 9.5% while deaths fell; share 120.2%). Cross-sectionally, the margins covaried negatively across locations in 2023 for most maternal causes (covariance shares down to −70% for obstructed labour; hypertensive disorders the exception at +13%; §3.4): where exposure is high, fatality tends to be low, so cross-location inequality loads onto the fatality margin (82–146% of variance) — the margin treatment access moves: haemorrhage episode fatality spanned 7.6 to 0.3 deaths per 1,000 episodes from low- to high-SDI (≈28-fold) while incidence varied comparatively little [17].
Intrapartum care, emergency obstetric care and the neonatal unit remain two margins of one investment — monitoring, timely caesarean and resuscitation enter both ledgers from one labour-ward purchase — with two exceptions: ectopic pregnancy, the only direct maternal cause whose fatality margin worsened (3.6 to 5.4 per 1,000 episodes, +49.1%), needs a diagnosis-and-surgical-access margin beyond delivery-ward reach (and GBD ectopic estimates are highly model-dependent; Limitations); and preterm birth is the neonatal mirror — exposure fell only 8.5% since 1990 while deaths fell 56.1%, neonatal-unit diffusion rather than prevention. The anomalous asphyxia gradient (§3.4) warns that a narrowly ascertained fatality margin may encode ascertainment as much as care quality.
Orphan Pathways as Candidate Disconnects
An orphan pathway’s prevention logic has no counterpart on the opposite ledger; its geography is diagnostic within ecological limits. In Central Asia maternal sepsis deaths fell 70.2% between 1990 and 2023 while neonatal sepsis deaths rose 62.2%; the placental pair dissociated identically; and during 2019→2021 it was the only location where all three pairs worsened on both ledgers at once (counts in §3.3). The pattern is consistent with service discontinuity between maternity and neonatal care — the reading we consider most plausible — but cannot exclude data-side alternatives: post-Soviet transitions towards WHO live-birth definitions continuously create registrable neonatal deaths, garbage-code redistribution acts strongly in low-data-density settings, and the counts are modest, warranting the same caution as Australasia’s small-count divergence (§3.3). The semi-orphans invert the prescription: haemorrhage needs obstetric commodities no newborn programme delivers, and neonatal jaundice (deaths −79.8% since 1990; 24,051 in 2023) needs phototherapy, exchange transfusion and Rhesus prophylaxis, its malaria-belt concentration overlapping the geography of the haemoglobinopathies.
Comparison with Prior Work
The GBD 2023 maternal mortality capstone [1] owns the descriptive territory; a single-ledger design cannot deliver the relational content reported here: pathway pairing, two-margin decomposition and a joint counterfactual. Aggregate ratio models link the ledgers [3,10] but cannot say which causes bind the phases; the cause-level anatomy here fills that gap, and complicates it where a pair’s two sides stop transitioning together: the 2019→2021 shock was dyad-dyssynchronous while the 2021→2023 recovery moved together on the two finest-calibre pathways (§3.2), through 2023, a modelled low-data year. Wei and colleagues documented the all-cause U-shaped maternal age curve [11]; cause resolution adds the actionable edge (a stalled adolescent placental pathway; ectopic MMR at 15–19 doubled) and the ecological dyad linkage of adolescence (§3.5) — no priority over the U-curve is claimed. MMEIG 2025 has told the aggregate pandemic story [2]; our GBD-calibre total sits below it, a calibration difference between estimation systems rather than a discrepancy adjudicated here, and what the aggregate conceals is the recovery heterogeneity of §3.7.
Policy Implications
Three implications follow for a merged EPMM–ENAP agenda. First, monitoring: SDG 3.1 (global MMR below 70 per 100,000 live births by 2030, no country above 140 under EPMM) [6] and SDG 3.2/ENAP (NMR of 12 or fewer per 1,000 live births in every country) [4,7] are tracked separately at different calibres, a DSI-style co-burden indicator is cheap because both ledgers already exist in GBD and UN estimation; one indicator set with two targets would make orphan pathways visible as they form. Secondly, financing: 92.2% of direct maternal and 73.5% of neonatal deaths in 2023 were avoidable at already-observed frontier performance (92.2–97.8% and 73.5–92.8% across frontier definitions; upper bounds, not programme targets), and the low-SDI quintile carried 73.6% and 60.8% of the avoidable tolls — intrapartum-plus-neonatal capacity yields gains on both ledgers at once. Preterm birth is the counterweight: its avoidable share is lowest even at the frontier (63.4%), so prematurity prevention cannot be replaced by diffusing existing care. Thirdly, adolescents cannot free-ride on adult services: adolescent declines lagged every reference band (§3.5), so adolescent-responsive contraception, safe-abortion, antenatal and ectopic-diagnosis services must be purchased explicitly — what works at 25 does not automatically reach a 16-year-old.
Limitations
Several limitations apply. First, the analysis is ecological and region/SDI-quintile-only: the dyad is an analytic pairing of marginal distributions across 26 locations, not linked mother–baby records; individual-level co-occurrence cannot be inferred, regional aggregates mask within-region heterogeneity, and nothing here identifies priority countries. Secondly, cause-specific rates partly inherit GBD regional envelopes and covariates, and GBD incidence models borrow mortality information, so concordance may partly reflect shared model inputs and headline fatality shares may be partly mechanical. Thirdly, maternal cause assignment in low-registration settings relies on verbal autopsy and redistribution, which separate sepsis from haemorrhage only weakly; Pair A levels and orphan determinations there inherit this ceiling. Fourthly, abortion and ectopic-pregnancy estimates carry well-known GBD modelling controversies in restrictive-law settings, where abortion-related deaths may be reclassified; both are reported at face value with this flag, qualifying the ectopic narrative. Fifthly, uncertainty handling is approximate: intervals are naive aggregations or symmetric normal approximations, and compositional shares carry no significance claims. Sixthly, neonatal incidence calibre is asymmetric: preterm, encephalopathy and jaundice incidence is an under-5 aggregate (biasing fatality measures slightly downward), other neonatal disorders have no incidence, neonatal sepsis has no pathogen attribution, and the back-calculated live-birth denominators are shared by both ledgers, inflating rate concordance mechanically. Seventhly, 2023 is a modelled, low-data year and maternal estimates span six key years, so recovery statements are provisional and no annualised trend coefficient exists. Eighthly, GBD excludes severe maternal morbidity and near-miss sources — our morbidity:mortality ratios are GBD-incidence-calibre, not near-miss ratios — and stillbirths are absent from the GBD cause list, understating the shared intrapartum toll. Ninthly, the pandemic-era surges in indirect and HIV-aggravated maternal deaths may partly be cause-reclassification artefacts inseparable here from true service disruption, and the 10–14 band carries tiny, strongly selected counts (1,571 deaths globally in 2023) and is descriptive only. Finally, the counterfactual is an upper bound by construction (best-observed frontier, not a theoretical minimum), its frontier fatality rates rest on small high-SDI death counts, and the coverage analysis is descriptive over at most 21 regional observations [17]. The exception is the post-hoc country-level analysis reported in Section 3.8, which provides national-granularity inequality estimates at an ecological, cross-country calibre.
5. Conclusions
Pairing ten maternal and five neonatal causes along a priori care pathways within GBD 2023 shows that mothers and newborns die along shared pathways whose decline has been purchased almost entirely on the fatality margin. All three registered pairs were strongly concordant in their pace of decline (first-difference co-movement ρ = 0.49–0.62); orphan pathways, above all Central Asia’s diverging sepsis pair, expose where the continuum breaks; 92.2% of direct maternal and 73.5% of neonatal deaths in 2023 were avoidable at already-observed frontier performance (upper bound); and the youngest arm of the age curve remains the dyad’s most fragile point, though the pandemic-era rise extended to ages 25–29 (+1.7%) and was steepest at 15–19 years. The policy-asserted continuum is demonstrable in cause-level epidemiology: EPMM and ENAP should be monitored as one dyad with two targets, financing should treat intrapartum and neonatal capacity as a single purchase, and adolescent-responsive maternal services must be bought explicitly. The next estimation round will show whether the breaks found here have begun to close.
6. Declarations, Abbreviations and References
Declarations
Supplementary Materials
The following supporting information can be downloaded at the website of this paper posted on Preprints.org. Legends for the supplementary figures (Figure S1, complete 10 × 5 concordance matrices; Figure S2, the adolescent window; Figure S3, pandemic shock and recovery heterogeneity; Figure S4, the two ledgers of the mother–neonate dyad, 1990–2023) appear in the supplementary appendix.
Ethics approval and consent to participate
This study is a secondary analysis of de-identified, aggregate, publicly available modelled estimates from the Global Burden of Disease Study 2023 (GBD 2023), coordinated by the Institute for Health Metrics and Evaluation (IHME) and distributed through the GBD Results Tool [12]. No individual-level, identifiable or newly collected primary data were accessed, and no human participants were involved. In accordance with institutional policy for research using publicly available aggregate data, this study was exempt from institutional review board approval; the requirement for informed consent was not applicable.
Consent for publication
Not applicable.
Data availability statement
All estimates analysed in this study are publicly available from the IHME GBD Results Tool (https://vizhub.healthdata.org/gbd-results/), GBD 2023 round, Results Tool version 8352, downloaded by the authors on 20 August 2026 using fully specified, reproducible queries (ten maternal causes — deaths, incidence and cause-specific maternal mortality ratios, females aged 10–54 years, six key years; five neonatal causes — deaths and, where available, incidence, ages 0–6 and 7–27 days, 1990–2023; 21 GBD regions, five Socio-demographic Index quintiles and the Global aggregate; plus a purpose-built country-level extraction — 204 countries and territories, 1990 and 2023 — used only for the post-hoc inequality extension of §3.8, raw files archived in 04_Supplementary/external_data/). Supplementary Data S1 provides (i) the unmodified raw CSV extractions and (ii) the author-aggregated derived analysis tables underpinning every figure and in-text statistic (derived/ directory: the 10 × 5 concordance matrices with BH-FDR q values, pair-scatter location-level rates, DSI(t) series, pairing-status and regional-concentration summaries, two-margin decompositions, SDI-quintile margin tables, morbidity:mortality ratios, frontier counterfactual tables and adolescent-window tables). Every derived table is regenerated from the raw extractions by the figure-building script (04_Supplementary/code/build_figs_dyad.py), which embeds an assertion battery re-deriving every headline value reported in the captions and text. All Python analysis code is included in the supplementary materials (04_Supplementary/code/: build_figs_dyad.py, sii_cii_dyad.py, sii_cii_trend_dyad.py, sii_cii_country_dyad.py).
Authors’ contributions
Deze Li (DL), Shen Chen (SC). CRediT roles: Conceptualisation: SC; Data curation: DL; Formal analysis: DL, SC; Funding acquisition: not applicable; Investigation: DL, SC; Methodology: SC; Project administration: SC; Software: DL; Supervision: SC; Validation: DL, SC; Visualisation: DL; Writing — original draft: SC; Writing — review and editing: all authors. SC is the guarantor and accepts full responsibility for the work and the conduct of the study, had access to the data, and controlled the decision to publish. All authors read and approved the final manuscript. The corresponding author attests that all listed authors meet authorship criteria and that no others meeting the criteria have been omitted. SC is the principal investigator who conceived the study and leads its overall conduct.
Use of artificial intelligence
AI tools were used for language polishing and code drafting.
Competing interests
All authors have completed the ICMJE uniform disclosure form at www.icmje.org/disclosure-of-interest/ and declare: Beijing Science and Technology Nova Program Interdisciplinary Project (20230484439) and the Beijing High-Level Public Health Technical Talents Project (2023-02-33); no financial relationships with any organisations that might have an interest in the submitted work in the previous three years; no other relationships or activities that could appear to have influenced the submitted work.
Funding
Beijing Science and Technology Nova Program Interdisciplinary Project (20230484439) and the Beijing High-Level Public Health Technical Talents Project (2023-02-33). The funder had no role in study design, data collection, data analysis, data interpretation or writing of the report.
Patient and public involvement
Patients and/or the public were not involved in the design, or conduct, or reporting, or dissemination plans of this research. The study is a secondary analysis of de-identified, aggregate, publicly available modelled estimates, and no individual patients or members of the public were engaged at any stage.
Patient consent for publication
Not applicable.
Provenance and peer review
Not commissioned; not externally peer reviewed.
Acknowledgments
We thank the Institute for Health Metrics and Evaluation, University of Washington, for making the GBD 2023 estimates publicly available through the GBD Results Tool, and the Global Burden of Disease Collaborator Network, whose primary data collection and modelling underpin all estimates analysed here.
GATHER statement
This study adheres to the Guidelines for Accurate and Transparent Health Estimates Reporting (GATHER); the completed checklist is provided in the supplementary appendix (Text S10) [16].
Author information
Deze Li, Shen Chen; Beijing Pediatric Research Institute, Beijing Children's Hospital, Capital Medical University, Beijing, China. Corresponding author: Shen Chen, Beijing Pediatric Research Institute, Beijing Children's Hospital, Capital Medical University, Beijing, China; Email: shenchen1110@mail.ccmu.edu.cn.
Abbreviations
Abbreviations used in this paper, in alphabetical order. Well-known organisational abbreviations that appear only inside reference titles are not listed.
| Abbreviation | Full term |
| CFR | case-fatality ratio (episode-fatality proxy: deaths per 1,000 episodes) |
| CI | confidence interval |
| CODEm | Cause of Death Ensemble modelling |
| CRediT | Contributor Roles Taxonomy |
| DSI | Dyad Synchrony Index |
| ENAP | Every Newborn Action Plan |
| EPMM | Ending Preventable Maternal Mortality |
| FDR | false discovery rate (Benjamini–Hochberg) |
| GATHER | Guidelines for Accurate and Transparent Health Estimates Reporting |
| GBD | Global Burden of Disease (Study) |
| HAQ | Healthcare Access and Quality (Index) |
| HIV | human immunodeficiency virus |
| ICD-9/ICD-10 | International Classification of Diseases, Ninth/Tenth Revision |
| IGME | (United Nations) Inter-Agency Group for Child Mortality Estimation |
| IHME | Institute for Health Metrics and Evaluation |
| MMEIG | (United Nations) Maternal Mortality Estimation Inter-Agency Group |
| MMR | maternal mortality ratio |
| NMR | neonatal mortality rate |
| SDG | Sustainable Development Goal |
| SDI | Socio-demographic Index |
| SSA | sub-Saharan Africa |
| UHC | universal health coverage (service coverage index) |
| UI | uncertainty interval |
| UN | United Nations |
| UNDESA | United Nations Department of Economic and Social Affairs |
| UNFPA | United Nations Population Fund |
| UNICEF | United Nations Children’s Fund |
| WHO | World Health Organization |
References
- Faith, J.; Martopullo, I.; Arndt, M.B.; Letourneau, I.D.; et al. GBD 2023 Maternal Mortality Collaborators. Global, regional, and national levels and trends in maternal mortality, progress towards the Sustainable Development Goals, and mortality from COVID-19 infection in pregnant women, 1990–2023: a systematic analysis for the Global Burden of Disease Study 2023. Lancet Obstet. Gynaecol. Womens Health 2026, 2(5), e375–e424. [Google Scholar] [CrossRef]
- World Health Organization; UNICEF; UNFPA; World Bank Group and UNDESA/Population Division. Trends in maternal mortality 2000 to 2023: estimates by WHO, UNICEF, UNFPA, World Bank Group and UNDESA/Population Division; World Health Organization: Geneva, 2025; Available online: https://www.who.int/publications/i/item/9789240108462ISBN 978-92-4-010846-2.
- Boerma, T.; Campbell, O.M.R.; Amouzou, A.; Blumenberg, C.; Blencowe, H.; Moran, A.; et al. Maternal mortality, stillbirths, and neonatal mortality: a transition model based on analyses of 151 countries. Lancet Glob. Health 2023, 11(7), e1024–31. [Google Scholar] [CrossRef] [PubMed]
- United Nations Inter-agency Group for Child Mortality Estimation (UN IGME). Levels & Trends in Child Mortality: Report 2024; United Nations Children’s Fund: New York, 2025; Available online: https://data.unicef.org/resources/levels-and-trends-in-child-mortality-2024/.
- Yang, J. Trends and inequities in the global burden of maternal mortality, 1990–2023: findings from the Global Burden of Disease Study 2023. Int. J. Gynaecol. Obstet. Epub ahead of print. 2026. [Google Scholar] [CrossRef] [PubMed]
- World Health Organization. Strategies towards ending preventable maternal mortality (EPMM); World Health Organization: Geneva, 2015; Available online: https://www.who.int/publications/i/item/9789241508483ISBN 978-92-4-150848-3.
- World Health Organization; UNICEF. Every newborn: an action plan to end preventable deaths; World Health Organization: Geneva, 2014; Available online: https://www.who.int/publications/i/item/9789241507448ISBN 978-92-4-150744-8.
- World Health Organization; UNICEF; UNFPA. Improving maternal and newborn health and survival and reducing stillbirth: progress report 2023; World Health Organization: Geneva, 2023; Available online: https://www.who.int/publications/i/item/9789240073678ISBN 978-92-4-007367-8.
- Bhutta, Z.A.; Das, J.K.; Bahl, R.; Lawn, J.E.; Salam, R.A.; Paul, V.K.; et al. Can available interventions end preventable deaths in mothers, newborn babies, and stillbirths, and at what cost? Lancet 2014, 384(9940), 347–70. [Google Scholar] [CrossRef] [PubMed]
- GBD 2017 Child and Adolescent Health Collaborators (Reiner RC Jr, Olsen HE, Ikeda CT, et al.). Diseases, injuries, and risk factors in child and adolescent health, 1990 to 2017: findings from the Global Burden of Diseases, Injuries, and Risk Factors 2017 Study. JAMA Pediatr. 2019, 173(6), e190337. [CrossRef] [PubMed]
- Wei Y, Luo H, Liu X, Sun G, Liu J, Wei X, et al. Global, regional, and national levels of maternal mortality, 1990–2021: a systematic analysis for the Global Burden of Disease Study 2021. BMC Pregnancy Childbirth. 2025;25:1359. [CrossRef]
- Institute for Health Metrics and Evaluation (IHME). GBD Results Tool, GBD 2023 (data version 8352); IHME: Seattle, WA; Available online: https://vizhub.healthdata.org/gbd-results/ (accessed on 2026-08-20).
- GBD 2023 Causes of Death Collaborators. Global burden of 292 causes of death in 204 countries and territories and 660 subnational locations, 1990–2023: a systematic analysis for the Global Burden of Disease Study 2023. Lancet 2025, 406(10513), 1811–72. [CrossRef]
- GBD 2023 Disease and Injury and Risk Factor Collaborators. Burden of 375 diseases and injuries, risk-attributable burden of 88 risk factors, and healthy life expectancy in 204 countries and territories, including 660 subnational locations, 1990–2023: a systematic analysis for the Global Burden of Disease Study 2023. Lancet 2025, 406(10513), 1873–922. [Google Scholar] [CrossRef] [PubMed]
- Benjamini, Y.; Hochberg, Y. Controlling the false discovery rate: a practical and powerful approach to multiple testing. J. R Stat. Soc. Ser. B Stat. Methodol. 1995, 57(1), 289–300. [Google Scholar] [CrossRef]
- Stevens GA, Alkema L, Black RE, Boerma JT, Collins GS, Ezzati M, et al.; GATHER Working Group. Guidelines for Accurate and Transparent Health Estimates Reporting: the GATHER statement. Lancet 2016, 388(10062), e19–23. [CrossRef] [PubMed]
- GBD 2019 Universal Health Coverage Collaborators. Measuring universal health coverage based on an index of effective coverage of health services in 204 countries and territories, 1990–2019: a systematic analysis for the Global Burden of Disease Study 2019. Lancet 2020, 396(10258), 1250–84. [Google Scholar] [CrossRef] [PubMed]
Figure 1.
Dyad concordance for the three a priori pathway pairs, 26 locations. (a) The 10 × 5 dyad synchrony index (DSI) matrix, 2023: Spearman rank correlation across the 26 locations (21 GBD regions + 5 SDI quintiles; Global excluded) of maternal cause-specific death rate (deaths per 100,000 live births, all-age recomputed as Σdeaths/Σimplied live births) versus neonatal cause-specific death rate. The three a priori pairs (boxed): Pair A infection/hygiene (368×383) ρ = 0.89; Pair B intrapartum care (370×382) ρ = 0.81; Pair C placental/preterm (369×381) ρ = 0.82. Level-calibre ranks carry no pairing specificity — all 50 cells are compressed into a high-ρ band dominated by the shared development (SDI) gradient; pairing-specific tests rest on the decline calibre (main text §3.2; the complete level and decline matrices with Benjamini–Hochberg q values: Figure S1, Table S1). (b–d) Scatter of the three pairs (log–log), 26 locations, Global shown as an open diamond reference marker (not entering correlations). Annotated: DSI with bootstrap 95% CI (2,000 resamples) and Pearson r on log rates — Pair A ρ = 0.89 (0.73–0.95), r = 0.93; Pair B ρ = 0.81 (0.57–0.92), r = 0.80; Pair C ρ = 0.82 (0.57–0.93), r = 0.87.
Figure 1.
Dyad concordance for the three a priori pathway pairs, 26 locations. (a) The 10 × 5 dyad synchrony index (DSI) matrix, 2023: Spearman rank correlation across the 26 locations (21 GBD regions + 5 SDI quintiles; Global excluded) of maternal cause-specific death rate (deaths per 100,000 live births, all-age recomputed as Σdeaths/Σimplied live births) versus neonatal cause-specific death rate. The three a priori pairs (boxed): Pair A infection/hygiene (368×383) ρ = 0.89; Pair B intrapartum care (370×382) ρ = 0.81; Pair C placental/preterm (369×381) ρ = 0.82. Level-calibre ranks carry no pairing specificity — all 50 cells are compressed into a high-ρ band dominated by the shared development (SDI) gradient; pairing-specific tests rest on the decline calibre (main text §3.2; the complete level and decline matrices with Benjamini–Hochberg q values: Figure S1, Table S1). (b–d) Scatter of the three pairs (log–log), 26 locations, Global shown as an open diamond reference marker (not entering correlations). Annotated: DSI with bootstrap 95% CI (2,000 resamples) and Pearson r on log rates — Pair A ρ = 0.89 (0.73–0.95), r = 0.93; Pair B ρ = 0.81 (0.57–0.92), r = 0.80; Pair C ρ = 0.82 (0.57–0.93), r = 0.87.
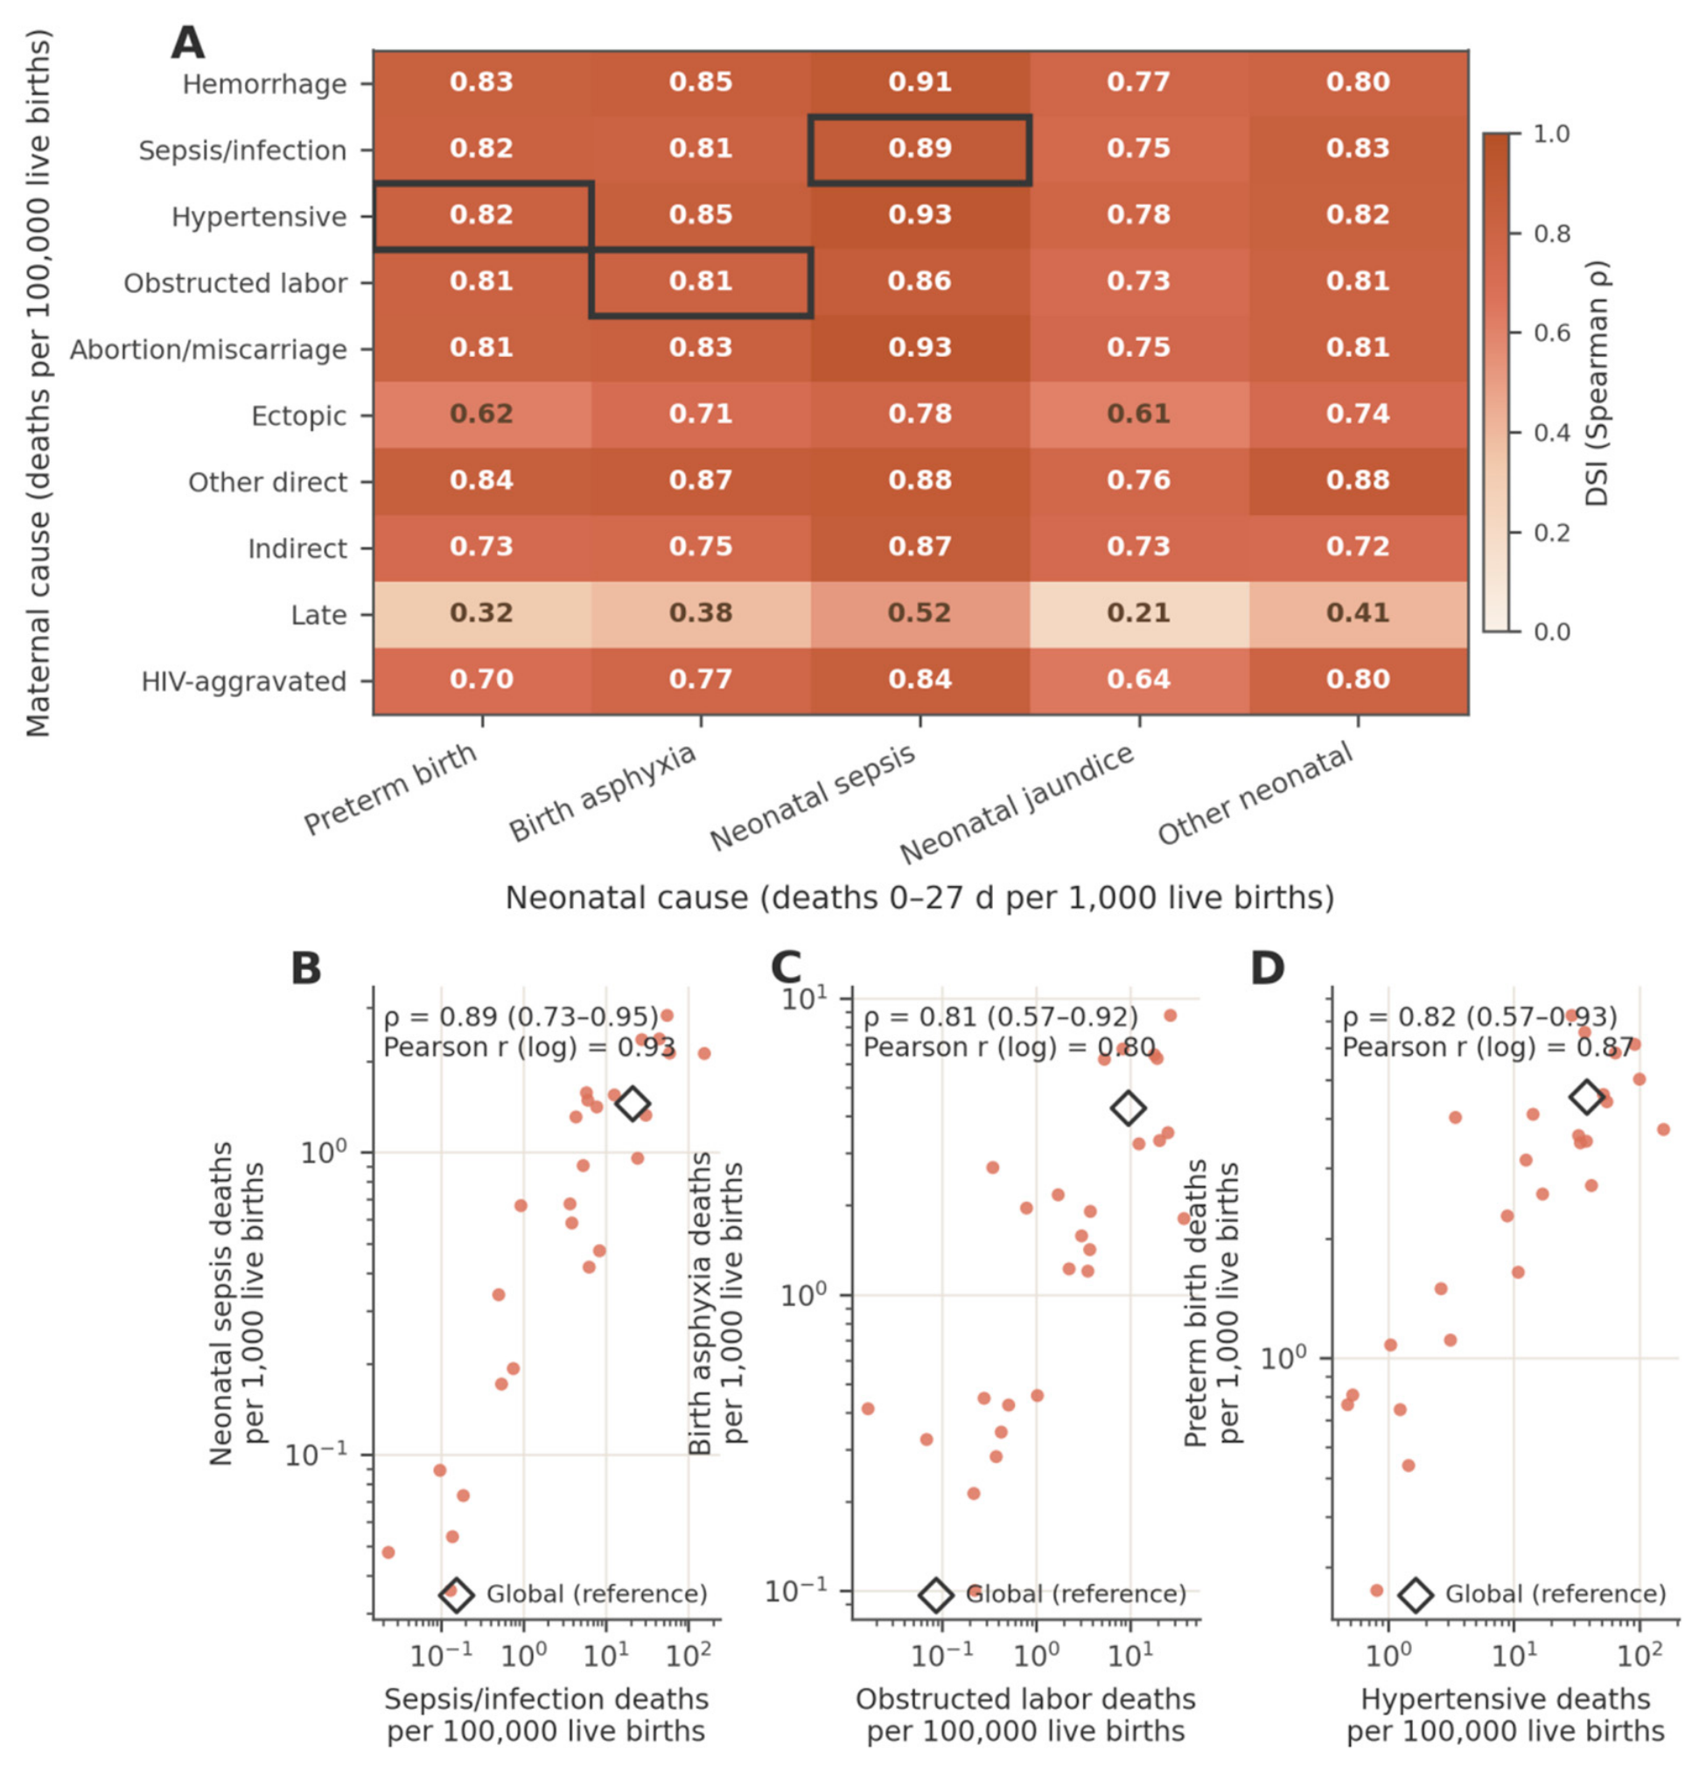
Figure 2.
Orphan pathways: where the dyad logic does not bind. (a) DSI(t) for the three a priori pairs across the six key years (rate calibre, 26 locations): Pair A 0.88–0.93, Pair B 0.80–0.82, Pair C 0.81–0.85 — concordance is stable over 33 years. (b) Share of the 2023 joint dyad toll (1,713,950 deaths) by pairing status: paired causes (the three a priori pairs: maternal 368/369/370 + neonatal 381/382/383) carry 80.2%; the semi-orphan (maternal haemorrhage, 367) carries 3.0%; orphan causes without an a priori partner on the opposite ledger (maternal 995/374/375/376/741/1160 + neonatal 384/385) carry 16.8%. (c) Regional concentration (share of global cause-specific deaths, 2023) of the two largest orphan/semi-orphan causes: maternal haemorrhage — Western sub-Saharan Africa 37.3%, South Asia 23.1%, Eastern sub-Saharan Africa 15.1% (sub-Saharan Africa + South Asia = 83.4%); neonatal jaundice — South Asia 42.8%, Western sub-Saharan Africa 20.9%, Eastern sub-Saharan Africa 16.2% (sub-Saharan Africa + South Asia = 84.3%).
Figure 2.
Orphan pathways: where the dyad logic does not bind. (a) DSI(t) for the three a priori pairs across the six key years (rate calibre, 26 locations): Pair A 0.88–0.93, Pair B 0.80–0.82, Pair C 0.81–0.85 — concordance is stable over 33 years. (b) Share of the 2023 joint dyad toll (1,713,950 deaths) by pairing status: paired causes (the three a priori pairs: maternal 368/369/370 + neonatal 381/382/383) carry 80.2%; the semi-orphan (maternal haemorrhage, 367) carries 3.0%; orphan causes without an a priori partner on the opposite ledger (maternal 995/374/375/376/741/1160 + neonatal 384/385) carry 16.8%. (c) Regional concentration (share of global cause-specific deaths, 2023) of the two largest orphan/semi-orphan causes: maternal haemorrhage — Western sub-Saharan Africa 37.3%, South Asia 23.1%, Eastern sub-Saharan Africa 15.1% (sub-Saharan Africa + South Asia = 83.4%); neonatal jaundice — South Asia 42.8%, Western sub-Saharan Africa 20.9%, Eastern sub-Saharan Africa 16.2% (sub-Saharan Africa + South Asia = 84.3%).
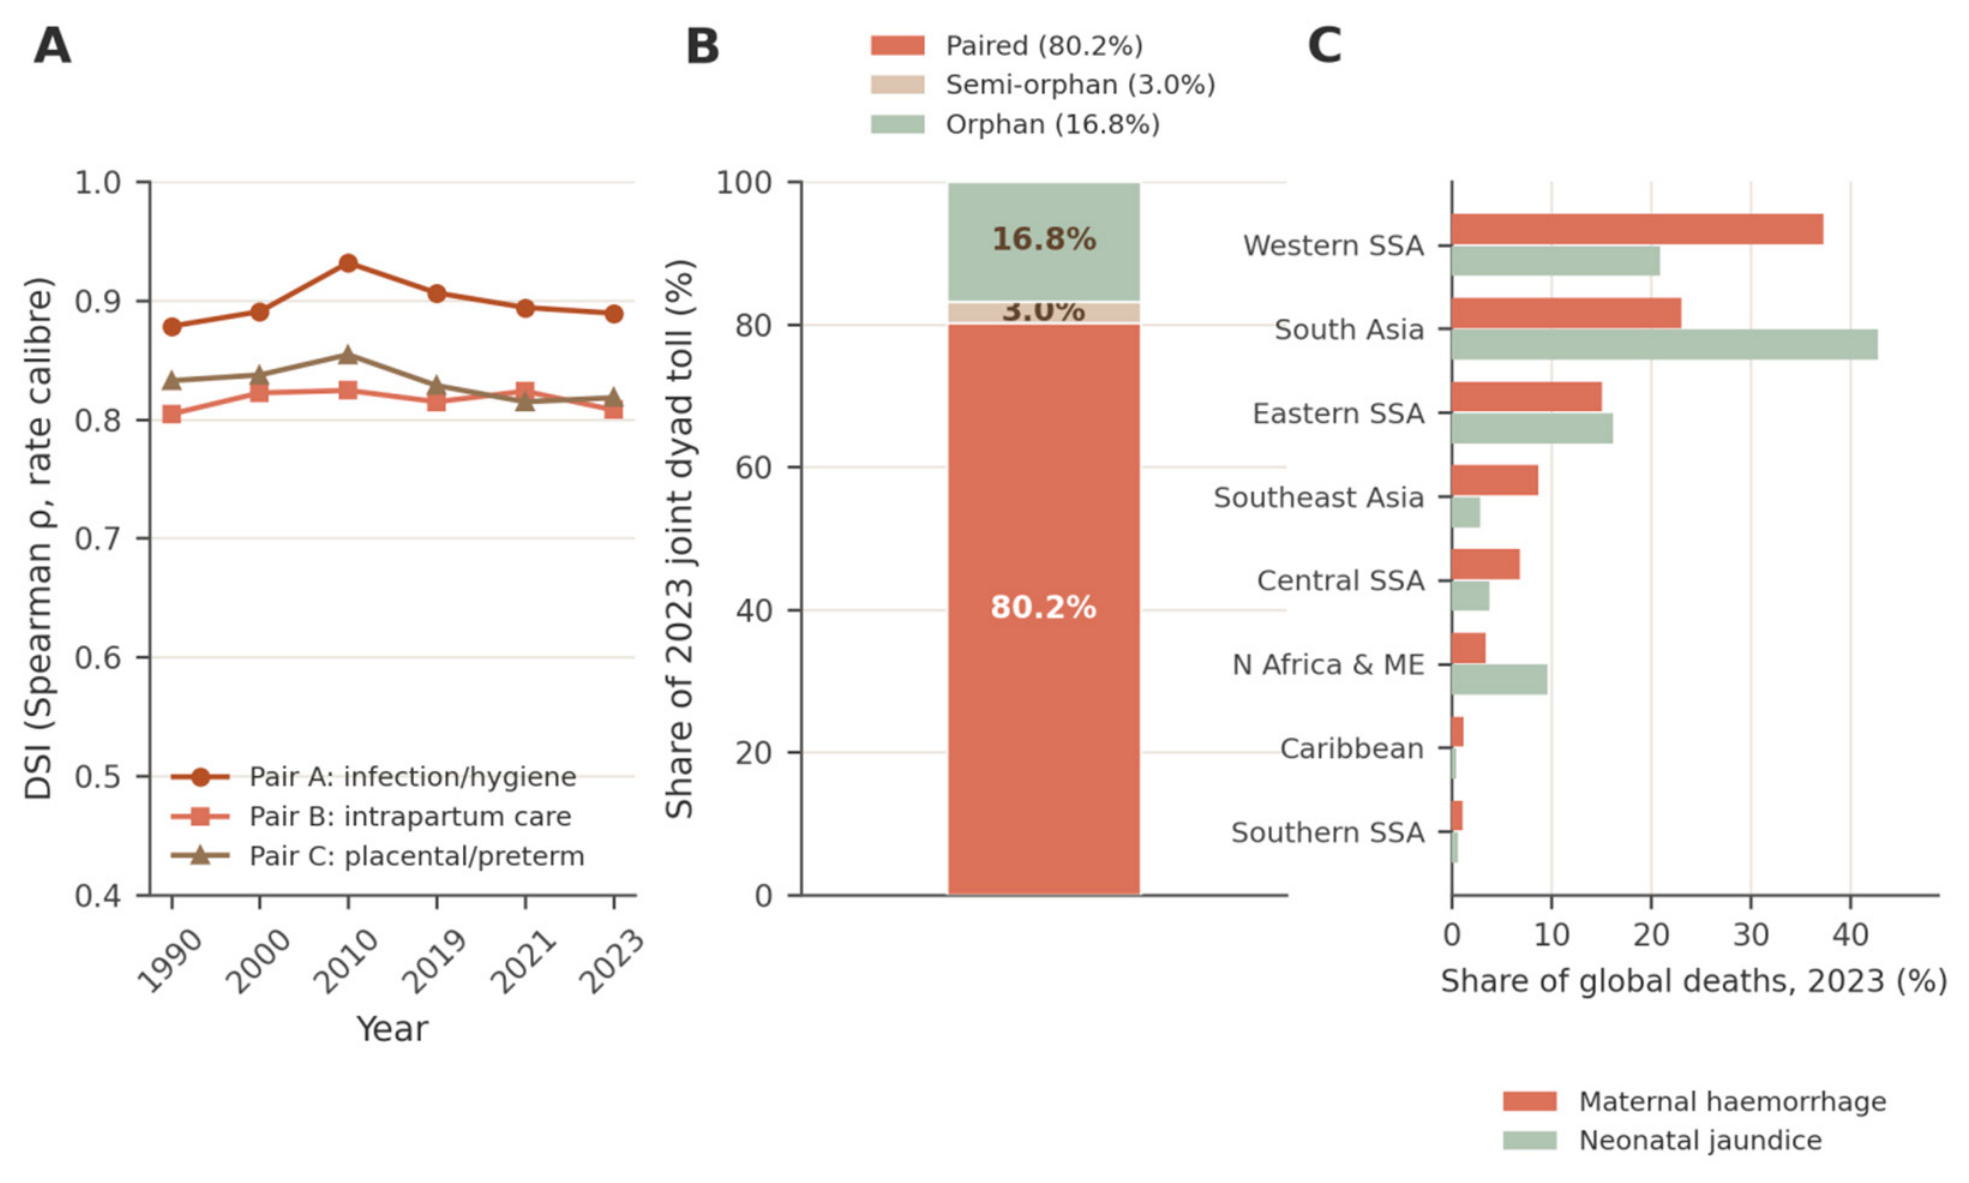
Figure 3.
Two margins of the dyad: exposure versus fatality. (a) Variance shares across the 26 locations, Var(log death rate) = Var(log incidence rate) + Var(log fatality proxy) + 2·Cov, per direct maternal cause, 1990 (left bar) versus 2023 (right bar); fatality proxy = deaths per 1,000 direct-cause episodes (distinct from the MMR, which is per live birth). The fatality margin dominates every cause in both years (2023 fatality share 82–146%); covariance shares are negative for most maternal causes (hatched; ectopic pregnancy −64%, obstructed labour −70%) except hypertensive disorders (+13%). (b) Fatality proxy (deaths per 1,000 episodes) versus exposure (episodes per 100 live births), 7 causes × 5 SDI quintiles, 2023 (log–log): margins separate strongly by SDI (haemorrhage fatality Low SDI 7.63 versus High SDI 0.27 per 1,000, 28-fold). (c) Neonatal sepsis and other neonatal infections (383) two-margin decomposition by fine age (within each age band: left bar = 1990, right bar = 2023; fine-age incidence available only for 383): 0–6 days, 2023 shares exposure 17% / fatality 69% / covariance +15%; 7–27 days 21% / 75% / +4% — late-neonatal sepsis retains the larger fatality margin. (d) Morbidity:mortality ratios (GBD-incidence episodes per death, Global 2023, log scale): abortion/miscarriage 3,246; obstructed labour 778; other direct 384; sepsis/infection 372; hypertensive disorders 316; haemorrhage 191; ectopic pregnancy 185 (maternal); preterm birth 37; neonatal sepsis 20; neonatal jaundice 16; birth asphyxia 1.9 (neonatal). All ratios are GBD-incidence-calibre; GBD contains no severe-morbidity or near-miss data sources, and no ratio may be read as a near-miss ratio. Incidence for preterm birth (381), birth asphyxia (382) and jaundice (384) is an under-5 aggregate (birth-cohort approximation); the high asphyxia fatality proxy (Global 2023 = 514 per 1,000) reflects GBD’s narrow definition of neonatal encephalopathy as moderate-to-severe clinical events.
Figure 3.
Two margins of the dyad: exposure versus fatality. (a) Variance shares across the 26 locations, Var(log death rate) = Var(log incidence rate) + Var(log fatality proxy) + 2·Cov, per direct maternal cause, 1990 (left bar) versus 2023 (right bar); fatality proxy = deaths per 1,000 direct-cause episodes (distinct from the MMR, which is per live birth). The fatality margin dominates every cause in both years (2023 fatality share 82–146%); covariance shares are negative for most maternal causes (hatched; ectopic pregnancy −64%, obstructed labour −70%) except hypertensive disorders (+13%). (b) Fatality proxy (deaths per 1,000 episodes) versus exposure (episodes per 100 live births), 7 causes × 5 SDI quintiles, 2023 (log–log): margins separate strongly by SDI (haemorrhage fatality Low SDI 7.63 versus High SDI 0.27 per 1,000, 28-fold). (c) Neonatal sepsis and other neonatal infections (383) two-margin decomposition by fine age (within each age band: left bar = 1990, right bar = 2023; fine-age incidence available only for 383): 0–6 days, 2023 shares exposure 17% / fatality 69% / covariance +15%; 7–27 days 21% / 75% / +4% — late-neonatal sepsis retains the larger fatality margin. (d) Morbidity:mortality ratios (GBD-incidence episodes per death, Global 2023, log scale): abortion/miscarriage 3,246; obstructed labour 778; other direct 384; sepsis/infection 372; hypertensive disorders 316; haemorrhage 191; ectopic pregnancy 185 (maternal); preterm birth 37; neonatal sepsis 20; neonatal jaundice 16; birth asphyxia 1.9 (neonatal). All ratios are GBD-incidence-calibre; GBD contains no severe-morbidity or near-miss data sources, and no ratio may be read as a near-miss ratio. Incidence for preterm birth (381), birth asphyxia (382) and jaundice (384) is an under-5 aggregate (birth-cohort approximation); the high asphyxia fatality proxy (Global 2023 = 514 per 1,000) reflects GBD’s narrow definition of neonatal encephalopathy as moderate-to-severe clinical events.
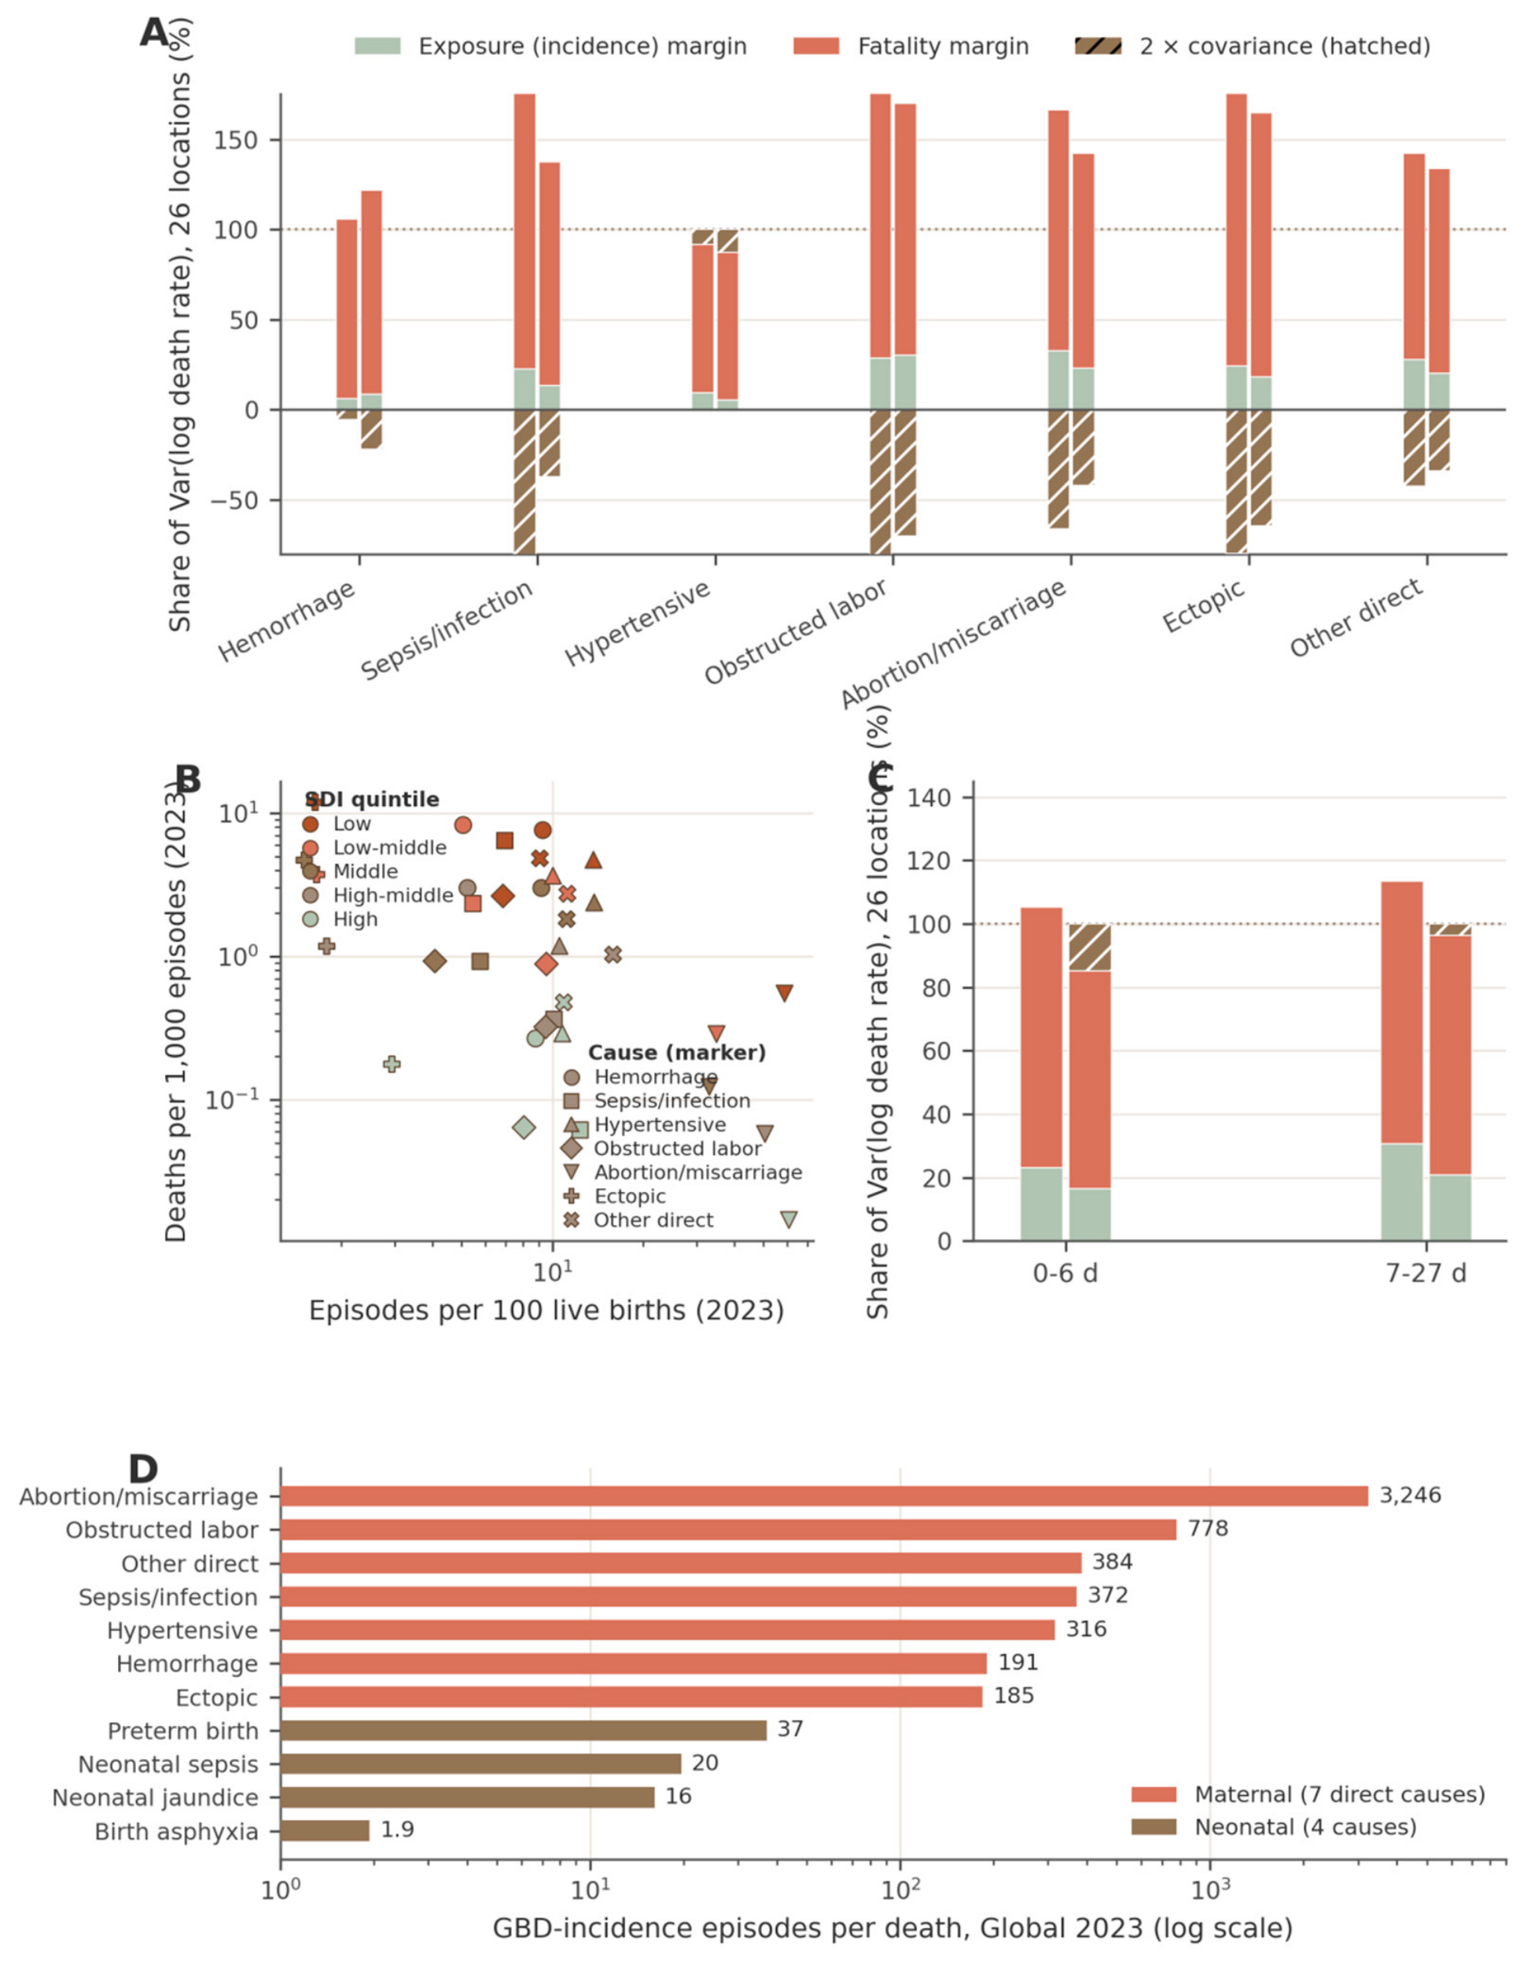
Figure 4.
The avoidable dyad: best-frontier counterfactual, 2023. (a) Deaths per 1,000 episodes by SDI quintile (log scale), 7 direct maternal causes (solid) + 4 neonatal causes (dashed); stars mark the frontier (2023 best quintile = High SDI for every cause). (b) Avoidable deaths by SDI quintile, stacked by cause (thousands): maternal 7 direct causes 190,766 of 207,003 = 92.2%; neonatal 4 causes 963,052 of 1,310,301 = 73.5%; combined 1,153,818 of 1,517,304 = 76.0%. Per cause: maternal sepsis 97.7%, ectopic pregnancy 96.7%, abortion/miscarriage 95.3%, obstructed labour 95.0%, haemorrhage 94.9%, other direct 81.5% (lowest); neonatal jaundice 88.6%, birth asphyxia 81.8%, neonatal sepsis 78.6%, preterm birth 63.4% (lowest). The Low SDI quintile alone holds 73.6% of maternal and 60.8% of neonatal avoidable deaths. (c) Frontier gap (avoidable share of observed deaths) by quintile and ledger: Low SDI 96% maternal / 78% neonatal; Low-middle 92/79; Middle 87/66; High-middle 75/54; High 0/0 by construction. The frontier is the lowest 2023 cause-specific fatality rate among the five SDI quintiles; avoidable deaths = observed deaths − episodes × frontier rate, truncated at zero, holding exposure fixed; every figure is an upper-bound marker of unattained performance, not a programme target. Causes without incidence (375/376/741/385) cannot enter. Uncertainty intervals not propagated for sums.
Figure 4.
The avoidable dyad: best-frontier counterfactual, 2023. (a) Deaths per 1,000 episodes by SDI quintile (log scale), 7 direct maternal causes (solid) + 4 neonatal causes (dashed); stars mark the frontier (2023 best quintile = High SDI for every cause). (b) Avoidable deaths by SDI quintile, stacked by cause (thousands): maternal 7 direct causes 190,766 of 207,003 = 92.2%; neonatal 4 causes 963,052 of 1,310,301 = 73.5%; combined 1,153,818 of 1,517,304 = 76.0%. Per cause: maternal sepsis 97.7%, ectopic pregnancy 96.7%, abortion/miscarriage 95.3%, obstructed labour 95.0%, haemorrhage 94.9%, other direct 81.5% (lowest); neonatal jaundice 88.6%, birth asphyxia 81.8%, neonatal sepsis 78.6%, preterm birth 63.4% (lowest). The Low SDI quintile alone holds 73.6% of maternal and 60.8% of neonatal avoidable deaths. (c) Frontier gap (avoidable share of observed deaths) by quintile and ledger: Low SDI 96% maternal / 78% neonatal; Low-middle 92/79; Middle 87/66; High-middle 75/54; High 0/0 by construction. The frontier is the lowest 2023 cause-specific fatality rate among the five SDI quintiles; avoidable deaths = observed deaths − episodes × frontier rate, truncated at zero, holding exposure fixed; every figure is an upper-bound marker of unattained performance, not a programme target. Causes without incidence (375/376/741/385) cannot enter. Uncertainty intervals not propagated for sums.
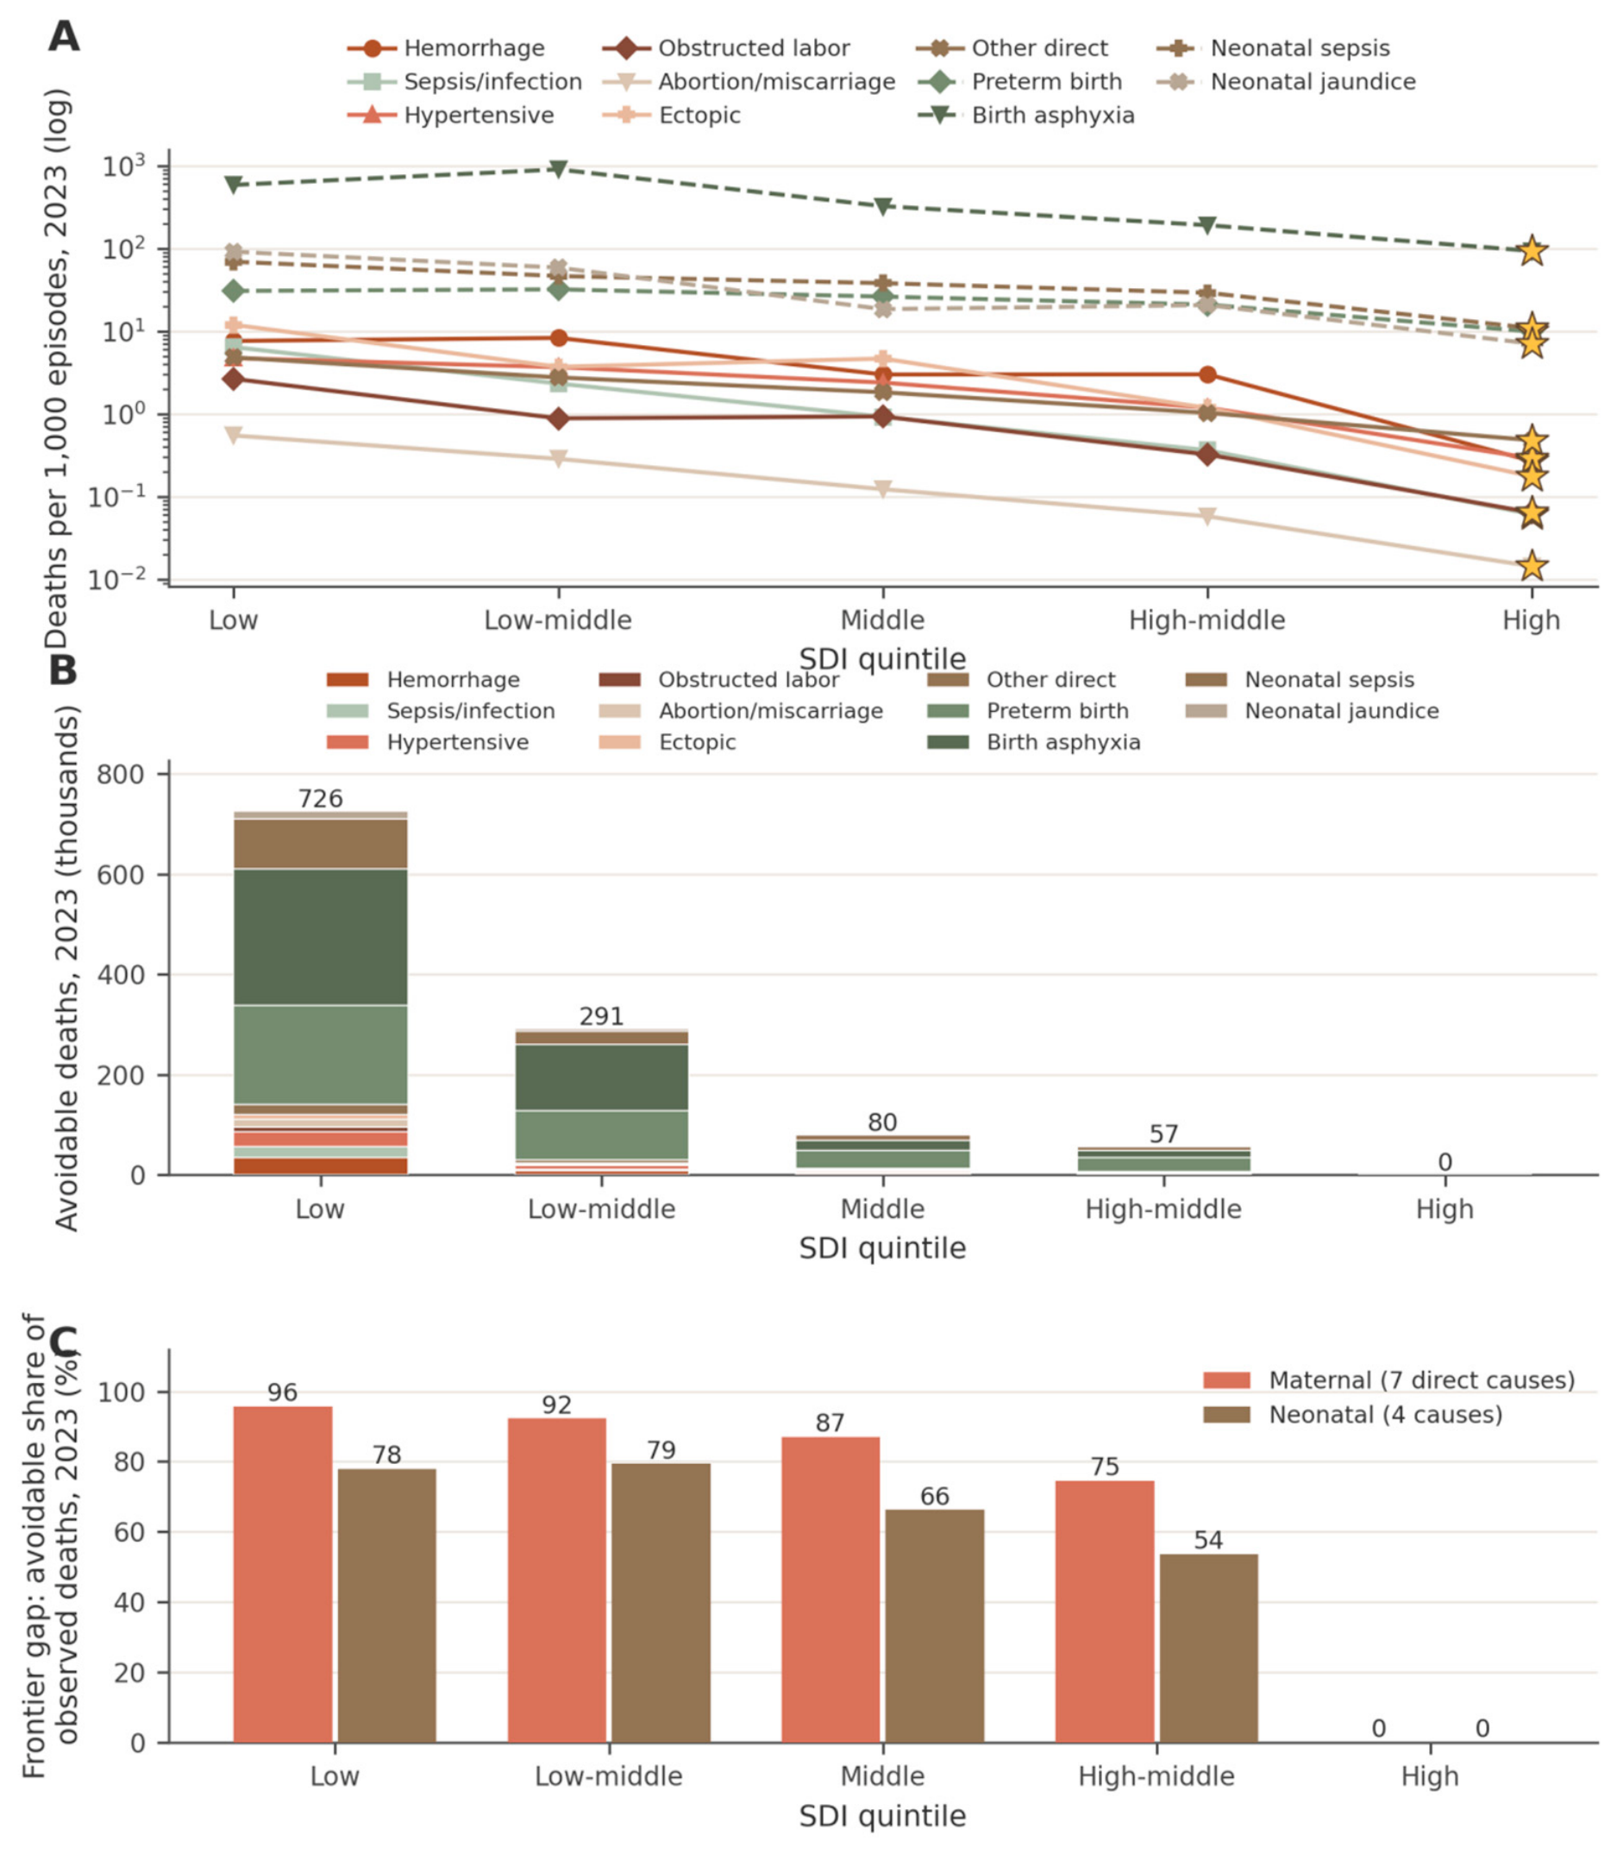

Table 1.
The avoidable dyad, 2023: avoidable deaths at the best-frontier (High SDI) cause-specific fatality rate, by cause (upper-bound estimates).
Table 1.
The avoidable dyad, 2023: avoidable deaths at the best-frontier (High SDI) cause-specific fatality rate, by cause (upper-bound estimates).
| Ledger / cause | Frontier location | Frontier CFR (per 1,000 episodes) | Avoidable deaths | Total deaths (5 SDI quintiles) | Avoidable (% of observed) |
|---|---|---|---|---|---|
| Maternal (7 direct causes) | |||||
| Haemorrhage | High SDI | 0.3 | 49,270.5 | 51,935.6 | 94.9 |
| Sepsis/infection | High SDI | 0.1 | 26,110.0 | 26,716.4 | 97.7 |
| Hypertensive disorders | High SDI | 0.3 | 43,716.6 | 48,147.2 | 90.8 |
| Obstructed labour | High SDI | 0.1 | 11,554.9 | 12,161.6 | 95.0 |
| Ectopic pregnancy | High SDI | 0.2 | 12,294.3 | 12,707.4 | 96.7 |
| Abortion/miscarriage | High SDI | 0.0 | 18,711.8 | 19,630.6 | 95.3 |
| Other direct | High SDI | 0.5 | 29,107.7 | 35,703.9 | 81.5 |
| Maternal total (7 direct) | 190,766 | 207,003 | 92.2 | ||
| Neonatal (4 causes with incidence) | |||||
| Preterm birth | High SDI | 9.9 | 360,116 | 568,421 | 63.4 |
| Birth asphyxia | High SDI | 93.3 | 438,538 | 535,807 | 81.8 |
| Neonatal jaundice | High SDI | 7.1 | 21,304.8 | 24,040.7 | 88.6 |
| Neonatal sepsis | High SDI | 10.9 | 143,094 | 182,033 | 78.6 |
| Neonatal total (4 causes) | 963,052 | 1,310,301 | 73.5 |
Notes: frontier = lowest 2023 cause-specific CFR among the five SDI quintiles (High SDI throughout); avoidable deaths = observed deaths − episodes × frontier CFR, truncated at zero; the CFR-frontier method holds exposure fixed; preterm/asphyxia/jaundice incidence uses the under-5 aggregate (approximating birth-cohort episodes); maternal indirect/late/HIV and other neonatal disorders are not computable (no incidence). All figures are upper-bound markers of unattained performance; UIs not propagated for sums.
Disclaimer/Publisher’s Note: The statements, opinions and data contained in all publications are solely those of the individual author(s) and contributor(s) and not of MDPI and/or the editor(s). MDPI and/or the editor(s) disclaim responsibility for any injury to people or property resulting from any ideas, methods, instructions or products referred to in the content. |
© 2026 by the author. Licensee MDPI, Basel, Switzerland. This article is an open access article distributed under the terms and conditions of the Creative Commons Attribution (CC BY) license.
Copyright: This open access article is published under a Creative Commons CC BY 4.0 license, which permit the free download, distribution, and reuse, provided that the author and preprint are cited in any reuse.