

Submitted:
27 October 2026
Posted:
28 October 2026
You are already at the latest version
Abstract
Background: Survival after childhood cancer is strikingly unequal across the development spectrum, yet population-based cancer registries, the gold standard for survival measurement, are absent or incomplete in most low- and middle-income countries (LMICs), precisely where the burden is concentrated. The World Health Organization (WHO) Global Initiative for Childhood Cancer (GICC) targets at least 60% survival by 2030, but no registry-free, annually updatable, internationally comparable tracer of childhood cancer care-system performance is currently in routine use. We evaluated the mortality-to-incidence ratio (M/I), computed from Global Burden of Disease (GBD) estimates, as such a tracer.Methods: We extracted deaths and incident cases (ages 0–19 years, both sexes, 1990–2023) for leukemia, retinoblastoma, and a 14-cause aggregate aligned with the International Classification of Childhood Cancer from GBD 2023. M/I was computed as deaths divided by incidence, with Monte Carlo propagation of uncertainty intervals (UIs). A cure gap index was defined as the ratio of low-SDI to high-SDI M/I. External validity was assessed by reconciliation against registry-based survival anchors (CONCORD-3; China's National Childhood Cancer Surveillance annual report) and against the expected direction of the socio-demographic index (SDI) gradient, under an explicit construct-difference framework. Sensitivity to incidence under-ascertainment was quantified with scenario corrections (u = 0–43%).Results: Global leukemia M/I declined monotonically from 62.7% in 1990 to 46.6% (95% UI 37.1–60.1) in 2023 (estimated annual percentage change [EAPC] −0.975% per year). In 2023, M/I fell monotonically across SDI quintiles for all three calibers (leukemia 66.99% in low-SDI vs 24.35% in high-SDI countries; retinoblastoma 93.57% vs 7.23%; 14-cause aggregate 55.67% vs 19.15%), and across 21 GBD regions leukemia M/I ranged 6.5-fold, from 72.5% (Oceania) to 11.2% (Western Europe). The cure gap index widened from 1.38× to 2.75× for leukemia (average +2.47% per year, decelerating to about +1.3% per year over the most recent decade) and from 3.07× to 12.95× for retinoblastoma. Criterion reconciliation was direction-consistent throughout: the GBD-modeled retinoblastoma M/I for China (8.6%) lay within 1.0 percentage point (pp) of the registry-implied case fatality (9.6%), and regional implied survival (1 − M/I) tracked the CONCORD-3 anchors across their full range (49.8–95.2%), including a near-exact agreement for Andean Latin America (49.77% vs Ecuador 49.8%, a 0.03 pp difference) that we treat as partly endogenous corroboration rather than independent validation. Under a 43% global-average under-ascertainment scenario the inequality persisted (corrected gap indices 1.57×–7.38×), and it persisted even at the western African regional rate of 57% (leukemia gap index 1.18×).Conclusion: The M/I is a smooth, annually updatable, registry-free tracer whose levels, gradients, and trends corroborate independent survival evidence. It cannot replace registry-based survival, but it can monitor the cure gap, and its widening, in the many settings where registries do not yet exist.
Keywords:
childhood cancer
; mortality-to-incidence ratio
; health system performance
; equity monitoring
; global burden of disease
; WHO global initiative for childhood cancer
Introduction
Cancer in children and adolescents is biologically distinct from adult cancer: it is rarely preventable, frequently curable, and highly sensitive to the performance of the health system into which a child happens to be born. In 2023, an estimated 377,000 (95% uncertainty interval [UI] 288,000–489,000) new cancers were diagnosed among people aged 0–19 years worldwide, and these diseases caused 144,000 (131,000–162,000) deaths.[1] Behind these totals lies one of the widest outcome gradients in global health. Simulation-based estimates anchored in registry data put global five-year net survival from childhood cancer at approximately 37.4%, but ranging from 8.1% in eastern Africa to 83.0% in North America.[2] The CONCORD-3 program, the largest registry-based survival surveillance effort, documented five-year net survival for childhood acute lymphoblastic leukemia (ALL) in 2010–2014 spanning from 49.8% in Ecuador to 95.2% in Finland.[3] For a group of diseases that is largely curable with established therapy, survival is, in effect, a readout of care-system performance.
Measuring that performance, however, is hardest exactly where it matters most. Population-based cancer registries, the only source of unbiased, cohort-based net survival, cover a small and unrepresentative fraction of the population in most low- and middle-income countries (LMICs), and childhood cases are few enough that sub-national registries rarely yield stable estimates. The CONCORD program itself, despite two decades of expansion, includes only a minority of countries in Africa and South Asia, and global incidence estimation exercises have concluded that roughly 43% of childhood cancers worldwide are never diagnosed at all, with under-ascertainment concentrated in low-income settings.[4] Even CONCORD-3, for all its reach, rests on 322 registries in 71 countries,[3] leaving the majority of the world’s childhood cancer burden outside direct survival surveillance. In such settings, neither survival nor even incidence can be observed directly; the monitoring infrastructure and the monitoring problem are the same problem.
This measurement gap has acquired operational significance since 2018, when the World Health Organization (WHO) launched the Global Initiative for Childhood Cancer (GICC), with the goal of reaching at least 60% survival for children with cancer globally by 2030.[5] Tracking progress toward that target requires indicators that are annual, comparable across countries, and available for countries without registries. Existing instruments fall short on one or more of these criteria: CONCORD delivers gold-standard net survival — most recently through the CONCORD-4 Cancer Survival Index, purpose-built to track the 60% target across the 68 countries with participating registries [6] — but only for registry-covered populations and in multi-year cycles; GLOBOCAN provides incidence and mortality estimates for all countries but is published at roughly two- to four-year intervals and does not target the childhood age band specifically; [7] and model-based survival syntheses, while invaluable, are not designed as annually refreshed monitoring tools.[2] On the input side, a composite vulnerability index of the determinants of delayed childhood cancer care has been proposed as a CureAll-aligned policy tool,[8] but it tracks the drivers of delay rather than outcomes, and it is not annually updatable from a single estimation cycle. A pragmatic tracer (one that sacrifices none of the population coverage, updates with each annual estimation cycle, and moves in the right direction when systems improve) would fill a genuine policy need.
The mortality-to-incidence ratio (M/I) is a candidate with a long pedigree in adult cancer surveillance, where it has been used as a proxy for fatality when survival is unavailable, a proxy use that has been challenged directly on construct grounds.[9] For childhood cancer it has been reported descriptively by national income group,[10] and a recent GBD 2021 analysis computed mortality-to-incidence ratios for 25 childhood cancers across the development spectrum, including a 31.8-fold low-versus-high-SDI disparity for eye cancer — a descriptive analogue of the retinoblastoma sentinel we use below.[11] That analysis was purely descriptive, however: it attempted no reconciliation against registry-based survival, no correction for incidence under-ascertainment, and no equity-gap time series or monitoring architecture, and it used medians of country ratios rather than ratio-of-counts on an ICCC-aligned cause list. The M/I has therefore rarely been examined systematically as a care-system tracer, and its external validity against registry-based survival in low-income settings has not, to our knowledge, been tested. The M/I requires only deaths and incident cases for the same population and period, quantities that the Global Burden of Disease (GBD) study estimates annually for every country, and therefore inherits GBD’s universality and update cycle. But a ratio of two modeled quantities is not self-evidently a valid performance signal: incidence denominators are themselves uncertain where registration is weak, and the ratio conflates case finding, stage at diagnosis, and treatment outcomes.
We therefore set out to construct, validate, and operationalize the childhood cancer M/I as a monitoring indicator, in three steps. First, we built the indicator at three calibers — leukemia (the largest single childhood cancer group, with relatively robust ascertainment), retinoblastoma (an extreme-sensitivity sentinel, near-universally curable in high-income settings), and a 14-cause aggregate aligned with the International Classification of Childhood Cancer (ICCC) — across the full GBD 2023 time series, 1990–2023. Second, we tested three validation logics, each chosen to probe a different failure mode of the ratio: (i) temporal coherence, whether the global series declines smoothly in step with known therapeutic progress, rather than jumping with estimation artifacts; (ii) gradient direction, whether cross-sectional M/I falls monotonically with socio-demographic development, as any plausible performance signal must — recognizing that in data-poor settings this property is partly mechanical, a caveat we quantify in Methods; and (iii) criterion reconciliation, whether implied survival (1 − M/I) is quantitatively concordant with independent registry-based survival anchors, recognizing that the two quantities measure different constructs. Third, we quantified the indicator’s robustness to incidence under-ascertainment, the single most important threat to its validity in low-income settings, and assembled the pieces into an annually updatable monitoring framework. That framework includes a cure gap index, the ratio of low-SDI to high-SDI M/I, designed to track whether the survival divide is closing on the road to the WHO 2030 target, and reporting norms intended to prevent the ratio from being misread as a survival probability.
Methods
Data Sources
We used estimates from the Global Burden of Disease Study 2023 (GBD 2023), accessed through the GBD Results Tool,[12] for deaths and incident cases of cancer at ages 0–19 years (aggregated across the four GBD childhood and adolescent age bands), both sexes combined, for the years 1990–2023, at four geographic levels: global, five socio-demographic index (SDI) quintiles, 21 GBD regions, and (for the China anchor) national. GBD 2023 estimates cause-specific mortality using ensemble models of vital registration, verbal autopsy, and cancer registry data (CODEm), and estimates cancer incidence by modeling registry incidence-to-mortality ratios and applying them to the mortality estimates;[13,14] both quantities therefore carry model-based uncertainty that we propagate below. This data-generating process has a direct implication for interpretation: where no registry informs the incidence-to-mortality model, both numerator and denominator of the M/I borrow strength from covariates and regional patterns, so the ratio is best read as a smoothed, model-based tracer rather than a direct measurement. The childhood cancer estimation framework and cause list for GBD 2023 are described in the capstone publication.[1]
Three calibers were defined. (1) Leukemia: the GBD leukemia cause aggregate, the largest single contributor to childhood cancer incidence and mortality and the caliber with the broadest registry underpinning. (2) Retinoblastoma: a single, near-exclusively pediatric cancer that is almost uniformly fatal untreated and curable in over 95% of cases where early diagnosis and modern treatment are available, making it an extreme-sensitivity sentinel of system performance. (3) Fourteen-cause aggregate: deaths and incidence summed across the 14 ICCC-aligned GBD cancer causes[15] before taking the ratio, providing the statistically most stable caliber. All analyses used the point-estimate convention of summing age-band counts and taking the ratio of totals, consistent with the underlying GBD childhood cancer tabulations.
Indicator Construction and Uncertainty
The M/I was computed as deaths divided by incident cases, multiplied by 100, for the same population and calendar year. Uncertainty was propagated by Monte Carlo simulation: we drew from the GBD draw-level distributions of deaths and incidence, formed draw-level M/I values, and took the 2.5th and 97.5th percentiles as the 95% UI. For the 14-cause aggregate, deaths and incidence were summed across causes at the draw level before ratio formation, so that covariance across causes is preserved.
Temporal change was summarized as the estimated annual percentage change (EAPC), obtained by ordinary least squares regression of the natural logarithm of M/I on calendar year (EAPC = 100 × [exp(β) − 1], with 95% confidence intervals from β ± 1.96 × SE). The narrowness of these intervals matters for monitoring: an annual tracer is only useful if genuine year-on-year movement exceeds estimation noise, so we report the EAPC standard error as an explicit signal-to-noise check. A cure gap index was defined as the ratio of the low-SDI-quintile M/I to the high-SDI-quintile M/I in each year; point estimates were computed from the summed counts and cross-checked against Monte Carlo ratio-of-draws estimates, with point estimates and Monte Carlo medians agreeing to one decimal place in all headline values (for example, 2.75 vs 2.74 for leukemia, a small difference arising from the right-skewed distribution of the draw-level ratio). All computations were performed in Python (pandas, NumPy); the full tabulation chain, from raw GBD extracts to every number reported here, is archived with the analysis package for auditability.
Joinpoint Segmentation and Inequality Indices
As complements to the single-slope EAPC, continuous segmented log-linear (joinpoint) models were fitted to ln(M/I) on calendar year for the leukemia caliber, globally and by SDI quintile, 1990–2023 (0–3 joinpoints, exhaustive grid search with a minimum of four observations per segment, BIC selection; segment APCs and span-weighted AAPCs with t-distribution 95% CIs reflecting regression precision only; Supplementary Table S5). Absolute and relative inequality of the leukemia M/I across the five SDI quintiles was summarized for 1990 and 2023 by the slope index of inequality (SII; population-weighted ridit regression) and the concentration index (CII), with 95% CIs from 1,000 Monte Carlo draws propagating death- and incidence-rate uncertainty (truncated normal, SD = [upper − lower]/3.92) (Supplementary Table S6). These are quintile-level analogues of the WHO Health Equity Monitor indices; the trend extraction frame (27 aggregate locations) does not support country-level SII/CII.
External Criterion Reconciliation
M/I and registry-based net survival measure different constructs. Net survival (as in CONCORD-3) is a cohort-based quantity estimated among diagnosed cases in defined registration periods, isolating deaths attributable to the cancer;[3] the M/I is a period ratio of two system-level counts that additionally embeds case ascertainment, the curability mix of diagnosed disease, and deaths occurring more than five years after diagnosis. We therefore designed the validation as corroboration across different constructs, not a test of equivalence: we required directional agreement and plausible magnitudes, not numerical identity. One structural feature limits the independence of these exercises: because GBD incidence is modeled in part by applying registry incidence-to-mortality ratios to mortality estimates (see Data Sources), the GBD estimates for data-rich settings, which are precisely the settings where the CONCORD-3 and NCPCS anchors exist, share underlying registry information with those anchors. Agreement at the 0.03–1.0 pp level is therefore partly endogenous corroboration arising from the data-generating process rather than fully independent validation. The same caveat extends to the development gradient itself: where no registry informs the incidence-to-mortality model, GBD incidence is derived from mortality through modeled mortality-to-incidence ratios driven by development covariates, so in data-poor settings a monotone M/I gradient across SDI quintiles contains a mechanical component and cannot be read as independent validation; we accordingly treat monotonicity as a necessary consistency property only, place the gradient’s evidential weight on its magnitude and ordering, and subject the mechanical-construction hypothesis to a direct falsification test (exercise 4 below). Four reconciliation exercises were pre-specified:
- Regional anchors (CONCORD-3). For GBD regions containing countries with published CONCORD-3 childhood ALL five-year net survival for 2010–2014,[3] we compared 1 − M/I (leukemia, 2023) against the corresponding national anchors (Ecuador, 49.8%; Finland, 95.2%), expecting direction consistency and level gaps explicable by construct difference, region-versus-country aggregation, and the 2010–2014 versus 2023 time-window offset.
- National anchor (China). For retinoblastoma in China, a setting with functioning national childhood cancer surveillance, we compared the GBD 2023 modeled M/I (2023) against the implied case fatality (100 − five-year survival) from the National Center for Children’s Cancer Surveillance (NCPCS) 2024 annual report cohort (five-year survival 90.40%).[16]
- Gradient check. We compared 1 − M/I across three strata (low SDI, global, high SDI) against the corresponding literature survival anchors (eastern Africa 8.1%, global 37.4%, North America 83.0%, as synthesized by Ward and colleagues from CONCORD data)[2] and required monotone directional agreement.
- Registry-informed subset falsification. To test directly whether the development gradient is an artifact of the incidence-modeling chain, we restricted the country-level gradient analyses to the 68 countries and territories participating in CONCORD-4,[6] where population-based childhood cancer registries provide observed data that inform the GBD incidence estimates. Within this subset (63 countries mappable to GBD national locations; the four French overseas territories and Liechtenstein are not separate GBD locations) we recomputed the country-level SDI-quintile gradient, the 21-region M/I ranking, and the country-level correlation of M/I with the UHC service coverage index, each compared against the full 204-country set computed identically. Country-level analyses use 2022, the most recent year for which national extracts were assembled; the full-set benchmark was recomputed at country level for the same year, so the comparison is internal and unaffected by the 2022 versus 2023 difference. If the gradient were purely a mechanical product of covariate-driven incidence modeling, it should collapse or markedly weaken within registry-informed countries.
Under-Ascertainment Scenario Correction
Because undiagnosed cases enter neither the incidence denominator nor (fully) the mortality numerator, reported M/I is plausibly an upper bound on the true fatality ratio in low-income settings. Ward and colleagues estimated that approximately 43% of childhood cancers worldwide go undiagnosed, concentrated in low-SDI countries, with regional estimates reaching 57% in western Africa.[4] If a fraction u of true incident cases is uncounted, true incidence equals reported incidence divided by (1 − u), and the corrected M/I equals the reported M/I multiplied by (1 − u). We applied u ∈ {0, 0.10, 0.20, 0.43, 0.57} to the low-SDI series of each caliber (holding high-SDI values fixed, since under-ascertainment there is assumed negligible) and recomputed the cure gap index under each scenario.
Development Proxy for Regional Correlation
To display regional M/I against an independent development axis, we used the WHO/World Bank universal health coverage (UHC) service coverage index (2021 round)[17] at country level, mapped countries to GBD regions using the IHME hierarchy, and aggregated to the 21 GBD regions by total-population weighting. Taiwan could not be mapped, and 11 small territories lacking UHC index values were excluded. This axis is a UHC-based proxy, not the GBD SDI, which is not published at the regional level in numeric form.
Reporting
The study uses publicly available, de-identified, aggregate estimates; no ethics approval was required. Reporting follows the Guidelines for Accurate and Transparent Health Estimates Reporting (GATHER).[18] All indicator values, uncertainty intervals, and self-checks are archived in the analysis package.
Results
A Smooth, Annually Resolvable Global Series
The global leukemia M/I declined from 62.7% in 1990 to 46.6% (95% UI 37.1–60.1) in 2023, an EAPC of −0.975% per year (95% CI −1.019 to −0.932) (Table 1; Figure 1a). The series declined monotonically across all 34 years with no reversal, satisfying the smoothness requirement of an annual tracer; the EAPC precision (±0.04 pp around the estimate) implies that year-on-year changes of a fraction of a percentage point are statistically resolvable. The 14-cause aggregate declined from 52.8% to 38.1% (EAPC −1.034% per year, −1.065 to −1.002), and the retinoblastoma M/I declined fastest of all (EAPC −1.616% per year, −1.736 to −1.495), consistent with the known trajectory of therapeutic progress in childhood leukemia19,20 and with the income-stratified retinoblastoma outcomes reported prospectively.21
A Monotone Development Gradient, Steepest for the Most Curable Cancer
In 2023, all three calibers exhibited a strictly monotone M/I gradient across SDI quintiles (Table 1; Figure 1b). For leukemia, M/I ranged from 66.99% in low-SDI countries to 24.35% in high-SDI countries; for the 14-cause aggregate, from 55.67% to 19.15%. The retinoblastoma gradient was the steepest by a wide margin: from 93.57% in low-SDI settings, approaching the natural history of the untreated disease, to 7.23% in high-SDI settings, approaching the curability frontier. This ordering (retinoblastoma steepest, leukemia intermediate, 14-cause aggregate most stable) is itself informative: the more completely a cancer’s outcome is determined by system-delivered treatment rather than by biology, the wider the development gradient of its M/I.
Across the 21 GBD regions in 2023 (Table 2; Figure 1c), the leukemia M/I spanned 6.5-fold, from 72.5% in Oceania, 69.5% in eastern sub-Saharan Africa, and 67.9% in central sub-Saharan Africa down to 11.2% in Western Europe, 13.7% in Australasia, and 14.7% in high-income Asia Pacific. Regional M/I tracked the population-weighted UHC service coverage index closely (Figure 1c), with regions covered by CONCORD-3 registries clustering at the low-M/I, high-coverage end.
A Cure Gap That Is Widening Even as the Global Mean Improves
The cure gap index, the ratio of low-SDI to high-SDI M/I, widened across the study period (Table 1; Figure 1d). For leukemia it rose from 1.38× in 1990 to 2.75× in 2023 (Monte Carlo estimate 2.74×), an average widening of +2.472% per year (95% CI 2.346–2.598) by OLS regression of the log index on year. The widening was not uniform: it was fastest between the mid-2000s and early 2010s (+3.6% per year over 2003–2013) and has decelerated since, to +1.3% per year over 2013–2023 and +1.1% per year over 2016–2023 as the high-SDI denominator approaches low levels, with the index plateauing near 2.7×–2.8× since 2020 without a durable reversal. The OLS estimate accordingly exceeds the endpoint-implied average (+2.1% per year), and we report both rather than projecting the fitted trend onto the endpoints. For the 14-cause aggregate the index rose from 1.74× to 2.91×, and for retinoblastoma from 3.07× to 12.95× (Monte Carlo 13.0×) — the widest and fastest-widening inequality fault line among the calibers examined. The widening is arithmetic evidence that improvements in childhood cancer outcomes over 1990–2023 accrued disproportionately to high-SDI populations: both ends of the development spectrum improved, but the high-SDI end improved faster.
Joinpoint Segmentation and Concentration Indices: The Widening, Quantified
Segmented models of the global leukemia M/I series placed the most recent joinpoint at 2019 (Supplementary Table S5): the decline slowed from −0.96% per year (95% CI −0.98 to −0.93) over 2008–2019 to −0.64% (−0.73 to −0.54) over 2019–2023 (AAPC 1990–2023 −0.89% [−0.90 to −0.88]). The late-period flattening was graded by development: the high-SDI series, also joining at 2019, decelerated from −2.53% (−2.63 to −2.42) to −0.60% (−0.95 to −0.24) per year, while the low-SDI series improved only slowly throughout (−0.38% [−0.40 to −0.36] per year after 2013, with no pandemic-window joinpoint). Inequality indices independently confirmed the widening cure gap (Supplementary Table S6): the SII of the leukemia M/I deepened from −25.9 percentage points (95% CI −55.1 to +0.3) in 1990 to −57.1 (−84.9 to −34.4) in 2023, and the CII from −0.064 (−0.128 to +0.001) to −0.176 (−0.239 to −0.107)—in 1990 the excess fatality burden of lower-SDI settings was not statistically distinguishable from zero; by 2023 it was large and significant.
All four pre-specified reconciliation exercises returned direction-consistent results (Table 3; Supplementary Table S7). We emphasize that these exercises were designed to falsify, not to confirm: had the implied survival for a registry-covered region fallen wildly outside the range bracketed by CONCORD-3 anchors, had the gradient reversed in any stratum, or had the gradient collapsed within registry-informed countries, the tracer would have failed the test. No such failure occurred.
First, at the regional level, the implied survival for Andean Latin America (1 − M/I = 49.77%) matched the CONCORD-3 childhood ALL net survival anchor for Ecuador (49.8%, 2010–2014) within 0.03 pp, a near-exact numerical agreement that we flag as partly coincidental at this precision, but which corroborates both direction and magnitude. For high-income North America and Western Europe, implied survival (76.18% and 88.83%) fell below the best-performing CONCORD-3 anchor (Finland, 95.2%) by 19.02 and 6.37 pp respectively; direction-consistent, with level gaps in the direction expected from comparing a regional mean with the best-performing country, a 2023 period ratio with a 2010–2014 cohort measure, and a system-level ratio with a registry-based net survival.
Second, for China, a populous country with national childhood cancer registration, the GBD 2023 modeled retinoblastoma M/I (8.6%, from 68.9 modeled deaths over 797.2 modeled incident cases in 2023) lay within 1.0 pp of the implied case fatality from the NCPCS 2024 report cohort (100 − 90.40% = 9.6%).[16] In a setting where registration exists, the tracer approaches the registry-measured quantity, although the comparison is not fully independent, because the GBD estimates partly absorb the same registration system (see Methods).
Third, the gradient check showed monotone directional agreement across all three strata: implied survival exceeded the CONCORD-synthesized net survival in the low-resource stratum (33.01% vs 8.1% for eastern Africa) and fell short of it in the high-resource stratum (75.65% vs 83.0% for North America), with the global stratum in between (53.42% vs 37.4%). The high-resource deviation matches the expected direction of the construct difference, because the M/I numerator includes deaths beyond the five-year window that net survival censors. The low-resource deviation requires more care: it cannot be attributed to incidence under-ascertainment, which (per the scenario-correction logic in Methods) shrinks the denominator and therefore lowers, not raises, 1 − M/I. The observed direction points instead to numerator-side and construct effects: deaths of undiagnosed children may be misclassified to other causes and lost to the mortality numerator, biasing M/I downward and 1 − M/I upward, and the Ward anchors are conditioned on diagnosed cases, who in low-resource settings present late and fare worst. Because the numerator- and denominator-side biases act in opposite directions, the net magnitude is indeterminate, which is why this check is interpreted as a direction test only.
Fourth, the registry-informed subset falsification rejected the purely mechanical explanation of the gradient (Supplementary Table S7). Within the 63 GBD-mappable CONCORD-4 countries, settings where observed registry data inform the GBD incidence estimates, the country-level leukemia M/I gradient in 2022 remained monotone across the covered development spectrum: 62.44% in low-middle-SDI versus 16.85% in high-SDI countries (ratio-of-totals), a low-middle-to-high ratio of 3.71× that is essentially identical to the same comparison in the full 204-country set (3.69×; the full-set low-versus-high ratio including the low-SDI quintile, which contains no CONCORD-4 country, was 4.08×). The 21-region M/I ranking recomputed from CONCORD-4 countries alone agreed closely with the full ranking (Spearman ρ = 0.93 across the 16 regions containing at least one CONCORD-4 country, p < 0.001), and the country-level association between M/I and the UHC service coverage index was preserved in the subset (Spearman ρ = −0.77, n = 61, vs ρ = −0.85, n = 177, in the full set). Had the gradient been an artifact of covariate-driven incidence modeling, it should have attenuated toward flatness where incidence is registry-informed; it did not. The test has one structural gap: CONCORD-4 includes no low-SDI country, so the falsification spans the low-middle- to high-SDI range, and the low-SDI tail of the gradient remains model-dependent (the tail addressed by the scenario correction below).
Robustness to Incidence Under-Ascertainment
Under the scenario correction, reported M/I values are upper bounds: if 43% of true incident cases in low-SDI settings are uncounted,4 the corrected low-SDI M/I falls from 66.99% to 38.18% for leukemia, from 93.57% to 53.33% for retinoblastoma, and from 55.67% to 31.73% for the 14-cause aggregate (Table 4; Figure 1E). The cure gap index correspondingly narrows from 2.75× to 1.57× (leukemia), from 12.95× to 7.38× (retinoblastoma), and from 2.91× to 1.66× (14-cause aggregate); but in no scenario does the inequality disappear. Even under this global-average scenario (regional under-ascertainment may reach 57%, as in western Africa4), low-SDI children face a fatality ratio 1.6- to 7.4-fold higher than high-SDI children. Applying that regional estimate directly (u = 57%), the corrected low-SDI leukemia M/I falls to 28.81% and the leukemia cure gap index to 1.18×, with the retinoblastoma and 14-cause indices at 5.57× and 1.25× (Table 4; Supplementary Table S4): the leukemia inequality attenuates to a thin margin but does not disappear even under the most extreme published ascertainment scenario. The inequality conclusion is robust to under-ascertainment; the absolute level of M/I, however, must always be reported as a scenario interval rather than a point value. Intermediate scenarios (u = 10% and u = 20%) trace a smooth, roughly linear path between the reported and global-average-corrected values (Table 4), so the scenario interval can be read as a continuous sensitivity surface rather than a pair of disconnected bounds. The correction was applied only to the denominator; mortality among undiagnosed children may itself be misattributed to other causes, an offsetting bias we return to in the limitations.
Discussion
Principal Findings
Using only two quantities that the GBD study publishes annually for every country, we constructed a childhood cancer care-system tracer that is smooth enough for year-on-year tracking, monotone in development as theory predicts, and quantitatively corroborated by independent registry-based survival anchors at regional, national, and global levels. The tracer reveals a paradox at the heart of the global childhood cancer agenda: the world as a whole is curing a growing share of children with cancer — the global leukemia M/I fell by 16 percentage points over 34 years — yet the distance between the best- and worst-served children has doubled and, for the most treatment-sensitive cancer, quadrupled. The cure gap widened at an average rate of about 2.5% per year for leukemia over 1990–2023, although the pace has decelerated to roughly 1.3% per year over the most recent decade as the high-SDI denominator approaches low levels.
Relation to Previous Use of Mortality-to-Incidence Ratios
The M/I is not a new quantity: GLOBOCAN publishes mortality-to-incidence ratios for adult cancers, and they are routinely, if cautiously, read as fatality proxies in settings without survival data.[7] For childhood cancer, the ratio has a precedent in the Closing the Cancer Divide analyses, which reported childhood leukemia M/I by national income group (above 70% in low-income versus below 20% in high-income countries).[10] A recent GBD 2021 analysis extended this descriptive tradition, computing mortality-to-incidence ratios for 25 childhood cancers by SDI stratum with trend modeling and reporting a 31.8-fold low-versus-high-SDI disparity for eye cancer.[11] That study establishes that the descriptive quantities are computable from GBD; it does not establish that they are valid or actionable, because it includes no reconciliation against registry-based survival, no under-ascertainment correction, no equity-gap time series, and no monitoring framework. What the present study adds is a pediatric-specific, systematically validated operationalization. Three features distinguish the childhood application. First, the outcome gradient in childhood cancer is dominated by the delivery of curative treatment rather than by screening or early-detection programs, which arguably makes the ratio a cleaner readout of the treatment system than in adult oncology. Second, we subject the ratio to explicit external falsification against registry-based survival rather than assuming validity; the resulting anchor concordance (0.03–1.0 pp in the strongest comparisons, partly endogenous by construction) is, to our knowledge, the first quantitative demonstration that a modeled, registry-free childhood cancer M/I can converge with measured survival where both exist. Third, we embed the ratio in a monitoring architecture with a built-in equity gap index, so that it functions as a governance instrument rather than a descriptive statistic.
The M/I as a Tracer: Scope and Boundaries
The M/I’s strengths are those of a tracer indicator in the classic health-systems sense: cheap, universal, timely, and sensitive to the system attribute of interest. Its weaknesses define the boundary conditions under which it should not be interpreted at face value. First, because the denominator depends on case ascertainment, abrupt changes in registration or diagnostic capacity (a new registry, a screening initiative, an insurance expansion that brings previously undiagnosed children into care) can move the M/I without any change in outcomes. Second, cause-of-death misclassification can contaminate the numerator, particularly where verbal autopsy dominates mortality data. Third, cross-border treatment seeking (children diagnosed in one country and treated, or dying, in another) distorts national ratios, especially for small countries adjacent to referral centers. Fourth, the M/I is a period quantity: deaths in year t arise largely from cases diagnosed in earlier years, so the ratio lags genuine improvements in survival by several years and will overstate fatality during periods of rapid incidence growth. Fifth, for very rare cancers the ratio is statistically unstable — the retinoblastoma uncertainty intervals in low-SDI settings are extremely wide (reflecting both sparse data and the modeled incidence estimation), which is why we position retinoblastoma as a sentinel for direction rather than for precise level. Finally, the M/I is not a survival probability and should never be reported as one. Ellis and colleagues have shown that 1 − M/I has no stable mathematical relationship to net survival and that close numerical agreement between the two can be coincidental;[9] our design responds to that critique directly, in that we never treat 1 − M/I as a survival substitute and instead test only whether it is directionally and approximately concordant with registry anchors across the construct difference. Every publication of the indicator should carry that statement.
Complementarity With CONCORD
The CONCORD program remains the gold standard: population-based, cohort-defined, age-standardized net survival with rigorous quality control.[3] CONCORD-4 has now extended that standard to a purpose-built Cancer Survival Index that tracks the WHO 60% target across 68 countries over 1990–2019,[6] and it is the reference against which progress toward the target will ultimately be judged. What CONCORD cannot be is universal or annual, because most of the world’s children live in countries without operational childhood cancer registration. Nor does the input side fill the gap: the composite vulnerability index of Cotache-Condor and colleagues tracks the determinants of delayed care in LMICs as a policy tool,[8] but it is not an outcome measure. The M/I occupies the complementary outcome-side niche (universal coverage, annual refresh, and immediate country comparability) at the price of construct purity. Our results suggest the two instruments can be used as a rotating validation pair: wherever CONCORD publishes a new cycle, or a national surveillance system such as China’s NCPCS publishes an annual cohort,[16] the reconciliation exercise reported here can be repeated to recalibrate the tracer; where no registry exists, the M/I is, for now, the only feasible performance signal. The China triangulation, a modeled M/I within 1.0 pp of a registry-implied fatality in a country of 1.4 billion people, indicates that this complementarity is practical rather than aspirational, subject to the partial data-sharing caveat stated in Methods.
Policy Uses: Process Monitoring for the 60% Target and for UHC
The WHO GICC commits its member states to reach at least 60% childhood cancer survival globally by 2030.5 An outcome target of this kind requires process monitoring between the infrequent waves of survival estimation, and the three-tier dashboard implied by our results — annual global M/I for the trend layer, the SDI-quintile gradient for the equity layer, and the 21-region cross-section for the action layer — can be refreshed with each GBD cycle at no additional data-collection cost. Two design features deserve emphasis. First, the cure gap index is more sensitive to system change than the global mean: while the global leukemia M/I moves at under 1% per year, the gap index moved at an average of nearly 2.5% per year over 1990–2023 (about 1.3% per year in the most recent decade), and its reversal would be an early, legible signal that diffusion of effective care is accelerating. Second, the tracer gives the UHC agenda a childhood-cancer-specific readout. The UHC service coverage index currently contains no childhood cancer dimension;17 the close regional correspondence between M/I and the UHC index (Figure 1c) suggests that M/I could serve as an outcome-side complement to the coverage-side index within UHC monitoring, flagging where nominal coverage is not translating into survival.
Why the Gap Is Widening
The widening cure gap is not evidence of stagnation in poor countries, where low-SDI M/I values are also declining, but of differential speed. Curative therapy for childhood ALL has been refined continuously in high-income settings, where five-year survival rose from around 73% in the 1980s to about 93% in the 2010s in the US SEER data,[22] driven by risk-stratified protocols, supportive care, and cooperative-group trial infrastructure.[19,20] For retinoblastoma, prospective multinational data show survival stratified sharply by national income, with enucleation alone insufficient where adjuvant therapy and early diagnosis are unavailable.[21] The constraint in low-income settings is less the absence of effective protocols than the diffusion chain that delivers them: diagnostic capacity, drug supply, abandonment of treatment (which affects an estimated 15% of children with cancer globally, 99% of them in LMICs[23]), and referral infrastructure. Each therapeutic advance in high-income settings mechanically widens the gap until diffusion catches up; the retinoblastoma gap index of 12.95×, against 3.07× in 1990, quantifies how far diffusion currently lags innovation for the most curable childhood cancer.
Limitations
Several limitations qualify these findings. First, the construct difference is real: M/I embeds ascertainment, stage distribution, and post-five-year mortality, and our reconciliation design tests corroboration, not equivalence; the near-exact Andean agreement (0.03 pp) should be read as encouraging rather than probative, and we flag its partly coincidental precision. Second, the criterion reconciliation is partly endogenous: because GBD incidence is modeled from mortality via registry incidence-to-mortality ratios, the GBD estimates in the data-rich settings where the CONCORD-3 and NCPCS anchors exist share underlying registry information with those anchors, so the 0.03 pp and 1.0 pp agreements are partly built into the data-generating process, and the independent validation weight rests on directional consistency and gradient magnitude. The development gradient itself shares this limitation: in data-poor countries, where GBD incidence is modeled from mortality via development-covariate-driven mortality-to-incidence ratios, a monotone M/I ordering across SDI quintiles is close to mechanically built into the data-generating process, so gradient monotonicity is a necessary consistency property rather than independent evidence, and the gradient’s evidential weight lies in its magnitude and steepness ordering across calibers. Our registry-informed subset analysis probes this concern directly: within the 63 CONCORD-4 countries, where observed registry data inform the incidence estimates, the gradient persisted essentially unchanged (low-middle- versus high-SDI ratio 3.71×, against 3.69× for the same comparison in the full set), which a purely mechanical construction would not predict. The falsification nonetheless leaves the low-SDI tail untested, because no low-SDI country participates in CONCORD-4; for that tail the mechanical caveat stands, and the evidential weight there rests on the scenario correction and the direction tests. Third, the reconciliation is temporally misaligned: CONCORD-3 anchors describe 2010–2014 cohorts, the NCPCS cohort was diagnosed in 2018–2019, and our M/I values describe 2023; therapeutic progress over those intervals biases implied survival upward relative to the anchors. Fourth, both GBD quantities are modeled; where vital registration and cancer registration are sparse, the M/I inherits the uncertainty, and the smoothing assumptions, of CODEm and the incidence-to-mortality modeling,13,14 and our uncertainty intervals reflect modeled draws rather than independent measurement error. Fifth, the scenario correction addresses only denominator under-ascertainment; deaths among undiagnosed children may also be miscoded to other causes, which would bias the correction in the opposite direction. Sixth, the retinoblastoma caliber has wide uncertainty intervals in low-SDI settings and should be read as a directional sentinel. Seventh, the development axis in Figure 1c is a population-weighted UHC index for 2021, not GBD SDI, and excludes Taiwan and 11 small territories. Eighth, death certification quality and garbage-code redistribution themselves vary monotonically with SDI, so the observed M/I gradient may overstate the true performance gradient because performance and data-quality effects cannot be separated, and the criterion anchors cannot rule this out because they too come from data-rich settings. Ninth, our equity summary is a relative measure (a ratio of M/I values), chosen because ratios are scale-free and comparable across calibers whose M/I levels differ widely; absolute M/I differences could evolve differently and should be reported alongside the ratio in monitoring outputs. Finally, GBD estimation cycles revise the full time series retrospectively, so M/I values from successive cycles are not strictly commensurate; monitoring should always use a single internally consistent cycle, as we have done.
Implications for Monitoring Practice
We propose four reporting norms if the M/I is adopted for childhood cancer monitoring: (i) always report the 95% UI alongside point values; (ii) always accompany absolute M/I levels with the under-ascertainment scenario interval (u = 0–43%); (iii) always append the explicit statement that M/I is not a survival probability; and (iv) repeat the criterion reconciliation whenever a new CONCORD cycle or national cohort report appears. With these norms, a dual-indicator dashboard — leukemia M/I as the primary signal, retinoblastoma M/I as the extreme-sensitivity sentinel, and the cure gap index as the equity tracer — can be maintained at negligible marginal cost.
Conclusions
A registry remains the only way to measure childhood cancer survival properly. But most of the world’s children live where registries do not yet operate, and the world has committed to a 2030 survival target that cannot be monitored with instruments that arrive in multi-year waves for a minority of countries. The mortality-to-incidence ratio, computed from annually updated Global Burden of Disease estimates, offers a pragmatic complement: it is universal, annual, smooth, monotone in development, and quantitatively corroborated by registry-based survival evidence — within 1.0 percentage point of China’s registry-implied retinoblastoma fatality and direction-consistent with CONCORD-3 anchors across their full range — that is only partly independent of the GBD data-generating process.
Applied to 1990–2023, the tracer delivers an uncomfortable but actionable message. Global childhood cancer fatality is declining steadily, by roughly one per cent per year for the leukemias and faster for the most treatment-sensitive cancers; yet the divide between low- and high-SDI care systems has doubled for leukemia and quadrupled for retinoblastoma over the same period, and this inequality survives correction at the global-average under-diagnosis rate and, with a thinner margin for leukemia, even at the highest regional under-diagnosis rate reported (57%). Progress, in other words, is real but not shared, and the gap itself is now measurable at annual resolution, which means it can be governed.
Used with its stated boundaries — reported with uncertainty intervals and under-ascertainment scenario ranges, validated in rotation against each new CONCORD cycle or national cohort, and always carrying the explicit disclaimer that it is not a survival rate — the M/I can serve as the annually updatable tracer of care-system performance, and of the cure gap, that the WHO Global Initiative for Childhood Cancer currently lacks. Its immediate value is to make visible, every year and for every country, whether the diffusion of curative care is finally catching up with the pace of innovation.
Declarations
Supplementary Materials
The following supporting information can be downloaded at the website of this paper posted on Preprints.org.
Author Contributions
SC conceived and designed the study, extracted and analysed the data, and drafted the manuscript. XW, HC and DL contributed to data curation, statistical analysis, interpretation of the results and critical revision of the manuscript. SC supervised the study and acquired funding. SC is the principal investigator who conceived the study and leads its overall conduct. All authors read and approved the final manuscript.
Funding
This work was supported by the Beijing Science and Technology Nova Program Interdisciplinary Project (20230484439) and the Beijing High-Level Public Health Technical Talents Project (2023-02-33). The funders had no role in study design, data collection and analysis, decision to publish, or preparation of the manuscript.
Data Availability Statement
All indicator values, uncertainty intervals, and analysis code supporting this study are archived in the accompanying analysis package (analysis tables B1a–B4d; machine-readable summary statistics).
Conflicts of Interest
The authors declare no competing interests.
Use of artificial intelligence. Declaration of generative AI use
AI tools were used for language polishing and code drafting.
Ethical issues
The study uses publicly available, de-identified, aggregate modeled estimates; no ethics approval was required.
References
- GBD 2023 Childhood Cancer Collaborators. Global burden of cancer in children and adolescents aged 0–19 years, 1990–2023: a systematic analysis for the Global Burden of Disease Study 2023. Lancet 2026, 407(10536), 1360–1373. [Google Scholar] [CrossRef] [PubMed]
- Ward, Z.J.; Yeh, J.M.; Bhakta, N.; Frazier, A.L.; Girardi, F.; Atun, R. Global childhood cancer survival estimates and priority-setting: a simulation-based analysis. Lancet Oncol. 2019, 20(7), 972–983. [Google Scholar] [CrossRef] [PubMed]
- Allemani, C.; Matsuda, T.; Di Carlo, V.; CONCORD Working Group; et al. Global surveillance of trends in cancer survival 2000–14 (CONCORD-3): analysis of individual records for 37,513,025 patients diagnosed with one of 18 cancers from 322 population-based registries in 71 countries. Lancet 2018, 391(10125), 1023–1075. [Google Scholar] [CrossRef] [PubMed]
- Ward, Z.J.; Yeh, J.M.; Bhakta, N.; Frazier, A.L.; Atun, R. Estimating the total incidence of global childhood cancer: a simulation-based analysis. Lancet Oncol. 2019, 20(4), 483–493. [Google Scholar] [CrossRef] [PubMed]
- World Health Organization. The Global Initiative for Childhood Cancer (CureAll framework); WHO: Geneva, 2021; Available online: https://www.who.int/initiatives/the-global-initiative-for-childhood-cancer.
- Allemani, C.; Di Carlo, V.; Ssenyonga, N.; Khan Baloch, F.; Kuehni, C.; Girardi, F.; CONCORD Working Group; et al. Progress towards the WHO Global Initiative for Childhood Cancer target of 60% 5-year survival for all childhood cancers combined, 1990–2019 (CONCORD-4): a Cancer Survival Index derived for 68 countries by analysis of individual records for 613,021 children from 307 population-based cancer registries. Lancet 2026, 407(10536), 1335–1359. [Google Scholar] [CrossRef] [PubMed]
- Bray, F.; Laversanne, M.; Sung, H.; et al. Global cancer statistics 2022: GLOBOCAN estimates of incidence and mortality worldwide for 36 cancers in 185 countries. CA Cancer J. Clin. 2024, 74(3), 229–263. [Google Scholar] [CrossRef] [PubMed]
- Cotache-Condor, C.; Rice, H.E.; Schroeder, K.; Staton, C.; Majaliwa, E.; Tang, S.; et al. Delays in cancer care for children in low-income and middle-income countries: development of a composite vulnerability index. Lancet Glob. Health 2023, 11(4), e505–e515. [Google Scholar] [CrossRef] [PubMed]
- Ellis, L.; Belot, A.; Rachet, B.; Coleman, M.P. The mortality-to-incidence ratio is not a valid proxy for cancer survival. J. Glob. Oncol. 2019, 5, 1–9. [Google Scholar] [CrossRef] [PubMed]
- Knaul, F.M.; Frenk, J.; Shulman, L.N. for the Global Task Force on Expanded Access to Cancer Care and Control in Developing Countries. Closing the Cancer Divide: A Blueprint to Expand Access in Low and Middle Income Countries; Harvard Global Equity Initiative: Boston, MA, 2011. [Google Scholar]
- Mao, X.; Wang, X.; Fang, T.; Zhang, X.; Yang, J.; Gào, X.; et al. The disparity and trend of childhood cancer burden in survival perspective: a systematic analysis for the global burden of disease 2021. Int. J. Surg. 2026, 112(4), 9189–9202. [Google Scholar] [CrossRef] [PubMed]
- Institute for Health Metrics and Evaluation (IHME). GBD Results Tool; IHME: Seattle, WA; Available online: https://vizhub.healthdata.org/gbd-results.
- GBD 2023 Causes of Death Collaborators. Global burden of 292 causes of death in 204 countries and territories and 660 subnational locations, 1990–2023: a systematic analysis for the Global Burden of Disease Study 2023. Lancet 2025, 406(10513), 1811–1872. [CrossRef] [PubMed]
- GBD 2023 Disease and Injury and Risk Factor Collaborators. Burden of 375 diseases and injuries, risk-attributable burden of 88 risk factors, and healthy life expectancy in 204 countries and territories, 1990–2023: a systematic analysis for the Global Burden of Disease Study 2023. Lancet 2025, 406(10513), 1873–1922. [Google Scholar] [CrossRef] [PubMed]
- Steliarova-Foucher, E.; Stiller, C.; Lacour, B.; Kaatsch, P. International Classification of Childhood Cancer, third edition. Cancer 2005, 103(7), 1457–1467. [Google Scholar] [CrossRef] [PubMed]
- Ni, X.; Li, Z. (Eds.) National Childhood Cancer Surveillance Annual Report 2024 [in Chinese]; People’s Medical Publishing House: Beijing, 2026; ISBN 978-7-117-39219-8. [Google Scholar]
- World Health Organization and World Bank. Tracking Universal Health Coverage: 2023 Global Monitoring Report; WHO: Geneva, 2023. [Google Scholar]
- Stevens, G.A.; Alkema, L.; Black, R.E.; GATHER Working Group; et al. Guidelines for Accurate and Transparent Health Estimates Reporting: the GATHER statement. Lancet 2016, 388(10062), e19–e23. [Google Scholar] [CrossRef] [PubMed]
- Pui, C.H.; Yang, J.J.; Bhakta, N.; Rodriguez-Galindo, C. Global efforts toward the cure of childhood acute lymphoblastic leukaemia. Lancet Child Adolesc. Health 2018, 2(6), 440–454. [Google Scholar] [CrossRef] [PubMed]
- Hunger, S.P.; Mullighan, C.G. Acute lymphoblastic leukemia in children. N Engl. J. Med. 2015, 373(16), 1541–1552. [Google Scholar] [CrossRef] [PubMed]
- Fabian, I.D.; Abdallah, E.; Abdullahi, S.U.; et al. Global Retinoblastoma Study Group. The Global Retinoblastoma Outcome Study: a prospective, cluster-based analysis of 4064 patients from 149 countries. Lancet Glob. Health 2022, 10(8), e1128–e1140. [Google Scholar] [CrossRef] [PubMed]
- Sasaki, K.; Jabbour, E.; Short, N.J.; et al. Acute lymphoblastic leukemia: a population-based study of outcome in the United States (SEER), 1980–2017. Am. J. Hematol. 2021, 96(6), 650–658. [Google Scholar] [CrossRef] [PubMed]
- Friedrich, P.; Lam, C.G.; Itriago, E.; Perez, R.; Ribeiro, R.C.; Arora, R.S. Magnitude of treatment abandonment in childhood cancer. PLoS ONE 2015, 10(9), e0135230. [Google Scholar] [CrossRef] [PubMed]
Figure 1.
(a) Global leukemia mortality-to-incidence ratio (M/I), ages 0–19 years, 1990–2023, with 95% uncertainty interval; (b) M/I by SDI quintile, 2023, for leukemia, retinoblastoma, and the 14-cause aggregate. (c) Leukemia M/I (2023) across 21 GBD regions against the population-weighted UHC service coverage index (2021); CONCORD-3-covered regions annotated; dashed lines indicate implied M/I corresponding to CONCORD-3 survival anchors. (d) Cure gap index (low-SDI M/I divided by high-SDI M/I), 1990–2023, for leukemia, retinoblastoma, and the 14-cause aggregate. (e) Scenario correction of low-SDI M/I and the cure gap index under incidence under-ascertainment fractions u = 0, 10%, 20%, and 43%.
Figure 1.
(a) Global leukemia mortality-to-incidence ratio (M/I), ages 0–19 years, 1990–2023, with 95% uncertainty interval; (b) M/I by SDI quintile, 2023, for leukemia, retinoblastoma, and the 14-cause aggregate. (c) Leukemia M/I (2023) across 21 GBD regions against the population-weighted UHC service coverage index (2021); CONCORD-3-covered regions annotated; dashed lines indicate implied M/I corresponding to CONCORD-3 survival anchors. (d) Cure gap index (low-SDI M/I divided by high-SDI M/I), 1990–2023, for leukemia, retinoblastoma, and the 14-cause aggregate. (e) Scenario correction of low-SDI M/I and the cure gap index under incidence under-ascertainment fractions u = 0, 10%, 20%, and 43%.
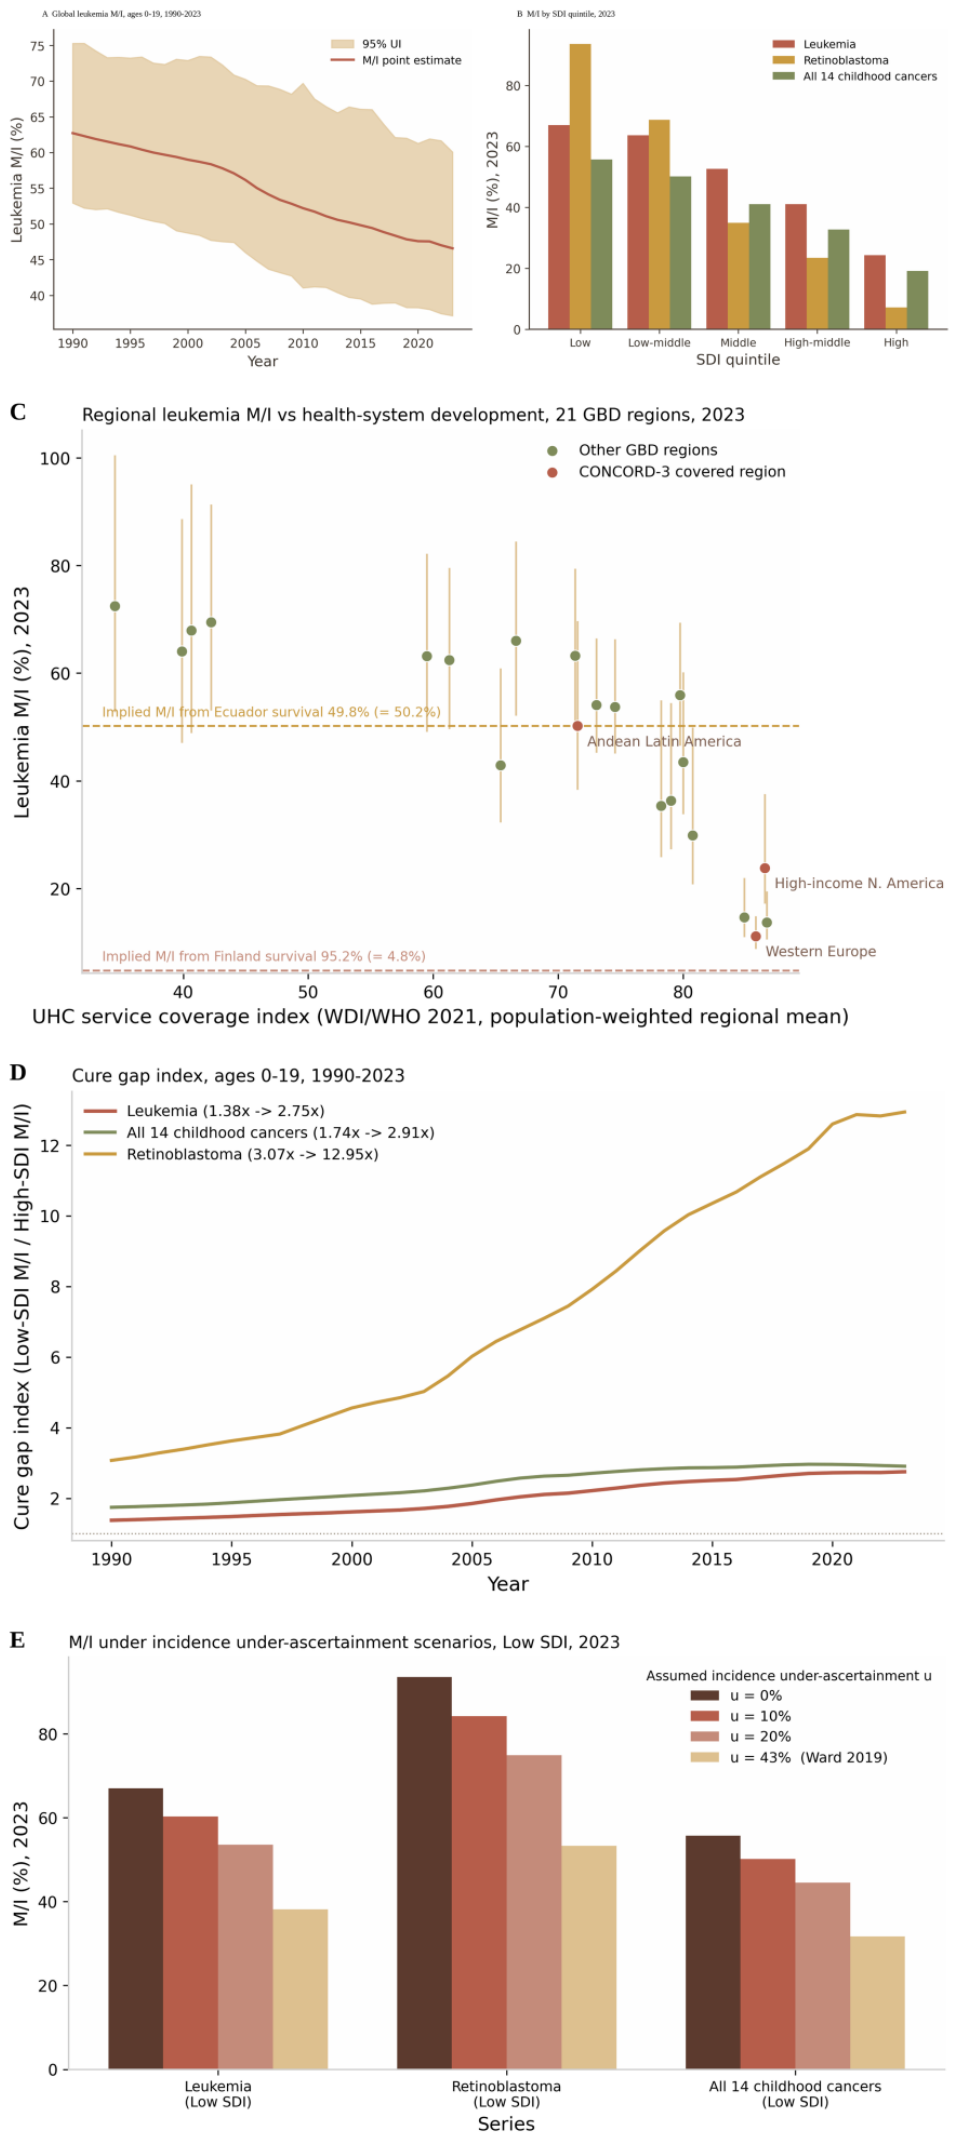

Table 1.
Mortality-to-Incidence Ratio (M/I, %) for Childhood Cancer (Ages 0–19 Years), Three Calibers, by SDI Quintile (2023), With Global Series and Cure Gap Index (1990–2023).
Table 1.
Mortality-to-Incidence Ratio (M/I, %) for Childhood Cancer (Ages 0–19 Years), Three Calibers, by SDI Quintile (2023), With Global Series and Cure Gap Index (1990–2023).
| Stratum | Leukemia M/I (%) | Retinoblastoma M/I (%) | 14-cause aggregate M/I (%) |
| Low SDI, 2023 | 66.99 | 93.57 | 55.67 |
| Low-middle SDI, 2023 | 63.64 | 68.73 | 50.14 |
| Middle SDI, 2023 | 52.64 | 34.89 | 41.01 |
| High-middle SDI, 2023 | 41.02 | 23.42 | 32.74 |
| High SDI, 2023 | 24.35 | 7.23 | 19.15 |
| Global, 1990 | 62.71 | — | 52.77 |
| Global, 2023 | 46.58 (95% UI 37.15–60.07) | — | 38.09 |
| Global EAPC, %/yr (95% CI) | −0.975 (−1.019, −0.932) | −1.616 (−1.736, −1.495) | −1.034 (−1.065, −1.002) |
| Cure gap index (low/high SDI), 1990 | 1.38 | 3.07 | 1.74 |
| Cure gap index (low/high SDI), 2023 | 2.75 (MC 2.74) | 12.95 (MC 13.0) | 2.91 |
| Cure gap index EAPC, %/yr (95% CI) | +2.472 (2.346, 2.598) | — | — |
Abbreviations: M/I, mortality-to-incidence ratio; SDI, socio-demographic index; UI, uncertainty interval; CI, confidence interval; EAPC, estimated annual percentage change; MC, Monte Carlo ratio-of-draws estimate. Retinoblastoma global M/I series values omitted because small counts make point estimates unstable; EAPC computed from the full series.
Table 2.
Childhood Cancer M/I (%) Across 21 GBD Regions, 2023 (Ages 0–19 Years).
| GBD region | Leukemia M/I (%, 95% UI) | Retinoblastoma M/I (%) | 14-cause M/I (%) |
| Oceania | 72.46 (52.76–100.52) | 80.52 | 40.43 |
| Eastern Sub-Saharan Africa | 69.47 (53.08–91.33) | 91.94 | 57.52 |
| Central Sub-Saharan Africa | 67.92 (48.93–95.09) | 99.01 | 61.55 |
| Southern Sub-Saharan Africa | 66.05 (52.11–84.44) | 86.46 | 52.60 |
| Western Sub-Saharan Africa | 64.03 (47.06–88.63) | 90.73 | 52.91 |
| Caribbean | 63.27 (50.83–79.41) | 54.91 | 49.78 |
| South Asia | 63.18 (49.13–82.20) | 63.58 | 49.56 |
| Southeast Asia | 62.41 (49.64–79.56) | 35.89 | 46.25 |
| Tropical Latin America | 55.92 (46.54–69.38) | 31.81 | 41.32 |
| Central Asia | 54.12 (45.25–66.51) | 29.64 | 42.73 |
| Central Latin America | 53.72 (45.14–66.31) | 29.26 | 40.67 |
| Andean Latin America | 50.23 (38.39–69.66) | 25.16 | 36.68 |
| Southern Latin America | 43.51 (33.86–60.18) | 13.49 | 21.25 |
| North Africa and Middle East | 42.88 (32.31–60.90) | 19.57 | 34.11 |
| Central Europe | 36.36 (27.31–54.51) | 10.36 | 24.65 |
| Eastern Europe | 35.37 (25.85–54.98) | 10.15 | 27.53 |
| East Asia | 29.91 (20.84–49.95) | 8.74 | 25.34 |
| High-income North America | 23.82 (17.22–37.58) | 4.99 | 14.14 |
| High-income Asia Pacific | 14.71 (11.02–21.98) | 3.17 | 13.60 |
| Australasia | 13.75 (10.59–19.48) | 1.95 | 12.95 |
| Western Europe | 11.17 (8.86–14.89) | 2.71 | 11.28 |
Abbreviations as in Table 1. Regions sorted by leukemia M/I. Highest-to-lowest ratio = 72.46/11.17 ≈ 6.5×.
Table 3.
Criterion Reconciliation of M/I Against Independent Registry-Based Survival Anchors.
| Comparison | GBD quantity | Value (%) | External anchor | Anchor value (%) | Gap (pp) | Verdict |
| Andean Latin America vs Ecuador | 1 − leukemia M/I, 2023 | 49.77 | CONCORD-3 childhood ALL 5-y net survival, 2010–14[3] | 49.8 | −0.03 | Direction and magnitude corroborate (near-exact agreement partly coincidental) |
| High-income North America vs best anchor | 1 − leukemia M/I, 2023 | 76.18 | CONCORD-3, Finland[3] | 95.2 | −19.02 | Direction consistent; level gap expected (region vs best country, 2023 vs 2010–14, construct difference) |
| Western Europe vs best anchor | 1 − leukemia M/I, 2023 | 88.83 | CONCORD-3, Finland[3] | 95.2 | −6.37 | Direction consistent |
| China, retinoblastoma | GBD 2023 M/I, 2023 | 8.6 | NCPCS implied case fatality (100 − 90.4)[16] | 9.6 | −1.0 | Direction consistent; registry-free and registry quantities converge |
| Low SDI vs eastern Africa | 1 − leukemia M/I | 33.01 | CONCORD-3 synthesized survival[2] | 8.1 | — | Monotone direction agreement |
| Global vs global | 1 − leukemia M/I | 53.42 | Ward 2019 global estimate[2] | 37.4 | — | Monotone direction agreement |
| High SDI vs North America | 1 − leukemia M/I | 75.65 | CONCORD-3 synthesized survival[2] | 83.0 | — | Monotone direction agreement |
All comparisons are cross-construct corroborations as defined in Methods. M/I mixes ascertainment, stage, and treatment effects; net survival is cohort-based among diagnosed cases.
Table 4.
Scenario Correction for Incidence Under-Ascertainment, Low-SDI Quintile (2023).
| Caliber (low SDI) | Reported M/I (%) | u = 10% | u = 20% | u = 43% | Cure gap index, reported | Cure gap index, u = 43% |
| Leukemia | 66.99 | 60.29 | 53.59 | 38.18 | 2.75 | 1.57 |
| Retinoblastoma | 93.57 | 84.21 | 74.85 | 53.33 | 12.95 | 7.38 |
| 14-cause aggregate | 55.67 | 50.11 | 44.54 | 31.73 | 2.91 | 1.66 |
Corrected M/I = reported M/I × (1 − u), assuming true incidence = reported incidence / (1 − u); u = 43% is the Ward 2019 global-average undiagnosed fraction and u = 57% the western African regional estimate from the same study,[4] applied here to low-SDI settings. High-SDI M/I held fixed. Values at u = 57% match Supplementary Table S4.
Disclaimer/Publisher’s Note: The statements, opinions and data contained in all publications are solely those of the individual author(s) and contributor(s) and not of MDPI and/or the editor(s). MDPI and/or the editor(s) disclaim responsibility for any injury to people or property resulting from any ideas, methods, instructions or products referred to in the content. |
© 2026 by the authors. Licensee MDPI, Basel, Switzerland. This article is an open access article distributed under the terms and conditions of the Creative Commons Attribution (CC BY) license (http://creativecommons.org/licenses/by/4.0/).
Copyright: This open access article is published under a Creative Commons CC BY 4.0 license, which permit the free download, distribution, and reuse, provided that the author and preprint are cited in any reuse.