

Submitted:
27 October 2026
Posted:
28 October 2026
You are already at the latest version
Abstract
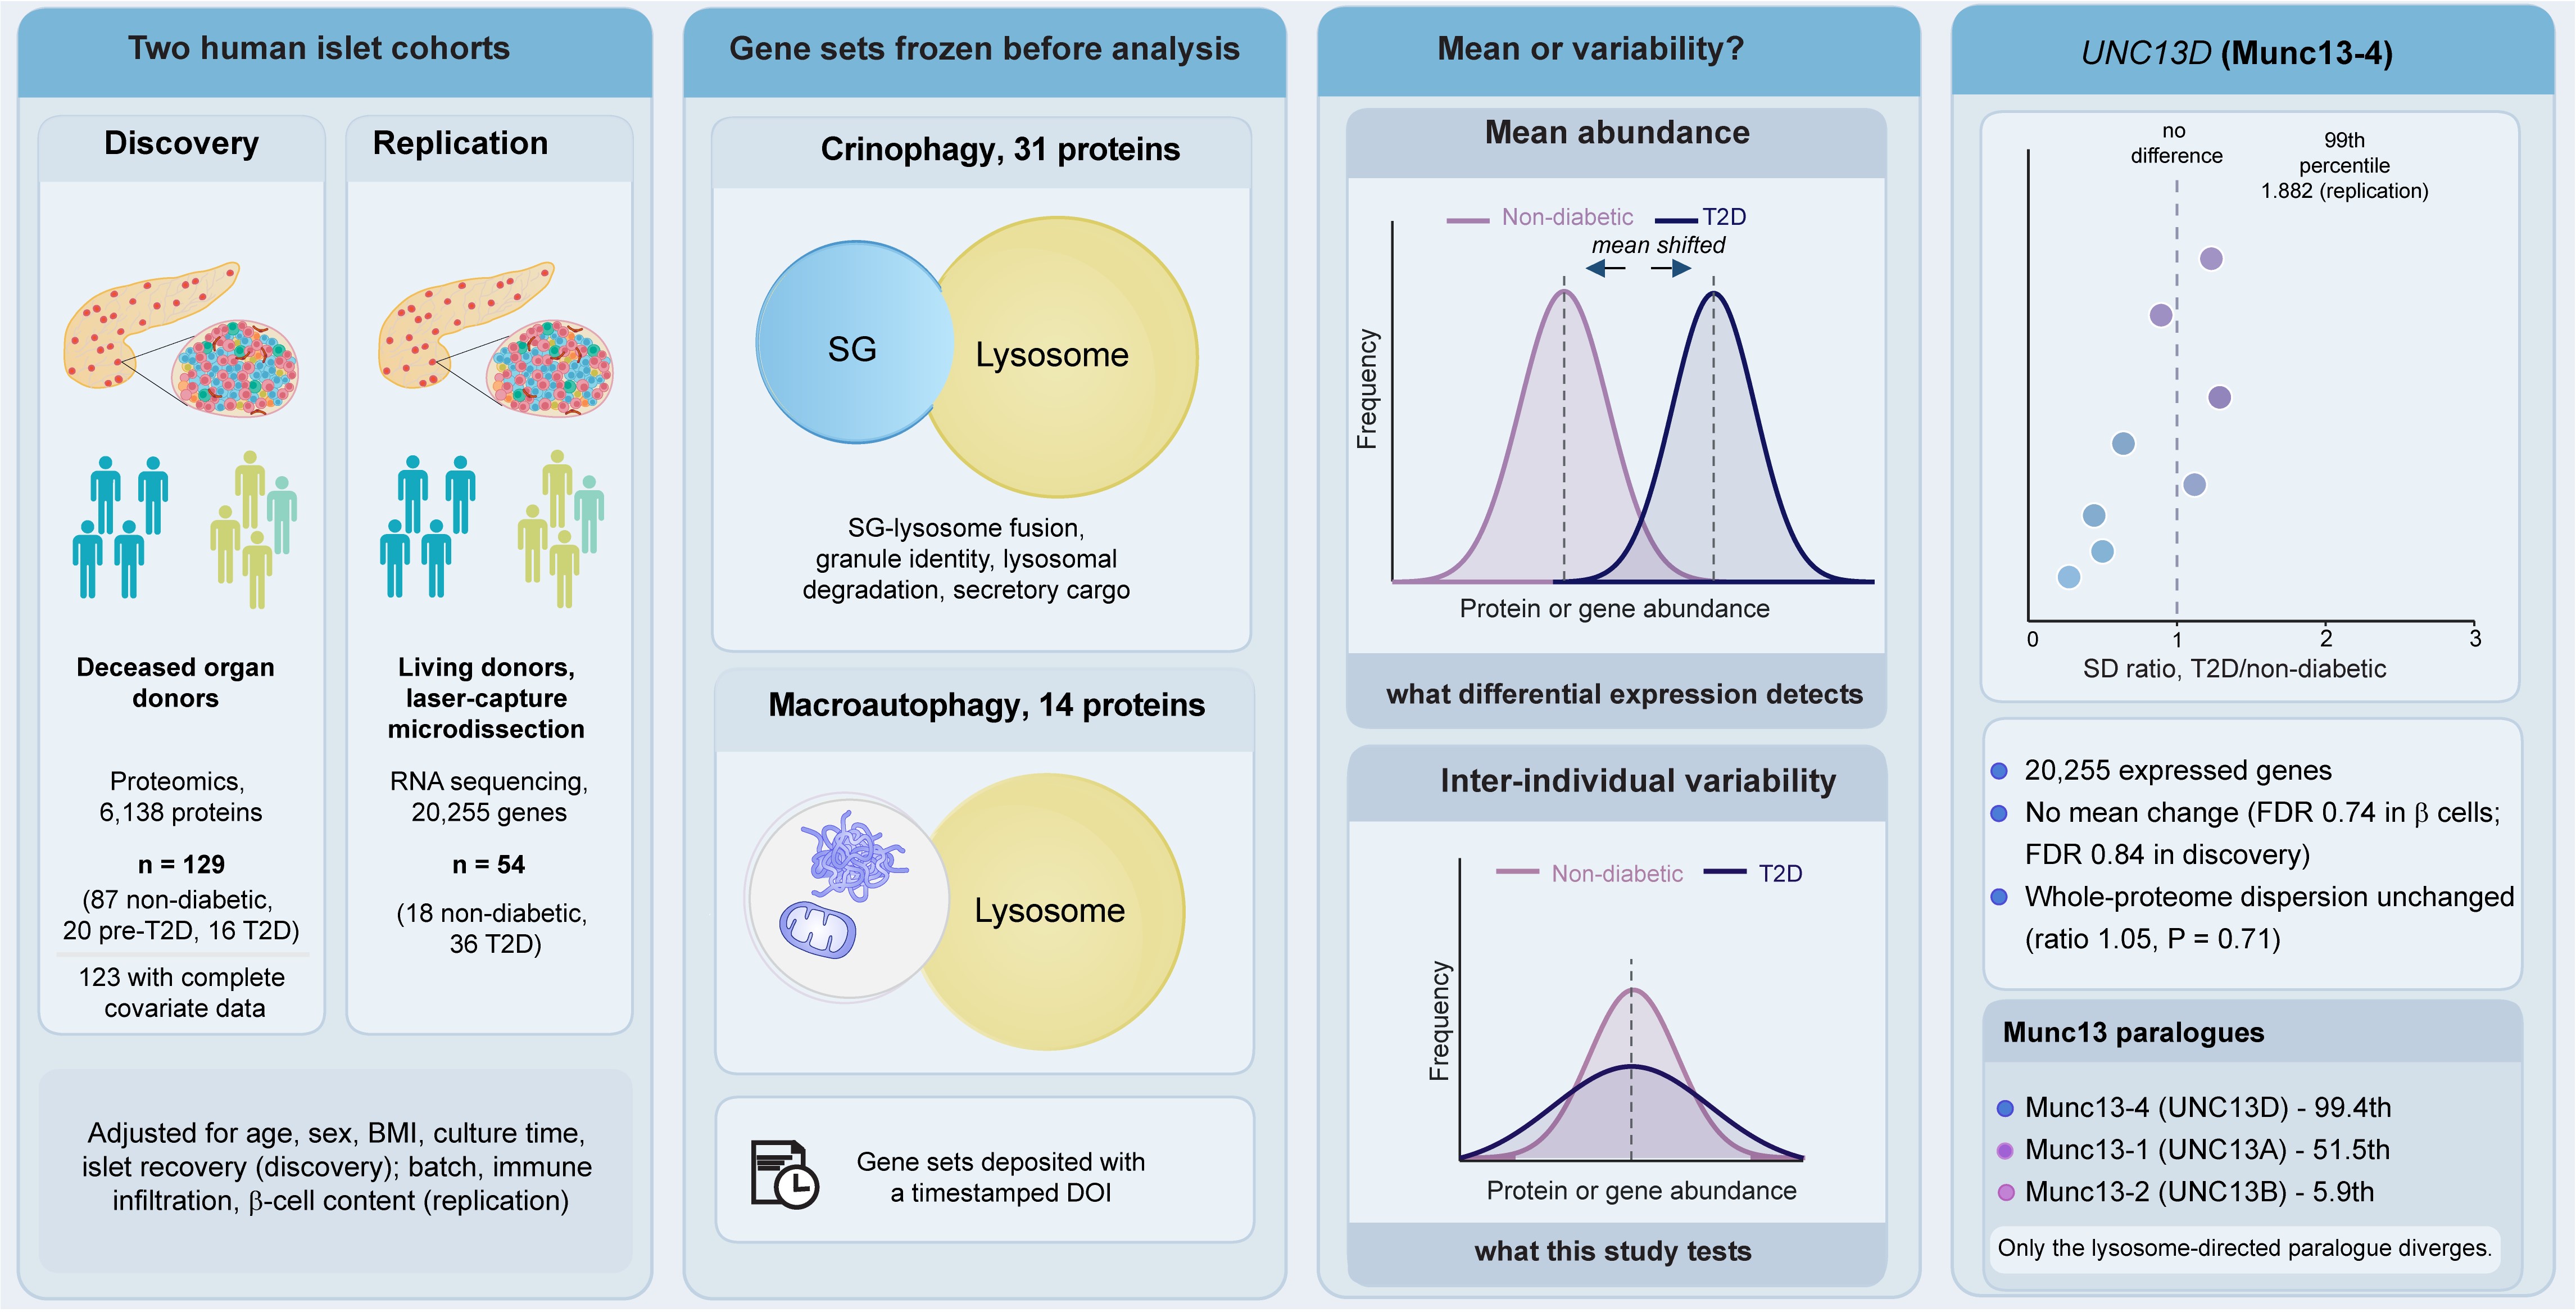
Type 2 diabetes (T2D) is associated with transcriptional and proteomic heterogeneity in human pancreatic islets, yet inter-individual variance is rarely treated as a phenotype in its own right. We tested whether variance captures disease-associated information missed by mean-based analysis, focusing on crinophagy, the direct lysosomal degradation of insulin secretory granules (iSGs). A 31-member crinophagy set and a 14-member macroautophagy comparator were pre-registered before analysis and evaluated in a discovery proteomics cohort of 129 organ donors and an independent RNA-seq cohort of 54 donors (18 non-diabetic, 36 T2D), with adjustment for batch, immune infiltration, and b-cell content. Global proteome dispersion did not differ between groups (centroid-distance ratio 1.05, permutation P = 0.71), and the mean crinophagy-set abundance was unchanged by glycemic status (P = 0.88). In contrast, crinophagy-set variance was greater than expected from size-matched random gene sets (median SD ratio 1.178 vs 1.078, permutation P = 0.036), with no corresponding shift in the comparator set (P = 0.71). UNC13D and STX7 ranked at the 99.38th and 99.09th percentiles of 20,255 expressed genes. UNC13D showed closely concordant SD ratios in discovery proteomics and replication RNA-seq (2.065 and 2.001), whereas RAB3A did not replicate (1.725 and 1.101). Neither UNC13D nor STX7 showed a corresponding mean-expression difference in independent single-cell b-cell data. Inter-individual variance therefore identifies molecular differences in T2D islets not captured by mean-based analysis, with UNC13D providing a reproducible variance phenotype across independent cohorts and molecular platforms.
Keywords:
type 2 diabetes
; crinophagy
; differential variability
; inter-individual heterogeneity
; UNC13D
; STX7
; pancreatic islets
; human proteomics
1. Introduction
Type 2 diabetes (T2D) is a heterogeneous metabolic disorder characterized by persistent hyperglycemia and progressive impairment of pancreatic β-cell function[1,2]. Although defects in insulin secretion are a central feature of T2D, the molecular changes underlying β-cell function vary substantially between individuals[3,4,5]. Human islet studies have identified extensive transcriptional and proteomic differences associated with T2D[4,5,6]; however, these analyses have predominantly focused on differences in mean molecular abundance between clinically defined groups. Such approaches implicitly treat inter-individual variation as biological noise. Consequently, they risk overlooking disease-relevant molecular phenotypes driven by differences in dispersion rather than changes in average expression.
Heterogeneity has been reported as a feature of human T2D islets. Profiling islets from metabolically phenotyped living donors across the glycemic continuum, Wigger and colleagues found transcriptomic and proteomic profiles to be more heterogeneous in donors with diabetes than in non-diabetic controls[4]. They argued for an uncoordinated loss of mature β cell identity, a “disharmonic remodeling” rather than a linear, uniform trajectory toward dedifferentiation[4]. This interpretation is supported by clinical observations that β-cell failure can be functionally reversible, arguing against widespread β-cell loss and in favor of reversible molecular alteration under metabolic stress [1,2,3]. Individuals with similar clinical classifications can therefore exhibit markedly different molecular states, reflecting differences in disease duration, metabolic stress, cellular composition and other biological factors. Yet whether the extent of inter-individual molecular variance is itself altered in T2D has received comparatively little attention.
The question is not without precedent in other settings. Increased transcriptional variability has been described in schizophrenia [7,8,9], differential molecular variability has been demonstrated in cancer and aging[10], and statistical methods have been developed specifically to detect changes in dispersion rather than central tendency. A systematic analysis of variance could therefore provide complementary information to conventional differential expression approaches and identify molecular features that are obscured when individual differences are collapsed into group means.
Insulin secretory granule (iSG) homeostasis provides the biologically relevant context in which to examine this possibility. In addition to regulated exocytosis, β cells maintain granule quality and abundance through intracellular degradation pathways[11]. One key mechanism is crinophagy, a lysosome-dependent process wherein iSGs directly fuse with lysosomes, enabling the removal and recycling of secretory materials[11,12]. We recently defined the molecular machinery of this pathway in mammalian neuroendocrine cells[12]. Specifically, Munc13-4, which is recruited to iSGs by Rab27A, plays a critical role in tethering them to lysosomes and facilitating a Ca2+-dependent fusion process involving VAMP2, along with lysosomal SNAREs such as syntaxin-7, syntaxin-8 and VTI1B, the HOPS complex and PLEKHM1. Studies on Munc13-4 knockout mice show a reduction in multigranular bodies and an increase in insulin-containing granules within pancreatic β cells, indicating an essential role for Munc13-4 in this pathway [12]. Consequently, altered regulation of this machinery could plausibly influence β-cell secretory physiology without necessarily producing uniform changes in the abundance of its constituent proteins across individuals; this possibility remains to be tested directly.
In the present study, we tested whether inter-individual variance in crinophagy- related proteins is associated with T2D independently of changes in the mean abundance. We pre-registered a 31-member crinophagy gene set and a 14-member macroautophagy comparator before analysis and evaluated set-level and individual-gene variance in a discovery proteomics cohort of human organ donors; we then assessed reproducibility in an independent transcriptomic cohort and placed individual variance signals in a genome-wide context. Finally, we examined whether reproducible variance-associated candidates showed corresponding changes in the mean expression in a separate single-cell β-cell dataset. Global proteome dispersion did not differ between groups, yet two components of the secretory granule (SG)-lysosome fusion machinery, UNC13D and STX7, ranked among the most variable genes in the transcriptome while showing no detectable mean expression change. This framework allowed us to distinguish changes in average molecular abundance from changes in the distribution of molecular states between individuals with T2D.
2. Results
2.1. Pre-Registered Variance Analysis Identifies T2D-Associated Heterogeneity in Crinophagy-Related Proteins
Conventional differential expression analysis compares mean abundance between groups, making it blind to genes whose mean is unchanged but whose spread across individuals differs. Given reports that human islets from donors with type 2 diabetes (T2D) are transcriptionally and proteomically more heterogeneous than those from non-diabetic donors[4], we asked whether inter-individual dispersion carries information about the crinophagy mechanism in T2D. Before statistical testing, we defined and froze two protein sets and deposited them with a timestamped DOI [13]: a 31-member crinophagy set spanning secretory granule (SG)-lysosome fusion machinery, calcium-regulated SG identity, lysosomal degradation, and secretory cargo; and a 14-member macroautophagy comparator set spanning core initiation and conjugation machinery, the ATG8 family, and selective autophagic cargo receptors [13]. The comparator was chosen so that a difference confined to the crinophagy set could be distinguished from a general property of vesicular or degradative genes (Figure 1A; Table S1).
The discovery cohort comprised islet proteomes from 129 organ donors (91 non-diabetic, 20 pre-T2D, 18 T2D by corrected diabetes status). Of these, 123 had complete covariate data and were used for a pathway-level analysis; per-protein SD ratios were computed on the 103 donors in the two-group non-diabetic versus T2D comparison. A pathway-level enrichment score for the crinophagy set showed no difference in mean between glycemic groups (adjusted omnibus P = 0.88) and no association with HbA1c (β = 11.8, 95% CI -1.7 to 25.2, P = 0.086, n = 112) (Figure 1B). Dispersion behaved differently. After adjustment for donor age, sex, BMI, culture time, and islet recovery, the residual crinophagy score was more variable among T2D donors than among non-diabetic donors (SD 62.9 versus 39.0; Brown-Forsythe P = 0.018; permutation P = 0.017), while the comparator score showed no such difference (P = 0.62) (Figure 1C).
The pathway-level effect was imprecise (SD ratio 1.61, 95% CI 0.97 to 2.21) and sensitive to individual donors: excluding any one of the three T2D donors moved the P value above 0.05 (Figure S1). Decomposing the score to individual proteins showed that the signal was concentrated rather than distributed across the set. Of the 31 proteins, UNC13D (SD ratio 2.065) and RAB3A (1.725) reached FDR significance for variance heterogeneity (q = 0.022 for both), with the remaining 29 proteins not individually reaching FDR significance (Table S1).
2.2. Global Proteome Dispersion Is Not Increased in T2D
A variance phenotype in a specific gene set is interpretable only against the behavior of the proteome as a whole. If dispersion were globally elevated in T2D, any sufficiently large gene set would appear affected.
We therefore examined dispersion at the level of the entire proteome. Islet proteomes from the 123 donors with complete covariate data were adjusted for age, sex, BMI, culture time, and islet recovery and projected by principal component analysis; dispersion was quantified as the mean Euclidean distance from each group's centroid across the first five components. Mean centroid distance was 18.5 in non-diabetic and 19.3 in T2D donors, a ratio of 1.05 that did not differ from chance (permutation P = 0.71) (Figure S2). Overall proteome dispersion is therefore not detectably increased in T2D, and the pathway-level and gene-level effects reported below are not a reflection of globally elevated variability.
Figure 1.
Crinophagy machinery shows increased inter-individual variance in type 2 diabetes without a change in mean abundance. A. Crinophagy delivers insulin secretory granules (iSGs) directly to lysosomes. Munc13-4, recruited to the SGs by Rab27a, tethers them to the lysosome and drives Ca2+-dependent fusion steps involving VAMP2 together with the lysosomal SNAREs syntaxin-7, syntaxin-8, and VTI1B, the HOPS complex, and PLEKHM1; SG contents are degraded by lysosomal cathepsins while the membrane components are recycled. Proteins shown in bold are members of the pre-registered 31 protein crinophagy set. B. Adjusted crinophagy score against HbA1c in the discovery cohort (n = 112 donors with HbA1c available), colored by glycemic group. The fitted line and shaded band show the linear association and its 95% confidence interval. No significant association was detected (β = 11.8, 95% CI −1.7 to 25.2, P = 0.086). C. Dispersion of covariate-adjusted pathway scores for the pre-registered crinophagy and macroautophagy comparator sets across non-diabetic (n = 87), pre-T2D (n = 20), and T2D (n = 16) donors. Scores are z-standardized within pathways, so the two sets can share a common axis; raw score magnitudes are not comparable between sets of different size. Points are individual donors; boxes show the median and interquartile range. Mean pathway abundance did not differ between glycemic groups (adjusted omnibus P = 0.88), whereas the residual crinophagy score was more variable among T2D than non-diabetic donors (SD 62.9 versus 39.0; SD ratio 1.61, 95% CI 0.97 to 2.21; Brown-Forsythe P = 0.018; permutation P = 0.017). The macroautophagy comparator showed no corresponding difference (P = 0.62).
Figure 1.
Crinophagy machinery shows increased inter-individual variance in type 2 diabetes without a change in mean abundance. A. Crinophagy delivers insulin secretory granules (iSGs) directly to lysosomes. Munc13-4, recruited to the SGs by Rab27a, tethers them to the lysosome and drives Ca2+-dependent fusion steps involving VAMP2 together with the lysosomal SNAREs syntaxin-7, syntaxin-8, and VTI1B, the HOPS complex, and PLEKHM1; SG contents are degraded by lysosomal cathepsins while the membrane components are recycled. Proteins shown in bold are members of the pre-registered 31 protein crinophagy set. B. Adjusted crinophagy score against HbA1c in the discovery cohort (n = 112 donors with HbA1c available), colored by glycemic group. The fitted line and shaded band show the linear association and its 95% confidence interval. No significant association was detected (β = 11.8, 95% CI −1.7 to 25.2, P = 0.086). C. Dispersion of covariate-adjusted pathway scores for the pre-registered crinophagy and macroautophagy comparator sets across non-diabetic (n = 87), pre-T2D (n = 20), and T2D (n = 16) donors. Scores are z-standardized within pathways, so the two sets can share a common axis; raw score magnitudes are not comparable between sets of different size. Points are individual donors; boxes show the median and interquartile range. Mean pathway abundance did not differ between glycemic groups (adjusted omnibus P = 0.88), whereas the residual crinophagy score was more variable among T2D than non-diabetic donors (SD 62.9 versus 39.0; SD ratio 1.61, 95% CI 0.97 to 2.21; Brown-Forsythe P = 0.018; permutation P = 0.017). The macroautophagy comparator showed no corresponding difference (P = 0.62).
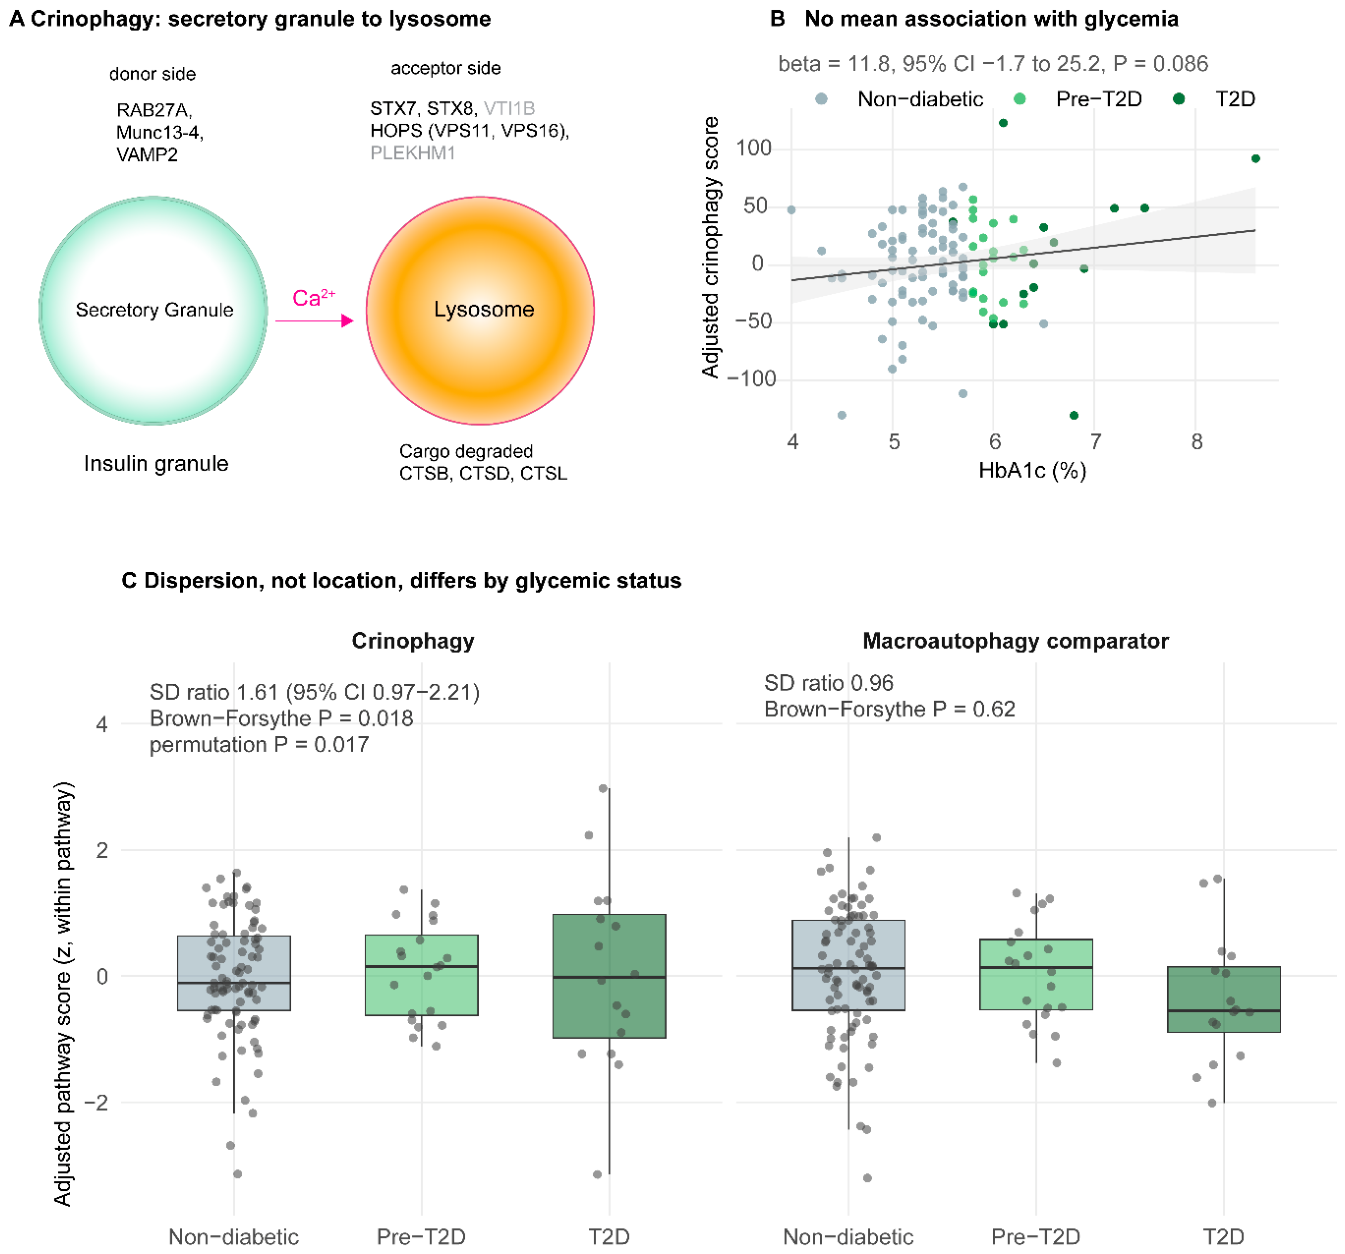
Figure 2.
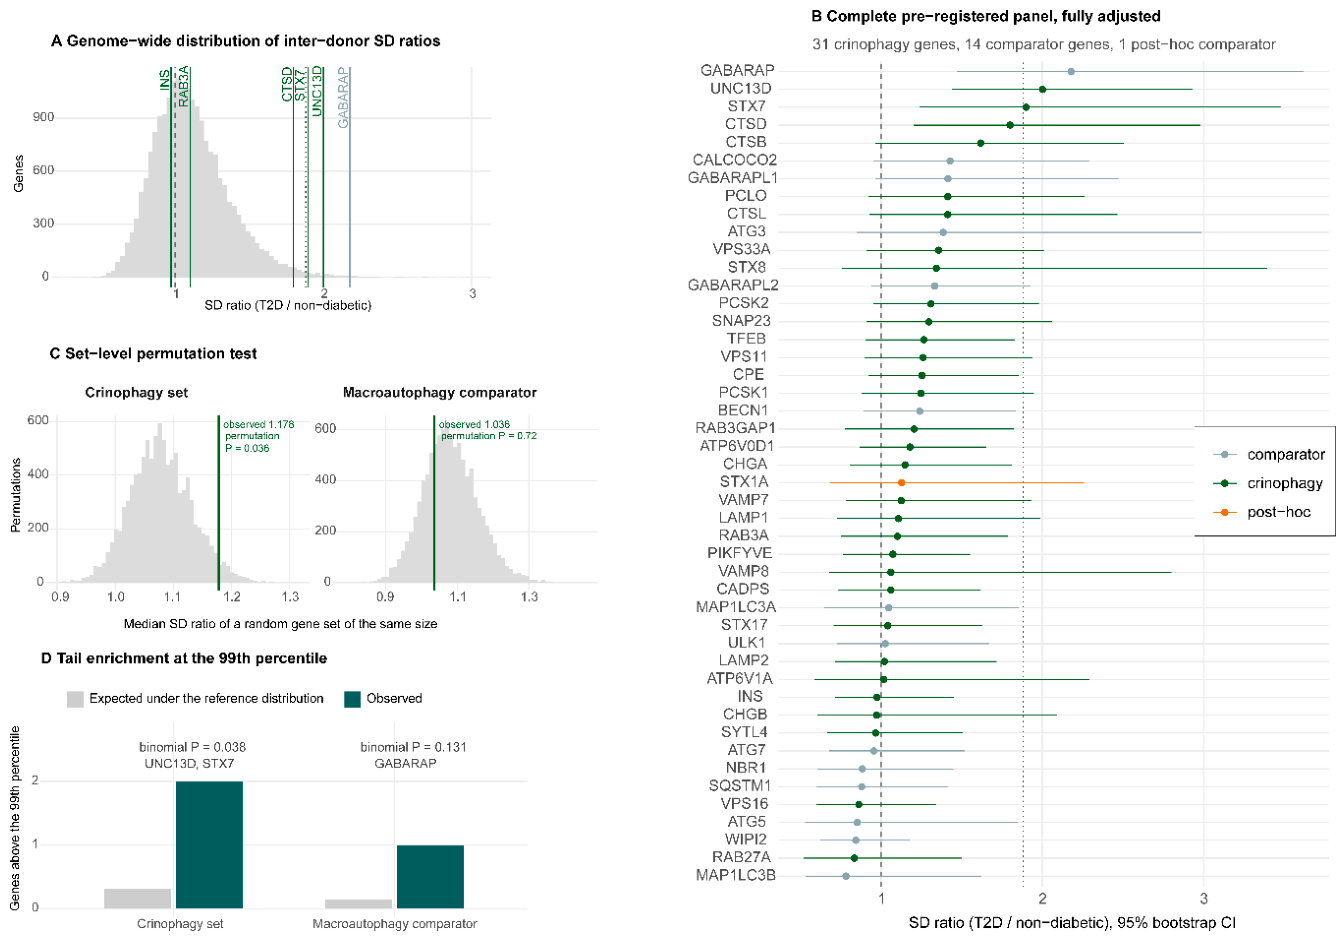
UNC13D and STX7 rank in the extreme tail of the genome-wide SD-ratio distribution. A. Distribution of T2D/non-diabetic SD ratios for all 20,255 expressed genes in the replication cohort under the fully adjusted model (batch, immune infiltration score, and β-cell content score). Vertical lines mark selected genes; the dotted line marks the model-specific 99th percentile (1.882). B. SD ratios with 95% bootstrap confidence intervals for the complete pre-registered panel: 31 crinophagy genes, 14 macroautophagy comparator genes, and one post-hoc comparator (STX1A). Gene sets were frozen with a timestamped DOI before statistical testing. STX1A was added after the primary analysis, following its identification as mean-shifted in T2D β cells [14], and is labelled separately. The dashed line marks an SD ratio of 1 and the dotted line the 99th percentile of the genome-wide distribution. C. Set-level permutation tests. For each pre-registered set, the observed median SD ratio (vertical line) is compared with the distribution of medians from 1,000,000 random size-matched gene sets drawn from the genome-wide reference distribution. The crinophagy set was shifted relative to matched random sets (observed 1.178 versus null median 1.078; permutation P = 0.036), whereas the macroautophagy comparator was not (1.036 versus 1.078; P = 0.71). D. Enrichment in the extreme tail. Bars show the number of pre-registered set members exceeding the model-specific 99th percentile (1.882) against the number expected under the reference distribution. Two of 31 crinophagy genes exceeded the threshold, UNC13D and STX7, against 0.31 expected (binomial P = 0.038); one of 14 comparator genes did, GABARAP, against 0.14 expected (P = 0.13).
Figure 2.
UNC13D and STX7 rank in the extreme tail of the genome-wide SD-ratio distribution. A. Distribution of T2D/non-diabetic SD ratios for all 20,255 expressed genes in the replication cohort under the fully adjusted model (batch, immune infiltration score, and β-cell content score). Vertical lines mark selected genes; the dotted line marks the model-specific 99th percentile (1.882). B. SD ratios with 95% bootstrap confidence intervals for the complete pre-registered panel: 31 crinophagy genes, 14 macroautophagy comparator genes, and one post-hoc comparator (STX1A). Gene sets were frozen with a timestamped DOI before statistical testing. STX1A was added after the primary analysis, following its identification as mean-shifted in T2D β cells [14], and is labelled separately. The dashed line marks an SD ratio of 1 and the dotted line the 99th percentile of the genome-wide distribution. C. Set-level permutation tests. For each pre-registered set, the observed median SD ratio (vertical line) is compared with the distribution of medians from 1,000,000 random size-matched gene sets drawn from the genome-wide reference distribution. The crinophagy set was shifted relative to matched random sets (observed 1.178 versus null median 1.078; permutation P = 0.036), whereas the macroautophagy comparator was not (1.036 versus 1.078; P = 0.71). D. Enrichment in the extreme tail. Bars show the number of pre-registered set members exceeding the model-specific 99th percentile (1.882) against the number expected under the reference distribution. Two of 31 crinophagy genes exceeded the threshold, UNC13D and STX7, against 0.31 expected (binomial P = 0.038); one of 14 comparator genes did, GABARAP, against 0.14 expected (P = 0.13).
Dispersion in the pre-T2D group was lower than in non-diabetic donors (permutation P = 0.024), but this comparison involved only 20 donors, did not survive correction across the tests performed on this cohort, was not accounted for by any available covariate, and was not investigated further.
2.3. Replication in an Independent Cohort
We tested the two FDR-significant candidates in an independent cohort of laser-capture microdissected islets from partially pancreatectomized living donors profiled by RNA sequencing (GSE164416) [4], differing from the discovery cohort in donors, tissue procurement, and measurement platform.
Library preparation date was strongly confounded with glycemic status in the cohort (chi-square P = 0.00068), so all analyses adjusted for preparation batch, and comparisons were restricted to batches containing both groups, yielding 18 non-diabetic and 36 T2D donors. Counts were variance-stabilized with a design-blind transformation.
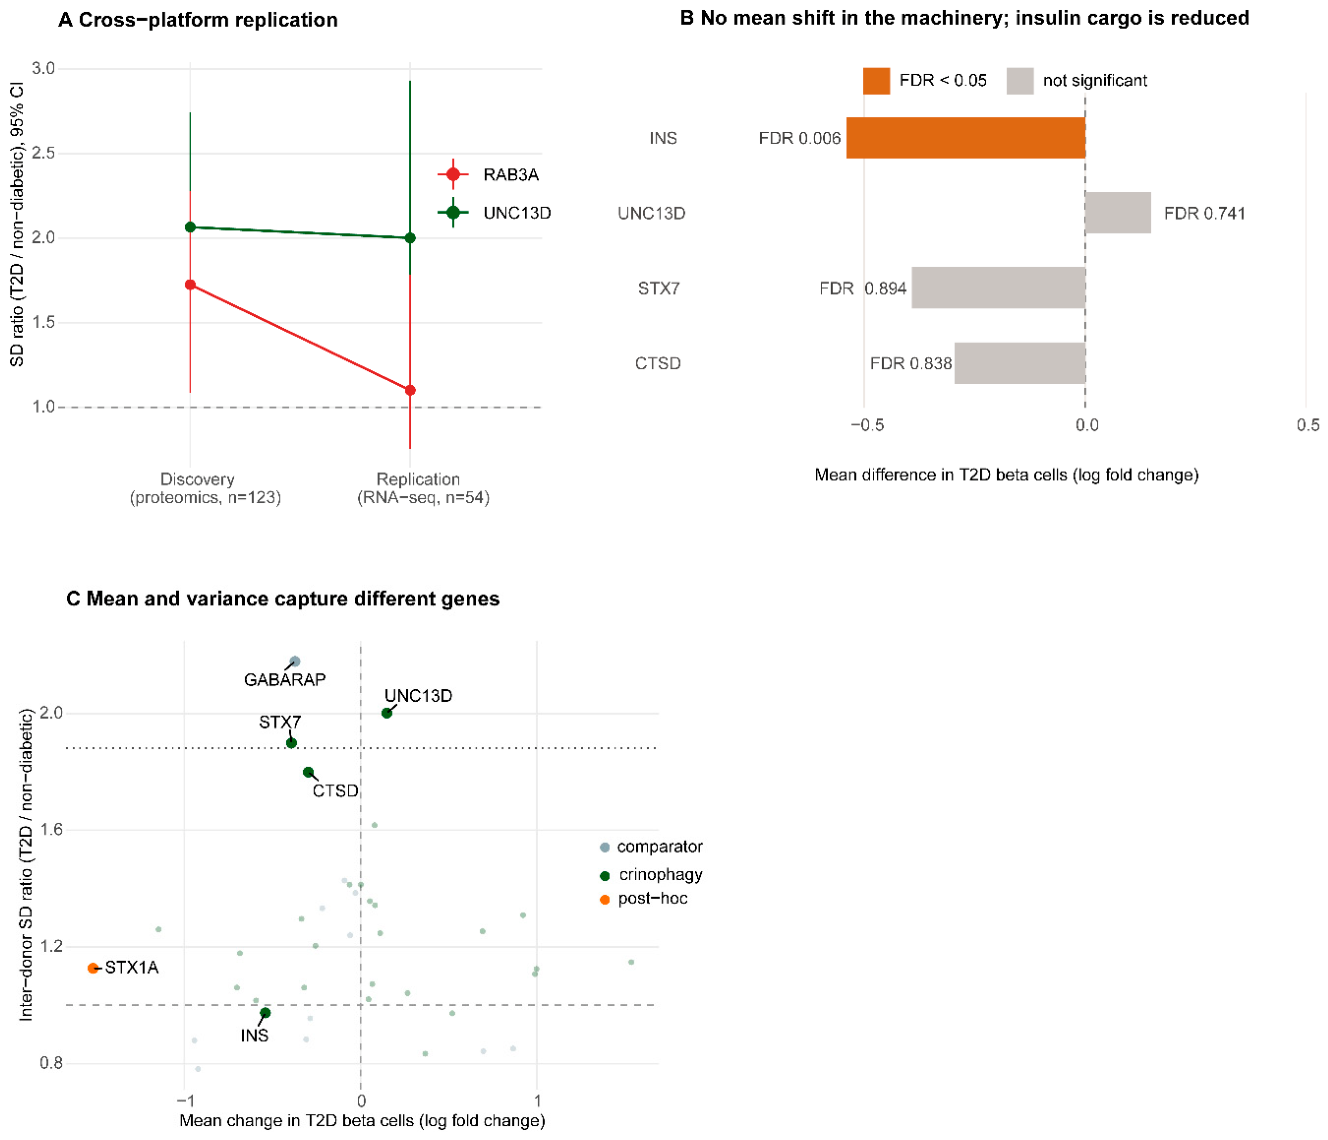
RAB3A did not replicate; its SD ratio fell from 1.725 in discovery to 1.101, placing it at the 53.8th percentile of the genome-wide distribution. UNC13D replicated, with an SD ratio of 2.001 versus 2.065 in discovery proteomics (Figure 5A).
This concordance is not an expected consequence of measuring the same donors on two platforms. Genome-wide SD ratios showed almost no agreement between layers in the 71 donors with paired proteomic and transcriptomic data and complete covariate information (Pearson r = 0.06 on log2 ratios; Figure S3A), although mean abundance correlated as expected for paired omics measurements across all 87 donors with paired data (r = 0.34; Figure S3B). Panel-level transcript and protein abundance are shown in Figure S4. Against that background, the agreement of the UNC13D estimates across platforms is notable.
2.4. UNC13D and STX7 Rank in the Extreme Tail of the Genome-Wide SD-Ratio Distribution
To establish whether these values were unusual, we computed the T2D/non-diabetic SD ratio for all 20,255 expressed genes under the identical model, providing a genome-wide reference against which to assess whether the individual SD ratios were extreme (Figure 2A).
Under the fully adjusted model, UNC13D ranked at the 99.38th percentile (ratio 2.001) and STX7 at the 99.09th percentile (1.899). CTSD followed at the 98.44th percentile (1.799) without crossing the model-specific 99th percentile threshold of 1.882. GABARAP, a comparator-set member, ranked highest overall (2.178, 99.75th percentile), though its signal was attenuated after adjustment for cellular composition (Section 2.5) (Figure 2B and Figure S5; Table S1); its presence in the extreme tail limits interpretation of the variance phenotype as specific to crinophagy.
At the set level, the pre-registered crinophagy panel was shifted relative to size-matched random gene sets drawn from the same background (median SD ratio 1.178 versus null 1.078, permutation P = 0.036), whereas the pre-registered comparator panel was not (1.036 versus 1.078, P = 0.71) (Figure 2C; Table S3A). Two of 31 crinophagy genes exceeded the 99th percentile against 0.31 expected (binomial P = 0.038); one of 14 comparator genes did, GABARAP (P = 0.13) (Figure 2D).
2.5. The Variance Phenotype Persists After Adjustment for Cellular Composition
Bulk islet measurements are sensitive to sample cellular composition. This concern is acute for UNC13D, which encodes Munc13-4, a mediator of cytotoxic granule exocytosis in lymphoid cells as well as of fusion at lysosome-related organelles in secretory cells[15].
Figure 3.
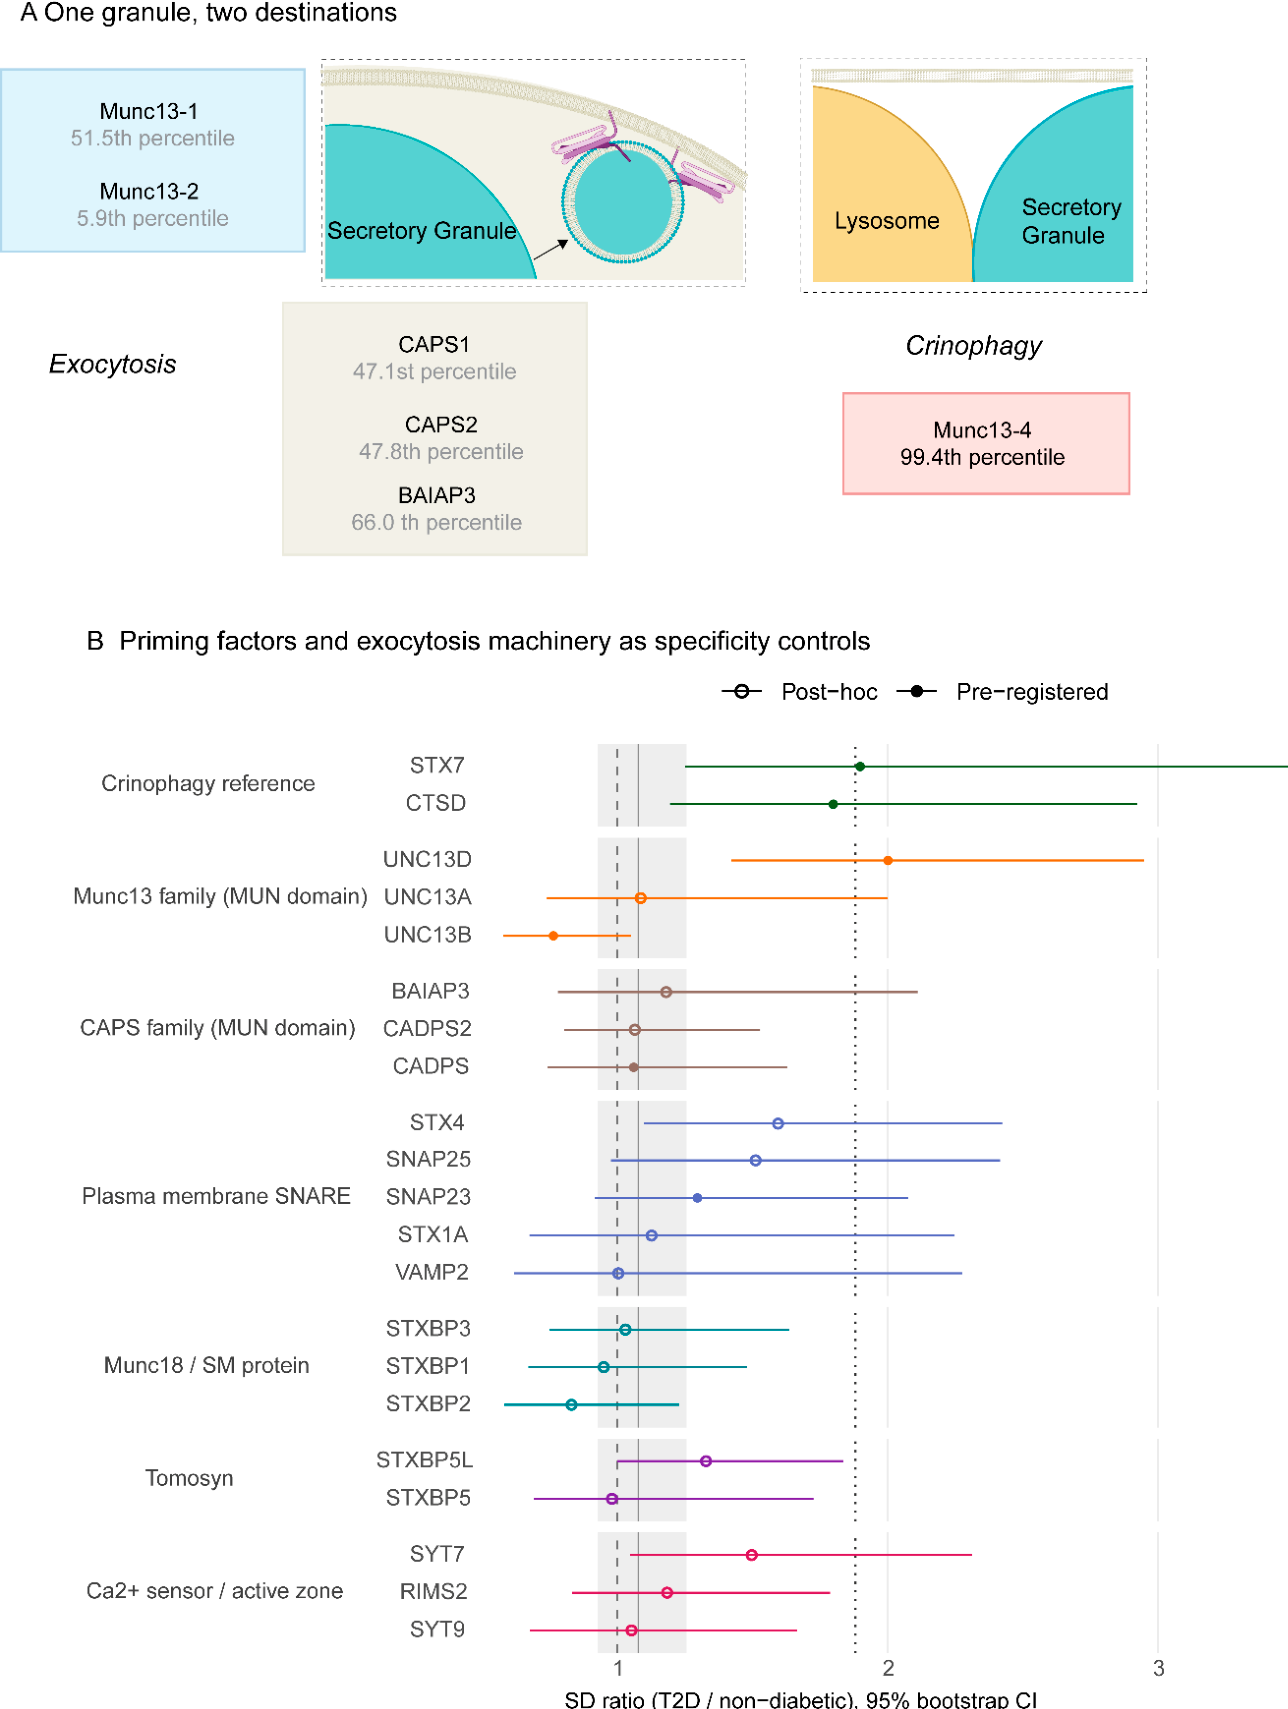
The variance phenotype is confined to the lysosome-directed Munc13 paralogue among MUN-domain priming factors. A. SGs have two principal destinations: fusion with the plasma membrane during exocytosis, and fusion with the lysosome during crinophagy. Munc13-1, Munc13-2 and the CAPS proteins (CADPS, CADPS2, BAIAP3) prime granules for plasma-membrane fusion[16,17,18,19,20,21], whereas Munc13-4 primes them for lysosomal fusion[12]. All five carry MUN domains and catalyze the same SNARE-opening step [16,17,18,19]. Percentiles are inter-donor SD ratios against the 20,255-gene genome-wide reference distribution. Munc13-3 (UNC13C) was not detected in islet tissue. B. SD ratios with 95% bootstrap confidence intervals for MUN-domain priming factors and for regulated exocytosis machinery selected from the T2D insulin-secretion literature, grouped by function. The grey band shows the interquartile range of the genome-wide reference distribution, the dashed line an SD ratio of 1, and the dotted line the 99th percentile. Open circles denote genes assembled post-hoc and excluded from all set-level statistics; filled circles denote pre-registered set members shown for reference. Of the MUN-domain priming factors detected in islet tissue, only Munc13-4 exceeded the 99th percentile, and no regulated exocytosis gene did.
Figure 3.
The variance phenotype is confined to the lysosome-directed Munc13 paralogue among MUN-domain priming factors. A. SGs have two principal destinations: fusion with the plasma membrane during exocytosis, and fusion with the lysosome during crinophagy. Munc13-1, Munc13-2 and the CAPS proteins (CADPS, CADPS2, BAIAP3) prime granules for plasma-membrane fusion[16,17,18,19,20,21], whereas Munc13-4 primes them for lysosomal fusion[12]. All five carry MUN domains and catalyze the same SNARE-opening step [16,17,18,19]. Percentiles are inter-donor SD ratios against the 20,255-gene genome-wide reference distribution. Munc13-3 (UNC13C) was not detected in islet tissue. B. SD ratios with 95% bootstrap confidence intervals for MUN-domain priming factors and for regulated exocytosis machinery selected from the T2D insulin-secretion literature, grouped by function. The grey band shows the interquartile range of the genome-wide reference distribution, the dashed line an SD ratio of 1, and the dotted line the 99th percentile. Open circles denote genes assembled post-hoc and excluded from all set-level statistics; filled circles denote pre-registered set members shown for reference. Of the MUN-domain priming factors detected in islet tissue, only Munc13-4 exceeded the 99th percentile, and no regulated exocytosis gene did.
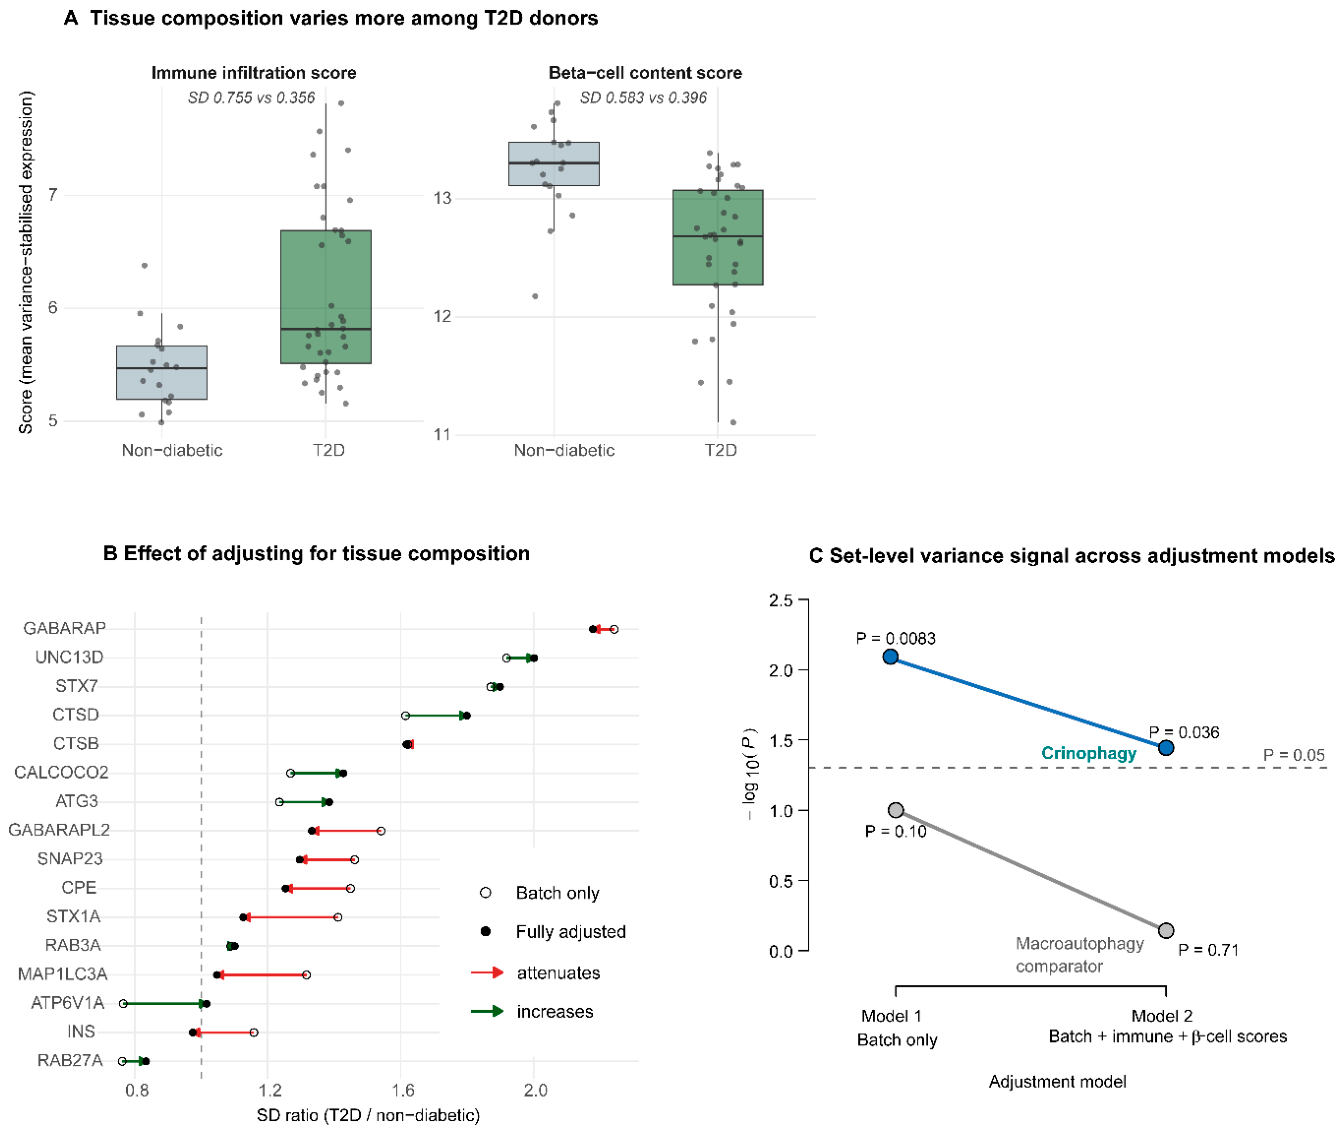
Immune infiltration was approximately twofold more variable among T2D donors than non-diabetic donors (SD 0.755 versus 0.356); β-cell content was also more variable (SD 0.583 versus 0.396), and the genes with the highest SD ratios genome-wide were dominated by immunoglobulin transcripts and immune-cell markers, consistent with variable lymphocytic content in surgically obtained tissue (Figure 4A).
We therefore constructed per-donor immune-infiltration and β-cell content scores and repeated the entire analysis with both as covariates alongside batch. Rather than attenuating, the UNC13D and STX7 signals increased modestly (UNC13D 1.918 to 2.001; STX7 1.871 to 1.899), as did CTSD (1.615 to 1.799). In contrast, several genes attenuated substantially: GABARAP fell from FDR-significant to non-significant within the comparator panel (q = 0.033 to 0.075), and STX1A (1.412 to 1.127), MAP1LC3A (1.317 to 1.047), and INS (1.159 to 0.974) all moved toward the null (Figure 4B,C; Table S1). The adjustment therefore removed composition-sensitive variance where it was present and did not remove the crinophagy-associated signals. This indicates that the UNC13D and STX7 variance phenotypes were not explained by the measured composition covariates, although residual or unmeasured composition effects cannot be excluded.
The set-level evidence was weaker under the fully adjusted model than under batch-only adjustment (crinophagy permutation P = 0.036 versus 0.0083), while the tail evidence was stronger (two genes above the model-specific 99th percentile versus one) (Figure 4C). We report both models throughout and designate the fully adjusted model as the primary model, on the grounds that the confounds it addresses are demonstrably present in these data (Table S1 and S3A).
2.6. No Corresponding Mean Shift in β-Cells
If UNC13D dispersion reflected a conventional expression change, it should be detectable by differential expression analysis. In an independent single-cell study of human islets [14], UNC13D showed no difference between T2D and non-diabetic β cells (logFC 0.149, FDR 0.741) in an analysis that detected 248 genes at FDR below 0.05. The same was true of STX7 (logFC -0.392, FDR 0.894) and CTSD (logFC -0.296, FDR 0.838) (Figure 5B). UNC13D was expressed in β cells at a level comparable to other islet endocrine cell types, modestly lower than in α cells (logFC -0.42, FDR 0.0019), indicating that UNC13D expression is not restricted to a single islet endocrine cell population.
Figure 4.
Adjustment for islet cellular composition does not account for the principal crinophagy-associated variance signals. A. Immune infiltration and β-cell content scores by glycemic group in the replication cohort (18 non-diabetic, 36 T2D donors). Scores are the mean variance-stabilized expression of 34 and 8 marker genes, respectively. Both were more variable among T2D donors (immune SD 0.755 versus 0.356; β-cell SD 0.583 versus 0.396), which is why adjustment for tissue composition was necessary rather than optional. B. Effect of composition adjustment on gene-level SD ratios. Open circles show estimates from the batch-adjusted model (Model 1); filled circles show estimates after additional adjustment for immune infiltration and β-cell content (Model 2); arrows indicate the direction of change. Several genes attenuated substantially after adjustment, including GABARAP, STX1A, MAP1LC3A and INS, whereas UNC13D, STX7 and CTSD were maintained or increased. C. Set-level variance signal under the two adjustment models, shown as −log₁₀(P) from the permutation test. The crinophagy set remained significant after full adjustment (P = 0.0083 batch-only, P = 0.036 fully adjusted), whereas the macroautophagy comparator did not (P = 0.10 and P = 0.71). The dashed line marks P = 0.05.
Figure 4.
Adjustment for islet cellular composition does not account for the principal crinophagy-associated variance signals. A. Immune infiltration and β-cell content scores by glycemic group in the replication cohort (18 non-diabetic, 36 T2D donors). Scores are the mean variance-stabilized expression of 34 and 8 marker genes, respectively. Both were more variable among T2D donors (immune SD 0.755 versus 0.356; β-cell SD 0.583 versus 0.396), which is why adjustment for tissue composition was necessary rather than optional. B. Effect of composition adjustment on gene-level SD ratios. Open circles show estimates from the batch-adjusted model (Model 1); filled circles show estimates after additional adjustment for immune infiltration and β-cell content (Model 2); arrows indicate the direction of change. Several genes attenuated substantially after adjustment, including GABARAP, STX1A, MAP1LC3A and INS, whereas UNC13D, STX7 and CTSD were maintained or increased. C. Set-level variance signal under the two adjustment models, shown as −log₁₀(P) from the permutation test. The crinophagy set remained significant after full adjustment (P = 0.0083 batch-only, P = 0.036 fully adjusted), whereas the macroautophagy comparator did not (P = 0.10 and P = 0.71). The dashed line marks P = 0.05.
The same pattern held in our own discovery cohort. Applying a conventional mean-difference analysis under the identical covariate model, UNC13D showed no significant difference between T2D and non-diabetic donors (P = 0.66, FDR = 0.84), ranking at the 79th percentile among the 6,138 proteins tested, while the same analysis detected 602 proteins at an FDR below 0.05, demonstrating adequate power to detect mean differences (Figure S6).
Insulin behaved in the opposite manner. INS showed a significant mean decrease in T2D β cells (logFC -0.540, FDR 0.0060) with an unremarkable SD ratio (0.974, 32nd percentile). The crinophagic cargo is therefore reduced in mean without excess dispersion, while the components of the machinery that degrades it show the reverse (Figure 5C).
Figure 5.
Cross-platform replication identifies a variance phenotype distinct from mean expression. A. SD ratios with 95% confidence intervals for UNC13D and RAB3A in the discovery proteomics cohort (covariate model fitted across the 123 donors with complete covariate data; SD ratio computed from 87 non-diabetic, 16 T2D) and the independent replication RNA-seq cohort (fully adjusted model, n = 54). UNC13D showed closely concordant estimates across platforms (2.065 and 2.001), whereas the RAB3A signal observed in discovery (1.725) was not reproduced (1.101). The dashed line marks an SD ratio of 1. Both candidates were fixed before replication testing, and the non-replication is reported alongside the replication. B. Mean expression differences between T2D and non-diabetic β cells in published single-cell data [14]. INS showed a significant decrease (log fold change −0.540, FDR 0.006), whereas UNC13D (0.149, FDR 0.741), STX7 (−0.392, FDR 0.894) and CTSD (−0.296, FDR 0.838) showed no significant difference. The same analysis detected 248 of 7,441 tested genes at FDR below 0.05, indicating adequate power. Values are taken from the published supplementary tables; no reanalysis was performed. C. Mean change against inter-donor variance. The x-axis shows mean differences in T2D β cells from published single-cell data [14]; the y-axis shows SD ratios from the replication bulk islet RNA-seq analysis. The dotted horizontal line marks the 99th percentile of the genome-wide SD-ratio distribution. UNC13D and STX7 occupy the high-variance region with little or no mean shift, whereas INS shows the reverse. This is a cross-cohort plot: the two coordinates of each gene derive from different datasets, and no gene contributes both measurements from the same samples. Only genes tested in both datasets are shown.
Figure 5.
Cross-platform replication identifies a variance phenotype distinct from mean expression. A. SD ratios with 95% confidence intervals for UNC13D and RAB3A in the discovery proteomics cohort (covariate model fitted across the 123 donors with complete covariate data; SD ratio computed from 87 non-diabetic, 16 T2D) and the independent replication RNA-seq cohort (fully adjusted model, n = 54). UNC13D showed closely concordant estimates across platforms (2.065 and 2.001), whereas the RAB3A signal observed in discovery (1.725) was not reproduced (1.101). The dashed line marks an SD ratio of 1. Both candidates were fixed before replication testing, and the non-replication is reported alongside the replication. B. Mean expression differences between T2D and non-diabetic β cells in published single-cell data [14]. INS showed a significant decrease (log fold change −0.540, FDR 0.006), whereas UNC13D (0.149, FDR 0.741), STX7 (−0.392, FDR 0.894) and CTSD (−0.296, FDR 0.838) showed no significant difference. The same analysis detected 248 of 7,441 tested genes at FDR below 0.05, indicating adequate power. Values are taken from the published supplementary tables; no reanalysis was performed. C. Mean change against inter-donor variance. The x-axis shows mean differences in T2D β cells from published single-cell data [14]; the y-axis shows SD ratios from the replication bulk islet RNA-seq analysis. The dotted horizontal line marks the 99th percentile of the genome-wide SD-ratio distribution. UNC13D and STX7 occupy the high-variance region with little or no mean shift, whereas INS shows the reverse. This is a cross-cohort plot: the two coordinates of each gene derive from different datasets, and no gene contributes both measurements from the same samples. Only genes tested in both datasets are shown.
2.7. Specificity of the Variance Phenotype
Three comparisons bear on how specific this phenotype is. The clearest comparison concerns is the MUN-domain priming factors, a grouping defined by structural homology rather than by any partition imposed after inspecting the results. Within the Munc13 family, UNC13D (Munc13-4) ranked at the 99.38th percentile, UNC13A (Munc13-1) at the 51.5th percentile, and UNC13B (Munc13-2) at the 5.9th percentile; UNC13C, encoding the largely cerebellar Munc13-3[22]was not detected in islet tissue. The CAPS family, which shares the MUN domain and catalyzes the same SNARE-opening step, behaved similarly to the exocytic Munc13 paralogues: CADPS, CADPS2, and BAIAP3 showed SD ratios of 1.060, 1.065, and 1.181, respectively (47.1st, 47.8th, and 66.0th percentiles), none approaching significance. Munc13-1, Munc13-2, and the CAPS proteins prime secretory granules (SGs) for fusion with the plasma membrane, whereas Munc13-4 primes them for fusion with lysosomes. Of the five MUN-domain priming factors detected in islet tissue, only the degradation-directed one showed elevated inter-donor variance (Figure 3A,B and S7).
Second, a post-hoc panel of seventeen regulated exocytosis genes selected from the T2D insulin-secretion literature, including STX1A[23], SNAP25[24], VAMP2[25], the Munc18 isoforms, tomosyn[26], and RIMS2[27]; fifteen were quantified in islet tissue, and none exceeded the 99th percentile (Figure 3B, Table S4). Elevated inter-donor variance is therefore not a general property of β-cell membrane fusion machinery. Because this panel was assembled after the primary analysis, we treat it as supporting rather than confirmatory.
Third, no Rab GTPases or Rab GEF/GAP proteins examined showed a comparable signal (Figure S8; Table S4). Because Rab proteins are regulated through nucleotide state and GEF/GAP proteins act catalytically, abundance measurements cannot resolve the Rab27A: Rab3A activity ratio, and this result neither supports nor excludes a change in Rab activity.
2.8. The Strongest Signals Are Individual Components, Not a Pathway-Wide Module
Taken together, the analysis distinguishes a set-level variance signal from a uniform pathway-wide effect. The pre-registered crinophagy set showed greater inter-individual variance than matched random gene sets, whereas the pre-registered comparator set did not. At the gene level, UNC13D and STX7 occupied the extreme tail of the genome-wide SD ratio distribution, with CTSD also ranking highly. Among these candidates, UNC13D showed the most consistent evidence across independent donors and molecular platforms, with no corresponding mean-expression difference.
The highest-ranking crinophagy-associated genes included UNC13D, STX7, and CTSD. UNC13D was specified as the primary candidate before analysis, whereas STX7 and CTSD were identified from the observed variance distribution and should therefore be interpreted as exploratory findings. UNC13D and STX7 function at the SG-lysosome fusion step, and our previous work showed that Munc13-4 associates physically with syntaxin-7 and syntaxin-8 in the crinophagic fusion complex [12]. We therefore tested whether the apparent concentration of high-ranking genes reflected a broader variance phenotype across the autophagy-lysosome system. In an exploratory analysis of 107 additional genes grouped by pathway position, median SD ratios were 1.19 for autophagosome-associated genes, 1.04 for secretory granule-associated genes, and 1.03 for shared lysosomal machinery, compared with 1.077 genome-wide. No gene in this exploratory panel survived correction for multiple testing (minimum q = 0.577) (Table S2 and S3B).
The available data therefore do not support a generalized increase in variance across the autophagy-lysosome pathway. Instead, the strongest signals are concentrated in individual crinophagy-related components, with UNC13D providing the most reproducible example.
3. Discussion
Here we identify a molecular phenotype in human pancreatic islets from donors with type 2 diabetes (T2D): elevated inter-individual variance in specific components of the insulin granule degradation machinery, occurring without any change in the mean protein abundance. Conventional differential expression analyses are designed to detect shifts in group averages and are therefore blind to traits in which mean levels are preserved while individual regulation becomes heterogeneous. Examining variance distribution across human islet proteomes, we find that Munc13-4 (UNC13D) abundance differs roughly twofold more between donors with T2D than between non-diabetic donors, while no corresponding mean-abundance difference was detected in the discovery proteomics (P = 0.66) or in independent single-cell β-cell data (FDR = 0.74). At the pathway level, the mean crinophagy score was likewise unchanged across glycemic groups (P = 0.88) and showed no association with HbA1c (P = 0.086). Munc13-4 therefore identifies a locus at which T2D islets diverge from one another rather than a molecule whose abundance distinguishes T2D islets from non-diabetic ones.
3.1. Specificity of the Variance Phenotype
A central question is whether this elevated variance reflects a selective property of the secretory granule (SG) degradation machinery or a nonspecific background effect. Three lines of evidence bear on this, and they differ in strength.
The clearest concerns the MUN-domain priming factors, a grouping defined by structural homology rather than by any partition imposed after inspecting the results. Munc13-4 ranks at the 99.4th percentile of SD ratios across 20,255 expressed genes, whereas its paralogues Munc13-1 and Munc13-2 rank at the 51.5th and 5.9th percentiles. The CAPS family, which shares the MUN domain and catalyzes the same SNARE opening step[16,17,18,19,20,21], behaves like the exocytic Munc13 paralogues: CADPS, CADPS2 and BAIAP3 rank at the 47.1st, 47.8th and 66.0th percentiles. Munc13-1, Munc13-2 and the CAPS proteins dock/prime SGs for fusion with the plasma membrane[16,19], whereas Munc13-4 dock/primes them for fusion with lysosomes[12]. Of the five MUN-domain priming factors detected in islet tissue, only the degradation-directed one shows elevated inter-donor variance.
Second, a post-hoc panel of regulated exocytosis genes drawn from the T2D insulin-secretion literature, including STX1A[23], SNAP25[24], VAMP2[25], the Munc18 isoforms, tomosyn[26] and RIMS2[27], contained no gene exceeding the 99th percentile. This indicates that elevated inter-donor variance is not generally a property of β-cell membrane fusion machinery. Because the panel was assembled after the primary analysis, we treat it as supporting rather than confirmatory evidence.
Third, the pre-registered comparator set of macroautophagy proteins showed no set-level shift (P = 0.72), while the crinophagy set did (P = 0.036). This is the weakest of the three comparisons. GABARAP, a comparator-set member, ranked highest of all panel genes under batch-only adjustment (q = 0.033) and fell below FDR significance only after adjustment for tissue composition (q = 0.075). We report this rather than setting it aside; its behavior demonstrates that composition-sensitive variance is present in these data and is removed by the adjustment, which is the context in which the persistence of the Munc13-4 signal should be read.
The highest-ranking crinophagy-associated genes included UNC13D, STX7, and CTSD, act at SG-lysosome fusion and lysosomal proteolysis, and our earlier work found that Munc13-4 associates physically with syntaxin-7 and syntaxin-8 in the crinophagic fusion complex [12]. We therefore asked whether variance was elevated across this part of the autophagy-lysosome system more generally. It was not. In an exploratory analysis of 107 additional genes grouped by pathway position, median SD ratios were 1.19 for autophagosome-associated genes, 1.04 for SG-associated genes and 1.03 for shared lysosomal machinery, against a genome-wide median of 1.077 and no gene survived correction for multiple testing. The apparent clustering of the top-ranked genes at the fusion and degradation step is therefore not supported as a pathway-level phenomenon and is reported as a property of those genes individually.
The behavior of the machinery contrasts with that of its cargo. In T2D β cells, INS shows a significant decrease in mean expression with little evidence of increased inter-donor dispersion, whereas Munc13-4 shows preserved mean abundance with approximately twofold greater inter-donor dispersion. These opposing patterns suggest that reduced insulin expression is a more uniform disease-associated feature, whereas variation in the crinophagic machinery may differ more substantially between individuals. This interpretation remains speculative, however, because the present data do not establish a causal relationship between Munc13-4 heterogeneity, crinophagic activity, and insulin loss.
3.2. The Effect Is Not a Global Property of the Diabetic Proteome
An immediate objection to any variance finding is that the diseased states might be associated with global molecular instability, producing proteome-wide scatter. Our data argue against this. Across 123 covariate-adjusted donors, whole-proteome dispersion did not differ between groups (mean distance from the group centroid 18.5 in non-diabetic versus 19.3 in T2D donors; ratio 1.05, permutation P = 0.71). Islet proteomes from T2D donors are not globally more scattered than those from non-diabetic donors, and the gene-level effects reported here are therefore not a reflection of elevated variability across the proteome.
This differs from the qualitative observation of Wigger and colleagues, who reported substantial proteomic heterogeneity among T2D islets [4]. Their transcriptomic analysis spanned 133 donors; however, the proteomic comparison on which that observation rests involved five donors per group without covariate adjustment. Since our replication cohort is theirs, the difference in global proteomic dispersion is most simply explained by sample size and analytical approach rather than by any inconsistency in the underlying data.
The persistence of the Munc13-4 and STX7 signals after adjustment for immune infiltration and β cell content indicates that the measured composition covariates do not explain these variance phenotypes, although residual or unmeasured composition effects cannot be excluded. This is a meaningful distinction: in the same analysis, GABARAP, STX1A, MAP1LC3A, and INS all attenuated substantially, showing that the adjustment removes composition-sensitive variance where it is present.
3.3. Biological Plausibility
Crinophagy is a regulated, stress-responsive pathway rather than a constitutive housekeeping mechanism in endocrine cells. It responds to secretory demand, granule age, and intracellular Ca2+ [11,12]. Munc13-4 is required for SG-lysosome fusion, requires Ca2+ binding for a post-docking fusion step, and its ablation in knockout mice leads to accumulation of insulin-containing granules and fewer multigranular bodies in β cells[12].
Individuals with T2D differ in disease duration, glycemic exposure, and metabolic workload, so engagement of a stress-responsive pathway such as crinophagy could plausibly vary across a patient population. We emphasize that we have not shown this: no clinical covariate available to us accounted for the observed variance, and the proposal is an interpretation rather than a result.
Regulatory GTPase signaling behaved differently from the fusion machinery. RAB3A showed elevated variance in the discovery cohort but did not replicate (1.725 to 1.101), and RAB27A showed lower dispersion in T2D (12th percentile). These observations do not test the hypothesis that the RAB27 to RAB3A activity ratio directs aged granules towards lysosomal degradation [11,12]. The Rab GTPases are governed by nucleotide state, and GEF and GAP proteins act catalytically, so activity can change substantially with no change in abundance. Testing that hypothesis requires nucleotide-state or effector-pull-down assays across donor tissue.
3.4. Limitations
Sample sizes differ markedly between cohorts. The discovery cohort comprised 129 donors with proteomics, of whom 123 had complete covariate data, whereas the replication cohort was smaller (18 non-diabetic and 36 T2D donors after batch restriction). Variance estimates are less stable than mean estimates at the replication cohort’s size, producing wide bootstrap confidence intervals and, in the discovery cohort, a pathway-level result sensitive to individual donors. Per-donor clinical covariates were unavailable for the replication cohort, preventing adjustment for age, sex, and BMI, although the published cohort description indicates that T2D donors were an average of approximately ten years older and three BMI units heavier than non-diabetic donors [4].
Evidence is unevenly distributed across the three candidate genes. Munc13-4 is the only gene with concordant evidence in both cohorts (2.065 in discovery proteomics, 2.001 in replication transcriptomics). STX7 was not retained in the processed discovery proteomics matrix and was therefore not testable there, and CTSD was unremarkable in discovery (SD ratio 1.148) despite ranking at the 98.4th percentile in replication. STX7 and CTSD should accordingly be regarded as single-cohort observations.
Both cohorts used bulk islet tissue. In the replication cohort, derived from a surgical pancreatectomy in living donors, malignant pancreatic tumors were present in 69% of T2D and 50% of non-diabetic donors. Although pathological review reported no neoplastic cells in the islets and exocrine contamination was comparable to enzymatically isolated islets[4]. A systemic or local pro-inflammatory effect of the underlying malignancy cannot be excluded. The Munc13-4 signal did persist after adjustment for immune infiltration.
We observed an unexplained reduction in proteome dispersion in the pre-T2D group (permutation P = 0.024). It was not accounted for by age, BMI, culture time, or islet recovery, all of which were adjusted for before analysis. Given the size of the group (n = 20) and the fact that this test does not survive correction across those performed on this cohort, we report it without interpretation pending independent replication.
RAB3A illustrates a more generalized hazard: a signal reaching FDR significance in discovery did not survive independent testing. We reported that failure alongside the replication.
Finally, protein abundance is not functional flux. In the discovery cohort, the crinophagy variance signature showed no significant association with insulin content per islet equivalent, insulin:DNA ratio, or total insulin content. We therefore cannot say whether Munc13-4 variation has consequences for β-cell function, nor whether high or low levels represent the unfavorable state.
3.5. Variance as a Disease Phenotype
Our findings indicate that inter-individual variance can constitute a disease phenotype in human T2D islets. Conventional differential expression analyses identify molecules whose average abundance shifts between groups; they are not designed to identify molecules whose average abundance is preserved while their regulation becomes more heterogeneous. Munc13-4 is a concrete example. Its mean is unchanged in the discovery proteomics, in published single-cell β-cell data in which 248 other genes reach significance, and in a conventional mean-difference analysis of our own cohort, yet its inter-individual variance places it in the top one percent of 20,255 expressed genes.
Differential variability has been examined in schizophrenia[7,8,9], cancer, and aging[10]. What this analysis adds is a case in which the variance-selected gene has established, independently characterized function in the process under study, in which conventional analysis demonstrably returns nothing and in which the effect is shown not to reflect a global increase in variability.
Whether this variance reflects differences in crinophagic engagement, disease history, or other donor-specific biology remains unresolved. The value of the observation lies not in establishing Munc13-4 as a marker of dysfunction, but in identifying a measurable molecular axis along which T2D islets differ between individuals.
3.6. Outlook
The question that follows is whether this heterogeneity is functionally consequential. The prediction is specific and testable: if Munc13-4 abundance is rate-limiting for crinophagic flux, cells at the extremes of the observed range should differ in the rate at which they degrade aged iSGs. Our Munc13-4 knockout mouse line and the live-cell crinophagy assay developed [12] in our earlier work provide a direct route to testing whether variation across the range observed here is sufficient to alter flux.
More broadly, if β cell failure in T2D proceeds along individually variable routes rather than a single shared trajectory, the molecules at which that variability concentrates may be as informative as those with the largest average change. As deep phenotyping of human islet resources continues to develop, evaluating inter-individual variance alongside mean abundance may help to map that variability.
4. Materials and Methods
4.1. Gene and Protein Set Pre-Registration
Two sets were defined before any statistical evaluation and deposited with a timestamped DOI [13]. The crinophagy set (n = 31) comprises four functional groups: SG-lysosome fusion machinery (UNC13D, STX7, STX8, STX17, VAMP7, VAMP8, SNAP23, VPS33A, VPS16, VPS11); Ca2+-regulated granule identity and tethering (RAB3A, RAB3GAP1, RAB27A, CADPS, SYTL4, PCLO); lysosomal degradation and acidification (LAMP1, LAMP2, CTSB, CTSD, CTSL, ATP6V0D1, ATP6V1A, TFEB, PIKFYVE); and secretory cargo (INS, CHGA, CHGB, PCSK1, PCSK2, CPE).
The comparator set (n = 14) comprises macroautophagy components: core initiation and conjugation machinery (ATG3, ATG5, ATG7, BECN1, ULK1, WIPI2), the ATG8 family (MAP1LC3A, MAP1LC3B, GABARAP, GABARAPL1, GABARAPL2), and selective autophagy cargo receptors (SQSTM1, NBR1, CALCOCO2).
The comparator set underwent one revision before any statistical test, documented with its date in the deposited repository. Version 1 comprised seven macroautophagy components, with MAP1LC3B as the sole ATG8-family member. Neither MAP1LC3B nor ATG12 was detected in the discovery proteomics, so the set was expanded to include the ATG8-family members assayable in the data (MAP1LC3A, MAP1LC3B, GABARAP, GABARAPL1, GABARAPL2) together with the selective autophagy cargo receptors listed above. MAP1LC3C was not included and was absent from the replication transcriptome. ATG12 was excluded because it was detected in neither dataset. MAP1LC3B was retained in the final set because it was measurable in the replication transcriptomics; it was inadvertently omitted from the version 2 file and is restored in version 3 of the deposit, which contains the fourteen-member comparator used throughout. All versions remain publicly accessible, and the 31-member crinophagy set is identical across all three versions.
We mapped identifiers across Entrez, UniProt, and Ensembl programmatically using org.Hs.eg.db (v3.23.1) rather than by manual cross-referencing, and we verified every accession used in the analysis against the relevant expression matrix before testing. This safeguard is material: an incorrect accession produces a silent absence rather than an error, and absence is not distinguishable from biological non-detection without verification.
4.2. Discovery Cohort
Human islet proteomic profiles, bulk transcriptomics, and donor metadata were obtained from HumanIslets.com [28]. All 129 donors with proteomics data were negative for type 1 diabetes. Glycemic status was assigned using the corrected diagnostic classification (‘diagnosis_computed’), which reconciles the clinical record against HbA1c, yielding 91 non-diabetic, 20 pre-T2D and 18 T2D donors. This field was used in preference to the chart-reported diagnosis, which differed for 21 donors (16%); the reclassification is given in Table S1.
Two proteomics matrices are distributed and were used for different purposes. The processed matrix (6,138 proteins, Entrez-keyed) contains no missing values and was used for pathway-level scoring, mean-difference analysis, and proteome-wide dispersion analysis. The unprocessed matrix (8,194 proteins, UniProt-keyed) retains 7.1% missing values and was used to assess detection frequency and to compute per-protein SD ratios, since 2,056 proteins present in the raw matrix are absent from the processed one. Because the two used different identifier systems, gene sets were mapped separately for each. Proteins absent from a given matrix were not testable in analyses based on it; this is stated where relevant in the results.
The processed matrix contains no missing values, whereas the unprocessed matrix contains 7.1%. The imputation or filtering procedure applied by the data provider is not documented in the distributed README, and we were unable to determine it. Because deterministic or low-end imputation can compress within-group variance, all discovery per-protein variance estimates were computed on the unprocessed matrix, and detection frequency was assessed before any variance estimates were interpreted.
Of the 129 donors, 123 had complete covariate data. These 123 were used for pathway-level and proteome-wide analyses, and also to fit the per-protein covariate models; per-protein SD ratios were then computed from the residuals of the 87 non-diabetic and 16 T2D donors. The mean difference analysis used the 103 donors in the two-group non-diabetic versus T2D comparison.
No donor was excluded on the basis of outlier detection. No formal outlier criterion was applied in either cohort, and all donors meeting the covariate-completeness requirement were retained.
4.3. Pathway Scoring and Discovery-Cohort Analysis
Single-sample enrichment scores were computed with GSVA (v2.6.6) [29] in ssGSEA mode on the processed proteomics matrix with score normalization disabled (normalize = FALSE). Score normalization rescales by the range of scores across samples and compresses the dynamic range of small gene sets and obscures between-donor variation, which is the quantity of interest here.
Mean differences were tested by a linear model:
where Status is glycemic group (or, in a separate model, continuous HbA1c), CultureTime is pre-distribution culture duration in hours, and IEQ is percent islet equivalent recovery after culture. No direct measure of exocrine contamination was available; islet recovery and particle index were used as quality proxies, and this substitution is a limitation.
y_i = β₀ + β₁·Status_i + β₂·Age_i + β₃·Sex_i + β₄·BMI_i + β₅·CultureTime_i + β₆·IEQ_i + ε_i
Variance heterogeneity was assessed on the residuals ε̂ using median-centered Levene's (Brown-Forsythe) test with a permutation null of 10,000 label shuffles and within-group bootstrap confidence intervals from 10,000 resamples. Leave-one-out analysis removed each T2D donor in turn and refitted.
Per-protein SD ratios were computed identically on the unprocessed matrix, with Benjamini-Hochberg correction applied across the 31 pre-registered crinophagy proteins. This correction applies to the discovery cohort only; the multiple-testing scheme for the replication cohort is given in Section 4.7.
A conventional mean-difference analysis was run on the same 103 donors under the identical covariate model, testing each of the 6,138 proteins in the processed matrix, to establish where the variance candidates fall within a standard differential-abundance framework.
4.4. Proteome-Wide Dispersion
Proteome-wide dispersion was assessed in the 123 donors with complete covariates. Each protein was residualized on age, sex, BMI, culture time, and islet recovery with no term for glycemic status, and the residual matrix was projected by principal component analysis (centered, not scaled). Dispersion was quantified as the Euclidean distance of each donor from its group centroid across the first five principal components. Group differences were tested by permutation (10,000 shuffles of the group labels), with centroids recomputed under each permuted labeling, since centroid distance depends on group membership. Sensitivity to the number of retained components was examined at 2, 3, 5, and 10. The results were cross-checked with betadisper (vegan)[30].
4.5. Replication Cohort
Raw HTSeq counts and sample metadata for GSE164416[4] were obtained from NCBI GEO using FTP server. Sample identifiers were matched to the count matrix through the donor codes in the sample titles.
Library preparation date was strongly associated with glycemic status (chi-square P = 0.00068); one preparation batch contained IGT and T3cD donors but no non-diabetic donors. All models therefore include preparation batch as a factor, and comparisons were restricted to batches containing both compared groups. One batch of two samples was excluded as unadjustable. The primary comparison retained 18 non-diabetic and 36 T2D donors. Donors with impaired fasting glucose (n = 3) were excluded on sample size; donors with type 3c diabetes were analyzed separately, as pancreatogenic diabetes is mechanistically distinct from type 2 diabetes.
Per-donor clinical covariates (age, sex, BMI) are not available in the GEO metadata for this cohort and could not be included in the model. This is an asymmetry relative to the discovery cohort and is stated as a limitation.
Genes were retained if at least 10 samples had at least 10 counts, leaving 20,255 genes. Counts were variance-stabilized with DESeq2 (v1.52.0) [31] using blind = TRUE, so that the transformation could not borrow information from the group labels. This matters specifically for a variance analysis, since a design-aware transformation could partly encode the effect under test.
4.6. Composition Covariates
Two per-donor scores were computed as the mean variance-stabilized expression of marker panels.
Immune infiltration score (34 genes): MS4A1, PTPRC, CD3E, CD79A, CD79B, MZB1, JCHAIN, CCL19, CCL18, CMA1, CTSG, TPSAB1, CPA3, together with immunoglobulin genes present in the filtered matrix.
β cell content score (8 genes): INS, IAPP, NKX6-1, PDX1, MAFA, G6PC2, ADCYAP1, SLC30A8.
Immunoglobulin and immune-cell genes were included because they dominated the upper tail of the genome-wide SD-ratio distribution, consistent with variable lymphocytic content in the surgically obtained tissue. Both scores were themselves more variable among T2D than non-diabetic donors (immune SD 0.755 versus 0.356; β cell SD 0.583 versus 0.396), which is why adjustment was necessary rather than optional.
Scores were computed as unweighted means of marker expression rather than by formal cell-type deconvolution. Deconvolution frameworks such as MuSiC or BisqueRNA were not applied, and the composite scores were not tested for sensitivity to single-gene outlier expression; this is a limitation.
INS appears both in the crinophagy set and in the β-cell content score; therefore, its SD ratio under Model 2 is partly self-adjusted. We therefore recomputed the β cell score from the remaining seven markers and repeated the analysis. The two scores correlated at r = 0.996, and the genome-wide SD-ratio ranking was essentially unchanged (Spearman 0.999). UNC13D was unaffected (2.001, 99.40th percentile, versus 2.001, 99.38th), STX7 shifted marginally (1.877, 98.96th, versus 1.899, 99.09th), and INS itself moved from 0.974 to 0.961. The partial self-adjustment of INS therefore does not account for its attenuation after composition adjustment. At the set level, the median shift was retained (observed 1.172 versus null 1.077, permutation P = 0.043), whereas the tail-enrichment test was not (one of 31 members above the model-specific 99th percentile of 1.890, P = 0.27), because STX7 falls marginally below that raised threshold. The tail statistic is therefore sensitive to the precise threshold in a way the median shift is not. Full results are given in Table S5.
4.7. Variance Analysis
Two models were fitted and are reported throughout:
- Model 1: expression ~ batch
- Model 2: expression ~ batch + immune score + β-cell score
Model 2 is designated primary. The justification is that the confounds it addresses are demonstrably present in these data, not that it yields more favorable results; both models are reported for every gene and every set-level test, including where they disagree.
For each gene g, residuals were taken from the relevant model and the SD ratio computed as the ratio of residual standard deviations:
R_g = SD(ε̂_g,T2D) / SD(ε̂_g,ND)
Note that R is a ratio of standard deviations, not of variances.
Significance was assessed by a median-centered Levene's test in its Brown-Forsythe form [32] and the ratio's uncertainty by within-group bootstrap. Bootstrap iterations were 10,000 for the discovery cohort, 5,000 for the replication cohort and the pre-registered panels, and 2,000 for the exploratory panel described in section 4.10; the number is stated with each result. All resampling used set.seed(1).
In the replication cohort, Benjamini-Hochberg correction[33] was applied within the pre-registered comparator panel, which constitutes the multiple-comparison family for the specificity analysis. The crinophagy genes constitute the primary hypothesis and are reported uncorrected alongside their genome-wide percentiles.
Levene's test and the SD ratio both used an n - 1 denominator, so the ratio is unbiased for the quotient of population standard deviations under normality. Because R is a quotient of two standard deviations rather than a difference, its sampling distribution is right-skewed; confidence intervals were therefore obtained by within-group bootstrap rather than from a normal approximation. Because both standard deviations are estimated from residuals of the same model, the denominator convention largely cancels and residual asymmetry arises only from the unequal group sizes. A sensitivity analysis recomputing all ratios with an n - p denominator did not change the ranking (Spearman correlation of ranks = 1.000; mean absolute change in ratio 0.15%).
4.8. Genome-Wide Reference Distribution
The SD ratio was computed for all 20,255 retained genes under each model separately, giving two reference distributions. A gene's percentile is always taken against the distribution computed under the same model. This addresses the objection that gene expression is generally more variable in disease: the relevant question is not whether a gene’s ratio exceeds 1.0 but where it falls among all genes measured in the same way.
Model-specific 99th percentile thresholds were 1.918 (Model 1) and 1.882 (Model 2); background medians were 1.090 and 1.077.
4.9. Set-Level Tests
Both sets were frozen before analysis, so set-level tests are pre-registered. Two were performed.
Median shift. The set’s median SD ratio was compared against 1,000,000 random gene sets of equal size drawn from the genome-wide reference distribution under the same model, using set. seed(1). Reported P values are stable to two significant figures across seeds.
Tail enrichment. The number of set members exceeding the model-specific 99th percentile was tested against a binomial expectation of 1%.
The hypothesis framework is hierarchical. The primary hypothesis is set-level variance expansion, tested by permutation. Gene-level results within the crinophagy set are a secondary, exploratory layer, reported with exact genome-wide percentiles and uncorrected P values; formal FDR control is applied only within the pre-registered comparator panel.
4.10. Post-Hoc Panels
Three panels were assembled after the primary analysis. All are identified as post-hoc in the results and figures, and none contributes to any pre-registered set-level statistic.
Regulated exocytosis panel. Genes were selected from the published T2D insulin secretion literature (STX1A, STX1B, STX4, SNAP25, SNAP23, VAMP2, STXBP1, STXBP2, STXBP3, STXBP5, STXBP5L, UNC13A, UNC13B, UNC13C, SYT7, SYT9, RIMS2), tested to determine whether elevated variance is a general property of β cell membrane fusion machinery. STX1A was added to the figures as a single post-hoc comparator following its identification as mean-shifted in T2D β cells [14].
CAPS family. CADPS, CADPS2, and BAIAP3 were tested as the second MUN-domain priming factor family. CADPS is a member of the frozen crinophagy set and is identified as pre-registered; CADPS2 and BAIAP3 are post-hoc.
Extended autophagy lysosome panel. A total of 136 genes grouped by position in the pathway (autophagosome donor side, SG donor side, shared lysosomal acceptor, upstream signaling) were tested to determine whether variance was elevated in a particular compartment. Of these, 29 are members of the frozen crinophagy set; these were plotted by position but excluded from every group-level summary and from the FDR calculation, since a comparison containing the test genes is not a comparison. Benjamini-Hochberg correction was applied across the 107 post-hoc genes.
4.11. Independent Single-Cell Data
Cell-type-resolved differential expression was taken from the published supplementary tables of Lawlor et al.[14], which report likelihood ratio tests with Benjamini-Hochberg[33] correction across 7,441 genes per comparison. No reanalysis of the primary single-cell data was performed. Their T2D versus non-diabetic comparison pools cells across donors, so significant results there may be influenced by donors contributing many cells; results are used here principally as a null mean-difference reference, for which this is a conservative direction.
Donor-level variance was not estimated from these data, as the number of donors per group does not support it.
4.12. Analyses Not Performed
Gene-gene correlation or coexpression network comparison between groups was not attempted; correlation estimates require substantially larger samples than variance estimates, and differential network structure at n=18 versus 36 would not be reliable. No classifier or ROC analysis was performed, as the sample size does not support a claim of diagnostic utility. Variance component partitioning was not attempted for the same reason; the nested-model comparison serves the same purpose within the limits of the data.
4.13. Software and Reproducibility
Analyses were performed in R (v4.6.1) and Python (v3.14.6). Key packages: GSVA (v2.6.6)[29], DESeq2 [31] (v1.52.0), org.Hs.eg.db (v3.23.1), car (v3.1.5), vegan (v2.7.5); numpy, pandas, scipy, statsmodels. Random seeds were fixed for all permutation and bootstrap procedures.
The primary variance analysis was implemented independently in R and Python and gave identical results; we report this as a check against implementation error rather than as independent evidence.
All analysis scripts, the frozen gene set files with their change history, and the derived results tables are available on GitHub (https://github.com/ManiMuralidharan/crinophagy-variance-t2d). All percentiles, ratios, and P values in the manuscript are derived from a single frozen set of output files; no analysis was repeated after freezing.
5. Conclusion
Inter-individual variance identifies molecular differences in T2D islets that are not captured by mean-based analysis. UNC13D, encoding Munc13-4, showed an approximately twofold greater inter-donor standard deviation in T2D in both discovery proteomics and independent replication RNA-seq, despite no corresponding change in mean abundance in independent mean-expression analyses. In the replication transcriptome, UNC13D ranked at the 99.38th percentile of 20,255 expressed genes for inter-donor variance. This phenotype was not explained by globally increased proteome dispersion or by measured differences in islet cellular composition. Together, these findings establish inter-individual variance as a complementary molecular phenotype in T2D and identify Munc13-4 as a reproducible locus of heterogeneity whose functional consequences for crinophagy remain unresolved.
Supplementary Materials
The following supporting information can be downloaded at the website of this paper posted on Preprints.org. Figure S1: Leave-one-out sensitivity of the discovery crinophagy variance test; Figure S2: Global proteome structure and dispersion across glycemic-status groups; Figure S3: Cross-platform concordance of mean abundance and SD ratios; Figure S4: Transcript and protein abundance across the pre-registered panel; Figure S5: Heterogeneity of variance effects across the pre-registered panel; Figure S6: Crinophagy-associated variance candidates are not identified by conventional differential-expression analysis; Figure S7: Donor-level distributions and variance effects across Munc13 paralogues; Figure S8: Elevated variance is concentrated in fusion-execution components rather than Rab regulatory proteins; Table S1: Pre-registered gene sets under both adjustment models; Table S2: Exploratory autophagy-lysosome panel; Table S3: Set-level and tier-level summaries; Table S4: Post-hoc comparator panels; Table S5: Sensitivity of the variance analysis to removal of INS from the β-cell content score.
Author Contributions
Conceptualization, N.M. M.M.; data curation, N.M. M.M.; formal analysis, N.M. M.M.; investigation, M.M.; methodology, N.M. M.M.; software, N.M. M.M.; validation, N.M. M.M.; visualization, P.E. N.M. M.M.; writing — original draft, N.M. M.M.; writing — review and editing, P.E. N.M. and M.M. All authors have read and agreed to the published version of the manuscript.
Funding
This research received no external funding.
Institutional Review Board Statement
Not applicable. This study analyzed publicly available, de-identified human data. Ethical approval for the original studies was obtained by the respective investigators.
Informed Consent Statement
Not applicable.
Data Availability Statement
The pre-registered gene sets are deposited at Zenodo (https://doi.org/10.5281/zenodo.23060343). Analysis scripts are available at GitHub (https://github.com/ManiMuralidharan/crinophagy-variance-t2d). Discovery data were obtained from HumanIslets.com (registration required for access). Replication data are available from the Gene Expression Omnibus under GSE164416. Single-cell mean-difference values were taken from the published supplementary tables of Lawlor et al. (GSE86473).
Conflicts of Interest
Author N.M. is affiliated with Evotec, US Inc., Princeton, NJ. This research was conducted independently using publicly available datasets, without financial support from or scientific involvement of the affiliated organization. The organization had no role in the study design, data analysis, interpretation of results, manuscript preparation, or decision to publish. The authors declare no other conflicts of interest.
Abbreviations
The following abbreviations are used in this manuscript:
| T2D | Type 2 diabetes |
| SG | Secretory granule |
| iSG | Insulin secretory granule |
| SD | Standard deviation |
| FDR | False discovery rate |
| CI | Confidence interval |
| GEO | Gene Expression Omnibus |
| LCM | Laser-capture microdissection |
| PCA | Principal component analysis |
| ssGSEA | Single-sample gene set enrichment analysis |
| IEQ | Islet equivalent |
| MUN | Munc13 homology domain |
References
- Taylor, R. Pathogenesis of type 2 diabetes: tracing the reverse route from cure to cause Diabetologia 2008, 51(10), 1781–9.
- Boughton, C.K.; Munro, N.; Whyte, M. Targeting beta-cell preservation in the management of type 2 diabetes British Journal of Diabetes 2017, 17(4), 134–144.
- Taylor, R. Banting Memorial lecture 2012: reversing the twin cycles of type 2 diabetes Diabet Med 2013, 30(3), 267–75.
- Wigger, L. Multi-omics profiling of living human pancreatic islet donors reveals heterogeneous beta cell trajectories towards type 2 diabetes Nat Metab 2021, 3(7), 1017–1031.
- Avrahami, D.; et al. Single-cell transcriptomics of human islet ontogeny defines the molecular basis of beta-cell dedifferentiation in T2D Mol Metab 2020, 42, 101057.
- Bosi, E.; et al. Integration of single-cell datasets reveals novel transcriptomic signatures of beta-cells in human type 2 diabetes NAR Genom Bioinform Correction in NAR Genom Bioinform, 2021. 3(2): p. lqab053.. 2020. 2(4), lqaa097.
- Zhang, F.; et al. Increased Var. Genom. Transcr. Schizophr. Sci. Rep. 2015, 17995.
- Igolkina, A.A.; et al. Analysis of Gene Expression Variance in Schizophrenia Using Structural Equation Modeling Front Mol Neurosci 2018, 11, 192.
- Huang, G. Overdispersed Gene Expr. Schizophr. npj Schizophr. 2020, 6(1), 9.
- Phipson, B.; Oshlack, A. DiffVar: a new method for detecting differential variability with application to methylation in cancer and aging Genome Biol 2014, 15(9), 465.
- Mani, M.; Martin, T.F.J. Crinophagy in Pancreatic Beta Cells: From Insulin Granule Turnover to Diabetes Pathogenesis Pathophysiology 2026, 33(3).
- Mani, M.; James, D.J.; Martin, T.F.J. Molecular requirements for mammalian crinophagy highlight a key role for Ca (2+) -Depend. Munc13-4 Res. Sq. 2025. [CrossRef]
- Mani, M.; Martin, T.F.J. Pre-registered crinophagy and macroautophagy gene sets. 2026. [Google Scholar]
- Lawlor, N. Single-cell transcriptomes identify human islet cell signatures and reveal cell-type-specific expression changes in type 2 diabetes Genome Res 2017, 27(2), 208–222.
- Feldmann, J.; et al. Munc13-4 is essential for cytolytic granules fusion and is mutated in a form of familial hemophagocytic lymphohistiocytosis (FHL3) Cell 2003, 115(4), 461–73.
- Khodthong, C.; et al. Munc13 homology domain-1 in CAPS/UNC31 mediates SNARE binding required for priming vesicle exocytosis Cell Metab 2011, 14(2), 254–63.
- Ma, C.; et al. Munc13 mediates the transition from the closed syntaxin-Munc18 complex to the SNARE complex Nat Struct Mol Biol 2011, 18(5), 542–9.
- Yang, X.; et al. Syntaxin opening by the MUN domain underlies the function of Munc13 in synaptic-vesicle priming Nat Struct Mol Biol 2015, 22(7), 547–54.
- Nguyen Truong, C.Q.; et al. Secretory vesicle priming by CAPS is independent of its SNARE-binding MUN domain Cell Rep 2014, 9(3), 902–9.
- Binda, A.V.; Kabbani, N.; Levenson, R. Regulation of dense core vesicle release from PC12 cells by interaction between the D2 dopamine receptor and calcium-dependent activator protein for secretion (CAPS) Biochem Pharmacol. 2005, 69(10), 1451–61.
- Zhang, X.; et al. BAIAP3, a C2 domain-containing Munc13 protein, controls the fate of dense-core vesicles in neuroendocrine cells J Cell Biol 2017, 216(7), 2151–2166.
- Augustin, I.; et al. The cerebellum-specific Munc13 isoform Munc13-3 regulates cerebellar synaptic transmission and motor learning in mice J Neurosci 2001, 21(1), 10–7.
- Liang, T.; et al. New Roles of Syntaxin-1A in Insulin Granule Exocytosis and Replenishment J Biol Chem 2017, 292(6), 2203–2216.
- Daraio, T.; et al. SNAP-25b-deficiency Increases Insul. Secret. Chang. Spatiotemporal Profile Ca (2+) Oscil. Beta Cell Netw. Sci. Rep. 2017, 7(1), 7744.
- Regazzi, R.; et al. VAMP-2 and cellubrevin are expressed in pancreatic beta-cells and are essential for Ca (2+) -But Not. GTP Gamma S-Induc. Insul. Secret. EMBO J. 1995, 14(12), 2723–30.
- Perez, K.C.; et al. Tomosyn-2 Regulates Postnatal beta-Cell Expansion and Insulin Secretion to Maintain Glucose Homeostasis Diabetes 2026, 75(5), 799–815.
- Kashima, Y.; et al. Critical role of cAMP-GEFII--Rim2 complex in incretin-potentiated insulin secretion J Biol Chem 2001, 276(49), 46046–53.
- Ewald, J.D. HumanIslets.com: Improving accessibility, integration, and usability of human research islet data Cell Metab 2025, 37(1), 7–11.
- Hanzelmann, S.; Castelo, R.; Guinney, J. GSVA: gene set variation analysis for microarray and RNA-seq data BMC Bioinformatics 2013, 14, 7.
- Oksanen, J. Vegan Community Ecol. Package R Package Version 2015, 3.
- Love, M.I.; Huber, W.; Anders, S. Moderated estimation of fold change and dispersion for RNA-seq data with DESeq2 Genome Biol 2014, 15(12), 550.
- Brown, M.B.; Forsythe, A.B. Robust tests for the equality of variances Journal of the American statistical association 1974, 69(346), 364–367.
- Benjamini, Y.; Hochberg, Y. Controlling the false discovery rate: a practical and powerful approach to multiple testing Journal of the Royal statistical society: series B (Methodological) 1995, 57(1), 289–300.
Disclaimer/Publisher’s Note: The statements, opinions and data contained in all publications are solely those of the individual author(s) and contributor(s) and not of MDPI and/or the editor(s). MDPI and/or the editor(s) disclaim responsibility for any injury to people or property resulting from any ideas, methods, instructions or products referred to in the content. |
© 2026 by the authors. Licensee MDPI, Basel, Switzerland. This article is an open access article distributed under the terms and conditions of the Creative Commons Attribution (CC BY) license.
Copyright: This open access article is published under a Creative Commons CC BY 4.0 license, which permit the free download, distribution, and reuse, provided that the author and preprint are cited in any reuse.