

Submitted:
27 October 2026
Posted:
28 October 2026
You are already at the latest version
Abstract
Background: Retinoblastoma is the most common primary intraocular malignancy of childhood and is nearly universally curable where effective services exist: three-year survival is 99.5% in high-income countries versus 57.3% in low-income countries. Because its occurrence is largely non-modifiable while its outcome is highly treatment-dependent, retinoblastoma is among the most sensitive tracers of childhood cancer cure capacity. We quantified its global burden, trends, and diagnosis–outcome gap. Methods: We analysed Global Burden of Disease (GBD) Study 2023 estimates (results release v8352) for retinoblastoma (cause_id 1009). Deaths and incident cases at ages 0–19 years — the sum of the <5, 5–9, 10–14, and 15–19-year bands — were extracted for the global level, 21 regions, and five Socio-demographic Index (SDI) quintiles over 1990–2023, with a national map for 204 countries in 2022. The mortality-to-incidence ratio (M/I) served as a proxy for cure. Reporting follows GATHER. Results: In 2023, retinoblastoma caused 3,226 deaths (95% uncertainty interval [UI] 1,493–6,569) at ages 0–19 years, down 31.8% from 1990; the crude death rate declined significantly (estimated annual percentage change [EAPC] −1.48% per year, 95% CI −1.60 to −1.36), while the incident case count rose significantly (EAPC +0.63%, 95% CI 0.40 to 0.87). The global M/I fell from 87.4% to 55.5%, yet the low-to-high SDI M/I ratio widened from 3.1-fold to 13.0-fold — the widest disparity among 14 childhood cancers by point estimate (95% UI 3.02–39.65). Children under 5 years accounted for 87.7% of deaths (95% UI 67.1–96.1). The cross-SDI mortality gradient (18.8-fold) far exceeded the incidence gradient (1.5-fold). Conclusions: Residual retinoblastoma mortality is concentrated almost entirely in children under 5 years in low-SDI settings and is consistent with an outcome-driven divide rooted in diagnostic delay and treatment access. Community-level recognition of leukocoria offers the highest-leverage intervention, and the M/I provides a measurable indicator for monitoring the WHO Global Initiative for Childhood Cancer.
Keywords:
retinoblastoma
; childhood cancer
; mortality-to-incidence ratio
; Global Burden of Disease
; health equity
; early diagnosis
1. Introduction
1.1. A Curable Cancer with a Stark Survival Divide
Retinoblastoma, the most common primary intraocular malignancy of childhood, holds a foundational place in cancer biology: Knudson’s statistical analysis of its onset gave rise to the two-hit hypothesis of tumour-suppressor inactivation [1]. Its incidence is largely a function of the number of births rather than of modifiable exposures [2], with approximately 8,000 children diagnosed worldwide each year [3]. Clinically, it is one of the greatest success stories in paediatric oncology — but only where treatment is accessible. Three-year survival was 99.5% in high-income countries (HICs) against 57.3% in low-income countries (LICs), and extraocular extension at diagnosis was present in 0.8% of HIC patients versus 42.9% in LIC patients [4]. Treatment has shifted from enucleation and external-beam radiotherapy towards chemoreduction, intra-arterial chemotherapy and globe salvage [5,6], with a 40-year systematic analysis documenting rising survival (79% to 88%) and globe salvage (22% to 44%) [7]. Reflecting this curability, the World Health Organization designated retinoblastoma a tracer cancer of the Global Initiative for Childhood Cancer, which targets at least 60% survival for children with cancer by 2030 [8].
1.2. The Unquantified Diagnosis–Outcome Gap
Two analyses of the Global Burden of Disease (GBD) 2021 round have estimated the retinoblastoma burden to 2021, with the most recent reporting 6,275 incident cases and 2,762 deaths in that year [9]. These are the closest precedents to the present study, but neither exploits the GBD 2023 cycle, neither formalises a mortality-to-incidence (M/I) framework for tracing cure, and neither maps the burden at national level. In parallel, a substantial clinical literature has characterised delayed presentation — leukocoria is the presenting sign in 56.2% of cases [10], the first sign in 73% [11], and median diagnostic delay is 303 days in LICs versus 56 days in HICs [11] — yet this evidence has never been integrated with population-level mortality estimates to quantify where and why children die of a curable disease.
1.3. Study Aims and Contributions
A note on scope is warranted first. Retinoblastoma accounts for a small fraction of childhood cancer deaths, and burden magnitude alone would not justify a dedicated analysis. The case for one rests on structure, not size. Because this cancer is almost universally curable where organized care exists, the large majority of retinoblastoma deaths are, in effect, avoidable deaths that mark where care did not reach. A tumour that is nearly always survivable in high-income settings yet retains one of the widest mortality-to-incidence gradients among childhood cancers is therefore not a minor topic within the childhood cancer agenda but one of its most sensitive instruments: a tracer whose map of deaths localizes the failure of the care system rather than the biology of the disease. That framing, rather than absolute burden, motivates this standalone analysis.
Against this background, and using GBD 2023 estimates, we present a complete 1990–2023 time series of retinoblastoma mortality and incidence at ages 0–19 years across the global level, 21 regions, five Socio-demographic Index (SDI) quintiles and 204 countries, complementing the GBD 2023 childhood cancer assessment [12]. The study makes three contributions. First, it provides the first full-series GBD 2023 account of this cause, estimating 3,226 deaths (95% uncertainty interval 1,493–6,569) in 2023, of which 87.7% occurred in children younger than 5 years. Second, it quantifies the low-to-high SDI M/I ratio at 13.0-fold in 2023, up from 3.1-fold in 1990. Third, by decomposing the cross-SDI gradient, it shows that the 18.8-fold mortality gradient far exceeds the corresponding incidence gradient, providing population-level evidence that the divide is driven by differences in cure — diagnostic delay and treatment access — with direct implications for early-detection programmes centred on leukocoria recognition.
2. Methods
2.1. Data Sources and Case Definition
This study is a secondary analysis of the Global Burden of Disease (GBD) Study 2023 (results release v8352). We extracted all available estimates for retinoblastoma (GBD cause_id 1009), a cause that corresponds name-for-name to group V (retinoblastoma) of the International Classification of Childhood Cancer, third edition (ICCC-3) [12]. Estimates were obtained through the GBD Results Tool [13] for 27 aggregate locations — the global level, 21 GBD regions, and five Socio-demographic Index (SDI) quintiles — for the years 1990–2023, both sexes combined, and two measures: deaths and incidence, each expressed as counts (Number). Age-specific estimates covered the four non-overlapping paediatric age bands <5, 5–9, 10–14, and 15–19 years. The GBD 2023 modelling framework for causes of death, population denominators, and disease incidence has been described in detail elsewhere [14,15,16]. All estimates carry 95% uncertainty intervals (UIs) as published in the GBD extracts.
2.2. Age Aggregation, Denominators, and Uncertainty Propagation
The 0–19-year population was defined as the sum of the four age bands <5, 5–9, 10–14, and 15–19 years; the 20–24-year band was not included. Crude rates per 100,000 were computed as the 0–19 count divided by the corresponding 0–19 population. Because national age-structured populations are not directly reported for the aggregate locations used here, 0–19 population denominators were back-calculated from the GBD age-specific estimates and their published rates, yielding internally consistent denominators for each location and year. For derived quantities — percentage changes between years, ratios across SDI quintiles, and the mortality-to-incidence ratio — uncertainty was propagated by Monte Carlo simulation (20,000 draws from truncated normal distributions parameterised by the published point estimates and UIs), reporting the 2.5th, 50th, and 97.5th percentiles. Where point-estimate ratios differed from Monte Carlo medians owing to Jensen’s inequality, both conventions are reported and distinguished in the text and tables.
2.3. Mortality-to-Incidence Ratio and Trend Metrics
The primary equity metric was the mortality-to-incidence ratio (M/I), defined as deaths divided by incident cases in the same location, year, and age range, multiplied by 100. M/I is used here as a proxy for the probability of cure conditional on diagnosis — not as a survival estimate — under the explicit caveat that GBD incidence is itself modelled in part from mortality via region-specific mortality-to-incidence regressions, which introduces a degree of circularity discussed in the limitations. Inequality was summarised as the ratio of M/I in the low-SDI quintile to that in the high-SDI quintile for 1990 and 2023. Secular trends in rates and counts were quantified using the estimated annual percentage change (EAPC), obtained from an ordinary least-squares regression of the natural logarithm of the annual value on calendar year over 1990–2023; EAPC was computed as 100 × (exp(b) − 1) with 95% confidence interval b ± 1.96 × SE, and a trend was deemed significant when the confidence interval excluded zero. To characterise the COVID-19 pandemic window, we computed percentage changes in deaths over 2019→2021 (disruption), 2021→2023 (recovery), and 2019→2023 (net), at the global level and by SDI quintile. Because retinoblastoma is a rare cause, some location–year cells have wide UIs; we report point estimates alongside Monte Carlo UIs and refrain from interpreting year-to-year fluctuations whose intervals are compatible with zero.
Joinpoint Segmentation and SDI-Quintile Inequality Indices
Two complementary analyses were added to the trend and equity framework. Continuous segmented log-linear (joinpoint) models were fitted to ln(rate) on calendar year for the global and SDI-quintile crude death and incidence series, 1990–2023, with 0–3 joinpoints exhaustively grid-searched (minimum four observations per segment), BIC model selection, and segment annual percent changes (APCs) and span-weighted average APCs (AAPCs) reported with t-distribution 95% CIs reflecting regression precision only (Supplementary Table S7). Inequality across the five SDI quintiles was summarized for 1990 and 2023 by the slope index of inequality (SII; population-weighted ridit regression) and the concentration index (CII), with 95% CIs from 1,000 bootstrap draws propagating rate uncertainty (truncated normal, SD = [upper − lower]/3.92) (Supplementary Table S8). Because the trend extraction frame comprises 27 aggregate locations rather than national series, these are quintile-level analogues of the WHO Health Equity Monitor definitions.
2.4. Country-Level Analysis for 2022
To map the diagnosis–outcome gap geographically, we assembled a national-level dataset for 2022, the most recent year with complete country coverage in our extracts, covering 204 countries and territories; deaths and incident cases at ages 0–19 years were obtained by summing the four paediatric age bands per country. Crude national rates per 100,000 were computed against 0–19-year population denominators taken from the GLOBOCAN 2022 (United Nations World Population Prospects) reference populations [17], because GBD age-structured national populations were not part of this extraction; this denominator-source caveat is acknowledged in the limitations. Population denominators were unavailable for 25 small countries and territories, so national rates are reported for the remaining 179 countries, whereas counts are reported for all 204. Taiwan (Province of China) is shown together with mainland China, consistent with GBD naming conventions. National totals were checked against the corresponding GBD global estimate for internal consistency.
2.5. Reporting, Ethics, and Software
Reporting follows the Guidelines for Accurate and Transparent Health Estimates Reporting (GATHER) [18]; the completed checklist is provided in the supplement. The study used de-identified, publicly available, aggregate GBD estimates and was therefore exempt from institutional review board approval and informed consent requirements. All analyses were performed in Python 3 (pandas and NumPy libraries), and all figures and tables are fully reproducible from the extracted data and analysis code.
3. Results
3.1. Global Mortality and Incidence Trends, 1990–2023
Global retinoblastoma deaths and incident cases at ages 0–19 years are summarised at six anchor timepoints in Table 1, and the full annual series with 95% uncertainty intervals (UIs) is shown in Figure 1a–b. In 2023, retinoblastoma caused an estimated 3,226 deaths (95% UI 1,493–6,569) and 5,808 incident cases (3,574–9,819) worldwide in this age group, corresponding to crude rates of 0.121 deaths and 0.217 cases per 100,000 population aged 0–19 years. Between 1990 and 2023, the global death count fell by 31.8% (Monte Carlo median; the direct point-estimate ratio yields −32.2%, the small discrepancy reflecting uncertainty-interval propagation), whereas incident cases rose by 6.1% (point ratio +6.7%). The estimated annual percentage change (EAPC) in the crude death rate was −1.48% per year (95% CI −1.60 to −1.36), a sustained and statistically significant decline mirrored by the death count (EAPC −1.00%, 95% CI −1.12 to −0.87). In contrast, the incident case count increased significantly (EAPC +0.63%, 95% CI 0.40 to 0.87), while the crude incidence rate was essentially flat (EAPC +0.14%, 95% CI −0.10 to 0.37). Figure 1a–b therefore displays a progressive decoupling of occurrence from outcome: slowly rising case numbers against a steadily falling death toll, with uncertainty bands that widen in relative terms because retinoblastoma is a rare cause.
3.2. Position Within the Childhood Cancer Burden
Retinoblastoma is a small but stable component of the paediatric cancer burden. Its share of all deaths from neoplasms at ages 0–19 years was 2.35% in 1990 and 2.17% in 2023 (95% UI 0.99–3.91), a change of less than 0.2 percentage points over 33 years. Against the 14 malignant childhood cancers analysed comparatively, retinoblastoma accounted for 3.01% of deaths in 1990 and 2.80% in 2023, ranking seventh of the 14 causes in 2023; its share of the 14-cancer incidence total was 1.92%. The stability of these shares indicates that the absolute mortality decline has proceeded broadly in parallel with that of other childhood cancers, rather than reflecting exceptional progress for this cause alone.
3.3. Mortality-to-Incidence Ratio as a Cure Proxy
The mortality-to-incidence ratio (M/I) is presented in Figure 2. Globally, the M/I fell from 87.4% in 1990 to 55.5% in 2023 (Monte Carlo estimate 55.4%, 95% UI 21.3–125.1); the wide interval reflects the compounded uncertainty of two rare-event estimates and is reported in full. The 2023 gradient across Socio-demographic Index (SDI) quintiles was steep and monotone: 7.2% in high-SDI countries, 23.4% (high-middle), 34.9% (middle), 68.7% (low-middle) and 93.6% in low-SDI countries, where the M/I point estimate approaches 94%. The low-to-high SDI M/I ratio reached 13.0-fold in 2023 (point estimate 12.95; Monte Carlo 12.97, 95% UI 3.02–39.65), up from only 3.1-fold in 1990, meaning the gap widened roughly fourfold even as outcomes improved everywhere. At the regional level the 2023 range spanned 51-fold, from 99.0% in Central Sub-Saharan Africa (Eastern and Western Sub-Saharan Africa 91.9% and 90.7%) to 1.95% in Australasia (Western Europe 2.71%; high-income Asia Pacific 3.17%).
3.4. Age Pattern
Figure 1c–d contrasts the age structure of retinoblastoma with that of leukaemia, the largest childhood cancer killer. In 2023, 87.7% of global retinoblastoma deaths (95% UI 67.1–96.1) occurred in children younger than 5 years, and 12.3% at ages 5–9 years; the GBD attributes essentially no retinoblastoma deaths or cases at ages 10–14 or 15–19 years. The incidence composition was almost identical (88.0% under 5 years). The under-5 crude death rate was 0.44 per 100,000 and the corresponding incidence rate 0.80 per 100,000. Leukaemia shows the mirror image, with deaths distributed almost uniformly across the four age bands (28.1%, 24.8%, 24.1% and 22.9%). Retinoblastoma thus exhibits the most extreme infant-and-toddler peak among the 14 cancers, confining the effective window for detection and cure almost entirely to the first five years of life.
3.5. The COVID-19 Pandemic Window
Figure 3a–b examines 2018–2023. Globally, retinoblastoma deaths at ages 0–19 years were essentially undisturbed by the pandemic: the change from 2019 to 2021 was +0.09% (point estimate; Monte Carlo median +0.6%, 95% UI −100 to +120.6 (UI truncated at the −100% floor of the quantity) — an interval spanning zero whose width we report without smoothing, reflecting the small event counts involved). Deaths then fell by 9.2% between 2021 and 2023, leaving the 2023 total 9.1% below 2019 (Monte Carlo −9.3%); retinoblastoma was one of only three of the 14 childhood cancers — alongside leukaemia and Hodgkin lymphoma — whose 2023 deaths sat below their 2019 level. SDI-stratified changes revealed a pulse pattern in higher-income settings, where deaths first rose then fell sharply (high SDI +16.1% then −33.3% (point estimates on small annual counts of about 75–120 deaths; uncertainty intervals span no change); high-middle +12.4% then −21.6%), whereas low-SDI countries declined slowly throughout (−2.0% then −3.8%). A transient rise in modelled incidence in 2020–2021 (index 113.9 versus 2019 = 100) is shown separately in Supplementary Figure S1; it likely reflects the GBD back-calculation of incidence from deaths and should not be read as a true surge.
3.6. Socio-Demographic Gradient and Country-Level Map, 2022
Table 2 details the 2023 SDI gradient, and Figure 3c maps estimated national death rates for 2022 across 204 countries and territories (179 with computable rates; 25 small island states and territories lacked population denominators). The 2023 crude death rate rose monotonically from 0.013 per 100,000 in high-SDI to 0.247 per 100,000 in low-SDI countries — an 18.8-fold gradient, the steepest among the 14 childhood cancers. By contrast, the incidence-rate gradient was only 1.5-fold (0.182 versus 0.264 per 100,000). The diagnosis–outcome gap therefore lies in survival: the mortality gradient is driven almost entirely by differences in the probability of dying once retinoblastoma develops (the M/I), rather than by differences in how often it develops. Regionally, the highest 2023 death rates were in Eastern Sub-Saharan Africa (0.531 per 100,000), Andean Latin America (0.326) and Western Sub-Saharan Africa (0.298); the Andean rate reflects high incidence with a moderate M/I (25.2%), whereas sub-Saharan regions combine high incidence with near-fatal outcomes. In the 2022 national map, the largest death counts were in Nigeria (500), India (330) and Kenya (214), and the highest national death rates in Eritrea (2.74 per 100,000), Malawi (1.24) and Burundi (0.93) — concentrating the residual global burden in a limited set of high-burden, predominantly sub-Saharan African countries.
3.7. A National Anchor: China
Because subnational GBD estimates for China are not publicly released, the country-level series offers the finest available domestic granularity. In 2023, the GBD 2023 model placed China at 68.9 retinoblastoma deaths (95% UI 27.8–111.0) against 797.2 incident episodes (300.2–1,446.1) at ages 0–19 years—a mortality-to-incidence ratio of 8.6%, far below the global mean of 55.5% and an order of magnitude below the low-SDI quintile (93.6%). The modelled Chinese M/I has declined from 10.9% in 2018, and the 2020 pandemic year shows no deviation from this downward path.
An independent measurement from China’s own surveillance system corroborates this modelled value almost exactly. The National Childhood Cancer Surveillance Annual Report 2024, drawing on the national monitoring network covering all 31 provinces, reports a measured five-year survival of 90.40% for retinoblastoma in the 2018–2019 diagnostic cohort—the highest survival among all twelve ICCC-3 cancer groups in China. [19] The implied cohort fatality of approximately 9.6% sits within half a percentage point of the GBD-modeled M/I of 8.6% (and well inside its uncertainty interval). Two independent estimation frameworks—a global model and a national registry—thus converge on the same conclusion: China performs far better on this curable cancer than its income level alone would predict, consistent with a strong organized pediatric oncology care system, while the modelled year-on-year decline suggests continued improvement rather than stagnation. The two metrics are different constructs—the M/I is a same-year ratio of modelled deaths to modelled incidence, whereas 1 − 5-year survival is a registry cohort outcome—so the agreement is corroboration, not equivalence.
3.8. Segmented Trends and Inequality Indices
Joinpoint models sharpened the trend narrative (Supplementary Table S7). Global mortality decelerated from −2.32% per year in 1990–2001 to −0.46% (−0.58 to −0.34) in 2010–2020, then declined sharply after a data-driven 2020 joinpoint (−3.84% [−4.36 to −3.32] in 2020–2023; AAPC −1.69% [−1.74 to −1.65]); four of five SDI quintiles carried a 2020 mortality joinpoint, with terminal declines steepest in high-SDI settings (−13.49% [−16.46 to −10.42]) and shallowest in low-SDI settings (−3.46% [−3.88 to −3.04]). Incidence reversed sign at the same 2020 joinpoint globally (2004–2020, +1.41% [1.19 to 1.64]; 2020–2023, −4.02% [−5.70 to −2.30])—the rising-incidence, falling-mortality divergence of Section 4.3 is therefore a pre-2020 phenomenon, and both measures have fallen since. Inequality indices confirmed a persistent outcome divide (Supplementary Table S8): the mortality concentration index was −0.469 (95% CI −0.594 to −0.191) in 1990 and −0.423 (−0.529 to −0.161) in 2023, and the mortality SII remained significantly negative (−0.62 [−1.19 to −0.13] and −0.32 [−0.61 to −0.06] per 100,000), with no significant narrowing across the study period—retinoblastoma deaths stayed concentrated in low-SDI settings even as global mortality fell.
4. Discussion
4.1. Principal Findings
In this GBD 2023 analysis, retinoblastoma mortality at ages 0–19 years fell by 31.8% between 1990 and 2023, to 3,226 deaths (95% UI 1,493–6,569), while incident cases rose modestly but significantly. Three findings define the contemporary epidemiology. First, the low-to-high SDI ratio of the mortality-to-incidence ratio (M/I) widened from 3.1-fold in 1990 to 13.0-fold in 2023 — the widest such disparity among the 14 childhood cancers by point estimate (95% UI 3.02–39.65) — even as outcomes improved in every quintile. Second, the mortality gradient (18.8-fold) far exceeds the incidence gradient (1.5-fold), locating the inequity in outcome rather than occurrence. Third, 87.7% of deaths occurred in children younger than 5 years. Together these findings position retinoblastoma — nearly 100% curable where effective services exist [4] — as a sensitive tracer of childhood cancer cure capacity under the WHO Global Initiative for Childhood Cancer (GICC) [8].
4.2. A Gradient Driven by Outcome, Not Occurrence
The decomposition of the 13.0-fold M/I disparity into a steep mortality gradient against a near-flat incidence gradient indicates that children in low-SDI settings do not develop retinoblastoma much more often than their high-income peers; they die of it. Three independent lines of clinical evidence corroborate this inference. First, the Global Retinoblastoma Study Group’s cohort of 4,064 patients from 149 countries documented three-year survival of 99.5% in high-income, 91.2% in upper-middle-income, 80.3% in lower-middle-income and 57.3% in low-income countries — a staircase that mirrors our SDI-stratified M/I quintiles (7.2% to 93.6%) in both direction and ordering [4]. Second, the same cohort attributed the survival gap to stage at presentation: extraocular disease at diagnosis in 42.9% of low-income versus 0.8% of high-income patients [4]. Third, diagnostic delay has been measured at roughly 303 days in low-income versus 56 days in high-income settings, a lag that converts a curable intraocular tumour into disseminated disease [11]. The M/I therefore behaves as a valid tracer of cure-system performance, though with boundaries: as a ratio of two modelled rare-event estimates, its Monte Carlo uncertainty is wide (the low-to-high ratio spans 3.02–39.65), and it captures the joint effect of diagnostic delay, treatment access and abandonment rather than any single component. We report the full interval rather than over-interpreting the point estimate.
4.3. Rising Incidence, Falling Mortality: An Honest Ambiguity
The significant rise in incident case counts (EAPC +0.63% per year, 95% CI 0.40–0.87) alongside falling deaths admits two explanations that our data cannot separate. Incidence may genuinely be rising, or apparent incidence may be rising because improving diagnostic capacity registers cases that previously died unattributed. The flat crude incidence rate (EAPC +0.14%, 95% CI −0.10–0.37) and the narrow 1.5-fold incidence gradient argue that any true increase in occurrence is modest; the rising case count is driven chiefly by population growth, while the steep M/I decline indicates that an increasing fraction of cases is being found and cured. Either interpretation reinforces the same policy lever. Because leukocoria is the presenting sign in a large majority of cases [10,11], and the entire effective window lies in the first five years of life, community-level recognition of the white pupillary reflex — integrated into routine child-health contacts — offers the highest-leverage intervention for closing the outcome gap, preceding any investment in advanced therapy. Sustained monitoring of retinoblastoma M/I against the GICC target of at least 60% childhood cancer survival by 2030 would operationalise this tracer role 8.
4.4. Comparison with the GBD 2021 Round
Two prior analyses examined retinoblastoma in GBD 2021 [9,20]; Wang et al. estimated 6,275 incident cases and 2,762 deaths in 2021 [9], against our 5,808 cases and 3,226 deaths in 2023. These figures are not directly comparable: the GBD 2023 round incorporates revised cause-of-death modelling, updated data inputs and demographic re-estimation, so part of the difference reflects version effects rather than temporal change (our own 2021 anchor is 3,552 deaths). What is robust across both rounds is the geographic concentration of mortality in sub-Saharan Africa and South Asia and the divergence between stable incidence and declining mortality — a triangulation that strengthens confidence in the qualitative findings while cautioning against cross-version arithmetic.
4.5. Limitations
Several limitations qualify these results. First, the M/I is a proxy, not a measurement: GBD childhood cancer incidence is itself partly back-calculated from mortality using modelled survival, introducing circularity that damps extreme M/I values toward the modelled relationship. Second, retinoblastoma is a rare cause and uncertainty intervals are correspondingly wide — the 2023 global M/I interval spans 21.3–125.1%, and the pandemic-window change (95% UI −100 to +120.6, the lower bound truncated at the −100% floor of the quantity) is uninterpretable beyond its compatibility with no large disruption; we report these widths without smoothing. Third, our crude rates use back-calculated 0–19 population denominators, which may differ marginally from official GBD published estimates [12]. Fourth, the national map covers a single year (2022), uses GLOBOCAN 2022 UN-WPP populations as denominators, and lacks rates for 25 small states. Fifth, GBD estimates do not distinguish hereditary (germline RB1, typically bilateral) from sporadic unilateral disease [3], although the forms differ in age at onset and prognosis; nor do they capture treatment abandonment, a major cause of failure in low-resource settings. Finally, estimates for locations with sparse vital registration rely heavily on modelled covariates. For this reason we deliberately refrain from formal pandemic-window statistics such as interrupted time series regression for this rare cause: with uncertainty intervals this wide, significance assessed at regression precision on the point-estimate series would overstate certainty, and we note that ITS-based window findings reported for more common childhood cancers rest on that narrower inferential frame rather than on the full GBD uncertainty intervals.
These limitations notwithstanding, the coherence of the GBD estimates with independent clinical cohorts supports the central conclusion: the remaining global burden of retinoblastoma death is concentrated, preventable and measurable.
5. Conclusions
This GBD 2023 analysis shows that retinoblastoma deaths at ages 0–19 years fell by 31.8% between 1990 and 2023, to 3,226 (95% UI 1,493–6,569), yet the equity gap widened: the low-to-high SDI mortality-to-incidence ratio reached 13.0-fold (95% UI 3.02–39.65), and 87.7% of deaths occurred before age 5 years. Because the 18.8-fold mortality gradient far exceeds the 1.5-fold incidence gradient, the divide is driven by differences in the probability of cure after diagnosis. Early detection through community-level recognition of leukocoria, coupled with timely referral and access to treatment, is the highest-leverage response, and the mortality-to-incidence ratio offers a tractable indicator for monitoring progress toward the Global Initiative for Childhood Cancer survival target [8]. Future work should extend this framework to national-level time series, link population estimates with Global Retinoblastoma Study Group clinical cohorts [4,21], and stratify hereditary from sporadic disease [3].
Supplementary Materials
The following supporting information can be downloaded at the website of this paper posted on Preprints.org.
Funding
This work was supported by the Beijing Science and Technology Nova Program Interdisciplinary Project (20230484439) and the Beijing High-Level Public Health Technical Talents Project (2023-02-33). The funder had no role in study design, data analysis, interpretation, or writing of the manuscript.:.
Authors’ contributions
SC conceived and designed the study, extracted and analysed the data, and drafted the manuscript. XW contributed to data curation, statistical analysis, and figure preparation. HC and DL contributed to interpretation of the results and critical revision of the manuscript. SC supervised the study. All authors read and approved the final manuscript. SC is the principal investigator who conceived the study and leads its overall conduct.
Ethics approval and consent to participate
Not applicable. This study used de-identified, publicly available, aggregate estimates from the Global Burden of Disease Study 2023 and was exempt from institutional review board approval and informed consent requirements.
Consent for publication
Not applicable.
Availability of data and materials
Use of artificial intelligence. Declaration of generative AI use: AI tools were used for language polishing and code drafting. The datasets analysed in this study are publicly available from the Institute for Health Metrics and Evaluation GBD Results Tool (results release v8352; https://vizhub.healthdata.org/gbd-results)13. The derived analysis tables and analysis code are available from the corresponding author on reasonable request.
Acknowledgments
We thank the Institute for Health Metrics and Evaluation and the Global Burden of Disease collaborator network for making the GBD 2023 estimates publicly available.
Competing interests
The authors declare that they have no competing interests.
References
- Knudson AG Jr. Mutation and cancer: Statistical study of retinoblastoma. Proc Natl Acad Sci USA. 1971;68(4):820–823. PMID: 5279523. [CrossRef]
- Kivelä T. The epidemiological challenge of the most frequent eye cancer: Retinoblastoma, an issue of birth and death. Br J Ophthalmol. 2009;93(9):1129–1131. PMID: 19704035. [CrossRef]
- Dimaras H, Corson TW, Cobrinik D; et al. Retinoblastoma. Nat Rev Dis Primers. 2015;1:15021. PMID: 27189421.
- Fabian ID, Abdallah E, Abdullahi SU; et al.; Global Retinoblastoma Study Group. The Global Retinoblastoma Outcome Study: A prospective, cluster-based analysis of 4064 patients from 149 countries. Lancet Glob Health. 2022;10(8):e1128–e1140. [CrossRef]
- Shields CL, Shields JA. Retinoblastoma management: Advances in enucleation, intravenous chemoreduction, and intra-arterial chemotherapy. Curr Opin Ophthalmol. 2010;21(3):203–212. PMID: 20224400. [CrossRef]
- Munier FL, Beck-Popovic M, Chantada GL; et al. Conservative management of retinoblastoma: Challenging orthodoxy without compromising the state of metastatic grace. Prog Retin Eye Res. 2019;73:100764. PMID: 31173880. [CrossRef]
- Wong JR, Harris MA, Sengooba A; et al. Global retinoblastoma survival and globe salvage: A 40-year systematic analysis. Lancet Glob Health. 2022;10(3):e380–e389.
- World Health Organization. The Global Initiative for Childhood Cancer (CureAll framework). Geneva: WHO; 2021. https://www.who.int/initiatives/the-global-initiative-for-childhood-cancer.
- Wang L; et al. Incidence, mortality, and global burden of retinoblastoma in 204 countries worldwide from 1990 to 2021. Neoplasia. 2025;60:101107. PMID: 39724751. [CrossRef]
- Abramson DH, Frank CM, Susman M, Whalen MP, Dunkel IJ, Boyd NW 3rd. Presenting signs of retinoblastoma. J Pediatr. 1998;132(3 Pt 1):505–508. PMID: 9544909.
- Kaliki S, Shields CL, Rojanaporn D; et al. High-risk retinoblastoma: Presenting features and clinical outcomes. Cancers (Basel). 2021;13(8):1956. PMID: 33921566.
- GBD 2023 Childhood Cancer Collaborators. Global burden of cancer in children and adolescents aged 0–19 years, 1990–2023. Lancet. 2026;407(10536):1360–1373. [CrossRef]
- Institute for Health Metrics and Evaluation (IHME). GBD Results Tool. Seattle, WA: IHME. https://vizhub.healthdata.org/gbd-results.
- GBD 2023 Causes of Death Collaborators. Lancet. 2025;406(10513):1811–1872. [CrossRef]
- GBD 2023 Demographics Collaborators. Lancet. 2025;406(10513):1731–1810. [CrossRef]
- GBD 2023 Disease and Injury and Risk Factor Collaborators. Lancet. 2025;406(10513):1873–1922. [CrossRef]
- Bray F, Laversanne M, Sung H; et al. Global cancer statistics 2022: GLOBOCAN estimates of incidence and mortality worldwide for 36 cancers in 185 countries. CA Cancer J Clin. 2024;74(3):229–263. [CrossRef]
- Stevens GA; et al.; GATHER Working Group. The GATHER statement. Lancet. 2016;388(10062):e19–e23. [CrossRef]
- National Center for Children’s Cancer Surveillance (NCPCS), Ni X, Li Z (eds). National Childhood Cancer Surveillance Annual Report 2024. Beijing: People’s Medical Publishing House; 2026. ISBN 978-7-117-39219-8. (2018–2019 cohort: Retinoblastoma 5-year survival 90.40%, highest among 12 ICCC-3 groups).
- Li C; et al. Global, regional and national burden due to retinoblastoma in children aged younger than 10 years from 1990 to 2021. BMC Med. 2024;22:604. PMID: 39736662. [CrossRef]
- Global Retinoblastoma Study Group; Fabian ID, Abdallah E, Abdullahi SU; et al. Global retinoblastoma presentation and analysis by national income level. JAMA Oncol. 2020;6(5):685–695. [CrossRef]
Figure 1.
(a–b) Global retinoblastoma burden at ages 0–19 years, 1990–2023: deaths and incident episodes as counts (a, with 95% uncertainty-interval bands) and as crude rates per 100,000 (b, point estimates). (c–d) Age composition of the retinoblastoma burden versus leukaemia (the largest childhood cancer killer), 2023: shares of the 0–19-year total deaths (c) and crude death rates per 100,000 by age band (d).
Figure 1.
(a–b) Global retinoblastoma burden at ages 0–19 years, 1990–2023: deaths and incident episodes as counts (a, with 95% uncertainty-interval bands) and as crude rates per 100,000 (b, point estimates). (c–d) Age composition of the retinoblastoma burden versus leukaemia (the largest childhood cancer killer), 2023: shares of the 0–19-year total deaths (c) and crude death rates per 100,000 by age band (d).
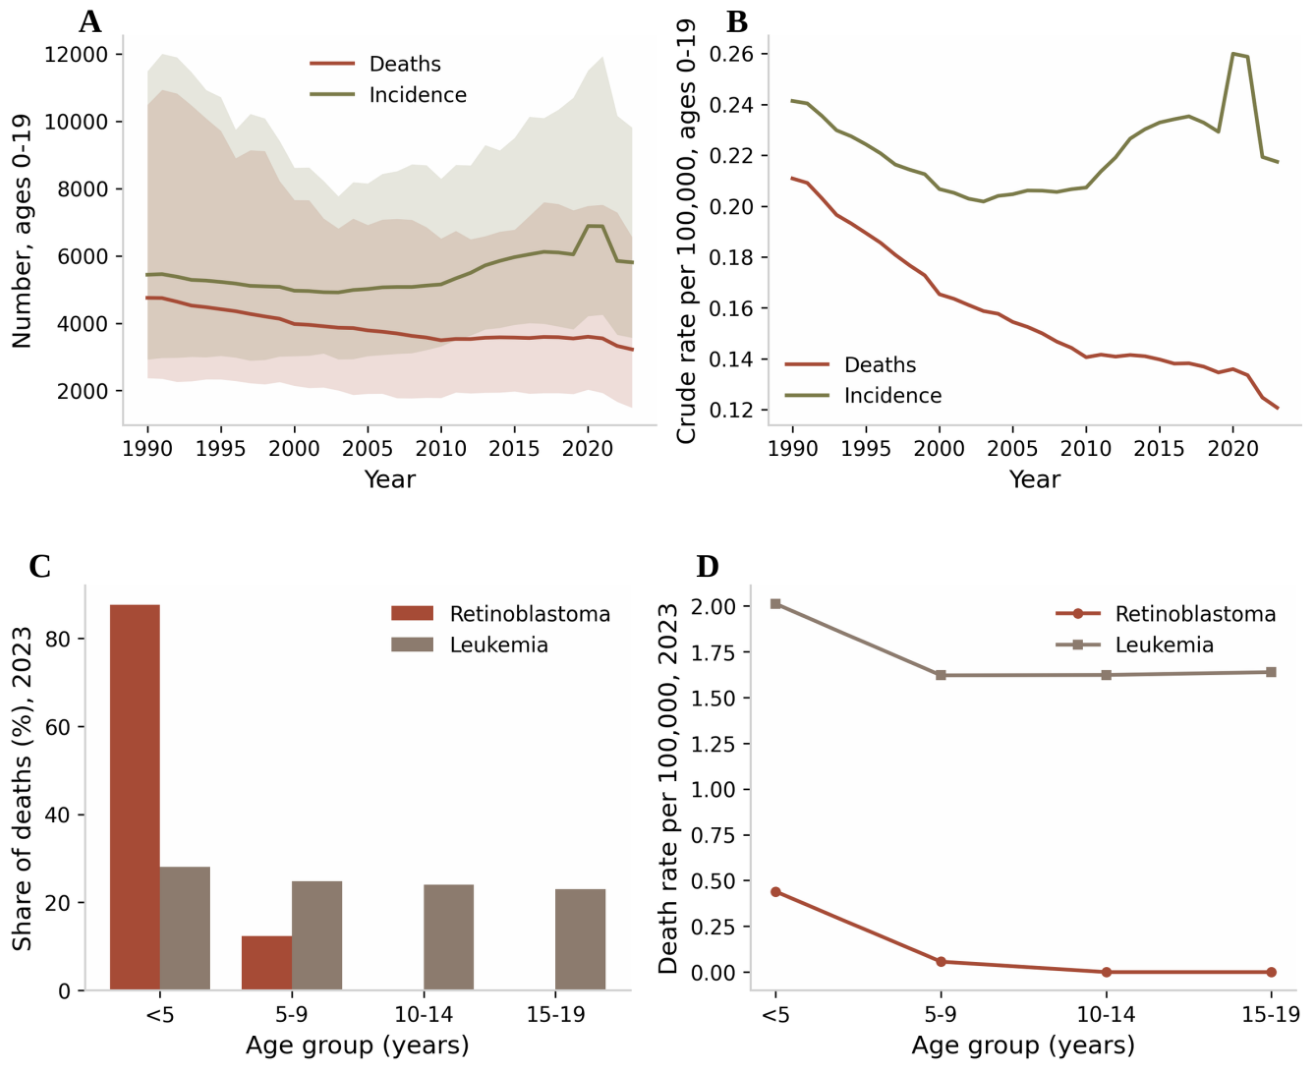
Figure 2.
Mortality-to-incidence ratio (M/I) at ages 0–19 years. (a) Global series, 1990–2023 (band: 95% UI). (b) M/I by SDI quintile, 2023 (error bars: 95% UI). (c) M/I across the 21 GBD regions, 2023 (error bars: 95% UI; dashed line: global M/I).
Figure 2.
Mortality-to-incidence ratio (M/I) at ages 0–19 years. (a) Global series, 1990–2023 (band: 95% UI). (b) M/I by SDI quintile, 2023 (error bars: 95% UI). (c) M/I across the 21 GBD regions, 2023 (error bars: 95% UI; dashed line: global M/I).
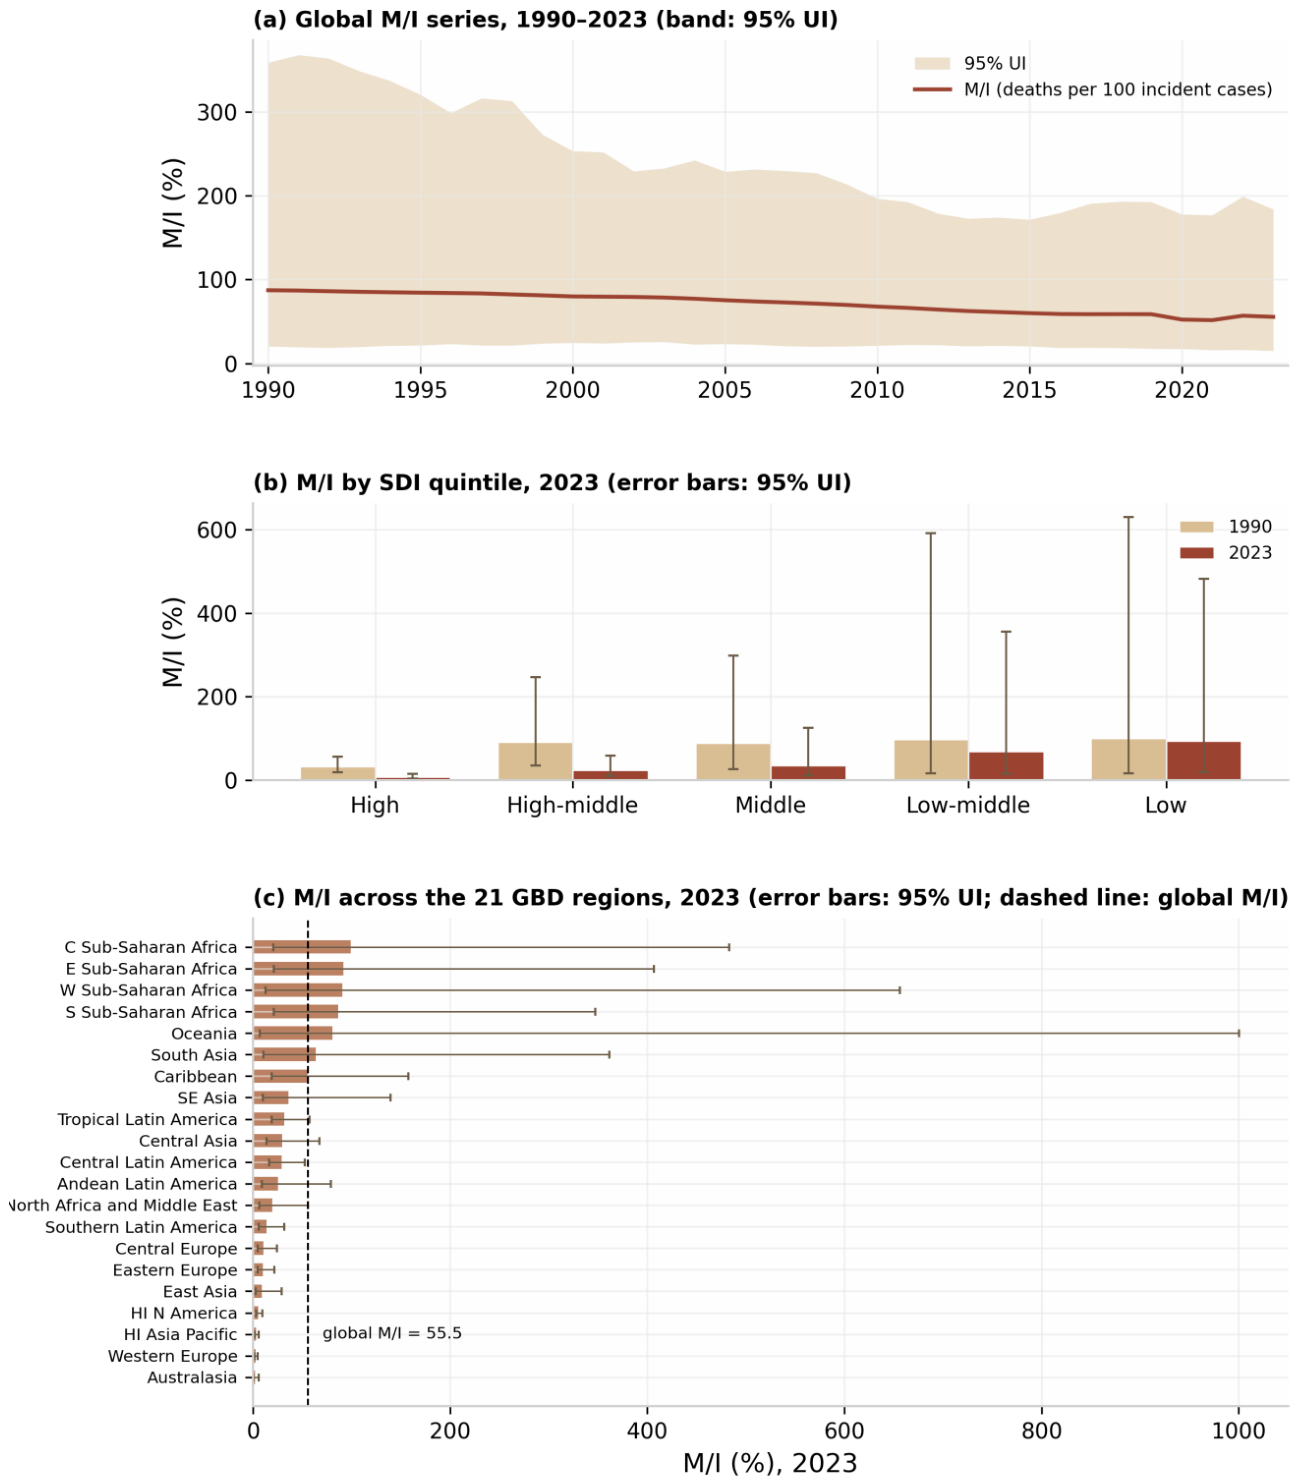
Figure 3.
The COVID-19 pandemic window for retinoblastoma deaths at ages 0–19 years. (a) Global deaths index (2019 = 100), 2018–2023; the beige band marks the suppression window. (b) Change in deaths by SDI quintile for 2019→2021 and 2021→2023. The modelled incidence uptick of 2020–2021 (likely a GBD back-calculation artefact) is shown separately in Supplementary Figure S1. (c) Retinoblastoma mortality rate per 100,000 by country, ages 0–19 years, 2022 (GBD 2023 numerators; GLOBOCAN 2022 population denominators; Robinson projection).
Figure 3.
The COVID-19 pandemic window for retinoblastoma deaths at ages 0–19 years. (a) Global deaths index (2019 = 100), 2018–2023; the beige band marks the suppression window. (b) Change in deaths by SDI quintile for 2019→2021 and 2021→2023. The modelled incidence uptick of 2020–2021 (likely a GBD back-calculation artefact) is shown separately in Supplementary Figure S1. (c) Retinoblastoma mortality rate per 100,000 by country, ages 0–19 years, 2022 (GBD 2023 numerators; GLOBOCAN 2022 population denominators; Robinson projection).
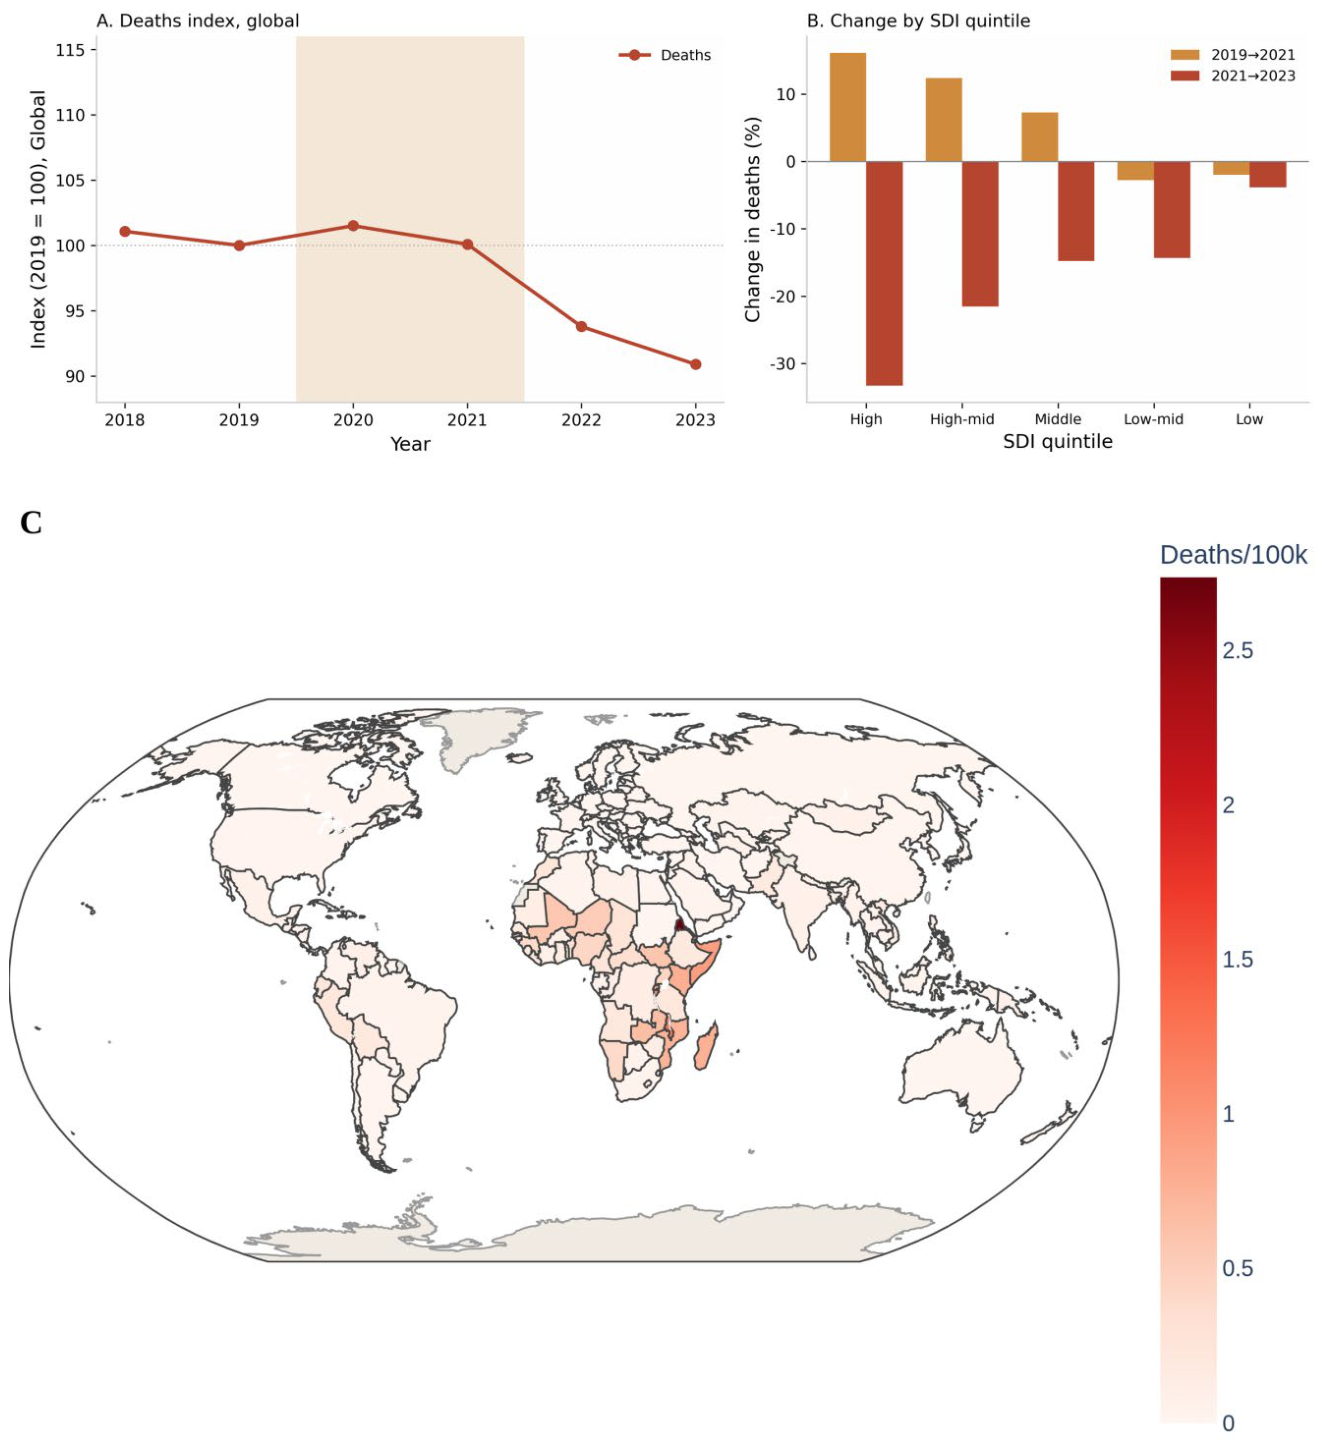

Table 1.
Global retinoblastoma burden at ages 0–19 years, six anchor years, 1990–2023.
| Year | Deaths (95% UI) | Death rate per 100,000 | Incident cases (95% UI) | Incidence rate per 100,000 | M/I (%) |
|---|---|---|---|---|---|
| 1990 | 4,755 (2,372–10,495) | 0.211 | 5,442 (2,926–11,491) | 0.241 | 87.4 |
| 2000 | 3,976 (2,144–7,663) | 0.165 | 4,969 (3,027–8,625) | 0.207 | 80.0 |
| 2010 | 3,497 (1,786–6,520) | 0.141 | 5,156 (3,318–8,297) | 0.207 | 67.8 |
| 2019 | 3,548 (1,903–7,359) | 0.135 | 6,044 (3,822–10,703) | 0.229 | 58.7 |
| 2021 | 3,552 (1,933–7,521) | 0.134 | 6,884 (4,254–11,940) | 0.259 | 51.6 |
| 2023 | 3,226 (1,493–6,569) | 0.121 | 5,808 (3,574–9,819) | 0.217 | 55.5 |
M/I, mortality-to-incidence ratio (deaths ÷ incidence × 100, point estimates); UI, uncertainty interval. Rates are crude, per 100,000 population aged 0–19 years.
Table 2.
Retinoblastoma burden at ages 0–19 years by SDI quintile, 2023.
| SDI quintile | Deaths (95% UI) | Death rate per 100,000 | Incident cases (95% UI) | Incidence rate per 100,000 | M/I (%) |
|---|---|---|---|---|---|
| High | 74 (50–99) | 0.013 | 1,026 (664–1,545) | 0.182 | 7.2 |
| High-middle | 251 (161–382) | 0.054 | 1,073 (650–1,553) | 0.231 | 23.4 |
| Middle | 210 (113–400) | 0.063 | 603 (321–1,088) | 0.180 | 34.9 |
| Low-middle | 596 (251–1,270) | 0.131 | 867 (357–1,740) | 0.190 | 68.7 |
| Low | 2,093 (879–4,494) | 0.247 | 2,237 (930–4,808) | 0.264 | 93.6 |
SDI, Socio-demographic Index; M/I, mortality-to-incidence ratio (point estimates; Monte Carlo uncertainty intervals for SDI-stratified M/I are wide and are given in the text for the low-to-high ratio). Rates are crude, per 100,000 population aged 0–19 years.
Disclaimer/Publisher’s Note: The statements, opinions and data contained in all publications are solely those of the individual author(s) and contributor(s) and not of MDPI and/or the editor(s). MDPI and/or the editor(s) disclaim responsibility for any injury to people or property resulting from any ideas, methods, instructions or products referred to in the content. |
© 2026 by the authors. Licensee MDPI, Basel, Switzerland. This article is an open access article distributed under the terms and conditions of the Creative Commons Attribution (CC BY) license (http://creativecommons.org/licenses/by/4.0/).
Copyright: This open access article is published under a Creative Commons CC BY 4.0 license, which permit the free download, distribution, and reuse, provided that the author and preprint are cited in any reuse.