

Submitted:
27 October 2026
Posted:
28 October 2026
You are already at the latest version
Abstract
Leptin receptor (LepR) signaling contributes to energy homeostasis and inflammatory responses, making LepR antagonism a potential anti-inflammatory strategy. Although H6-derived antibody ligands exhibit LepR agonistic activity, the pharmacological properties of H6 in a full-length immunoglobulin G format (H6-IgG) remain unclear. We evaluated H6-IgG binding, competition with leptin, and signaling activity, examined NanoBiT reporter responses and structural models, and assessed its activity in a 12-O-tetradecanoylphorbol-13-acetate (TPA)-induced acute cutaneous inflammation model in C57BL/6 mice. H6-IgG bound human and mouse LepR and interfered with leptin binding. H6-IgG showed no appreciable agonist activity but inhibited leptin-induced STAT3/STAT5 signaling and NanoBiT reporter responses. Structural modeling suggested distinct membrane-proximal LepR arrangements associated with H6-IgG and leptin. In female mice, H6-IgG (5 mg/kg) significantly reduced TPA-induced ear swelling. These findings identify H6-IgG as a functional LepR antagonist with anti-inflammatory activity in an acute cutaneous inflammation model.
Keywords:
leptin receptor
; H6-IgG
; antibody antagonist
; STAT3/STAT5
; receptor organization
; cutaneous inflammation
1. Introduction
Leptin is a protein hormone secreted primarily by adipose tissue that plays an important role in regulating appetite, energy expenditure, and body weight homeostasis [1,2]. Its biological effects are mediated by the leptin receptor (LepR), a member of the class I cytokine receptor family that shares structural and signaling features with related receptors such as gp130 [3,4].
LepR exists in multiple splice isoforms, among which the long isoform LepRb is primarily responsible for canonical intracellular signaling. Leptin binding to LepRb activates receptor-associated Janus kinase 2 (JAK2), leading to phosphorylation of intracellular receptor tyrosine residues and subsequent activation of downstream pathways, including STAT3, STAT5, and SHP2–ERK signaling [5,6]. Activation of STAT3 and STAT5 regulates downstream gene transcription, while STAT3 also induces the expression of suppressor of cytokine signaling 3 (SOCS3), which participates in negative feedback regulation of LepR signaling [7]. These pathways provide an important molecular basis for the diverse physiological functions of LepR.
Beyond its established metabolic functions, leptin participates in innate and adaptive immune responses by modulating immune cell activation, proliferation, and inflammatory cytokine expression. Leptin promotes pro-inflammatory responses in macrophages and regulates T cell-mediated immune functions [8,9]. In the context of cutaneous inflammation, leptin deficiency attenuates imiquimod (IMQ)-induced psoriasis-like inflammation in mice, whereas leptin stimulation enhances pro-inflammatory responses in human keratinocytes [10]. These findings provide a biological rationale for modulating leptin–LepR signaling to intervene in inflammatory responses.
Antagonistic strategies targeting leptin–LepR signaling have been explored in various experimental systems. Modification of leptin residues involved in receptor activation has yielded antagonistic variants that retain LepR binding but lack agonistic activity [11]. The anti-LepR monoclonal antibody 9F8 also competes with leptin for receptor binding and inhibits leptin-induced signaling and certain immune cell responses in vitro [12]. In animal models, a PEGylated leptin antagonist alleviated chronic colitis in IL-10-deficient mice [13]. However, because LepR also regulates energy homeostasis, broad inhibition of its signaling may have metabolic consequences. Selective interference with LepR–EGFR interactions has emerged as an alternative strategy for modulating specific immune functions while preserving the metabolic responses examined, providing another approach to differential pharmacological regulation of LepR [14].
Previous studies of LepR-targeting antibody ligands have also revealed a relationship between antibody molecular format and receptor function. The partially agonistic single-chain variable fragments (scFvs) Ab06 and Ab11 lost their agonistic activity upon conversion to full-length IgG while retaining their ability to bind LepR. Subsequent affinity maturation yielded H6, which exhibited enhanced LepR agonistic activity and demonstrated metabolic effects in leptin-deficient mice [15]. However, the pharmacological properties of full-length H6-IgG, particularly its potential functional antagonism of LepR and in vivo anti-inflammatory activity, have not been clearly characterized.
In the present study, we generated and characterized full-length H6-IgG and evaluated its LepR antagonistic properties through receptor-binding, binding competition, and cellular signaling assays. NanoBiT assays and structural modeling were employed to explore potential underlying molecular mechanisms. We further assessed the in vivo anti-inflammatory activity of H6-IgG using a TPA-induced model of acute cutaneous inflammation.
2. Materials and Methods
Ethics Statement
All murine in vivo experimental protocols were reviewed and approved by the Institutional Animal Care and Use Committee of ShanghaiTech University (approval No.2025080300). Animals were obtained from Shanghai Jihui Laboratory Animal Care Co., Ltd. (Shanghai, China) and housed in specific-pathogen-free (SPF) facilities with standardized 12-hour light/dark cycles, constant temperature/humidity, and unrestricted access to chow and water with one-week acclimatization prior to all experimental manipulations.
Cell Culture
HEK293T and hLepR SIE HEK293T were maintained in Dulbecco’s Modified Eagle Medium (DMEM, #C11995500BT, Gibco, USA) supplemented with 10% fetal bovine serum (FBS, #SV30208.02, Hyclone, Australia) under standard humidified conditions at 37 °C with 5% CO2. Suspension cells were cultured under the same incubator conditions.
The previously established hLepR/mLepR-Ba/F3 stable cell lines were grown in RPMI 1640 medium (#C22400500BT, Gibco, USA) containing 10% FBS. Expi293F cells (#A14527, Gibco, USA) were cultured in Union 293 medium (#UP1003, union biotech, China) under shake-flask conditions (120 rpm) to maintain suspension growth. All cultures were routinely passaged and monitored as previously described [15].
Plasmid Construct
The hLepR-ECD and mLepR-ECD genes, encoding residues 1–839 and 1–832, respectively, were cloned into the pFUSE expression vector (InvivoGen, USA) with an in-frame C-terminal His tag. H6-IgG expression constructs were generated using the same cloning strategy. The design of the iCAR-based NanoBiT reporter plasmids, iCAR-hLepR-ECD-SmBiT and iCAR-hLepR-ECD-LgBiT, was adapted from the NanoBiT® PPI MCS Starter System (#N2014, Promega, USA), which uses complementary Large BiT (LgBiT) and Small BiT (SmBiT) fragments to generate luminescence upon complementation. PCR amplification (#10154ES01, Yeasen, China) and homologous recombination (#RM20523, Abclonal, China) were performed using commercially available reagents. All constructs were verified by Sanger sequencing (GenScript, China).
Protein Expression and Purification
hLepR-ECD, mLepR-ECD and H6-IgG were expressed in suspension Expi293F cells by transient PEI transfection (#40816ES03, Yeasen, China). After 72 h of cultivation, culture supernatants were harvested. hLepR-ECD and mLepR-ECD were purified by using a HisTrap excel column (#17371206, Cytiva, USA) pre-equilibrated with binding buffer (500 mM NaCl, 20 mM sodium phosphate, 5 mM imidazole, pH 7.4). further subjected to size-exclusion chromatography (SEC, Superdex 75 Increase, Cytiva, USA) to remove imidazole, the peak fractions corresponding to the target protein were pooled. H6-IgG1 was purified using Protein A affinity chromatography (#L00210-50, GenScript, China). Protein A purification used binding buffer (150 mM NaCl, 20 mM sodium phosphate, pH 7.4) and elution buffer (0.1 M citric acid, pH 3.4). All purified proteins were buffer-exchanged into PBS (150 mM NaCl, 20 mM sodium phosphate, pH 7.4), concentrated with 30-kDa MWCO ultrafiltration membranes (Merck Millipore, USA), and quantified by BCA assay (#23225, Thermo Scientific, USA).
ELISA and Competitive Binding ELISA
Direct binding ELISA and competitive binding ELISA were performed to characterize the binding of H6 IgG to recombinant human and mouse LepR ECD. For direct binding ELISA, 96-well microplates were coated overnight with 5 μg/mL purified recombinant LepR ECD diluted in PBS at 4 °C. Wells were blocked with 5% non-fat milk in PBST (#60146ES76, Yeasen, China) for 1 h at room temperature. H6-IgG was serially diluted threefold from an initial concentration of 100 nM, added to the wells, and incubated at room temperature for 1 h.
For competitive binding ELISA, H6-IgG (10 nM for mLepR-ECD; 1 or 0.25 nM for hLepR-ECD) was premixed with threefold serial dilutions of recombinant human leptin starting at 300 nM (#92542ES80, Yeasen, China).
After washing, HRP conjugated anti mouse IgG secondary antibody (#7076, Cell Signaling Technology, UK) was applied. ABTS substrate (#37615, Thermo Fisher Scientific, USA) was added, and absorbance was measured at 410 nm. All ELISA measurements were performed in triplicate. Data are presented as mean ± SD, and curves were fitted using a four-parameter logistic (4PL) nonlinear regression model.
Octet-Based Epitope Competition Assay
Sequential binding competition assays were performed using an Octet biolayer interferometry (BLI) system following a protocol adapted from the manufacturer’s epitope binning guidelines (Sartorius, Germany). Biotinylated hLepR-ECD or mLepR-ECD (50 μg/mL) was immobilized on streptavidin (SA) biosensors. The assay consisted of an initial baseline (30 s), antigen loading (180 s), a second baseline (30 s), first association (300 s), and second association (200 s). During the first association, biosensors were exposed to 100 nM leptin or PBST. During the second association, biosensors were transferred to 100 nM leptin alone, 100 nM H6-IgG or mibavademab alone, or mixtures containing 100 nM leptin and 100 nM H6-IgG or mibavademab. Biosensors without immobilized LepR-ECD were included as reference controls to assess nonspecific binding. All proteins were diluted in PBST. For data processing, the mean BLI response over the 2 s immediately preceding the first association step was used as the baseline and subtracted from all response values across both association steps.
Surface Plasmon Resonance (SPR) Analysis
The binding kinetics of H6-IgG to hLepR-ECD and mLepR-ECD were measured using a Biacore 8K system. Both receptor ectodomains were immobilized on CM sensor chips by amine coupling to approximately 400 response units (RU), with pH 4.5 selected by pH scouting. H6-IgG was injected at two-fold serial dilutions of 10–0.31 nM for hLepR-ECD (10, 5, 2.5, 1.25, 0.63, and 0.31 nM) and 50–0.78 nM for mLepR-ECD. Association and dissociation phases were monitored for 180 and 600 s, respectively, followed by sensor regeneration with glycine (pH 1.5). Sensorgrams were fitted using a 1:1 binding model in Biacore 8K Evaluation Software to determine the association rate constant (kₐ), dissociation rate constant (kᵈ), and equilibrium dissociation constant (Kᴅ).
Competitive STAT3 Phosphorylation SIE Luciferase Reporter Assay
A stable HEK293 reporter cell line co expressing human LepR and SIE driven firefly luciferase was generated via lentiviral integration. Reporter cells were adjusted to 4 × 10⁵ cells/mL and seeded (50 μL per well) into white opaque 96 well tissue culture plates (PerkinElmer). Serially diluted antagonistic antibody was added to cells for 30 min pre incubation at 37 °C. A fixed concentration of recombinant leptin was then applied to induce LepR driven STAT3 luciferase signaling. Plates were incubated for 6–8 h at 37 °C, 5% CO2. For luminescence detection, 25 μL of furimazine (#PBI 3939, Selleck, USA) was added to each sample to achieve a final concentration of 20 μM. Luminescence was recorded on an Enspire multimode plate reader (PerkinElmer, USA). Relative luminescence unit (RLU) values were used to calculate dose response inhibition curves and IC50 values. Data are presented as the mean ± SD of three technical replicates (n = 3).
NanoLuc LepR Extracellular-Domain Proximity Assay
HEK293T cells were transfected with hLepR ECD fused to complementary NanoLuc fragments adapted from the NanoBiT Protein: Protein Interaction (PPI) MCS Starter System (#N2014, Promega, USA). Cells were seeded in opaque 96-well plates. Serially diluted H6-IgG and isotype were pre-incubated with cells for 30 min before stimulation with 10 nM leptin. At 4 h post-stimulation, furimazine (#PBI 3939, Selleck, USA) was added at a final concentration of 20 μM, and after incubation at room temperature for 10 min, luminescence was measured on an Enspire multimode plate reader. hLepR-ECD proximity was calculated relative to leptin-only controls. All measurements were performed in triplicate. Data are presented as mean ± SD, and curves were fitted using a 4PL nonlinear regression model.
Phospho- STAT3 and STAT5 Intracellular Flow Cytometry
Before the assay, hLepR-Ba/F3 cells were washed three times with PBS to remove residual leptin and serum-starved overnight in serum-free RPMI 1640 medium. Cells were then adjusted to 2 × 10⁶ cells/mL and seeded into 96-well plates (50 μL/well). Cells were preincubated with threefold serial dilutions of H6-IgG or isotype control (#HY-P80757, MedChemExpress, USA) starting at 200 nM for 30 min at 37 °C, followed by stimulation with 10 nM leptin for an additional 30 min. Cells were subsequently fixed with Fixation Buffer (#420801, BioLegend, USA) for 15 min at room temperature and permeabilized with True-Phos Perm Buffer (#425401, BioLegend, USA) for 2 h at −20 °C. Cells were stained with PE-conjugated anti-pSTAT3 (#12-9033-42, Thermo Fisher Scientific, USA) and CL647-conjugated anti-pSTAT5 (#CL647-80138-2, Proteintech, China) antibodies for 1 h at room temperature in the dark. STAT3 and STAT5 phosphorylation was quantified by flow cytometry (CytoFLEX S, Beckman Coulter, USA) using median fluorescence intensity (MFI). All measurements were performed in triplicate. Data are presented as mean ± SD, and curves were fitted using a 4PL nonlinear regression model.
Structural Modeling and Analysis of Membrane-Proximal LepR Separation
The AlphaFold 3-predicted VH and VL domains of the H6 Fab were superimposed onto the corresponding variable domains in the H6–hLepR-CRH2 reference structure (PDB ID: 7CTU). The CRH2 region of chain B from PDB 8AVE was then superimposed onto the reference receptor, and the resulting transformation was applied to the entire modeled hLepR fragment (residues 236–831). Superposition was performed by least-squares fitting of paired Cα atoms, with atom pairs deviating by more than 2.5 Å iteratively excluded.
The two Fab–receptor modules were assembled onto a mouse IgG1 template (PDB ID: 1IGY) by superimposing their CH1 regions. Rotations about the N–Cα and Cα–C axes of the first hinge residue were sampled in 45° increments. The Cα790-to-Cα831 vector of each receptor was used to define its terminal direction. Candidate conformations were retained if the angle between the two terminal vectors was ≤45° and the difference in the receptor termini’s projected positions along the mean direction was ≤15 Å. Specified heavy-atom contacts between the two receptors, each receptor and the opposing Fab, the two Fab arms, and each Fab arm and the Fc region were also examined. Candidates with any inspected atom pair separated by less than 2 Å were excluded. Among the candidates passing these filters, the conformation with the shortest distance between the receptor termini was selected for visualization.
The mouse model was constructed under the assumption that H6 adopts a similar binding pose on human and mouse LepR. Homologous CRH2 residues were identified by sequence alignment, and the CRH2 region of chain B from PDB 8AVB was superimposed onto the reference receptor. The resulting transformation was applied to the entire modeled mLepR fragment (residues 235–827), which was then placed separately into the coordinate frames of the two Fab arms. The antibody conformation was kept unchanged, and no additional hinge-conformation sampling was performed. All models were constructed as template-assisted rigid-body schematic assemblies.
For the leptin–LepR comparison, the human 2:2 assembly from PDB 8AVE and the mouse 1:2 assembly from PDB 8AVB were used, preserving the original relative positions of the chains. The experimentally determined receptor construct in PDB 8AVE contains a C-terminal GCN4 fusion segment. The three-dimensional Euclidean distance between the Cα atoms of Asp831 in the two human receptor chains or Thr827 in the two mouse receptor chains was measured to characterize the C-terminal separation of the modeled receptor fragments. Residues were numbered according to the native sequences, and missing segments were not modeled. Structures were visualized and images were exported using UCSF ChimeraX.
Molecular Dynamics Simulations and Binding Free Energy Calculations
Based on the previously constructed H6–LepR complex models, the variable heavy (VH) and variable light (VL) domains of H6 were connected by a flexible (GGGGS)3 linker to generate single-chain variable fragment (scFv) constructs. The resulting H6-scFv was complexed with the modeled extracellular regions of hLepR (residues 236–831) or mLepR (residues 235–827), rather than the full-length receptors, for subsequent molecular dynamics (MD) simulations.
All-atom MD simulations were performed using GROMACS with the AMBER99SB-ILDN force field and the TIP3P water model. Each complex was placed in a cubic periodic simulation box with a minimum distance of 1.8 nm between the protein and the box boundaries. The systems were neutralized with Na+ and Cl− ions, and the NaCl concentration was adjusted to 0.15 M. Energy minimization was performed sequentially using the steepest descent and conjugate gradient algorithms, followed by 1 ns of NVT and 1 ns of NPT equilibration under positional restraints on the proteins. Temperature and pressure were maintained at 310 K and 1 bar using the V-rescale thermostat and Berendsen barostat, respectively, during equilibration. Bonds involving hydrogen atoms were constrained using the LINCS algorithm, and long-range electrostatic interactions were treated using the particle mesh Ewald (PME) method. Subsequently, 100 ns production MD simulations were performed without positional restraints, using a time step of 2 fs.
After periodic boundary correction and structural alignment, backbone root-mean-square deviation (RMSD), intermolecular hydrogen bonds, and solvent-accessible surface area (SASA) were analyzed to assess the conformational stability and dynamic behavior of the complexes.
The binding free energies between H6-scFv and LepR were estimated using the molecular mechanics/generalized Born surface area (MM/GBSA) method implemented in gmx_MMPBSA. Calculations were performed using the single-trajectory approach with snapshots extracted from the final 20 ns of each production trajectory. The generalized Born OBC2 implicit solvent model (igb = 5) was applied with a salt concentration of 0.15 M.
In Vivo Pharmacodynamic Evaluation of LepR Antagonists
To evaluate the in vivo pharmacodynamic effects of H6-IgG, male C57BL/6 mice (7–8 weeks old) were randomly assigned to three groups and subcutaneously administered H6-IgG (5 or 10 mg/kg; n = 3 per group) or PBS (vehicle; n = 4) every other day for 2 weeks. Food intake and body weight were monitored daily throughout the study.
TPA-Induced Acute Ear Inflammation Model
The study design was adapted from Shuyue Wang et al. [16], with minor modifications as detailed below. Ear edema was induced in female C57BL/6 mice by topical application of 2.4 μg TPA (dissolved in pure DMSO, Yeasen, #50601ES10) to the right ear. 8-week-old female C57BL/6 mice were randomly assigned to four groups (n = 3 mice per group): blank control (s.c., PBS and topical application of DMSO), TPA + vehicle (s.c., PBS), TPA + DEX (i.p., 10 mg/kg, positive control, MCE, #HY-B29A), and TPA + H6-IgG (s.c., 5 mg/kg). H6-IgG or controls were administered 12 h before TPA challenge. DEX was administered again 1 h before TPA challenge. Ear thickness was measured 6 h after TPA application using a digital caliper. After the above measurement, animals were euthanized, and peripheral blood was collected to profile and quantify circulating immune cell populations. Bilateral ear tissues were then sampled using a 6 mm biopsy punch at a standardized anatomical site; specimens were weighed and subsequently processed for inflammation-related analyses, including histopathological evaluation. Mouse ear tissues were fixed in 4% paraformaldehyde (PFA) for 24 hours at 4 °C, followed by paraffin embedding. Tissue sections (5 μm thickness) were cut and stained with Hematoxylin and Eosin (H&E) using standard protocols. Epidermal thickness, inflammatory cell infiltration, and tissue architecture were assessed in a blinded manner.
Statistical Analysis
For comparisons of multiple treatment groups with a designated control, ordinary one-way ANOVA followed by Dunnett’s multiple-comparisons test was used when variances were equal; Welch’s ANOVA followed by Dunnett’s T3 multiple-comparisons test was used when variances were unequal. Cumulative food intake was analyzed by two-way repeated-measures ANOVA with Geisser–Greenhouse correction, followed by Dunnett’s multiple-comparisons test against the vehicle group at each time point.A P value < 0.05 was considered statistically significant. All in vitro assays were performed in technical triplicate, and in vivo experiments included at least three mice per group. Data are presented as mean ± SD. Concentration–response curves were fitted using four-parameter logistic (4PL) nonlinear regression to determine EC50 or IC50 values. Statistical analyses, curve fitting, and data visualization were performed using GraphPad Prism 11.
3. Results
3.1. H6-IgG Binds Human and Mouse LepR with Distinct Binding Kinetics
The text continues here. Purified H6-IgG was first subjected to physicochemical characterization. SDS-PAGE showed a predominant band corresponding to intact antibody under nonreducing conditions, whereas bands consistent with the heavy and light chains were observed under reducing conditions (Figure 1a). Size-exclusion chromatography (SEC) revealed a single major elution peak, and nano differential scanning fluorimetry (nanoDSF) showed a distinct major thermal transition (Figure 1b,c), consistent with the expected molecular composition and a relatively homogeneous solution state.
The binding of H6-IgG to human and mouse LepR was then evaluated by ELISA. H6-IgG bound both hLepR-ECD and mLepR-ECD in a concentration-dependent manner, with EC50 values of 0.11 and 0.22 nM, respectively (Figure 1d,e). Surface plasmon resonance (SPR) analysis further revealed distinct binding kinetics toward the two receptors. Fitting to a 1:1 kinetic model yielded Kᴅ values of 2.53 nM for hLepR-ECD and 25.3 nM for mLepR-ECD, representing an approximately 10-fold difference (Figure 1f,g; Table 1). Although the association rates were similar, H6-IgG dissociated markedly more slowly from hLepR-ECD than from mLepR-ECD, indicating that the difference in binding affinity was primarily associated with dissociation kinetics.
3.2. H6-IgG Exhibits Competitive Binding with Leptin on Human and Mouse LepR
The text continues here. Competitive ELISA was performed to examine whether H6-IgG and leptin competed for binding to human and mouse LepR. For hLepR-ECD, increasing leptin concentrations progressively reduced H6-IgG binding. At H6-IgG concentrations of 1 and 0.25 nM, leptin exhibited IC50 values of 3.9 ± 1.5 nM and 1.5 ± 0.69 nM, respectively, although residual H6-IgG binding remained detectable at the highest leptin concentration tested (Figure 2a). A similar concentration-dependent reduction was observed for mLepR-ECD, with an IC50 of 3.0 ± 0.36 nM. In this assay, the binding signal decreased to near-baseline levels at higher leptin concentrations (Figure 2b).
To further assess the competitive binding characteristics of H6-IgG, Octet-based in-tandem epitope binning was performed to examine its binding following leptin prebinding. After hLepR-ECD or mLepR-ECD was prebound with 100 nM leptin, the addition of 100 nM H6-IgG in the continued presence of 100 nM leptin produced additional binding responses for both receptors. However, these responses were markedly lower than those observed for H6-IgG without leptin pretreatment (Figure 2c,d). Mibavademab (REGN4461), a previously reported LepR agonist antibody that does not compete with leptin for binding, was included as a reference [17]. In the human receptor assay, a clear additional binding response to mibavademab remained detectable following leptin prebinding. By contrast, continued exposure to leptin alone did not produce an additional response of comparable magnitude. No appreciable background binding was observed with sensors lacking immobilized LepR-ECD (Figure S1). The reduced but residual H6-IgG binding responses were consistent with competition between H6-IgG and leptin without complete mutual exclusivity under all assay conditions.
3.3. H6-IgG Functions as a LepR Antagonist
The effects of H6-IgG on LepR downstream signaling were first examined in the absence of leptin. In hLepR-SIE-HEK293T reporter cells, leptin induced STAT3-responsive luciferase activity in a concentration-dependent manner, whereas H6-IgG elicited no appreciable reporter response over the concentration range tested (Figure 3a). STAT3 and STAT5 activation was further assessed by intracellular phospho-flow cytometry in hLepR-Ba/F3 cells. In contrast to the pronounced phosphorylation responses induced by leptin, H6-IgG alone did not elicit appreciable pSTAT3 (Tyr705) or pSTAT5 (Tyr694) responses (Figure 3b,c).
The ability of H6-IgG to functionally antagonize leptin-induced signaling was then evaluated in both cellular systems. In hLepR-SIE-HEK293T cells, H6-IgG concentration-dependently inhibited luciferase activity induced by 0.5 nM leptin, with an IC50 of 10 ± 0.30 nM and marked inhibition at higher H6-IgG concentrations (Figure 3d; Table 2). In hLepR-Ba/F3 cells, H6-IgG similarly inhibited STAT3 (Tyr705) and STAT5 (Tyr694) phosphorylation induced by 10 nM leptin, with IC50 values of 3.2 ± 0.36 nM and 2.8 ± 0.34 nM, respectively. No corresponding concentration-dependent inhibition was observed with the isotype control antibody (Figure 3e,f; Table 2).
3.4. H6-IgG inhibits Leptin-Induced NanoBiT Signaling
The text continues here. To further investigate the potential mechanism underlying H6-IgG antagonism, a NanoBiT complementation reporter system was used to monitor luminescence signals associated with the membrane-proximal regions of LepR. Leptin increased NanoBiT luminescence in a concentration-dependent manner, with an EC50 of 7.3 ± 0.89 nM, whereas H6-IgG alone elicited only a weak response, reaching approximately 14.0% of the maximal leptin response (Figure 4a). In the presence of 10 nM leptin, H6-IgG concentration-dependently reduced NanoBiT luminescence to approximately 50% of the isotype control response at concentrations near the upper end of the tested range. In contrast, the isotype control antibody showed no appreciable inhibitory effect (Figure 4b).
To explore the receptor spatial arrangements potentially associated with these observations, a structural model of H6-IgG bound to two hLepR extracellular domains was constructed using the previously reported H6–hLepR-CRH2 binding structure and structural templates of LepR and IgG1. In the H6-IgG–hLepR model, the Cα–Cα distance between the membrane-proximal reference residues Asp831 of the two receptors was approximately 84.0 Å (Figure 4c,d), substantially greater than the corresponding distance of 9.7 Å in the experimentally determined cryo-electron microscopy structure of the leptin–hLepR complex (Figure 4e). A similar difference was observed for mouse LepR, with Thr827 Cα–Cα distances of 91.9 Å in the H6-IgG–mLepR model and 17.2 Å in the leptin–mLepR cryo-electron microscopy structure (Figure S2). These modeled differences suggested that H6-IgG-bound LepR may adopt a spatial arrangement distinct from that of the native leptin-bound complex, providing a possible structural explanation for its functional antagonism. Molecular dynamics simulations of H6-scFv complexed with individual hLepR or mLepR molecules additionally provided information on dynamic interactions at the binding interfaces (Figure S3).
3.5. H6-IgG Attenuates TPA-Induced Acute Ear Swelling in Mice
The text continues here. The in vivo pharmacological effects of H6-IgG were evaluated in a TPA-induced mouse model of acute ear inflammation. Mice received a subcutaneous injection of H6-IgG (5 mg/kg) before TPA challenge, with dexamethasone (DEX) included as a positive control. Ear inflammation-related parameters were assessed 6 h after TPA stimulation (Figure 5a). H6-IgG treatment significantly reduced the TPA-induced increase in ear thickness compared with the TPA+PBS group (p = 0.002; Figure 5b). The comparable effects of H6-IgG were reproduced in an independent experiment employing indomethacin (INN) topical film as a comparator (Figure S4). Ear weight gain was also lower following H6-IgG treatment, although the difference did not reach statistical significance (p = 0.2; Figure 5c).
Histopathological changes in ear tissue were further examined by hematoxylin and eosin (H&E) staining. Compared with the group without TPA stimulation, the TPA+PBS group exhibited pronounced tissue thickening and inflammatory cell infiltration. H6-IgG treatment was associated with less pronounced inflammation-related morphological changes and a downward trend in quantified inflammatory cell infiltration, although the latter did not reach statistical significance (p = 0.053; Figure 5d,e). DEX treatment markedly attenuated TPA-induced inflammatory changes in the ear. The significant reduction in ear swelling, accompanied by directionally consistent but nonsignificant changes in ear weight and inflammatory cell infiltration, suggested potential in vivo anti-inflammatory activity of H6-IgG.
In a separate repeated-dose experiment, the effects of H6-IgG on food intake and body weight were evaluated. Mice received subcutaneous injections of H6-IgG (5 or 10 mg/kg) every other day. Over the two-week observation period, neither dose group showed statistically significant differences in cumulative food intake or body-weight changes compared with the vehicle group (Figure S5).
4. Discussion
Previous studies have shown that the agonistic activity of LepR-targeting antibodies is influenced by their molecular format. Tao et al. reported that Ab06 and Ab11, two single-chain variable fragments (scFvs) with partial LepR agonistic activity, lost their agonistic activity upon conversion to full-length IgG while retaining their ability to bind cell-surface LepR [15]. Through affinity maturation, they subsequently generated H6 with enhanced agonistic activity and proposed that the geometric arrangement of antibody-binding domains might influence receptor activation. Building on these findings, we generated H6 in a full-length IgG format and characterized its functional properties. H6-IgG retained binding to both hLepR and mLepR, exhibited minimal agonistic activity, and inhibited leptin-induced STAT3/STAT5 signaling, demonstrating functional antagonism. These findings extend previous observations of format-dependent loss of agonistic activity to the pharmacological characterization of H6-IgG as a LepR antagonist.
The antagonistic activity of H6-IgG may involve competition with leptin for LepR binding. Previous work localized the H6-binding region to the CRH2 domain of LepR, which also contains the principal leptin-binding site [15]. In the present study, competitive ELISA and Octet assays showed that leptin reduced H6-IgG binding to LepR, although residual binding remained detectable under certain experimental conditions. This variability may reflect differences in ligand-binding order, receptor immobilization, and binding kinetics, while partially overlapping binding regions or incomplete steric hindrance cannot be excluded [18]. Competition for receptor binding may therefore contribute to H6-IgG-mediated antagonism, although binding assays alone are insufficient to establish its complete mechanism of action.
As a class I cytokine receptor, LepR shares structural and signaling features with related receptors such as gp130, whose effective activation depends on the appropriate spatial organization of receptor complexes. Moraga et al. used distinct diabodies to alter the spatial arrangement of erythropoietin receptor (EPOR) dimers and found that ligands capable of inducing receptor dimerization could nevertheless produce markedly different signaling outputs, indicating that dimerization alone is insufficient for productive activation [19]. Structural studies of gp130 family receptors further revealed characteristic spatial arrangements of active cytokine–receptor complexes, including close positioning of their membrane-proximal domains [20]. Similarly, the leptin–LepR complex resolved by Saxton et al. exhibits an asymmetric receptor assembly, with membrane-proximal domains bending inward in a manner that may facilitate the proximity of the transmembrane regions [21]. These observations raise the possibility that the minimal agonistic activity of H6-IgG reflects not only its receptor-binding properties but also a receptor arrangement that is unfavorable for productive downstream signaling.
In our NanoBiT assays, H6-IgG alone elicited only a weak membrane-proximal reporter response and inhibited leptin-induced NanoBiT signaling. Structural modeling further suggested that H6-IgG and leptin may promote distinct spatial arrangements of LepR, with greater predicted separation between the membrane-proximal receptor regions in the H6-IgG-associated model. These observations are consistent with the possibility that H6-IgG induces a nonproductive receptor arrangement. However, NanoBiT signals do not directly establish the dimerization state of LepR, and distances predicted from structural models do not necessarily represent the actual receptor conformation at the cell membrane. Differences in receptor spatial organization therefore remain a potential explanation for H6-IgG-mediated antagonism rather than an established causal mechanism.
Beyond its antagonistic activity in cellular assays, H6-IgG showed evidence of anti-inflammatory activity in a TPA-induced acute cutaneous inflammation model. Previous studies have shown that leptin regulates immune cell function and inflammatory responses in addition to its role in energy metabolism. Singh et al. reported that a PEGylated leptin antagonist alleviated chronic colitis in IL-10-deficient mice and reduced inflammatory cytokine expression, suggesting that inhibition of leptin signaling may have anti-inflammatory potential under certain inflammatory conditions [13]. In the present study, H6-IgG significantly attenuated TPA-induced ear swelling in mice, while ear weight and inflammatory cell infiltration showed numerical reductions that did not reach statistical significance. Previous work has shown that TPA-induced ear edema and inflammatory cell accumulation follow distinct temporal kinetics, with the edematous response generally peaking earlier [22]. The anti-inflammatory effects observed at 6 h after TPA challenge may therefore primarily reflect modulation of the early acute inflammatory response, providing preliminary in vivo evidence of the anti-inflammatory activity of H6-IgG.
Because LepR contributes to both immune regulation and energy homeostasis, the potential metabolic consequences of its antagonism also warrant consideration. Zabeau et al. reported that certain LepR-antagonizing antibodies increased food intake and body weight, whereas a single-domain antibody that selectively disrupted the LepR–EGFR interaction modulated specific immune functions without significantly affecting the metabolic parameters examined [14]. In our repeated-dosing study, neither cumulative food intake nor body-weight changes differed significantly from the vehicle group following H6-IgG administration at 5 or 10 mg/kg, providing additional information for its preliminary in vivo pharmacological evaluation.
Several limitations remain. Although the NanoBiT assays and structural modeling suggest that receptor spatial organization may contribute to H6-IgG-mediated antagonism, the receptor assembly state induced by H6-IgG and its causal relationship with functional inhibition have not been directly established. In addition, the relatively small sample sizes in the animal experiments, particularly the food intake and body weight assessments involving only three mice per H6-IgG treatment group, limit the statistical power to detect potential metabolic effects. An influence of H6-IgG on energy homeostasis therefore cannot be excluded. Whether its anti-inflammatory activity in the acute cutaneous inflammation model directly depends on LepR signaling antagonism also remains to be determined. Further animal pharmacological evaluation and studies of target dependence will be needed to clarify the mechanism of action and potential anti-inflammatory applications of H6-IgG.
5. Conclusions
In conclusion, H6-IgG was characterized as a functional LepR antagonist that binds both human and mouse LepR and inhibits leptin-induced STAT3/STAT5 signaling. NanoBiT assays and structural modeling suggest that differences in receptor spatial organization may contribute to its distinct functional properties, although the underlying mechanism remains to be established. Furthermore, H6-IgG attenuated TPA-induced ear swelling in mice, providing initial evidence of anti-inflammatory activity in an acute cutaneous inflammation model. These findings establish the antagonistic properties of H6-IgG and support further investigation of its potential applications in LepR-targeted inflammatory modulation.
6. Patents
Guang Yang and Pingdong Tao are named inventors of Hong Kong Patent No. HK40073325B, which discloses the complementarity-determining region (CDR) sequences of H6-IgG described in this manuscript.
Supplementary Materials
The following supporting information can be downloaded at the website of this paper posted on Preprints.org. Figure S1. Receptor-free biosensor controls for Octet binding assays; Figure S2. Structural comparison of H6-IgG– and leptin-bound mLepR complexes; Figure S3. Molecular dynamics simulations and binding energy analysis of H6-scFv complexes with human and mouse LepR; Figure S4. Effects of repeated H6-IgG administration on food intake and body weight in mice; Figure S5. Anti-inflammatory efficacy of H6-IgG in TPA-induced ear edema (indomethacin control).
Author Contributions
Conceptualization, L.Y. and G.Y.; Methodology, L.Y., G.Y., and P.T.; Investigation, X.C., P.T., L.D., F.W., Y.S., J.S., and R.D.; Formal Analysis, X.C., P.T., and L.Y.; Data Curation, X.C. and L.Y.; Visualization, X.C. and R.D.; Resources, L.L.; Writing—Original Draft Preparation, X.C.; Writing—Review & Editing, L.Y., G.Y., and all other co-authors. All authors have read and agreed to the published version of the manuscript.
Funding
This research received no external funding.
Institutional Review Board Statement
The animal study protocol was approved by Institutional Animal Care and Use Committee of ShanghaiTech University (approval No.2025080300).
Informed Consent Statement
Not applicable.
Data Availability Statement
The raw data supporting the conclusions of this article will be made available by the authors on request.
Acknowledgments
During the preparation of this manuscript, the authors used ChatGPT (OpenAI; [SOL/6.0]) to assist with scientific writing and language refinement. The authors have reviewed and edited the output and take full responsibility for the content of this publication.
Conflicts of Interest
Guang Yang and Pingdong Tao are inventors of Hong Kong Patent No. HK40073325B. The remaining authors declare no competing financial or non-financial interests.
Abbreviations
The following abbreviations are used in this manuscript:
| 4PL | Four-parameter logistic |
| ABTS | 2,2′-Azino-bis(3-ethylbenzothiazoline-6-sulfonic acid) |
| CRH2 | Cytokine receptor homology region 2 |
| ECD | Extracellular domain |
| ELISA | Enzyme-linked immunosorbent assay |
| EPOR | Erythropoietin receptor |
| ERK | Extracellular signal-regulated kinase |
| Fab | Fragment antigen-binding |
| gp130 | Glycoprotein 130 |
| IgG | Immunoglobulin G |
| IMQ | Imiquimod |
| JAK2 | Janus kinase 2 |
| LepR | Leptin receptor |
| MD | Molecular dynamics |
| MM/GBSA | Molecular mechanics/generalized Born surface area |
| NanoBiT | NanoLuc Binary Technology |
| PCR | Polymerase chain reaction |
| scFv | Single-chain variable fragment |
| SDS-PAGE | Sodium dodecyl sulfate–polyacrylamide gel electrophoresis |
| SEC | Size-exclusion chromatography |
| SIE | Sis-inducible element |
| SOCS3 | Suppressor of cytokine signaling 3 |
| SPR | Surface plasmon resonance |
| STAT3 | Signal transducer and activator of transcription 3 |
| STAT5 | Signal transducer and activator of transcription 5 |
| TPA | 12-O-Tetradecanoylphorbol-13-acetate |
References
- Zhang, Y.; Proenca, R.; Maffei, M.; Barone, M.; Leopold, L.; Friedman, J.M. Positional cloning of the mouse obese gene and its human homologue. Nature 1994, 372, 425–432. [Google Scholar] [CrossRef] [PubMed]
- Halaas, J.L.; Gajiwala, K.S.; Maffei, M.; Cohen, S.L.; Chait, B.T.; Rabinowitz, D.; Lallone, R.L.; Burley, S.K.; Friedman, J.M. Weight-reducing effects of the plasma protein encoded by the obese gene. Science 1995, 269, 543–546. [Google Scholar] [CrossRef] [PubMed]
- Tartaglia, L.A.; Dembski, M.; Weng, X.; Deng, N.; Culpepper, J.; Devos, R.; Richards, G.J.; Campfield, L.A.; Clark, F.T.; Deeds, J.; et al. Identification and expression cloning of a leptin receptor, OB-R. Cell 1995, 83, 1263–1271. [Google Scholar] [CrossRef] [PubMed]
- Baumann, H.; Morella, K.K.; White, D.W.; Dembski, M. The full-length leptin receptor has signaling capabilities of interleukin 6-type cytokine receptors. Proc. Natl. Acad. Sci. USA 1996, 93, 8374–8378. [Google Scholar] [CrossRef] [PubMed]
- Banks, A.S.; Davis, S.M.; Bates, S.H.; Myers, M.G., Jr. Activation of Downstream Signals by the Long Form of the Leptin Receptor *. J. Biol. Chem. 2000, 275, 14563–14572. [Google Scholar] [CrossRef] [PubMed]
- Hekerman, P.; Zeidler, J.; Bamberg-Lemper, S.; Knobelspies, H.; Lavens, D.; Tavernier, J.; Joost, H.G.; Becker, W. Pleiotropy of leptin receptor signalling is defined by distinct roles of the intracellular tyrosines. Febs J. 2005, 272, 109–119. [Google Scholar] [CrossRef] [PubMed]
- Bjørbæk, C.; Lavery, H.J.; Bates, S.H.; Olson, R.K.; Davis, S.M.; Flier, J.S.; Myers, M.G. SOCS3 mediates feedback inhibition of the leptin receptor via Tyr985*. J. Biol. Chem. 2000, 275, 40649–40657. [Google Scholar] [CrossRef] [PubMed]
- Loffreda, S.; Yang, S.Q.; Lin, H.Z.; Karp, C.L.; Brengman, M.L.; Wang, D.J.; Klein, A.S.; Bulkley, G.B.; Bao, C.; Noble, P.W.; et al. Leptin regulates proinflammatory immune responses. Faseb J. 1998, 12, 57–65. [Google Scholar] [CrossRef]
- Lord, G.M.; Matarese, G.; Howard, J.K.; Baker, R.J.; Bloom, S.R.; Lechler, R.I. Leptin modulates the T-cell immune response and reverses starvation-induced immunosuppression. Nature 1998, 394, 897–901. [Google Scholar] [CrossRef] [PubMed]
- Stjernholm, T.; Ommen, P.; Langkilde, A.; Johansen, C.; Iversen, L.; Rosada, C.; Stenderup, K. Leptin deficiency in mice counteracts imiquimod (IMQ)-induced psoriasis-like skin inflammation while leptin stimulation induces inflammation in human keratinocytes. Exp. Dermatol. 2017, 26, 338–345. [Google Scholar] [CrossRef] [PubMed]
- Peelman, F.; Van Beneden, K.; Zabeau, L.; Iserentant, H.; Ulrichts, P.; Defeau, D.; Verhee, A.; Catteeuw, D.; Elewaut, D.; Tavernier, J. Mapping of the leptin binding sites and design of a leptin antagonist. J. Biol. Chem. 2004, 279, 41038–41046. [Google Scholar] [CrossRef] [PubMed]
- Fazeli, M.; Zarkesh-Esfahani, H.; Wu, Z.; Maamra, M.; Bidlingmaier, M.; Pockley, A.G.; Watson, P.; Matarese, G.; Strasburger, C.J.; Ross, R.J.M. Identification of a monoclonal antibody against the leptin receptor that acts as an antagonist and blocks human monocyte and T cell activation. J. Immunol. Methods 2006, 312, 190–200. [Google Scholar] [CrossRef] [PubMed]
- Singh, U.P.; Singh, N.P.; Guan, H.; Busbee, B.; Price, R.L.; Taub, D.D.; Mishra, M.K.; Fayad, R.; Nagarkatti, M.; Nagarkatti, P.S. Leptin antagonist ameliorates chronic colitis in IL-10−/− mice. Immunobiology 2013, 218, 1439–1451. [Google Scholar] [CrossRef] [PubMed]
- Zabeau, L.; Wauman, J.; Dam, J.; Van Lint, S.; Burg, E.; De Geest, J.; Rogge, E.; Silva, A.; Jockers, R.; Tavernier, J. A novel leptin receptor antagonist uncouples leptin’s metabolic and immune functions. Cell. Mol. Life Sci. 2019, 76, 1201–1214. [Google Scholar] [CrossRef] [PubMed]
- Tao, P.; Kuang, Y.; Li, Y.; Li, W.; Gao, Z.; Liu, L.; Qiang, M.; Zha, Z.; Fan, K.; Ma, P.; et al. Selection of a full agonist combinatorial antibody that rescues leptin deficiency in vivo. Adv. Sci. 2020, 7, 2000818. [Google Scholar] [CrossRef] [PubMed]
- Wang, S.; Shi, X.; Li, J.; Huang, Q.; Ji, Q.; Yao, Y.; Wang, T.; Liu, L.; Ye, M.; Deng, Y.; et al. A small molecule selected from a DNA-encoded library of natural products that binds to TNF- α and attenuates inflammation in vivo. Adv. Sci. 2022, 9, 2201258. [Google Scholar] [CrossRef] [PubMed]
- Altarejos, J.Y.; Pangilinan, J.; Podgrabinska, S.; Akinci, B.; Foss-Freitas, M.; Neidert, A.H.; Ray, Y.; Zheng, W.; Kim, S.; Kamat, V.; et al. Preclinical, randomized phase 1, and compassionate use evaluation of REGN4461, a leptin receptor agonist antibody for leptin deficiency. Sci. Transl. Med. 2023, 15, eadd4897. [Google Scholar] [CrossRef] [PubMed]
- Abdiche, Y.N.; Malashock, D.S.; Pinkerton, A.; Pons, J. Exploring blocking assays using Octet, ProteOn, and Biacore biosensors. Anal. Biochem 2009, 386, 172–180. [Google Scholar] [CrossRef] [PubMed]
- Moraga, I.; Wernig, G.; Wilmes, S.; Gryshkova, V.; Richter, Christian P.; Hong, W.-J.; Sinha, R.; Guo, F.; Fabionar, H.; Wehrman, Tom S.; et al. Tuning cytokine receptor signaling by re-orienting dimer geometry with surrogate ligands. Cell 2015, 160, 1196–1208. [Google Scholar] [CrossRef] [PubMed]
- Zhou, Y.; Stevis, P.E.; Cao, J.; Saotome, K.; Wu, J.; Glatman Zaretsky, A.; Haxhinasto, S.; Yancopoulos, G.D.; Murphy, A.J.; Sleeman, M.W.; et al. Structural insights into the assembly of gp130 family cytokine signaling complexes. Sci. Adv. 2023, 9, eade4395. [Google Scholar] [CrossRef] [PubMed]
- Saxton, R.A.; Caveney, N.A.; Moya-Garzon, M.D.; Householder, K.D.; Rodriguez, G.E.; Burdsall, K.A.; Long, J.Z.; Garcia, K.C. Structural insights into the mechanism of leptin receptor activation. Nat. Commun. 2023, 14, 1797. [Google Scholar] [CrossRef] [PubMed]
- De Young, L.M.; Kheifets, J.B.; Ballaron, S.J.; Young, J.M. Edema and cell infiltration in the phorbol ester-treated mouse ear are temporally separate and can be differentially modulated by pharmacologic agents. Agents Actions 1989, 26, 335–341. [Google Scholar] [CrossRef] [PubMed]
Figure 1.
Biophysical characterization and cross-species LepR binding of H6-IgG. (a) SDS-PAGE analysis of purified H6-IgG under non-reducing (−) and reducing (+) conditions using β-mercaptoethanol (β-ME). (b) Size-exclusion chromatography (SEC) profile of purified H6-IgG. (c) Thermal unfolding profile of H6-IgG measured by nano-differential scanning fluorimetry (nanoDSF). (d,e) Concentration-dependent binding of H6-IgG to hLepR-ECD (d) and mLepR-ECD (e), determined by ELISA. Curves were fitted using four-parameter logistic (4PL) regression. Data are presented as mean ± SD (n = 3 technical replicates). (f,g) Surface plasmon resonance (SPR) sensorgrams showing the association and dissociation of H6-IgG with immobilized hLepR-ECD (f) and mLepR-ECD (g). Experimental sensorgrams were fitted using a 1:1 kinetic binding model.
Figure 1.
Biophysical characterization and cross-species LepR binding of H6-IgG. (a) SDS-PAGE analysis of purified H6-IgG under non-reducing (−) and reducing (+) conditions using β-mercaptoethanol (β-ME). (b) Size-exclusion chromatography (SEC) profile of purified H6-IgG. (c) Thermal unfolding profile of H6-IgG measured by nano-differential scanning fluorimetry (nanoDSF). (d,e) Concentration-dependent binding of H6-IgG to hLepR-ECD (d) and mLepR-ECD (e), determined by ELISA. Curves were fitted using four-parameter logistic (4PL) regression. Data are presented as mean ± SD (n = 3 technical replicates). (f,g) Surface plasmon resonance (SPR) sensorgrams showing the association and dissociation of H6-IgG with immobilized hLepR-ECD (f) and mLepR-ECD (g). Experimental sensorgrams were fitted using a 1:1 kinetic binding model.
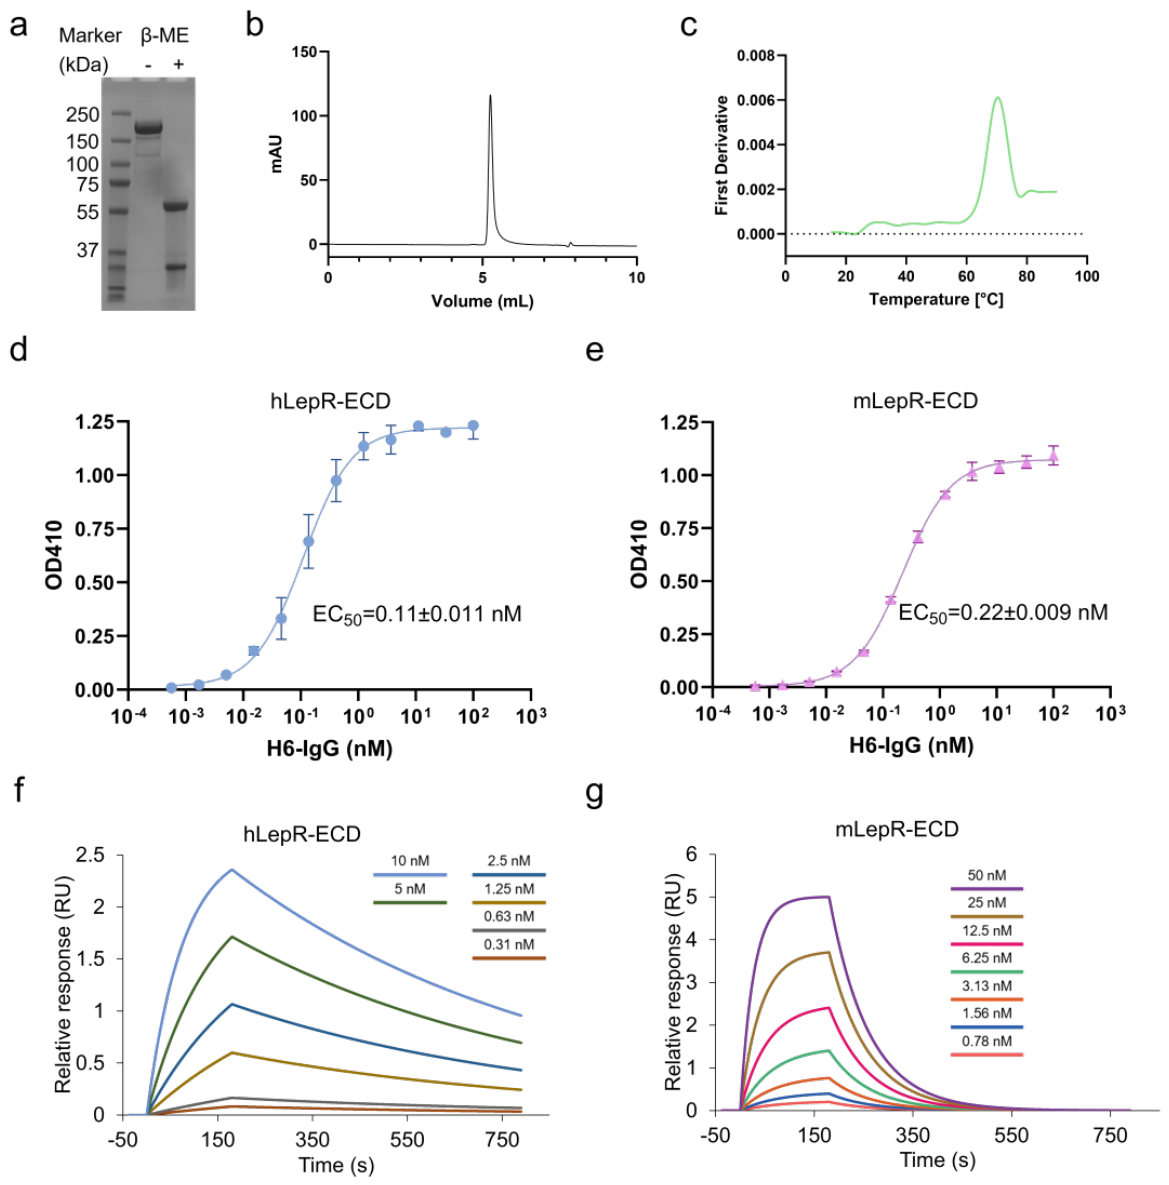
Figure 2.
Competitive binding of H6-IgG and leptin to human and mouse LepR. (a,b) Competitive binding ELISA showing the effects of increasing leptin concentrations on H6-IgG binding to hLepR-ECD (a) and mLepR-ECD (b). Fixed H6-IgG concentrations of 1 and 0.25 nM were used for hLepR-ECD (a), and 10 nM for mLepR-ECD (b). Curves were fitted using four-parameter logistic (4PL) regression. Data are presented as mean ± SD (n = 3 technical replicates). (c,d) Biolayer interferometry (BLI; Octet) analysis of sequential leptin and antibody binding to hLepR-ECD (c) and mLepR-ECD (d). LepR-ECD-loaded biosensors were first exposed to 100 nM leptin (0–300 s), followed by 100 nM leptin alone, 100 nM H6-IgG or mibavademab in PBST, or 100 nM H6-IgG or mibavademab supplemented with 100 nM leptin (300–500 s). Leptin was maintained at 100 nM in all leptin-containing solutions during the second phase to minimize dissociation-related changes in receptor occupancy.
Figure 2.
Competitive binding of H6-IgG and leptin to human and mouse LepR. (a,b) Competitive binding ELISA showing the effects of increasing leptin concentrations on H6-IgG binding to hLepR-ECD (a) and mLepR-ECD (b). Fixed H6-IgG concentrations of 1 and 0.25 nM were used for hLepR-ECD (a), and 10 nM for mLepR-ECD (b). Curves were fitted using four-parameter logistic (4PL) regression. Data are presented as mean ± SD (n = 3 technical replicates). (c,d) Biolayer interferometry (BLI; Octet) analysis of sequential leptin and antibody binding to hLepR-ECD (c) and mLepR-ECD (d). LepR-ECD-loaded biosensors were first exposed to 100 nM leptin (0–300 s), followed by 100 nM leptin alone, 100 nM H6-IgG or mibavademab in PBST, or 100 nM H6-IgG or mibavademab supplemented with 100 nM leptin (300–500 s). Leptin was maintained at 100 nM in all leptin-containing solutions during the second phase to minimize dissociation-related changes in receptor occupancy.
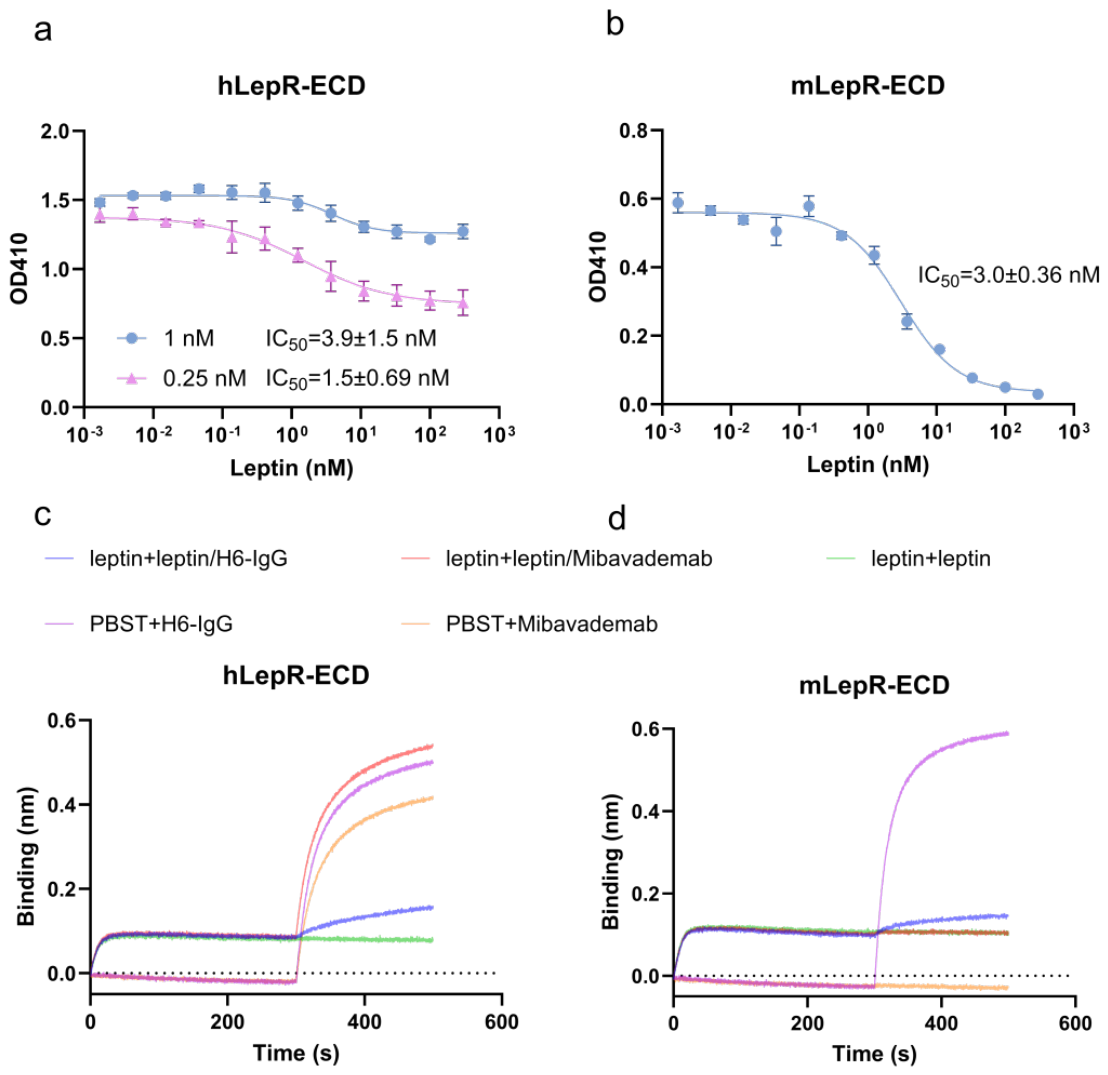
Figure 3.
H6-IgG shows no appreciable agonist activity and inhibits leptin-induced STAT3/STAT5 signaling. (a–c) Agonistic activity of H6-IgG in human LepR-expressing cells. (a) STAT3-responsive SIE-luciferase activity following H6-IgG treatment in hLepR-SIE-HEK293T reporter cells. (b,c) STAT3 Tyr705 (b) and STAT5 Tyr694 (c) phosphorylation following H6-IgG treatment in hLepR-Ba/F3 cells, measured by intracellular phospho-flow cytometry. (d–f) Antagonistic activity of H6-IgG against leptin-induced signaling. (d) Concentration-dependent inhibition of 0.5 nM leptin-induced SIE-luciferase activity by H6-IgG in hLepR-SIE-HEK293T reporter cells. (e,f) Concentration-dependent inhibition of 10 nM leptin-induced STAT3 Tyr705 (e) and STAT5 Tyr694 (f) phosphorylation by H6-IgG in hLepR-Ba/F3 cells. Phosphorylation signals in (b,c) were normalized to the maximal leptin-induced response, defined as 100%. MFI, mean fluorescence intensity. Data are presented as mean ± SD (n = 3 technical replicates).
Figure 3.
H6-IgG shows no appreciable agonist activity and inhibits leptin-induced STAT3/STAT5 signaling. (a–c) Agonistic activity of H6-IgG in human LepR-expressing cells. (a) STAT3-responsive SIE-luciferase activity following H6-IgG treatment in hLepR-SIE-HEK293T reporter cells. (b,c) STAT3 Tyr705 (b) and STAT5 Tyr694 (c) phosphorylation following H6-IgG treatment in hLepR-Ba/F3 cells, measured by intracellular phospho-flow cytometry. (d–f) Antagonistic activity of H6-IgG against leptin-induced signaling. (d) Concentration-dependent inhibition of 0.5 nM leptin-induced SIE-luciferase activity by H6-IgG in hLepR-SIE-HEK293T reporter cells. (e,f) Concentration-dependent inhibition of 10 nM leptin-induced STAT3 Tyr705 (e) and STAT5 Tyr694 (f) phosphorylation by H6-IgG in hLepR-Ba/F3 cells. Phosphorylation signals in (b,c) were normalized to the maximal leptin-induced response, defined as 100%. MFI, mean fluorescence intensity. Data are presented as mean ± SD (n = 3 technical replicates).
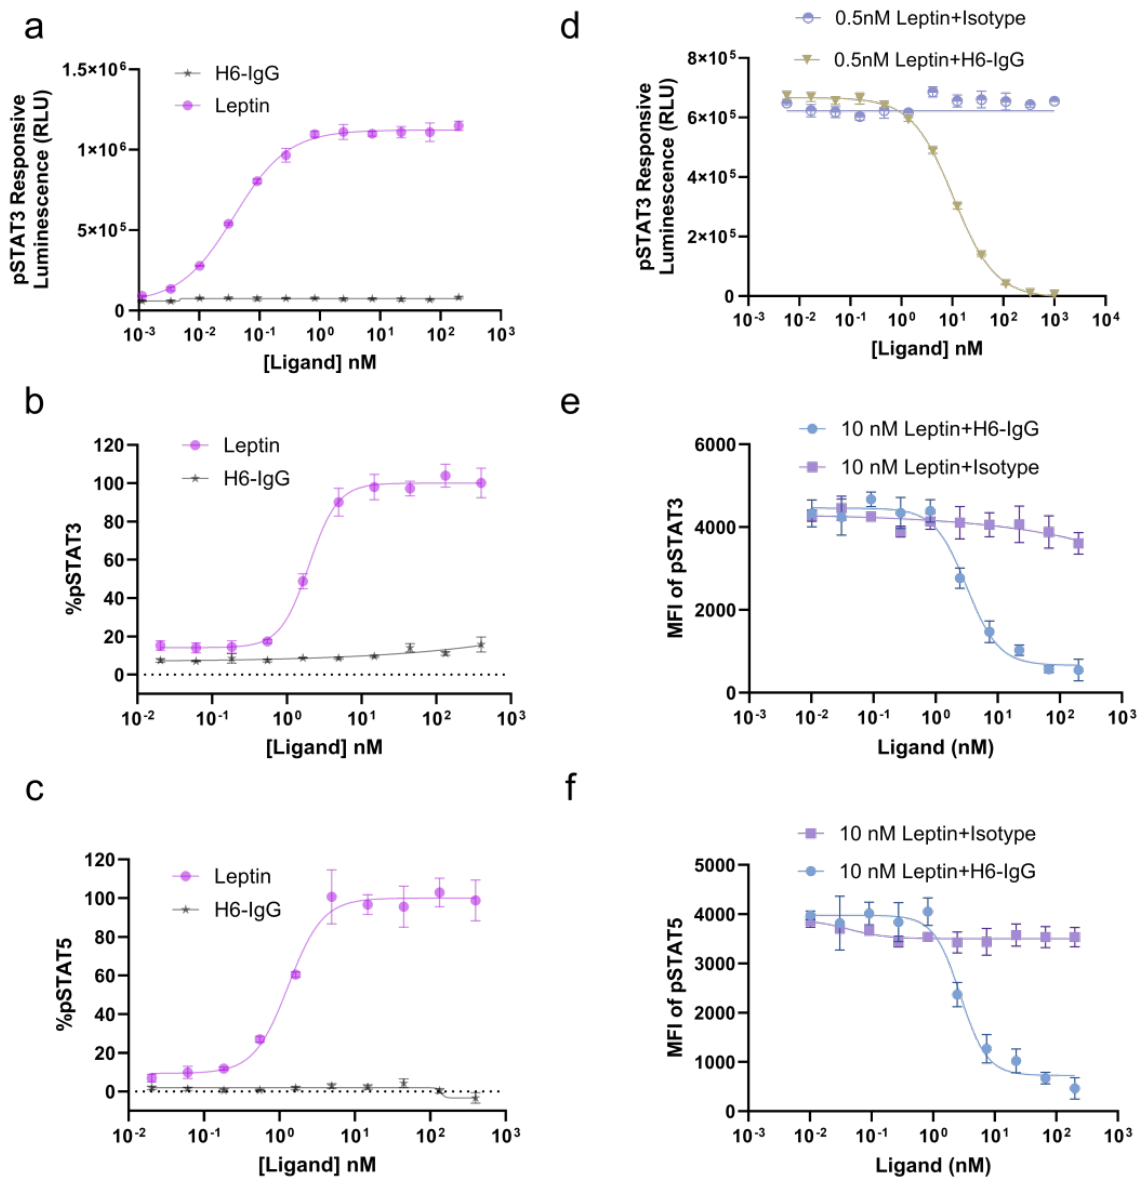
Figure 4.
H6-IgG inhibits leptin-induced NanoBiT signaling and alters modeled LepR arrangements. (a,b) NanoBiT complementation assays assessing membrane-proximal hLepR reporter responses. (a) Concentration-dependent NanoBiT responses induced by H6-IgG compared with leptin. (b) Inhibition of 10 nM leptin-induced NanoBiT responses by increasing concentrations of H6-IgG. Background luminescence was subtracted before normalization, and concentration–response curves were fitted using four-parameter logistic (4PL) regression. Responses in (a) were normalized to the maximal leptin-induced signal, whereas those in (b) were normalized to the leptin-stimulated isotype-control response, each defined as 100%. Data are presented as mean ± SD (n = 3 technical replicates). (c,d) Template-assisted structural model of H6-IgG bound to two hLepR ectodomains, constructed using the H6–hLepR-CRH2 structural reference (PDB: 7CTU), hLepR (PDB: 8AVE), and an intact IgG1 scaffold (PDB: 1IGY). The modeled distance between the Cα atoms of Asp831 in the two receptors is approximately 84.0 Å (c). The same model is shown after a 90° rotation about the vertical axis (d). (e) Cryo-EM structure of the human leptin–LepR complex (PDB: 8AVE; 2:2 leptin), showing an Asp831 Cα–Cα distance of approximately 9.7 Å. H6 Fab regions and leptin are shown in blue, the IgG1 hinge–Fc scaffold in gray, and the two LepR ectodomains in green and orange. Asp831 (hLepR) and Thr827 (mLepR) are highlighted in red. Connecting lines indicate the three-dimensional Cα–Cα distances between the indicated residues. Panels (c,d) represent template-assisted structural models, whereas panels (e) show experimentally determined cryo-EM structures.
Figure 4.
H6-IgG inhibits leptin-induced NanoBiT signaling and alters modeled LepR arrangements. (a,b) NanoBiT complementation assays assessing membrane-proximal hLepR reporter responses. (a) Concentration-dependent NanoBiT responses induced by H6-IgG compared with leptin. (b) Inhibition of 10 nM leptin-induced NanoBiT responses by increasing concentrations of H6-IgG. Background luminescence was subtracted before normalization, and concentration–response curves were fitted using four-parameter logistic (4PL) regression. Responses in (a) were normalized to the maximal leptin-induced signal, whereas those in (b) were normalized to the leptin-stimulated isotype-control response, each defined as 100%. Data are presented as mean ± SD (n = 3 technical replicates). (c,d) Template-assisted structural model of H6-IgG bound to two hLepR ectodomains, constructed using the H6–hLepR-CRH2 structural reference (PDB: 7CTU), hLepR (PDB: 8AVE), and an intact IgG1 scaffold (PDB: 1IGY). The modeled distance between the Cα atoms of Asp831 in the two receptors is approximately 84.0 Å (c). The same model is shown after a 90° rotation about the vertical axis (d). (e) Cryo-EM structure of the human leptin–LepR complex (PDB: 8AVE; 2:2 leptin), showing an Asp831 Cα–Cα distance of approximately 9.7 Å. H6 Fab regions and leptin are shown in blue, the IgG1 hinge–Fc scaffold in gray, and the two LepR ectodomains in green and orange. Asp831 (hLepR) and Thr827 (mLepR) are highlighted in red. Connecting lines indicate the three-dimensional Cα–Cα distances between the indicated residues. Panels (c,d) represent template-assisted structural models, whereas panels (e) show experimentally determined cryo-EM structures.
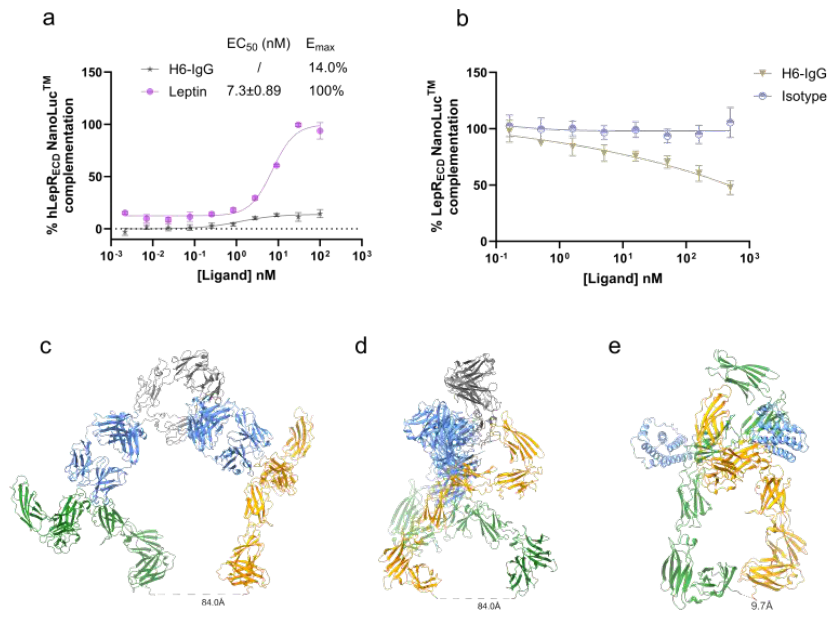
Figure 5.
H6-IgG attenuates TPA-induced acute cutaneous inflammation in mice. (a) Schematic timeline of the TPA-induced ear inflammation model and H6-IgG treatment. (b,c) Effects of H6-IgG on TPA-induced increases in ear thickness (b) and ear weight (c). (d) Quantification of inflammatory-cell infiltration in hematoxylin and eosin (H&E)-stained ear sections. Eighteen microscopic fields from one section per mouse were quantified and averaged to obtain one value per mouse. (e) Representative H&E-stained ear sections. Scale bar, 200 μm. Data are presented as mean ± SD (n = 3 mice per group). Statistical comparisons were performed against the TPA-challenged, PBS-treated group using one-way ANOVA followed by Dunnett’s multiple-comparisons test. **p < 0.01, ***p < 0.001, ****p < 0.0001; ns, not significant.
Figure 5.
H6-IgG attenuates TPA-induced acute cutaneous inflammation in mice. (a) Schematic timeline of the TPA-induced ear inflammation model and H6-IgG treatment. (b,c) Effects of H6-IgG on TPA-induced increases in ear thickness (b) and ear weight (c). (d) Quantification of inflammatory-cell infiltration in hematoxylin and eosin (H&E)-stained ear sections. Eighteen microscopic fields from one section per mouse were quantified and averaged to obtain one value per mouse. (e) Representative H&E-stained ear sections. Scale bar, 200 μm. Data are presented as mean ± SD (n = 3 mice per group). Statistical comparisons were performed against the TPA-challenged, PBS-treated group using one-way ANOVA followed by Dunnett’s multiple-comparisons test. **p < 0.01, ***p < 0.001, ****p < 0.0001; ns, not significant.
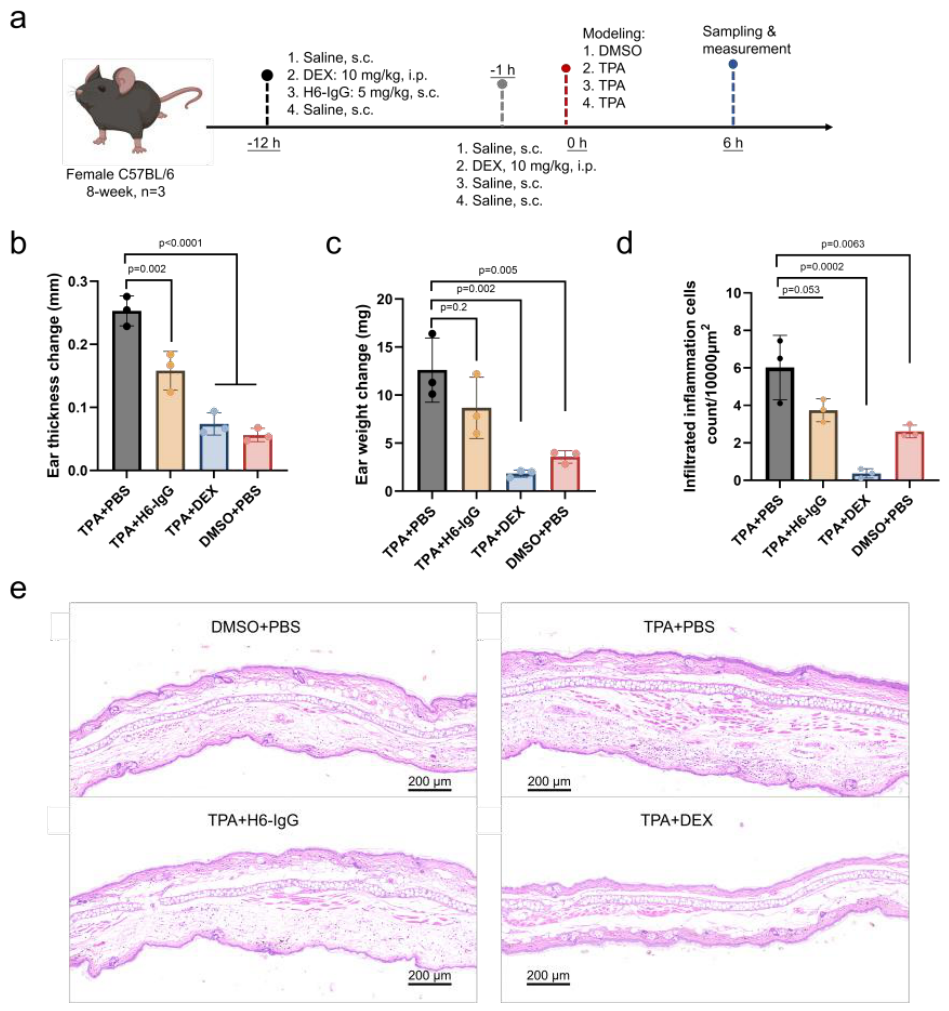

Table 1.
SPR-derived binding kinetic parameters of H6-IgG for human and mouse LepR-ECD.
| Ligand | hLepR-ECD | mLepR-ECD | ||||
| KD(M) | ka(1/M*s) | kd(1/s) | KD(M) | ka(1/M*s) | kd(1/s) | |
| H6-IgG | 2.53×10⁻⁹ | 5.85×10⁵ | 1.48×10⁻³ | 2.53×10⁻⁸ | 4.95×10⁵ | 1.25×10⁻² |
Association rate constants (kₐ), dissociation rate constants (kᵈ), and equilibrium dissociation constants (Kᴅ) were determined by fitting the SPR sensorgrams to a 1:1 kinetic binding model. Kᴅ was calculated as kᵈ/kₐ.
Table 2.
Inhibitory potency of H6-IgG against leptin-induced signaling in human LepR-expressing cells.
Table 2.
Inhibitory potency of H6-IgG against leptin-induced signaling in human LepR-expressing cells.
| H6-IgG | hLepR-SIE-293T | hLepR-Ba/F3 | |
|
STAT3-responsive luciferase (RLU) |
pSTAT3 (Y705) |
pSTAT5 (Y694) |
|
| IC50(nM) | 10±0.30 | 3.2±0.36 | 2.8±0.34 |
IC50 values were determined by nonlinear regression of H6-IgG concentration–response curves from the SIE-luciferase, phospho-STAT3 (Tyr705), and phospho-STAT5 (Tyr694) assays shown in Figure 3d–f.
Disclaimer/Publisher’s Note: The statements, opinions and data contained in all publications are solely those of the individual author(s) and contributor(s) and not of MDPI and/or the editor(s). MDPI and/or the editor(s) disclaim responsibility for any injury to people or property resulting from any ideas, methods, instructions or products referred to in the content. |
© 2026 by the authors. Licensee MDPI, Basel, Switzerland. This article is an open access article distributed under the terms and conditions of the Creative Commons Attribution (CC BY) license (http://creativecommons.org/licenses/by/4.0/).
Copyright: This open access article is published under a Creative Commons CC BY 4.0 license, which permit the free download, distribution, and reuse, provided that the author and preprint are cited in any reuse.