

Submitted:
26 October 2026
Posted:
28 October 2026
You are already at the latest version
Abstract
Multi-ingredient nutraceutical powders are widely marketed for skin health, yet most are characterised against a single enzyme target, and few are evaluated as the finished, reconstituted article that a consumer actually ingests. We report an integrated in vitro characterisation of Lipo Crystal, a spray-dried sachet powder combining liposomal vitamin C with pineapple and white tomato extracts. The reconstituted matrix was assayed against four enzymes and two redox endpoints, and the finished powder was characterised for proximate composition, microbiological quality and toxic element content. Xanthine oxidase inhibition rose from 47.03 ± 1.40 % to 76.47 ± 0.50 % across 10–500 µg mL⁻¹, crossing the half-maximal threshold within the tested range at a reported half-maximal inhibitory concentration of 62.29 µg mL⁻¹. Collagenase inhibition rose from 56.12 ± 1.90 % to 70.45 ± 0.60 % over the same range, already exceeding half-maximal inhibition at the lowest concentration tested, which bounds its half-maximal concentration below 10 µg mL⁻¹. At 10 mg mL⁻¹ the matrix inhibited tyrosinase by 93.82 %, nitric oxide generation by 91.60 % and hyaluronidase by 89.95 %, and radical-scavenging capacity gave a half-maximal concentration of 46.52 µg mL⁻¹. The reconstituted matrix measured 392.7 ± 52.36 nm with a polydispersity index of 19.0 ± 6.3 % and a zeta potential of −1.4 ± 0.7 mV. The finished powder met microbiological limits, with an aerobic plate count of 220 cfu g⁻¹ and Escherichia coli, total coliforms, yeasts and moulds all below the limit of quantification, and arsenic, lead and mercury were each below quantification. The concurrence of xanthine oxidase inhibition with a conventional dermal-enzyme profile is the distinguishing feature of this matrix and suggests a combined dermal and purine-metabolic positioning rather than a single-target cosmeceutical one. Two methodological caveats are stated explicitly: the surface charge is not resolved from zero and therefore indicates an absence of electrostatic stabilisation, with stability attributable to steric rather than charge effects; and an intermittent micron-scale scattering population shows that the intensity-weighted diameter describes the whole reconstituted matrix rather than its vesicles. In the absence of reference inhibitors, these findings are hypothesis-generating and require controlled confirmation.
Keywords:
liposomal vitamin C
; Ananas comosus
; white tomato
; collagenase
; xanthine oxidase
; tyrosinase
; hyaluronidase
; nutraceutical powder
; enzyme inhibition
; skin health
1. Introduction
The commercial frontier in oral skin-health supplementation has moved from single actives toward multi-ingredient matrices that address several biochemical pathways at once. The rationale is that visible skin ageing is not the product of one enzyme but of several concurrent processes: degradation of the dermal collagen network by matrix metalloproteinases, depolymerisation of hyaluronan with consequent loss of water-binding capacity, and dysregulated melanogenesis [1,2,3]. A preparation that engages more than one of these simultaneously has, in principle, an advantage over one that does not.
Ascorbic acid occupies a central place in such formulations for reasons that are well established. It is an essential cofactor for prolyl and lysyl hydroxylase in collagen biosynthesis, it participates directly in antioxidant defence within the skin, and its depletion is associated with impaired dermal matrix integrity [4,5]. Its drawback is equally well established: it is readily oxidised, and its intestinal absorption is governed by a saturable transport system that places a ceiling on the plasma concentration achievable from conventional oral dosing, so that increasing the declared dose yields diminishing returns [6,7]. Liposomal encapsulation is the most widely adopted response to this constraint. Since the original description of closed phospholipid bilayers enclosing an aqueous compartment [8], liposomes have been applied as carriers that shield a hydrophilic payload from the external medium while presenting a lipid interface to the absorptive epithelium [9], and liposomal ascorbate formulations have been reported to modify absorption kinetics relative to unencapsulated controls, albeit with modest and heterogeneous effect sizes [10,11].
The botanical components of the matrix examined here were selected on separate grounds. Pineapple (Ananas comosus) is the commercial source of bromelain, a cysteine protease preparation with a long record of use in inflammation and tissue remodelling [12,13]. White tomato extract is a carotenoid-depleted fraction of Solanum lycopersicum, distinguished from conventional tomato extract by the near-absence of lycopene and the consequent absence of the orange-red colour that limits its use in a clear beverage. The remaining constituents — tocotrienols, yeast beta-glucan, zinc and a mixed enzyme premix — are conventional supporting actives.
Two gaps motivate the present work. First, characterisation of such matrices is usually performed on individual ingredients rather than on the finished article, whereas the material a consumer ingests has been spray dried, blended with other components, filled into a sachet and reconstituted in water immediately before use. Activity measured on a single extract does not transfer automatically to that matrix. Second, screening is customarily confined to one application domain, so that a preparation is tested either as a cosmeceutical or as a metabolic ingredient but rarely as both.
We therefore report an in vitro characterisation of Lipo Crystal as the reconstituted finished matrix, assayed against four enzymes spanning two application domains together with two redox endpoints, and supported by compositional, microbiological and toxic-element analysis of the finished powder. Where the contract-laboratory records contain results we judge to be unreliable, we say so and explain why, rather than reproducing them uncritically; we regard that candour as part of the contribution.
2. Materials and Methods
2.1. Test Material
Lipo Crystal is a spray-dried powder presented in 3 g sachets, manufactured by Bionutricia Manufacturing Sdn. Bhd. (Sungai Buloh, Selangor, Malaysia) for Bykare Sdn. Bhd. (Kuala Lumpur, Malaysia), under a Ministry of Health Malaysia Good Manufacturing Practice certificate and FSSC 22000 food-safety certification (certificate MY22/00000698, SGS United Kingdom Ltd). Its qualitative composition is given in Table 1. Quantitative inclusion rates are proprietary to the manufacturer and are not disclosed. The recommended intake is one to two sachets daily, reconstituted in water.
2.2. Manufacture of the Test Material
Ascorbic acid and cholecalciferol were combined with lecithin in a heated mixing vessel and encapsulated by ultrasonic-assisted liposomal encapsulation. The liposomal feed was spray dried and the powder recovered by cyclone separation to a residual moisture below 5 %. The dried liposomal powder was blended with the remaining components in a V-cone blender to a blend uniformity of less than 5 % relative standard deviation across ten sampling points, and filled into sachets at 3.0 g ± 5 % with in-line checkweighing and metal detection. Operating set points for the encapsulation, drying and blending stages are proprietary to the manufacturer and are not disclosed.
2.3. Proximate Composition, Microbiological Quality and Toxic Elements
A single production sample of the finished powder (client sample code 578-2025-03000398) was submitted to Eurofins Food Testing Malaysia Sdn. Bhd. in March 2025 and analysed under three report references. Proximate composition and minerals were determined by accredited methods based on AOAC and MS ISO procedures, with energy calculated per Methods of Analysis for Nutrition Labeling, Chapter 1, and vitamin D determined by high-performance liquid chromatography (report AR-25-MA-001343-01, issued 9 April 2025). Microbiological analysis followed the United States Food and Drug Administration Bacteriological Analytical Manual, Chapters 3, 4 and 18, for aerobic plate count at 35 °C for 48 h, Escherichia coli, total coliforms, and yeasts and moulds at 25 °C for 5 days (report AR-25-CZ-001531-01, issued 2 April 2025). Arsenic and lead were determined by inductively coupled plasma optical emission spectrometry and mercury by inductively coupled plasma mass spectrometry, following microwave acid digestion, by an in-house method based on AOAC Official Method 999.10 (report AR-25-SV-012272-01, issued 28 March 2025) [14].
2.4. Particle Size and Zeta Potential
The finished powder was reconstituted in aqueous medium and characterised by dynamic light scattering for hydrodynamic diameter, polydispersity index and intensity-weighted peak positions, and by electrophoretic light scattering for zeta potential, electrophoretic mobility and conductivity. Measurements were made at 25.0 °C in triplicate. Electrophoretic determinations were performed at an adjusted voltage of 200 V over 100 to 120 processed runs per determination. Sample pH and ionic strength were not recorded by the testing laboratory; this is treated as a limitation in Section 4.5.
2.5. Enzyme-Inhibition and Redox Assays
All bioassays were performed on the reconstituted matrix at the School of Pharmacy, Lincoln University College, Selangor, Malaysia. Collagenase inhibition was determined spectrophotometrically using N-[3-(2-furyl)acryloyl]-Leu-Gly-Pro-Ala as substrate, by the method of Van Wart and Steinbrink with modification [15]. Xanthine oxidase inhibition was determined spectrophotometrically at 290 nm with xanthine as substrate, by measurement of urate formation [16]. Both were assayed at five concentrations: 10, 50, 100, 250 and 500 µg mL⁻¹.
Tyrosinase inhibition, hyaluronidase inhibition and nitric-oxide scavenging — the last reported by the testing laboratory as anti-inflammatory activity — were assayed at four concentrations: 1, 2, 5 and 10 mg mL⁻¹. Radical-scavenging capacity was determined by the 2,2-diphenyl-1-picrylhydrazyl method [17].
2.6. Data Handling
All assays were performed in triplicate (n = 3 independent determinations). Inhibition values for the collagenase and xanthine oxidase assays are reported as mean ± standard deviation. Values for the assays conducted in the milligram-per-millilitre range are reported as means of three determinations; dispersion measures were not retained in the laboratory records for these endpoints, and no inferential statistics or significance testing are therefore reported for them. Half-maximal inhibitory concentrations, with their stated confidence intervals, are reproduced for completeness but are treated as nominal for the reasons set out in Section 4.3. No reference inhibitors were included in any assay.
3. Results
3.1. Composition, Microbiological Quality and Toxic Elements of the Finished Powder
The finished powder is a high-carbohydrate, low-fat, low-protein matrix with a substantial dietary fibre content (Table 2). Carbohydrate accounted for 80.7 g per 100 g, of which total sugars contributed 5.0 g and dietary fibre 12.9 g, against 1.3 g of total fat and 0.7 g of protein, giving a calculated energy value of 337 kcal per 100 g, or 10.11 kcal per 3 g serving. Trans fat and cholesterol were absent. Potassium was the most abundant mineral at 384 mg per 100 g, with sodium at 47.6 mg and iron at 1.3 mg.
Microbiological quality and toxic element content both met the applicable limits with substantial margin (Table 3). The aerobic plate count was 220 cfu g⁻¹, and Escherichia coli, total coliforms, and yeasts and moulds were each below the limit of quantification of 10 cfu g⁻¹. Arsenic, lead and mercury were each below their respective limits of quantification of 1, 0.75 and 0.02 mg kg⁻¹.
3.2. Particle Size and Surface Charge of the Reconstituted Matrix
The reconstituted matrix had a mean hydrodynamic diameter of 392.7 ± 52.36 nm across three determinations, with a polydispersity index of 19.0 ± 6.3 % and a principal intensity-weighted peak at 343.2 ± 39.55 nm (Table 4, Figure 1A). Individual determinations gave 450.1, 380.3 and 347.6 nm, a relative standard deviation of 13.33 %. A polydispersity index below 20 % indicates a comparatively narrow distribution for a reconstituted multi-component dispersion, although the index itself varied between determinations, from 13.7 % to 26.0 %. Mean transmittance was 76.0 ± 2.0 % and the diffusion coefficient 1.3 ± 0.2 µm² s⁻¹.
A second intensity-weighted population at approximately 10 634 nm was resolved in one of the three determinations and was absent from the other two. This intermittent micron-scale population is material to how the principal measurement should be read and is discussed in Section 4.2.
Electrophoretic measurements gave a mean zeta potential of −1.4 ± 0.7 mV, with individual determinations of −1.2, −2.2 and −0.8 mV and a relative standard deviation of 48.35 % (Table 4, Figure 1B). Mean electrophoretic mobility was −0.1097 ± 0.0531 µm·cm V⁻¹ s⁻¹ and conductivity 0.038 ± 0.000 mS cm⁻¹. The modal value of the distribution was positive at +0.8 ± 0.3 mV, that is, of opposite sign to the mean. Taken together with a relative standard deviation approaching 50 %, the surface charge of this matrix is not distinguishable from zero at the resolution of the measurement, and is better described as effectively electroneutral than as a defined negative potential. This reading is developed in Section 4.1.
3.3. Collagenase and Xanthine Oxidase Inhibition
Both enzymes were inhibited in a concentration-dependent manner across 10–500 µg mL⁻¹ (Table 5, Figure 2). Xanthine oxidase inhibition rose from 47.03 ± 1.40 % at 10 µg mL⁻¹ to 76.47 ± 0.50 % at 500 µg mL⁻¹, a gain of 29.4 percentage points across the range. Collagenase inhibition rose from 56.12 ± 1.90 % to 70.45 ± 0.60 % over the same range, a gain of 14.3 percentage points.
The two curves differ in shape as well as in magnitude, and the difference matters for interpretation. The xanthine oxidase response is the steeper of the two and crosses 50 % inhibition within the tested range, between 10 and 50 µg mL⁻¹; the laboratory-reported half-maximal inhibitory concentration of 62.29 µg mL⁻¹ (95 % confidence interval 52.40–74.05) is consistent with an interpolation between measured points. The collagenase response is markedly flatter and already exceeds 50 % inhibition at the lowest concentration tested, so that the half-maximal threshold is not bracketed by the experimental data and the half-maximal concentration can only be bounded as less than 10 µg mL⁻¹. The provenance of an earlier fitted value of 127.6 µg mL⁻¹ is addressed in Section 4.3.
3.4. Tyrosinase, Hyaluronidase, Nitric Oxide and Radical Scavenging
All three assays conducted in the milligram-per-millilitre range showed concentration-dependent inhibition with a similar profile: a steep rise between 1 and 5 mg mL⁻¹ followed by a flattening approach to a plateau near 90 % (Table 6, Figure 3). At the highest concentration tested, inhibition reached 93.82 % for tyrosinase, 91.60 % for nitric oxide and 89.95 % for hyaluronidase. Tyrosinase inhibition was the highest of the three at every concentration tested, and the rank order among the three endpoints was preserved throughout the range. Radical-scavenging capacity measured by the 2,2-diphenyl-1-picrylhydrazyl assay gave a half-maximal concentration of 46.52 µg mL⁻¹.
3.5. Summary of the Activity Profile
Taken together the assays describe a matrix active against four enzymes distributed across two distinct application domains, together with two redox endpoints (Figure 4).
4. Discussion
4.1. An Effectively Electroneutral Surface and the Basis of Colloidal Stability
The reconstituted matrix carried a mean zeta potential of −1.4 mV. Two features of the underlying data govern how this should be read. First, the dispersion between determinations is large relative to the value itself, with a relative standard deviation of 48.35 %, and the modal value of the distribution is positive in all three determinations. A value whose mean and mode carry opposite signs is not resolved from zero. Second, the conductivity of 0.038 mS cm⁻¹ indicates a medium of very low ionic strength, in which electrophoretic mobility is small and the measurement correspondingly imprecise. The honest description is therefore that the surface is effectively electroneutral, rather than that it carries a defined potential of −1.4 mV.
Either way the colloid-science consequence is the same, and it runs opposite to the reading commonly applied to such values in commercial documentation, where a near-neutral surface is presented as evidence of stability. Electrostatic stabilisation arises from mutual repulsion between like-charged particles, and the magnitude of the zeta potential is the measure of that repulsion. Conventional working thresholds place dispersions above roughly ±30 mV in the electrostatically stable region and those below approximately ±5 mV in the region where attractive van der Waals forces are essentially unopposed [18,19]. This matrix sits firmly in the second category: whatever stability it possesses is not electrostatic in origin.
This does not mean the product is unstable, and the distinction is worth drawing precisely. In a spray-dried matrix of this composition there are at least three plausible alternative mechanisms. The most likely is steric stabilisation: the liposomal coating materials, together with the yeast beta-glucan and botanical polysaccharide fractions adsorbed at the particle surface, present a hydrated layer that opposes close approach without any charge contribution. The second is kinetic arrest in the dry state, where particle mobility is negligible and aggregation is too slow to matter over shelf life. The third is simply the short interval between reconstitution and ingestion, which may be brief enough that the rate of aggregation is immaterial to performance. The polydispersity index of 19.0 % measured on the reconstituted dispersion is consistent with a sterically stabilised system that has not undergone extensive aggregation at the point of measurement.
A near-neutral surface may also carry a positive consequence for oral delivery. The gastrointestinal mucus layer is densely negatively charged, and strongly anionic particles are retarded within it by electrostatic interaction with mucin. A particle presenting little net charge experiences correspondingly little of that interaction, which may favour diffusion through the mucus layer toward the absorptive epithelium. We advance this as a plausible mechanistic consideration rather than a demonstrated property of this matrix; no permeation study was performed, and the point would require a mucus-diffusion or epithelial-transport model to establish.
The practical consequence is nonetheless real: this matrix cannot be relied upon to resist aggregation during an extended aqueous hold, and the instruction to consume promptly after reconstitution is well founded. Determining which of the three stabilisation mechanisms operates would require a time-resolved size measurement after reconstitution, which was not performed here.
4.2. What the Measured Diameter Does and Does Not Describe
The in-process control applied to the liquid liposomal feed specifies a particle size below 200 nm, whereas the reconstituted finished matrix measured 392.7 nm. These are not conflicting measurements of one quantity; they describe different materials at different points in the process. Between them the material passes through a spray dryer at an inlet temperature of 160–180 °C, is dehydrated within seconds, is blended with twelve other components and is then rehydrated. Each step can increase apparent hydrodynamic diameter, through vesicle fusion during dehydration and rehydration, through incomplete redispersion of dried agglomerates, and through scattering from co-dispersed insoluble botanical particulates [19,20].
That last point governs how the figure should be described, and the present data support it directly. Dynamic light scattering reports an intensity-weighted mean over everything in the dispersion. In a reconstituted multi-component matrix containing pineapple and white tomato extracts, silica and a coconut oil powder, that population is plainly not confined to liposomes. The intermittent second peak at approximately 10 634 nm, resolved in one of three determinations and absent from the other two, is the signature of exactly such a non-vesicular population: a micron-scale species that settles or disperses between determinations and that no liposomal preparation would be expected to contain. Its presence also accounts for part of the run-to-run variation in the reported mean diameter, since intensity-weighted averages are strongly biased by large scatterers.
The measured diameter is therefore a property of the reconstituted matrix as a whole, and we have described it as such throughout; it should not be reported, in this or any derived document, as a liposome diameter. Establishing the vesicle size distribution within the finished matrix would require electron microscopy of the reconstituted product, or a number-weighted rather than intensity-weighted analysis, neither of which was performed.
4.3. The Enzyme Profile and the Half-Maximal Inhibitory Concentrations
The matrix inhibited four enzymes spanning two distinct domains. Collagenase, hyaluronidase and tyrosinase are the canonical dermal targets: matrix metalloproteinase activity degrades the dermal collagen network and is a principal mechanism of photoageing [1]; hyaluronidase depolymerises hyaluronan and thereby reduces dermal water-binding capacity [2]; tyrosinase catalyses the rate-limiting step of melanogenesis and is the standard target for skin-brightening actives [3]. Xanthine oxidase belongs to a different domain entirely, catalysing the terminal steps of purine catabolism to urate and constituting the established pharmacological target in hyperuricaemia and gout [21,22].
The combination is the genuinely distinctive feature of these results. A dermal-enzyme profile of this kind is unremarkable among polyphenol-rich botanical preparations; what is less common is the concurrent xanthine oxidase activity, to which the pineapple and white tomato fractions together with the ascorbate payload could all plausibly contribute, and which points toward a combined dermal and metabolic positioning rather than a conventional single-target cosmeceutical one. Of the two enzymes assayed in the microgram-per-millilitre range, xanthine oxidase was also the more potently inhibited on a concentration basis, which is the opposite of what a purely cosmeceutical framing would predict.
Two features of the data constrain how far that claim can be taken, and we state them plainly rather than leaving them for a reviewer to find. The first concerns the half-maximal inhibitory concentrations. For xanthine oxidase the value of 62.29 µg mL⁻¹ is consistent with the measured points, since inhibition is 47.03 % at 10 µg mL⁻¹ and 59.00 % at 50 µg mL⁻¹ and the threshold is therefore crossed within the tested interval. For collagenase it is not. Inhibition is already 56.12 % at the lowest concentration tested, which places the true half-maximal concentration below 10 µg mL⁻¹.
A value of 127.6 µg mL⁻¹ initially obtained for collagenase arose from a linear trendline fitted across the full 0–500 µg mL⁻¹ range with the origin included as a data point. Refitting the five measured points together with an assumed zero-concentration origin reproduces that figure closely, which confirms its provenance. The procedure is not appropriate to this response. A linear model cannot describe an inhibition curve that rises from zero to above half-maximal between 0 and 10 µg mL⁻¹ and then gains only 14.3 percentage points across the remaining fiftyfold range; forcing a straight line through that shape distributes the early rise across the whole abscissa and displaces the apparent half-maximal point far to the right. We therefore report the collagenase half-maximal concentration as less than 10 µg mL⁻¹, bounded by the lowest concentration tested, and do not carry the fitted value forward. Resolving it to a point estimate requires a concentration series below 10 µg mL⁻¹ fitted with a four-parameter logistic model on a logarithmic abscissa.
The flatness of the collagenase response deserves comment in its own right. A response that begins above 50 % at the lowest concentration tested and then rises slowly is the signature either of a saturating system assayed entirely above its dynamic range, or of a matrix effect — light scattering or intrinsic absorbance from the botanical particulates themselves — superimposed on genuine inhibition. Distinguishing the two requires a lower concentration series, from roughly 0.1 to 10 µg mL⁻¹, together with sample-only blanks run without enzyme. Until that is done the absolute magnitude of the collagenase result should be treated with reserve, although its concentration dependence is unambiguous.
The second constraint is the absence of reference inhibitors. No assay included a positive control: no epigallocatechin gallate or 1,10-phenanthroline for collagenase, no allopurinol for xanthine oxidase, no kojic acid or arbutin for tyrosinase, no ascorbic acid or Trolox for the radical-scavenging assay. Without them the results cannot be placed on a comparative scale, cannot be set against published values for other ingredients, and cannot confirm that each assay system was performing correctly on the day of testing. This is the single most consequential gap in the dataset and the first thing to remedy in confirmatory work.
4.4. Composition and Quality of the Finished Powder
The compositional data establish the identity of the test article and confirm that it is a low-energy preparation at the recommended intake: one 3 g sachet supplies approximately 10 kcal, of which sugars contribute 0.15 g. The dietary fibre content of 12.9 g per 100 g is consistent with the predominance of botanical extract by mass, and the potassium content of 384 mg per 100 g likewise reflects the pineapple fraction. The fat present is largely saturated, consistent with the virgin coconut oil powder and the lecithin introduced during encapsulation.
Two determinations from the same analysis, calcium and vitamin D, are not reported here. Neither bears on any endpoint examined in this study, and in both cases a single determination on one production sample was judged insufficient to characterise the finished powder. Confirmatory analyses are in progress: an acid-digestion determination for calcium, and a dedicated liquid-chromatography–tandem mass spectrometry method with an appropriate internal standard for cholecalciferol, which is the appropriate technique for quantifying vitamin D in a complex botanical matrix. Reporting either value on the present evidence would overstate what a single routine nutrition-labelling assay can support.
Microbiological quality and toxic element content were satisfactory with substantial margin. An aerobic plate count of 220 cfu g⁻¹ in a botanical-extract powder is low, and the absence of quantifiable Escherichia coli, coliforms, yeasts and moulds is consistent with the thermal history imposed by spray drying and with the low residual moisture of the finished powder. Arsenic, lead and mercury were each below quantification, which is the expected outcome for botanical material of controlled origin but is not automatic, since plant extracts concentrate whatever the source material accumulated. These determinations describe one production sample and do not substitute for routine batch release testing.
4.5. Limitations
The limitations of this study are substantial and we set them out in full. The work is entirely in vitro and provides no evidence of activity in vivo, of oral bioavailability or of clinical effect; inhibition of an isolated enzyme in a cuvette does not establish that the same enzyme is inhibited in tissue following ingestion, and the concentrations at which the dermal-domain assays were conducted — up to 10 mg mL⁻¹ — are far above anything plausibly attained in plasma or skin after a 3 g oral dose. The assays were conducted by contract laboratories on commissioned schedules rather than within a hypothesis-driven experimental design. Although all assays were performed in triplicate, dispersion measures were not retained for the milligram-range endpoints, which precludes inferential statistics for those assays. No reference inhibitors were included in any assay. Sample pH and ionic strength were not recorded alongside the electrophoretic determinations, and zeta potential is conditional on both, so the value describes the matrix only under the unstated conditions of measurement [20]. Size analysis was intensity-weighted, which biases the reported mean toward the largest scatterers present. No stability data are presented for the finished sachet under its actual storage conditions. Finally, the matrix is a thirteen-component blend and no attempt was made to attribute any observed activity to an individual constituent, nor to establish whether the components interact additively, synergistically or antagonistically; the results describe the matrix as a whole and nothing more.
In light of these limitations the appropriate status of the findings is hypothesis-generating. They justify a controlled confirmatory study; they do not support a product efficacy claim.
5. Conclusions
Lipo Crystal, a spray-dried sachet powder combining liposomal vitamin C with pineapple and white tomato extracts, was characterised in vitro as the reconstituted finished matrix. It inhibited xanthine oxidase and collagenase in a concentration-dependent manner from 10 to 500 µg mL⁻¹, reaching 76.47 % and 70.45 % respectively at the highest concentration tested, with collagenase already above half-maximal inhibition at the lowest concentration assayed, and inhibited tyrosinase, nitric-oxide generation and hyaluronidase to approximately 90 % at 10 mg mL⁻¹, with a radical-scavenging half-maximal concentration of 46.52 µg mL⁻¹. The finished powder is a low-energy, fibre-rich matrix that met microbiological limits and contained no quantifiable arsenic, lead or mercury.
The concurrence of xanthine oxidase inhibition with a conventional dermal-enzyme profile is the distinguishing finding and suggests a combined dermal and purine-metabolic positioning that is uncommon among oral skin-health preparations. Two methodological points are reported with equal emphasis because they bear on a broad class of commercial nutraceutical documentation and not only on this product. A mean zeta potential of −1.4 mV whose modal value is of opposite sign and whose relative standard deviation approaches 50 % is not resolved from zero; it indicates an absence of electrostatic stabilisation rather than the presence of colloidal stability, and points to steric stabilisation as the operative mechanism. And a half-maximal inhibitory concentration obtained by fitting a straight line across a saturating response, origin included, is an artefact of the fitting procedure rather than a property of the preparation.
Confirmatory work should prioritise, in order: inclusion of reference inhibitors in every bioassay; a lower concentration series for the collagenase assay with enzyme-free blanks; retention of replicate-level data and dispersion measures for all endpoints; polydispersity and time-resolved size measurement after reconstitution; and a real-time stability study of the finished sachet under International Council for Harmonisation climatic zone IVb conditions [23].
Author Contributions
Conceptualisation, N.K.P.; methodology, N.K.P., Y.Y.Y., S.P. and N.S.; validation, Y.Y.Y., S.B.N. and N.S.; formal analysis, N.K.P., S.P. and N.S.; investigation, S.P., S.B.N. and N.S.; resources, N.K.P. and Y.Y.Y.; data curation, Y.Y.Y. and S.P.; writing — original draft preparation, N.K.P.; writing — review and editing, N.K.P., Y.Y.Y., S.P., S.B.N. and N.S.; visualisation, N.K.P.; supervision, N.K.P., S.B.N. and N.S.; project administration, N.K.P.; funding acquisition, N.K.P. All authors have read and agreed to the published version of the manuscript.
Funding
This research was funded by Bionutricia Manufacturing Sdn. Bhd. and Bykare Sdn. Bhd., which commissioned and paid for all contract laboratory testing reported herein.
Institutional Review Board Statement
Not applicable. This study involved no human participants and no animal subjects.
Data Availability Statement
The data presented in this study are contained within the article. The underlying contract laboratory reports are held by Bionutricia Manufacturing Sdn. Bhd. and are available from the corresponding author on reasonable request, subject to the reproduction conditions imposed by the issuing laboratories. Quantitative formulation details are proprietary to the manufacturer and are not available.
Acknowledgments
The authors gratefully acknowledge the School of Pharmacy, Lincoln University College, Selangor, Malaysia, for providing the laboratory facilities, infrastructure and technical support required to carry out the in vitro experimental work presented in this study. The authors also thank Eurofins Food Testing Malaysia Sdn. Bhd. for the compositional, microbiological and toxic element analyses.
Conflicts of Interest
N.K.P. and Y.Y.Y. are affiliated with Bionutricia Manufacturing Sdn. Bhd. and Bykare Sdn. Bhd., which manufacture and market the test formulation and funded this study. The remaining authors declare no competing interest. The in vitro experimental work, data analysis and interpretation were carried out at the School of Pharmacy, Lincoln University College, Selangor, Malaysia. Eurofins Food Testing Malaysia Sdn. Bhd. was engaged on a fee-for-service basis and had no role in the interpretation of the data or in the decision to publish.
Abbreviations
The following abbreviations are used in this manuscript:
| Abbreviation | Full form |
| AOAC | Association of Official Analytical Chemists |
| cfu | Colony-forming unit |
| DPPH | 2,2-Diphenyl-1-picrylhydrazyl |
| FALGPA | N-[3-(2-Furyl)acryloyl]-Leu-Gly-Pro-Ala |
| FDA BAM | United States Food and Drug Administration Bacteriological Analytical Manual |
| FSSC | Food Safety System Certification |
| GMP | Good Manufacturing Practice |
| IC50 | Half-maximal inhibitory concentration |
| ICH | International Council for Harmonisation of Technical Requirements for Pharmaceuticals for Human Use |
| ICP-MS | Inductively coupled plasma mass spectrometry |
| ICP-OES | Inductively coupled plasma optical emission spectrometry |
| MPOB | Malaysian Palm Oil Board |
| MS ISO | Malaysian Standard adoption of an International Organization for Standardization method |
References
- Pittayapruek, P.; Meephansan, J.; Prapapan, O.; Komine, M.; Ohtsuki, M. Role of matrix metalloproteinases in photoaging and photocarcinogenesis. Int. J. Mol. Sci. 2016, 17, 868. [Google Scholar] [CrossRef] [PubMed]
- Girish, K.S.; Kemparaju, K. The magic glue hyaluronan and its eraser hyaluronidase: A biological overview. Life Sci. 2007, 80, 1921–1943. [Google Scholar] [CrossRef] [PubMed]
- Chang, T.-S. An updated review of tyrosinase inhibitors. Int. J. Mol. Sci. 2009, 10, 2440–2475. [Google Scholar] [CrossRef] [PubMed]
- Pullar, J.M.; Carr, A.C.; Vissers, M.C.M. The roles of vitamin C in skin health. Nutrients 2017, 9, 866. [Google Scholar] [CrossRef] [PubMed]
- Boyera, N.; Galey, I.; Bernard, B.A. Effect of vitamin C and its derivatives on collagen synthesis and cross-linking by normal human fibroblasts. Int. J. Cosmet. Sci. 1998, 20, 151–158. [Google Scholar] [CrossRef] [PubMed]
- Levine, M.; Conry-Cantilena, C.; Wang, Y.; Welch, R.W.; Washko, P.W.; Dhariwal, K.R.; Park, J.B.; Lazarev, A.; Graumlich, J.F.; King, J.; et al. Vitamin C pharmacokinetics in healthy volunteers: Evidence for a recommended dietary allowance. Proc. Natl. Acad. Sci. USA 1996, 93, 3704–3709. [Google Scholar] [CrossRef] [PubMed]
- Padayatty, S.J.; Sun, H.; Wang, Y.; Riordan, H.D.; Hewitt, S.M.; Katz, A.; Wesley, R.A.; Levine, M. Vitamin C pharmacokinetics: Implications for oral and intravenous use. Ann. Intern. Med. 2004, 140, 533–537. [Google Scholar] [CrossRef] [PubMed]
- Bangham, A.D.; Standish, M.M.; Watkins, J.C. Diffusion of univalent ions across the lamellae of swollen phospholipids. J. Mol. Biol. 1965, 13, 238–252. [Google Scholar] [CrossRef] [PubMed]
- Akbarzadeh, A.; Rezaei-Sadabady, R.; Davaran, S.; Joo, S.W.; Zarghami, N.; Hanifehpour, Y.; Samiei, M.; Kouhi, M.; Nejati-Koshki, K. Liposome: Classification, preparation, and applications. Nanoscale Res. Lett. 2013, 8, 102. [Google Scholar] [CrossRef] [PubMed]
- Davis, J.L.; Paris, H.L.; Beals, J.W.; Binns, S.E.; Giordano, G.R.; Scalzo, R.L.; Schweder, M.M.; Blair, E.; Bell, C. Liposomal-encapsulated ascorbic acid: Influence on vitamin C bioavailability and capacity to protect against ischemia–reperfusion injury. Nutr. Metab. Insights 2016, 9, 25–30. [Google Scholar] [CrossRef] [PubMed]
- Łukawski, M.; Dałek, P.; Borowik, T.; Foryś, A.; Langner, M.; Witkiewicz, W.; Przybyło, M. New oral liposomal vitamin C formulation: Properties and bioavailability. J. Liposome Res. 2020, 30, 227–234. [Google Scholar] [CrossRef] [PubMed]
- Maurer, H.R. Bromelain: Biochemistry, pharmacology and medical use. Cell. Mol. Life Sci. 2001, 58, 1234–1245. [Google Scholar] [CrossRef] [PubMed]
- Pavan, R.; Jain, S.; Shraddha; Kumar, A. Properties and therapeutic application of bromelain: A review. Biotechnol. Res. Int. 2012, 2012, 976203. [Google Scholar] [CrossRef] [PubMed]
- AOAC International. Official Method 999.10: Lead, Cadmium, Zinc, Copper and Iron in Foods — Atomic Absorption Spectrophotometry after Microwave Digestion; AOAC International: Gaithersburg, MD, USA, 2005. [Google Scholar]
- Van Wart, H.E.; Steinbrink, D.R. A continuous spectrophotometric assay for Clostridium histolyticum collagenase. Anal. Biochem. 1981, 113, 356–365. [Google Scholar] [CrossRef] [PubMed]
- Bergmeyer, H.U. (Ed.) Methods of Enzymatic Analysis, 3rd ed.; Verlag Chemie: Weinheim, Germany, 1983. [Google Scholar]
- Brand-Williams, W.; Cuvelier, M.E.; Berset, C. Use of a free radical method to evaluate antioxidant activity. LWT — Food Sci. Technol. 1995, 28, 25–30. [Google Scholar] [CrossRef]
- Clogston, J.D.; Patri, A.K. Zeta potential measurement. Methods Mol. Biol. 2011, 697, 63–70. [Google Scholar] [CrossRef] [PubMed]
- Bhattacharjee, S. DLS and zeta potential — What they are and what they are not? J. Control. Release 2016, 235, 337–351. [Google Scholar] [CrossRef] [PubMed]
- Danaei, M.; Dehghankhold, M.; Ataei, S.; Hasanzadeh Davarani, F.; Javanmard, R.; Dokhani, A.; Khorasani, S.; Mozafari, M.R. Impact of particle size and polydispersity index on the clinical applications of lipidic nanocarrier systems. Pharmaceutics 2018, 10, 57. [Google Scholar] [CrossRef] [PubMed]
- Pacher, P.; Nivorozhkin, A.; Szabó, C. Therapeutic effects of xanthine oxidase inhibitors: Renaissance half a century after the discovery of allopurinol. Pharmacol. Rev. 2006, 58, 87–114. [Google Scholar] [CrossRef] [PubMed]
- Richette, P.; Bardin, T. Gout. Lancet 2010, 375, 318–328. [Google Scholar] [CrossRef] [PubMed]
- International Council for Harmonisation of Technical Requirements for Pharmaceuticals for Human Use. ICH Harmonised Tripartite Guideline Q1A(R2): Stability Testing of New Drug Substances and Products; ICH: Geneva, Switzerland, 2003. [Google Scholar]
Figure 1.
Light scattering characterisation of the reconstituted Lipo Crystal matrix across three independent determinations. (A) Hydrodynamic diameter, with the mean of 392.7 nm marked. (B) Zeta potential, with the mean of −1.4 mV marked; diamonds show the modal value of each distribution, which is positive in all three determinations.
Figure 1.
Light scattering characterisation of the reconstituted Lipo Crystal matrix across three independent determinations. (A) Hydrodynamic diameter, with the mean of 392.7 nm marked. (B) Zeta potential, with the mean of −1.4 mV marked; diamonds show the modal value of each distribution, which is positive in all three determinations.
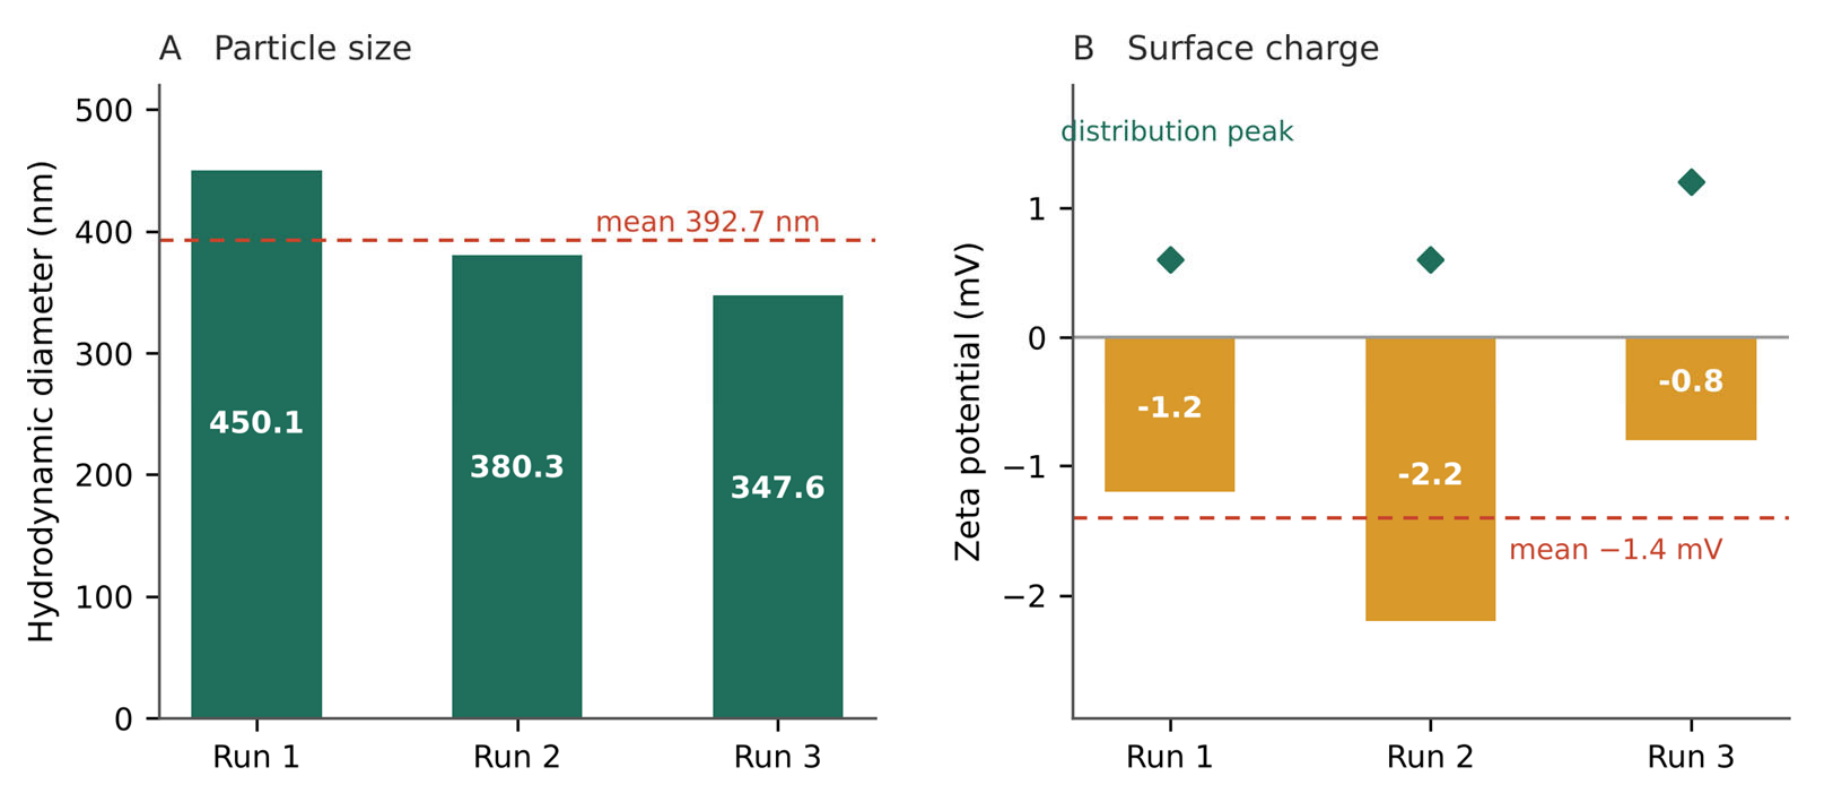
Figure 2.
Concentration-dependent inhibition of collagenase and xanthine oxidase by the reconstituted Lipo Crystal matrix across 10–500 µg mL⁻¹ (logarithmic abscissa). Error bars are standard deviations as supplied by the testing laboratory. The dashed line marks 50 % inhibition; the collagenase response exceeds this threshold at the lowest concentration tested.
Figure 2.
Concentration-dependent inhibition of collagenase and xanthine oxidase by the reconstituted Lipo Crystal matrix across 10–500 µg mL⁻¹ (logarithmic abscissa). Error bars are standard deviations as supplied by the testing laboratory. The dashed line marks 50 % inhibition; the collagenase response exceeds this threshold at the lowest concentration tested.
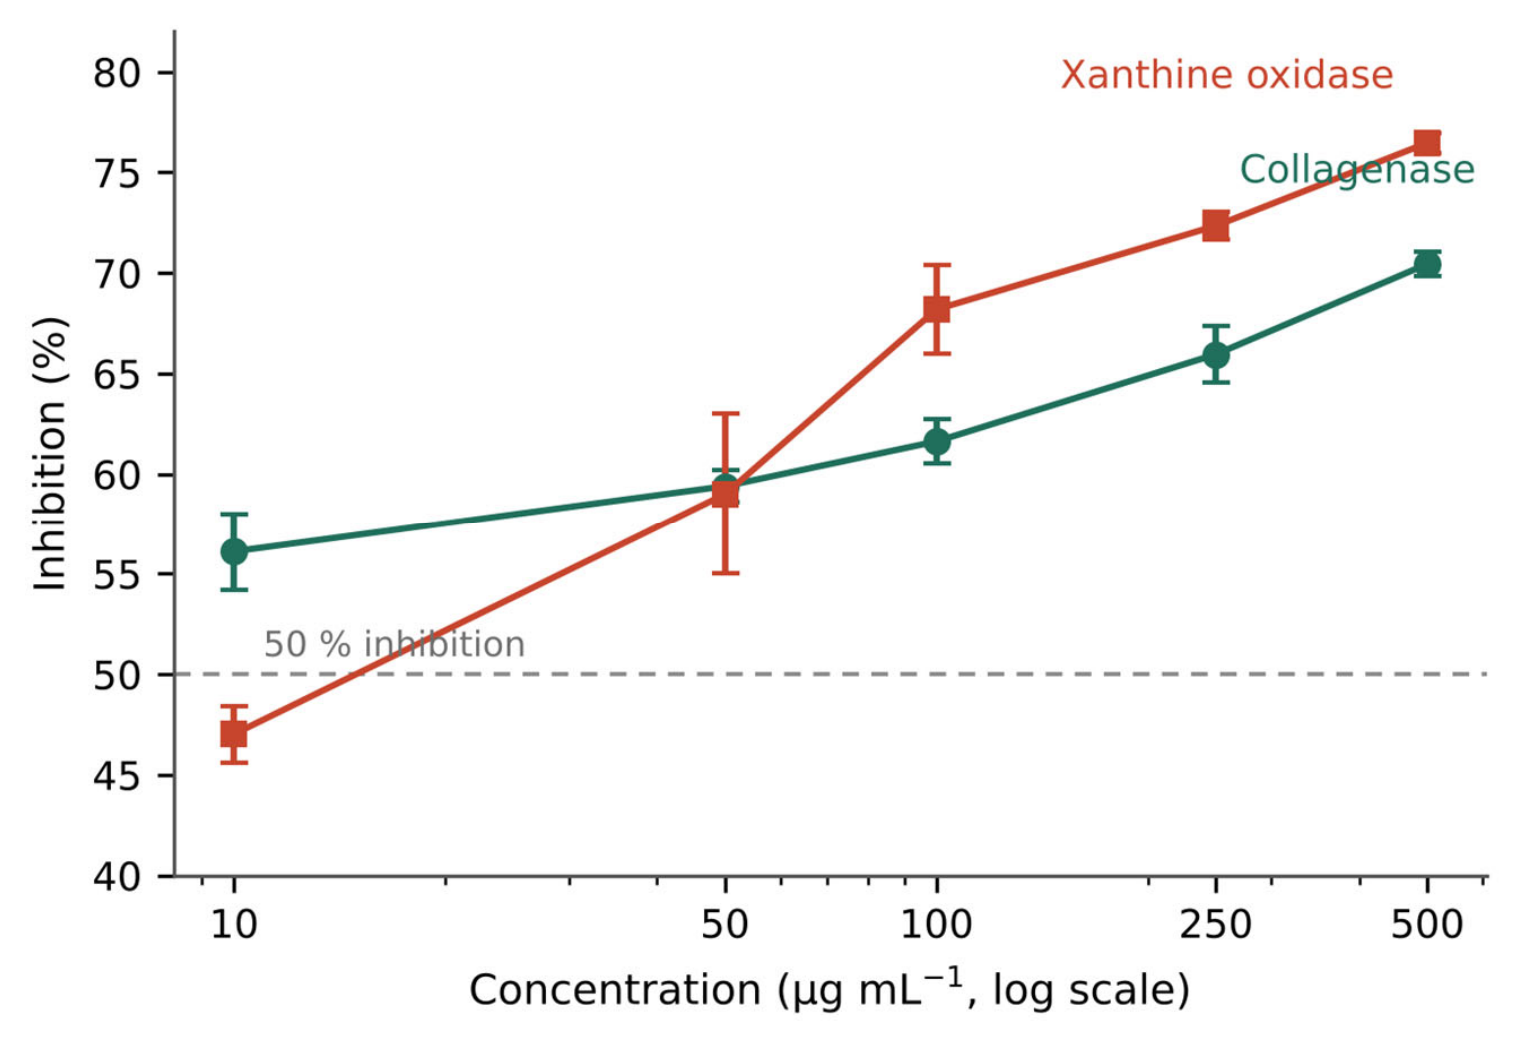
Figure 3.
Concentration-dependent inhibition of tyrosinase, hyaluronidase and nitric-oxide generation by the reconstituted Lipo Crystal matrix across 1–10 mg mL⁻¹. All three responses approach a plateau near 90 % and preserve their rank order across the tested range.
Figure 3.
Concentration-dependent inhibition of tyrosinase, hyaluronidase and nitric-oxide generation by the reconstituted Lipo Crystal matrix across 1–10 mg mL⁻¹. All three responses approach a plateau near 90 % and preserve their rank order across the tested range.
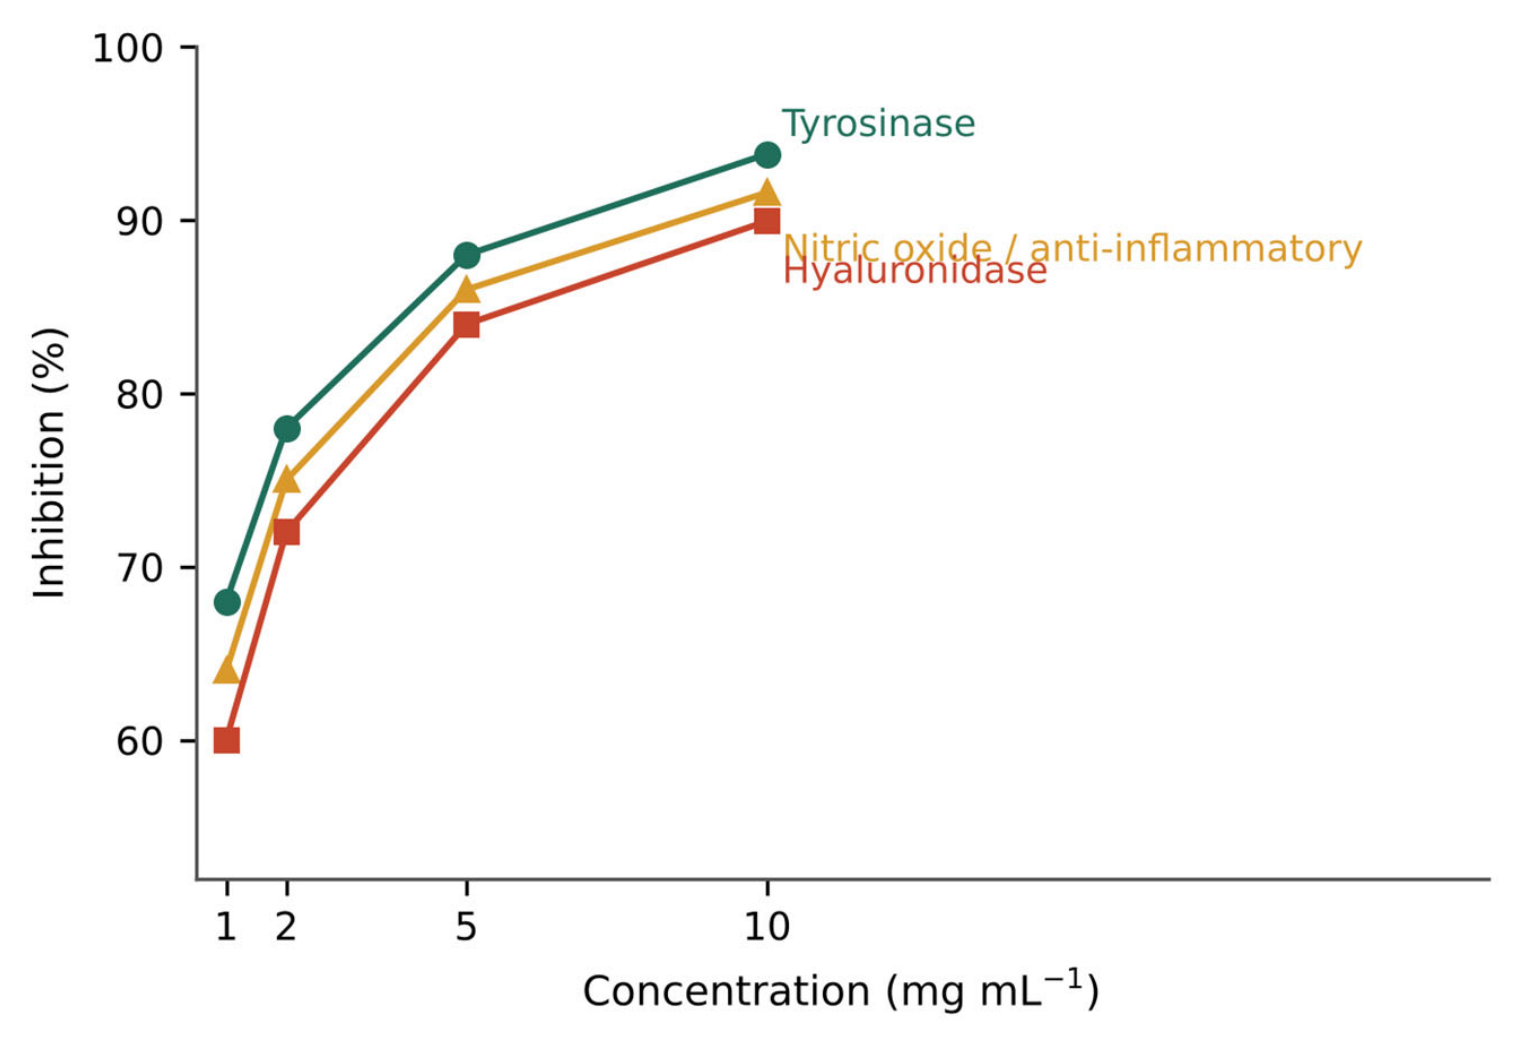
Figure 4.
Target map of the Lipo Crystal matrix. Collagenase, hyaluronidase and tyrosinase constitute the dermal matrix and pigment domain; xanthine oxidase belongs to purine metabolism; the 2,2-diphenyl-1-picrylhydrazyl and nitric-oxide assays report redox and mediator endpoints. Values shown are those measured at the highest concentration tested in each assay.
Figure 4.
Target map of the Lipo Crystal matrix. Collagenase, hyaluronidase and tyrosinase constitute the dermal matrix and pigment domain; xanthine oxidase belongs to purine metabolism; the 2,2-diphenyl-1-picrylhydrazyl and nitric-oxide assays report redox and mediator endpoints. Values shown are those measured at the highest concentration tested in each assay.
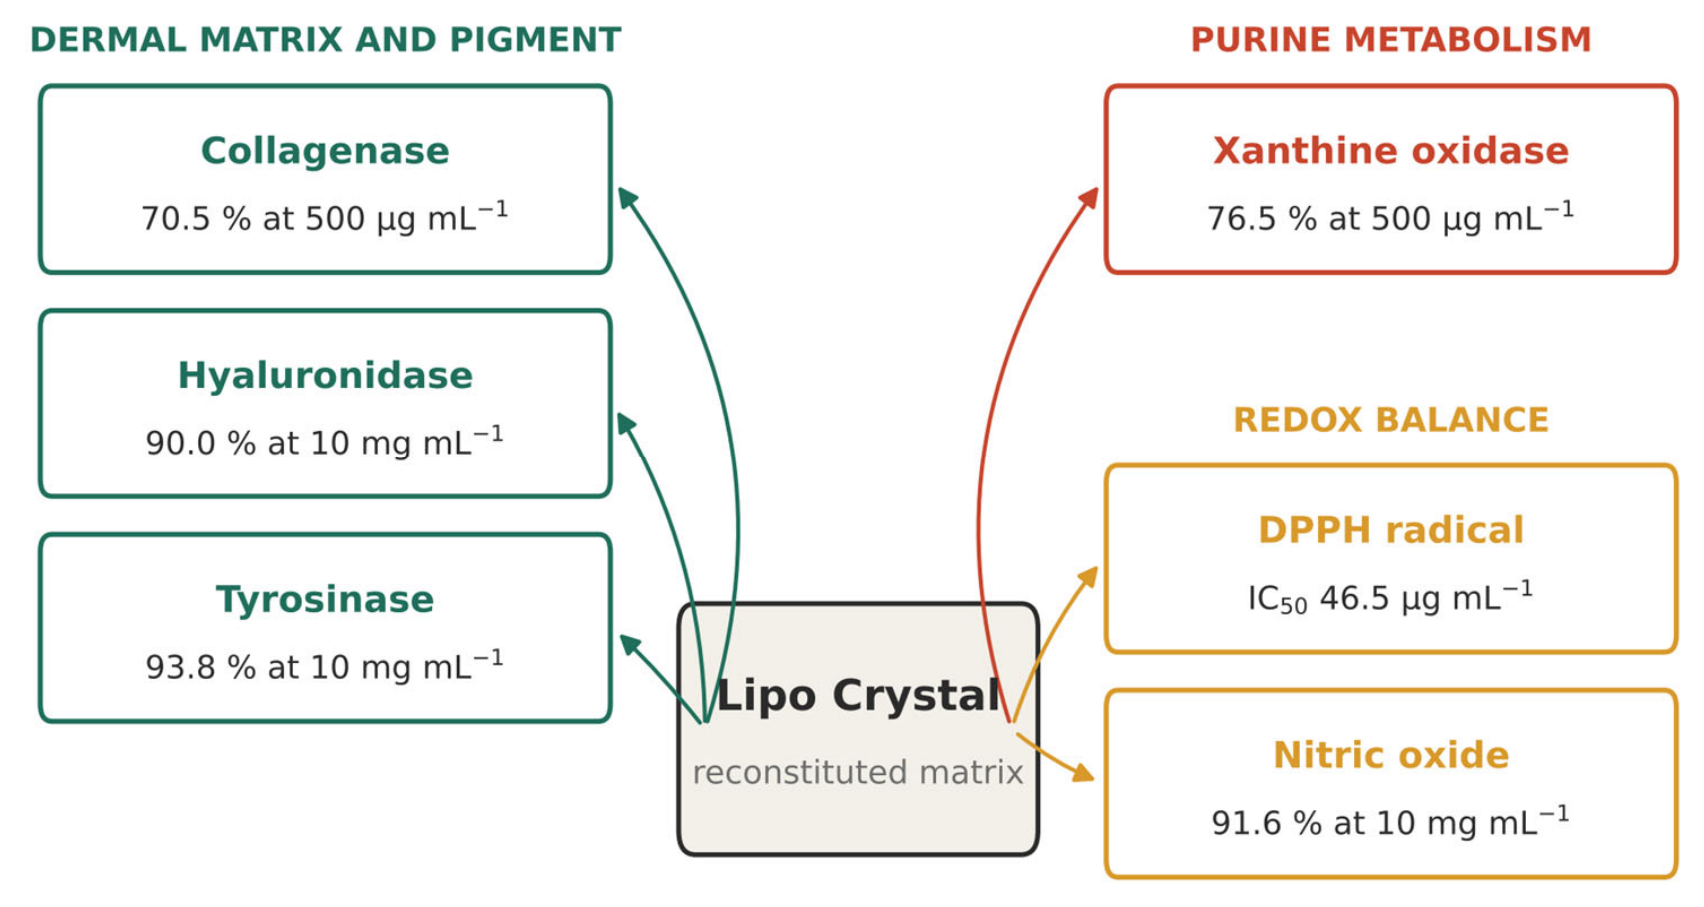

Table 1.
Qualitative composition of the Lipo Crystal matrix.
| Component | Role in the matrix |
| Pineapple (Ananas comosus) extract | Bromelain-bearing botanical fraction; principal component by mass |
| Liposomal vitamin C | Encapsulated ascorbic acid; principal active |
| White tomato (Solanum lycopersicum) extract | Carotenoid-depleted botanical fraction |
| Erythritol | Bulk sweetener |
| Virgin coconut oil powder | Lipid carrier |
| Enzyme premix | Mixed proteolytic blend |
| Tricalcium phosphate | Calcium source and anti-caking aid |
| Yeast beta-glucan | Polysaccharide |
| Silica | Flow agent |
| Tocotrienol complex | Vitamin E fraction |
| Sucralose | High-intensity sweetener |
| Zinc salt | Zinc source |
| Liposomal vitamin D3 | Encapsulated cholecalciferol premix |
Components are listed by function. Quantitative inclusion rates are proprietary and are not disclosed. Measured proximate composition of the finished powder is given in Table 2.
Table 2.
Measured composition of the finished Lipo Crystal powder (Eurofins report AR-25-MA-001343-01).
Table 2.
Measured composition of the finished Lipo Crystal powder (Eurofins report AR-25-MA-001343-01).
| Parameter | Per 100 g | Per 3 g serving | Method basis |
| Energy | 337 kcal | 10.11 kcal | Methods of Analysis for Nutrition Labeling, Ch. 1 |
| Total carbohydrate | 80.7 g | 2.4 g | Pearson's Composition and Analysis of Foods, Ch. 13 |
| Dietary fibre | 12.9 g | 0.39 g | Declared |
| Total sugar | 5.0 g | 0.15 g | AOAC 4.7.02 and 44.1.15 |
| Total fat | 1.3 g | 0.039 g | AOAC 32.1.14 |
| Saturated fat | 0.7 g | 0.021 g | MPOB P3.4 Part 1 and P3.5 |
| Monounsaturated fat | 0.4 g | 0.012 g | MPOB P3.4 Part 1 and P3.5 |
| Polyunsaturated fat | 0.2 g | 0.006 g | MPOB P3.4 Part 1 and P3.5 |
| Trans fat | 0 g | 0 g | MPOB P3.4 Part 1 and P3.5 |
| Cholesterol | 0 mg | 0 mg | AOAC 45.4.06 |
| Protein | 0.7 g | 0.021 g | MS 3:1982 |
| Potassium | 384 mg | 11.52 mg | MS ISO 6869:2005 |
| Sodium | 47.6 mg | 1.44 mg | MS ISO 6869:2005 |
| Iron | 1.3 mg | 0.04 mg | MS ISO 6869:2005 |
Per-serving values are derived from the per-100 g determinations at a 3 g serving size. Calcium and vitamin D were determined in the same analysis but are not reported here, pending confirmatory assays; neither bears on any of the endpoints examined in this study.
Table 3.
Microbiological quality and toxic element content of the finished Lipo Crystal powder (Eurofins reports AR-25-CZ-001531-01 and AR-25-SV-012272-01).
Table 3.
Microbiological quality and toxic element content of the finished Lipo Crystal powder (Eurofins reports AR-25-CZ-001531-01 and AR-25-SV-012272-01).
| Determination | Result | Limit of quantification | Method |
| Aerobic plate count, 35 °C / 48 h | 220 cfu g⁻¹ | 10 cfu g⁻¹ | FDA BAM Ch. 3 |
| Escherichia coli | Below quantification | 10 cfu g⁻¹ | FDA BAM Ch. 4 |
| Total coliforms | Below quantification | 10 cfu g⁻¹ | FDA BAM Ch. 4 |
| Yeasts and moulds, 25 °C / 5 d | Below quantification | 10 cfu g⁻¹ | FDA BAM Ch. 18 |
| Arsenic | Below quantification | 1 mg kg⁻¹ | AOAC 999.10, ICP-OES |
| Lead | Below quantification | 0.75 mg kg⁻¹ | AOAC 999.10, ICP-OES |
| Mercury | Below quantification | 0.02 mg kg⁻¹ | AOAC 999.10, ICP-MS |
Metals were determined following microwave acid digestion. ICP-OES, inductively coupled plasma optical emission spectrometry; ICP-MS, inductively coupled plasma mass spectrometry.
Table 4.
Dynamic and electrophoretic light scattering characterisation of the reconstituted Lipo Crystal matrix (n = 3).
Table 4.
Dynamic and electrophoretic light scattering characterisation of the reconstituted Lipo Crystal matrix (n = 3).
| Parameter | Mean ± standard deviation | Relative standard deviation | Individual determinations |
| Hydrodynamic diameter | 392.7 ± 52.36 nm | 13.33 % | 450.1 / 380.3 / 347.6 nm |
| Polydispersity index | 19.0 ± 6.3 % | 33.31 % | 26.0 / 17.2 / 13.7 % |
| Peak 1 (intensity-weighted) | 343.2 ± 39.55 nm | 11.52 % | 385.8 / 336.4 / 307.6 nm |
| Peak 2 (intensity-weighted) | 10 634 nm | — | Resolved in one of three determinations |
| Transmittance | 76.0 ± 2.0 % | 2.63 % | 77.6 / 76.7 / 73.8 % |
| Diffusion coefficient | 1.3 ± 0.2 µm² s⁻¹ | 12.84 % | 1.1 / 1.3 / 1.4 µm² s⁻¹ |
| Zeta potential | −1.4 ± 0.7 mV | 48.35 % | −1.2 / −2.2 / −0.8 mV |
| Distribution peak | +0.8 ± 0.3 mV | 39.41 % | +0.6 / +0.6 / +1.2 mV |
| Electrophoretic mobility | −0.1097 ± 0.0531 µm·cm V⁻¹ s⁻¹ | 48.35 % | −0.0966 / −0.1681 / −0.0645 |
| Conductivity | 0.038 ± 0.000 mS cm⁻¹ | 0.84 % | 0.038 / 0.038 / 0.038 mS cm⁻¹ |
Electrophoretic determinations were made at an adjusted voltage of 200 V over 100 to 120 processed runs each. The distribution peak is the modal value of the zeta potential distribution and is of opposite sign to the mean; see Section 4.1.
Table 5.
Collagenase and xanthine oxidase inhibition by the reconstituted Lipo Crystal matrix.
| Concentration (µg mL⁻¹) | Collagenase inhibition (%) | Xanthine oxidase inhibition (%) |
| 10 | 56.12 ± 1.90 | 47.03 ± 1.40 |
| 50 | 59.40 ± 0.80 | 59.00 ± 4.00 |
| 100 | 61.63 ± 1.10 | 68.19 ± 2.20 |
| 250 | 65.96 ± 1.40 | 72.35 ± 0.70 |
| 500 | 70.45 ± 0.60 | 76.47 ± 0.50 |
| IC50 (µg mL⁻¹) | < 10 (not bracketed by tested range) | 62.29 (95 % CI 52.40–74.05) |
Values are mean ± standard deviation of three independent determinations (n = 3). No reference inhibitor was included in either assay. The collagenase half-maximal concentration is given as an upper bound because inhibition exceeds 50 % at the lowest concentration tested; see Section 4.3.
Table 6.
Tyrosinase, hyaluronidase and nitric-oxide inhibition by the reconstituted Lipo Crystal matrix.
Table 6.
Tyrosinase, hyaluronidase and nitric-oxide inhibition by the reconstituted Lipo Crystal matrix.
| Concentration (mg mL⁻¹) | Tyrosinase (%) | Hyaluronidase (%) | Nitric oxide (%) |
| 1 | 68.00 | 60.00 | 64.00 |
| 2 | 78.00 | 72.00 | 75.00 |
| 5 | 88.00 | 84.00 | 86.00 |
| 10 | 93.82 | 89.95 | 91.60 |
Values are means of three independent determinations (n = 3); dispersion measures were not retained in the laboratory records for these endpoints, and no reference inhibitors were included.
Disclaimer/Publisher’s Note: The statements, opinions and data contained in all publications are solely those of the individual author(s) and contributor(s) and not of MDPI and/or the editor(s). MDPI and/or the editor(s) disclaim responsibility for any injury to people or property resulting from any ideas, methods, instructions or products referred to in the content. |
© 2026 by the authors. Licensee MDPI, Basel, Switzerland. This article is an open access article distributed under the terms and conditions of the Creative Commons Attribution (CC BY) license (http://creativecommons.org/licenses/by/4.0/).
Copyright: This open access article is published under a Creative Commons CC BY 4.0 license, which permit the free download, distribution, and reuse, provided that the author and preprint are cited in any reuse.