

Submitted:
27 October 2026
Posted:
28 October 2026
You are already at the latest version
Abstract
Objective: To develop a natural-language statistical-analysis agent that integrates a local large language model, specialized medical statistical tools, and output-checking stages, and to illustrate its functionality through representative software-interface displays.Materials and Methods: MedAnalysis Studio version 1.0.1 integrates a locally quantized Qwen2-family model, named EpiMind within the application, with structured tool calls, numerical traceability checks, and methodological auditing. The system provides Chinese and English interaction. Representative single-goal operations are illustrated by preserved screenshots of missingness reporting, correlation visualization, and event categorization.Results: The system comprises 93 configured tools in 12 modules. Illustrative software screenshots show a missingness-report panel, a correlation heatmap, and an event-status display within the natural-language workflow. These examples are presented as interface demonstrations rather than quantitative validation.Conclusions: The integrated workflow connects natural-language requests with explicit statistical operations, checking stages, and structured research outputs. Representative interface displays illustrate the organization of data-quality reporting, visualization, and outcome-category handling. Broader accuracy and clinical performance require separate evaluation.
Keywords:
medical statistics
; large language model
; AI agent
; local deployment
; functional demonstration
; bilingual interface
1. Introduction
Statistical analysis is embedded throughout medical research, from data collection and preparation to statistical-method selection, model fitting, visualization, and reporting [1]. Clinical and public-health datasets have heterogeneous structures: cross-sectional surveys, longitudinal follow-up data, and disease-surveillance series indexed at different temporal resolutions [2]. For investigators without programming experience, complex software workflows, variable-format conversion, and statistical assumptions can add practical barriers to routine analyses [3].
Distinct study designs require different data structures, analytical targets, and reporting standards [1,4]. Cross-sectional surveys require linkage of measurements by participant identifiers; follow-up studies require clear distinction between events and censoring; and surveillance studies require correctly ordered temporal observations [2,4]. Researchers frequently move between data-management programs, statistical packages, and plotting tools. Consequently, difficulties arise not only from statistical formulae, but also from coordination across the workflow [5].
The natural-language capabilities of large language models (LLMs) offer another interface for statistical software [3]. Tool-using agents can map investigators’ requests to executable analytical instructions, connecting research questions with statistical procedures [3,6]. However, medical statistical analyses require appropriate method selection, verifiable numerical output, and coherent interpretations [7,8]. Separating natural-language task planning from calculations executed by dedicated statistical tools is one possible way to reconcile convenient interaction with computational control [5,9].
Applications of medical LLMs have expanded from knowledge answering toward task execution [3]. Statistical tasks have specific requirements: an agent must recognize the analytical intention, study design, and variables expressed in Chinese or English, while also constraining numerical claims, methodological assumptions, and reporting language [7,10]. Tool-based workflows can exploit language models for task organization while preserving explicit calculations and an inspectable analysis trail [6,9].
Medical data processing may also be constrained by network availability, institutional data governance, and the equipment available in teaching settings [11,12]. Local deployment, programming-free interaction, and persistent structured output could therefore reduce operational barriers and help connect method selection with practical execution in medical statistics training [3,11].
To address these needs, we developed MedAnalysis Studio, a locally deployed medical statistical-analysis agent that integrates natural-language interaction, task planning, specialized tool calls, numerical traceability checks, and methodological auditing within one desktop interface. Representative interface screenshots illustrate missing-data reporting, correlation visualization, and event-category displays [2,4].
This study had three related objectives: (1) to describe the architecture integrating a local inference model, dedicated statistical tools, and two checking stages; (2) to illustrate the execution and presentation of single-goal software functions; and (3) to examine the workflow’s relevance to data preparation, research reporting, and medical statistics education. The focus was system development and representative functional presentation [7,13].
2. Methods
2.1. Architecture and Local Operation
MedAnalysis Studio is a desktop analytical system intended for clinical research, epidemiology, and medical statistics teaching. Its core workflow comprises data import, natural-language formulation of statistical objectives, agent-based planning and tool selection, checking of numerical and methodological consistency, and output generation [5,6]. The architecture has four interacting layers: a user-interface and data-management layer for file loading, sessions, and results; a local agent layer for interpreting and dispatching tasks; a statistical-tool layer for manipulation, testing, model fitting, and visualization; and a checking/output layer for tables, figures, summaries, and reports (Figure 1).
An Electron-based desktop interface is integrated with a Python statistical backend. After importing data, the left-hand workspace manages datasets and analytical sessions; the central area presents the natural-language question, analysis plan, and summary of tool calls; and the results area displays generated tables and graphics. Showing the request, execution process, and output together supports both individual task demonstrations and sequential analytical operations [7].
The design separates the semantic layer from the computation layer. The language model identifies the analytical objective, variables, and requested method, whereas explicit statistical functions perform the calculations [6,9]. Different statistical procedures therefore share a natural-language entry point while retaining distinct computational implementations for data handling, hypothesis testing, regression, and visualization.
MedAnalysis Studio runs as a Windows desktop application, supports CPU inference and optional GPU acceleration where the hardware permits, and manages research datasets, session information, and exported files locally. Model inference and data processing are performed on the host computer without requiring a remote LLM service for routine analyses [11,12].
The system accepts common structured-data formats, including CSV, TSV, Excel, SPSS, Stata, and SAS, and can manage several datasets within an analytical session. Tables, figures, and reports can be saved for subsequent research use. The CPU option broadens potential hardware compatibility; optional GPU inference does not change the statistical computation logic [5,11].
Software availability: MedAnalysis Studio v1.0.1 is publicly available as a portable Windows release at https://github.com/angli7328-cell/MedAnalysis-Studio/releases/latest. The Release page provides the application package and installation instructions. The link provides compiled software.
2.2. EpiMind Inference Engine and Statistical-Tool Integration
The underlying language model is a locally deployed Q4_K_M-quantized model from the Qwen2 family, with the deployment-file identifier qwen2-7.6b-q4_k_m. The model-dependent inference and task-dispatch component is named EpiMind within MedAnalysis Studio. EpiMind is the name of an integrated software component, not a separately pretrained foundation model. It parses dataset names, variables, analytical objectives, and methods, then passes structured parameters to dedicated statistical tools [3,6].
EpiMind first extracts the dataset, target variable, outcome type, group definition, requested statistical operation, and expected output and organizes them into an analysis plan [5,7]. When the input specifies relevant columns, event codes, and methods, these are converted to structured tool parameters. The tools return statistics, tables, or figures for subsequent interpretation [3,6]. For tasks requiring several operations, the workflow uses consecutive single-goal requests to keep each step explicit and reduce task complexity [7].
The software comprises 93 configured tools grouped into 12 modules: data management, data cleaning, descriptive statistics, hypothesis testing, regression, survival analysis, epidemiological methods, machine learning, time-series analysis, visualization, report generation, and privacy protection [3,9]. A common task interface supports outputs such as tables, PNG graphics, and editable Word reports. The configured tools and example single-goal prompts appear in Supplementary Table S1 [7].
Beyond descriptive and comparative analysis, the configured modules cover multivariable regression, repeated measures, Kaplan-Meier analysis, competing events, receiver operating characteristic (ROC) and calibration assessment, model comparison, time-series procedures, and specialized graphics [1,2,4]. The full list is provided as supplementary material rather than treated as evidence that every configured tool was validated. The main results describe only representative tasks with identifiable recorded output [7,13].
2.3. Two-Stage Checking and Bilingual Interaction
After statistical computation, the software applies two checking stages: numerical traceability checks and methodological auditing [7,9]. The former compares statistics described in natural-language conclusions with values returned by the statistical tool; the latter assesses consistency among variable types, model assumptions, and interpretation [1,7]. The plan, tool-call summary, check status, and results form an inspectable execution trail (Figure 2) [5].
Numerical traceability focuses on whether values reported in a narrative, including sample sizes, percentages, coefficients, and test statistics, have identifiable computational sources [7,9]. Methodological auditing instead examines whether a method is compatible with measurement scales and research design, and whether an interpretation exceeds the available evidence [1,8]. These stages address the distinct issues of computational provenance and interpretive appropriateness before research outputs are assembled [7].
Displaying the analysis plan and tool execution summaries allows users to check whether a selected method matches their original research objective [5,7]. When columns are absent, assumptions are not satisfied, or tool execution fails, the interface can present errors or audit feedback that invite a revised request. The intended interaction therefore makes statistical method selection visible rather than presenting only a free-form final answer [7].
Version 1.0.1 supports switching between a Chinese interface and an English-language interface. Chinese is the default. English mode supports key interface labels, statistical requests using English terminology, analysis plans, explanatory text, and an English report framework. Both language modes share the same computational tools and checking workflow; language switching affects interaction and reporting rather than statistical algorithms.
This bilingual design primarily changes interface text, task interpretation, analysis plans, and report structures, while maintaining a common statistical implementation [10]. English requests may use terms such as logistic regression, t-test, Kaplan-Meier, and ROC. Dataset column names are left untranslated in both modes, avoiding errors caused by inadvertent variable renaming [10].
In normal use of the current English-mode interface, some intermediate tool messages and statistical table labels may still appear in Chinese because localization is not yet uniform across all generated outputs. This mixed-language presentation does not, by itself, indicate a failure of the underlying analysis.
2.4. Software Functions and Illustrative Displays
This section describes configured software functions and representative interface illustrations rather than data-source validation. MedAnalysis Studio accepts structured tables, interprets single-goal natural-language requests, routes operations to statistical tools, and organizes tabular or graphical outputs. Table 1 summarizes the 12 configured modules and their tool counts; the full tool inventory appears in Supplementary Table S1.
Figure 3, Figure 4 and Figure 5 are preserved screenshots recorded during software operation. They are included solely to illustrate the on-screen workflow and output layout; values visible within the images are not treated as clinical findings, population estimates, independently verified benchmarks, or evidence of system-wide accuracy.
The illustrative functions concern missing-data summaries, correlation visualization, and the presentation of event-status categories. For survival-type tasks, correct use requires explicit definitions of censoring, the target event, and competing events [4].
Each illustrative request specified one principal statistical goal and identified the relevant dataset, variables, and requested operation [5,7]. The workflow makes the task plan, selected tool, parameters, and output visible [7]. When two steps were required, they were executed as distinct requests [5].
2.5. Illustrative Workflow and Assessment Scope
Each task was constrained to one main analytical goal, with explicit datasets, columns, and conditions, to improve correspondence between language interpretation and tool execution [5,7]. A data-join request specified the key and join type; an outlier request specified the variables and detection rule; and a competing-events request distinguished censoring, target events, and alternative outcomes [1,4]. Sequential operations were initiated only after the intermediate dataset or model output had been produced [5].
Four observable aspects were assessed: (1) clarity of task interpretation and planning; (2) agreement between requested inputs and tool selection/parameters; (3) generation of the expected dataset, statistical summary, or figure; and (4) availability of an explanatory narrative and reusable output [7,13]. Illustrative tasks were chosen for interpretable recorded execution traces across different statistical settings. Isolated screenshots were not used to estimate an overall success rate or numerical accuracy across all 93 tools [7,13].
3. Results
3.1. Natural-Language Data Management and Integration
The data-management interface presents dataset dimensions, field types, and available operations. Natural-language requests can specify horizontal joining by a shared key or row-wise concatenation of compatible tables, and the dedicated tools return structured outputs.
Left joins and row-wise concatenation address different data-integration needs. Joining enriches records from separate tables using a shared identifier, whereas concatenation extends rows across compatible tables. The resulting table dimensions can be displayed for user inspection, allowing review of the operation requested.
The newly created datasets remained available for subsequent tasks. Thus, natural-language requests produced structured intermediate data objects rather than only free-text responses, providing inputs for later descriptive statistics, regression models, or visualization.
3.2. Missingness and Outlier Screening
An illustrative missingness-report screen (Figure 3) shows how the software displays per-variable missing counts and proportions, a complete-record summary, and patterns of missing observations.
Missingness can be summarized at variable and record levels [14]. Variable-level reporting identifies affected fields, while a complete-record count indicates the number of rows without missing values across selected columns. These summary formats support initial data-quality review.
The configured interquartile-range (IQR) function supports screening of continuous variables using explicit thresholds. An operation can present screening limits, flagged observations, and explanatory text.
The IQR rule uses quartiles to define a range for potential outliers and can serve as an initial quality-control screen for continuous measures. A flagged value is not necessarily erroneous; it identifies an observation for further review, combining automated screening with subject-matter judgment.
3.3. Visualization of Correlations Among Clinical Measures
Figure 4 illustrates the correlation-heatmap screen following a natural-language request. The interface associates user-specified variables with visualization parameters and displays a plot alongside the analytical workflow.
A correlation heatmap uses a color gradient to display the direction and relative magnitude of pairwise correlations. The analysis plan and plot may be reviewed together within the application.
3.4. Handling Outcome Categories in Longitudinal Clinical Data
Figure 5 illustrates the way the software interface presents event-status categories in a survival-analysis workflow. A user can specify which codes represent the target event, a competing event, and censoring.
In survival research, death and other events may be competing endpoints. If one event changes the possibility of observing another event under a chosen outcome definition, treating it as ordinary censoring may affect the interpretation of event probabilities. An essential initial step is therefore to distinguish the target event, competing event, and censoring [4,17].
The demonstration illustrates an event-definition requirement that goes beyond identifying a time column and a status column: the user must also specify which status is the outcome of interest. The event-status screen can serve as a teaching example of how competing-risk categories are entered and presented.
3.5. Time-Series Tasks and Functional Summary
The time-series module is configured for operations involving ordered observations, temporal fields, and forecast horizons, including trend-related procedures and time-series modeling (Supplementary Table S1).
Unlike analyses of relationships among cross-sectional variables, time-series operations depend on temporal ordering, sampling frequency, and forecast horizon. A natural-language request may specify these elements for conversion into structured tool parameters.
3.6. Cross-Task Observations
Across the illustrative screens, the software shows formats for a missingness report, correlation visualization, and event-category display. These functions share a general sequence: state an explicit goal, generate a plan, invoke a statistical tool, and inspect or save the result.
The examples describe a common language-based front end for several statistical operations, with dedicated tools responsible for numerical computation.
4. Discussion
4.1. A Workflow-Centered Agent Design
A central design choice in MedAnalysis Studio is to embed the semantic capabilities of a general-purpose LLM within a medical statistical workflow rather than use generated text as the source of statistical calculations. EpiMind interprets requests and organizes parameters, dedicated statistical functions calculate results, and numerical and methodological checks connect the outputs to explanations. This division links the language interface to existing analytical methods while making selected execution details observable.
The practical value of a statistical agent depends not only on recognition of statistical terminology but also on consistent mapping among the research goal, variables, method, and output. For data linkage, a request to ‘merge by identifier’ must identify the key and joining rule. For missingness assessment, a general data-quality request must become variable-level counts and complete-record totals. Competing-events questions additionally require clear clinical meanings for outcome categories [17]. The statistical tool catalog supplies bounded operations, while the language model primarily plans and dispatches tasks.
Compared with conversational interfaces that only suggest methods or code fragments, this system combines data import, planning, statistical execution, visual output, and saving within one application. Figure 3, Figure 4 and Figure 5 illustrate the presentation of missingness, correlation, and event-category functions through the same interface.
Two checking stages provide an additional control point. Numerical traceability asks whether narrated statistics correspond to tool-returned values; methodological auditing asks whether a proposed method and interpretation fit the data and study design. Together with displayed plans and tool summaries, these features allow investigators to inspect key steps before saving output. In statistical education, juxtaposing the goal, tool, and result may help learners connect theoretical choices to practical operations.
4.2. Local Deployment and Bilingual Access
Clinical research analysis is influenced by local computing environments, institutional data-management procedures, and requirements for transmitting information. Integrating the model and statistics backend on the same computer permits selected analyses without sending raw data to a remote language-model service and is compatible with broader concerns about medical-data governance and transparency [11,12]. Separating language selection from tool execution allows Chinese and English workflows to share the same computational basis. This separation may also simplify future expansion of interfaces and report templates.
Local data management provides a defined boundary for processing. Files can be imported, analyzed, and exported on the host computer. Bilingual interaction extends the set of possible users: Chinese-speaking investigators may formulate familiar statistical questions, while English-speaking users can employ widely used English statistical terminology. Shared tools and checking rules avoid differences in calculation solely because the display language changes. These are architectural affordances; comparative usability benefits have not yet been quantified.
4.3. Implications for Medical Research and Education
Medical statistical workflows require identification of variables, selection of methods, consideration of assumptions, interpretation, and presentation of findings. Novice users may struggle to link these activities within a single analytical session. By displaying plans, tool names, and outputs together, MedAnalysis Studio may support exploratory work by clinical investigators and demonstrations in postgraduate medical statistics education. Supplementary Table S1 provides prompts across all 12 modules as an operational index; it does not certify the accuracy of all configured tools. Reporting self-checks can be informed by STROBE and TRIPOD+AI guidance where the corresponding study type is applicable [15,16].
Dividing a complex research task into a sequence of single-goal operations is also compatible with progressive instruction. A learner might inspect fields and clean the data, prepare a baseline table, perform a group comparison or regression, and finally assemble figures and a report. Each stage exposes both the statistical choice and the resulting output. Supplementary Table S1 contains example prompts that can be adapted to teaching exercises at different levels.
Analytical products saved from the results area may be assembled into editable reports, reducing the need to transfer tables and figures between applications. Reporting checklists such as STROBE and TRIPOD+AI may help users review design descriptions, variable definitions, and prediction-model items when relevant [15,16]. This workflow is intended to assist structured preparation and review of statistical materials, not to replace professional judgment about substantive medical questions.
Data integration, event coding, and temporal modeling impose different requirements on statistical tasks. The configured software modules are intended to accommodate such variation within a common agent workflow, whereas objective evaluation across task types remains a subject for future work.
4.4. Scope of Validation and Future Evaluation
This work addresses system development and representative software-operation screenshots. The figures are not a benchmark of tool-level correctness, numerical agreement, user performance, or clinical validity. Formal evaluation would require documented test inputs, independently reproduced outputs, prespecified performance measures, and appropriate methodological checks [1,18].
Future studies could use documented benchmark datasets or controlled simulated scenarios and independently reproduce selected results in established statistical packages such as R or Python under identical data and model specifications. Repeated tasks, English-language usability testing, and evaluation by users with varying statistical backgrounds would permit quantitative assessment of analytical correctness, reproducibility, and task efficiency. These proposed evaluations were not performed in the present work.
5. Conclusion
MedAnalysis Studio combines a local EpiMind inference component, 93 configured tools, numerical traceability checks, and methodological auditing within a natural-language medical statistical workflow. Figure 3, Figure 4 and Figure 5 illustrate the interface presentation of missing-data reports, correlation heatmaps, and event-status categories. A common task plan and observable execution trace connect user requests with structured analytical outputs. Chinese and English interaction modes broaden potential applications in research and medical statistics education. Broader numerical accuracy and usability evaluation remains a priority.
Supplementary Materials
The following supporting information can be downloaded at the website of this paper posted on Preprints.org.
Funding
This work was supported by the National Innovation Training Program for College Students (Grant No. 202610698222) and the Special Project for Undergraduate Experimental Practice and Innovation & Entrepreneurship Education and Teaching Reform of Xi’an Jiaotong University (Grant No. 26SJZX40).
Use of Generative AI in Manuscript Preparation
no.
Data and Software Availability
MedAnalysis Studio v1.0.1 Windows binaries and download instructions are publicly accessible at https://github.com/angli7328-cell/MedAnalysis-Studio/releases/latest. The configured tool inventory and example prompts are provided in Supplementary Table S1.
Study Declarations
Ethics Approval and Consent: This study describes software development and illustrative functional demonstrations. No human participants were recruited, and no identifiable human-participant data were used in the reported demonstrations. Ethical approval and informed consent were not required under the applicable institutional requirements.
Conflicts of Interest
All authors declare that the research was conducted in the absence of any commercial or fnancial relationships that could be construed as a potential confict of interest.The funders had no role in the design of the study; in the collection, analyses, or interpretation of data; in the writing of the manuscript; or in the decision to publish the results.
References
- EFTHIMIOU, O.; SEO, M.; CHALKOU, K.; et al. Developing clinical prediction models: a step-by-step guide. BMJ 2024, 386, e078276. [Google Scholar] [CrossRef]
- MA Y, BENMARHNIA T Interrupted Time Series Analysis in Environmental Epidemiology: A Review of Traditional and Novel Modeling Approaches. Curr. Environ. Health Rep. 2025, 12, 50. [CrossRef]
- BU, D.; SUN, J.; LI, K.; et al. Empowering AI data scientists using a multi-agent LLM framework with self-evolving capabilities for autonomous, tool-aware biomedical data analyses. Nat. Biomed. Eng. 2026, 2026. published online. [Google Scholar] [CrossRef]
- AUSTIN, P. C.; IBRAHIM, M.; PUTTER, H. Accounting for Competing Risks in Clinical Research. JAMA 2024, 331(24), 2125–2126. [Google Scholar] [CrossRef]
- WANG, Z.; DANEK, B.; YANG, Z.; et al. Making large language models reliable data science programming copilots for biomedical research. Nat. Biomed. Eng. 2026, 10(8), 1732–1746. [Google Scholar] [CrossRef]
- JIN, Q.; WANG, Z.; YANG, Y.; et al. AgentMD: Empowering language agents for risk prediction with large-scale clinical tool learning. Nat. Commun. 2025, 16, 9377. [Google Scholar] [CrossRef]
- WU, Y.; FU, D. J.; ZHOU, Y.; et al. Performance, Failures, and Oversight of a Large Language Model Agent for Clinical Data Analysis: Evaluation Study. J. Med. Internet Res. 2026, 28, e99597. [Google Scholar] [CrossRef]
- ZHOU, L.; SCHELLAERT, W.; MARTÍNEZ-PLUMED, F.; et al. Larger and more instructable language models become less reliable. Nature 2024, 634(8032), 61–68. [Google Scholar] [CrossRef]
- GOODELL, A. J.; CHU, S. N.; ROUHOLIMAN, D.; et al. Large language model agents can use tools to perform clinical calculations. npj Digit. Med. 2025, 8, 163. [Google Scholar] [CrossRef]
- QIU, P.; WU, C.; ZHANG, X.; et al. Towards building multilingual language model for medicine. Nat. Commun. 2024, 15, 8384. [Google Scholar] [CrossRef]
- WIEST, I. C.; FERBER, D.; ZHU, J.; et al. Privacy-preserving large language models for structured medical information retrieval. npj Digit. Med. 2024, 7, 257. [Google Scholar] [CrossRef]
- ZHANG, L.; WÖLFLEIN, G.; FERBER, D.; et al. On-premise medical AI agents for reliable clinical decision-making. Nat. Med. 2026, 32(10), 3705–3716. [Google Scholar] [CrossRef]
- LIU, Y.; CARRERO, Z. I.; JIANG, X.; et al. Benchmarking large language model-based agent systems for clinical decision tasks. npj Digit. Med. 2026, 9, 259. [Google Scholar] [CrossRef]
- LITTLE, R. Missing Data Analysis. Annu. Rev. Clin. Psychol. 2024, 20, 149–173. [Google Scholar] [CrossRef]
- VON ELM, E.; ALTMAN, D. G.; EGGER, M.; et al. The Strengthening the Reporting of Observational Studies in Epidemiology (STROBE) statement: guidelines for reporting observational studies. PLoS Med. 2007, 4(10), e296. [Google Scholar] [CrossRef]
- COLLINS, G. S.; MOONS, K. G. M.; DHIMAN, P.; et al. TRIPOD+AI statement: updated guidance for reporting clinical prediction models that use regression or machine learning methods. BMJ 2024, 385, e078378. [Google Scholar] [CrossRef]
- AUSTIN, P. C.; LEE, D. S.; FINE, J. P. Introduction to the analysis of survival data in the presence of competing risks. Circulation 2016, 133(6), 601–609. [Google Scholar] [CrossRef]
- WOLFF, R. F.; MOONS, K. G. M.; RILEY, R. D.; et al. PROBAST: A tool to assess the risk of bias and applicability of prediction model studies. Ann. Intern. Med. 2019, 170(1), 51–58. [Google Scholar] [CrossRef]
Figure 1.
Layered architecture of the locally deployed MedAnalysis Studio statistical agent.
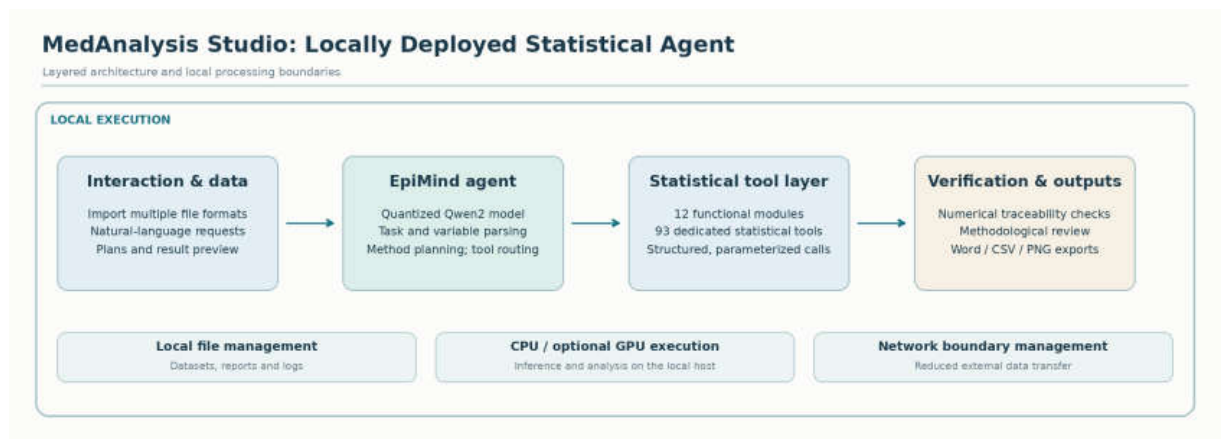
Figure 2.
Natural-language task orchestration, statistical execution and two-stage checking.
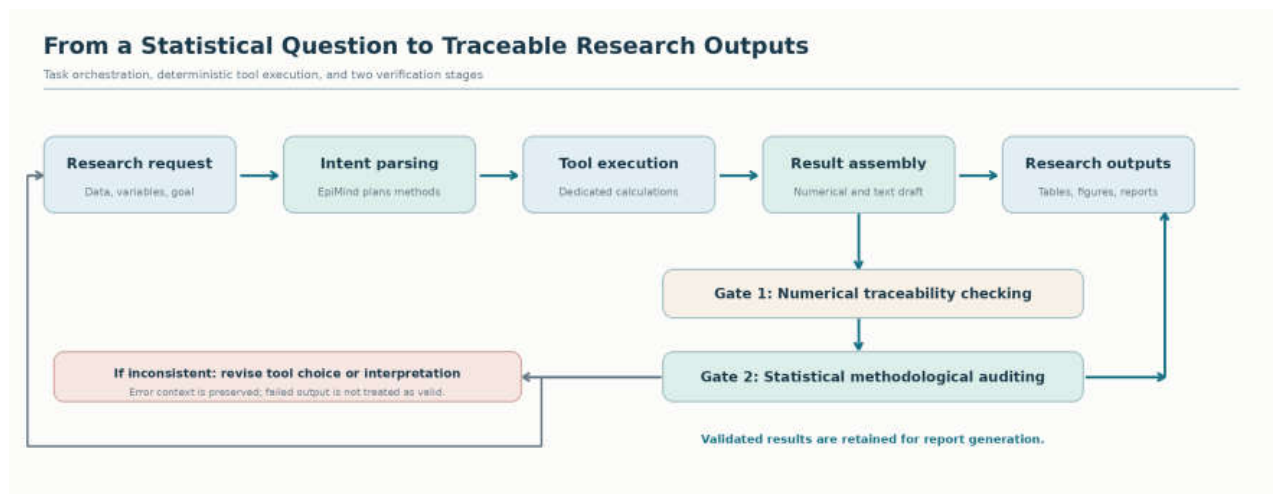
Figure 3.
Illustrative missingness-report interface (software functional display only).
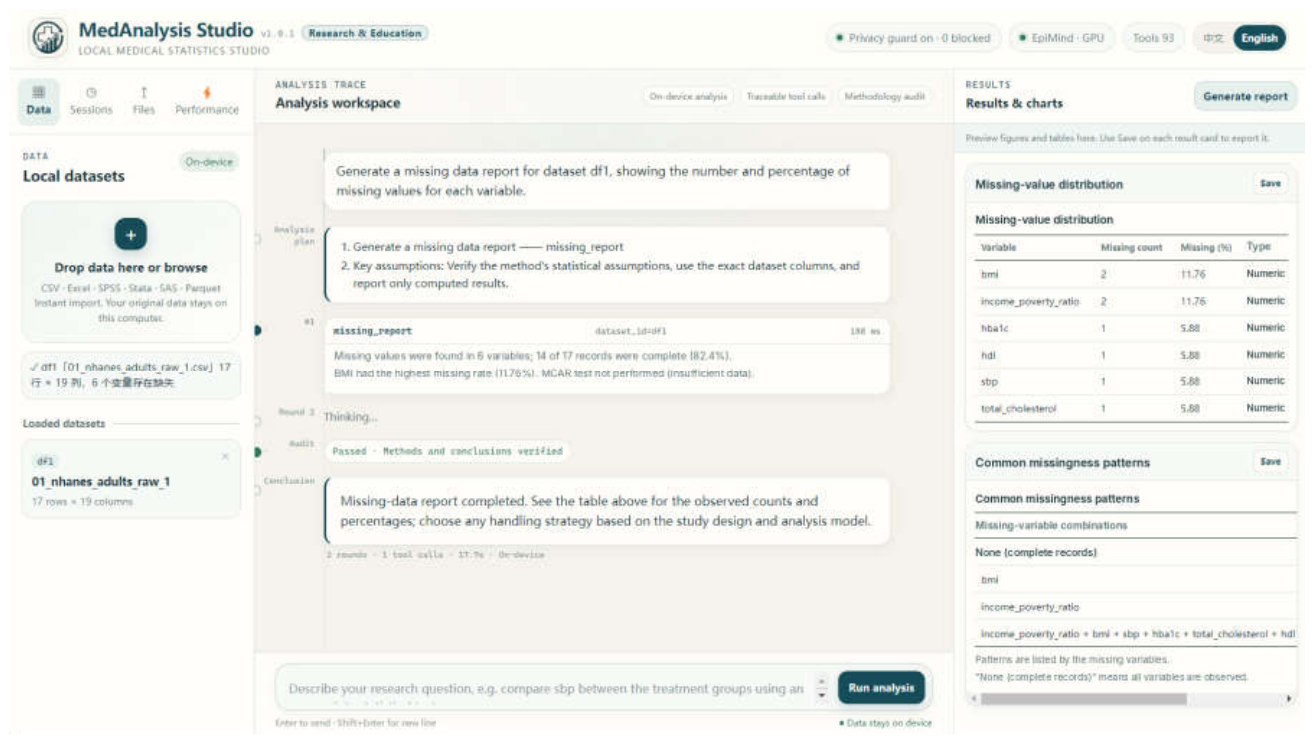
Figure 4.
Illustrative correlation-heatmap interface (software functional display only).
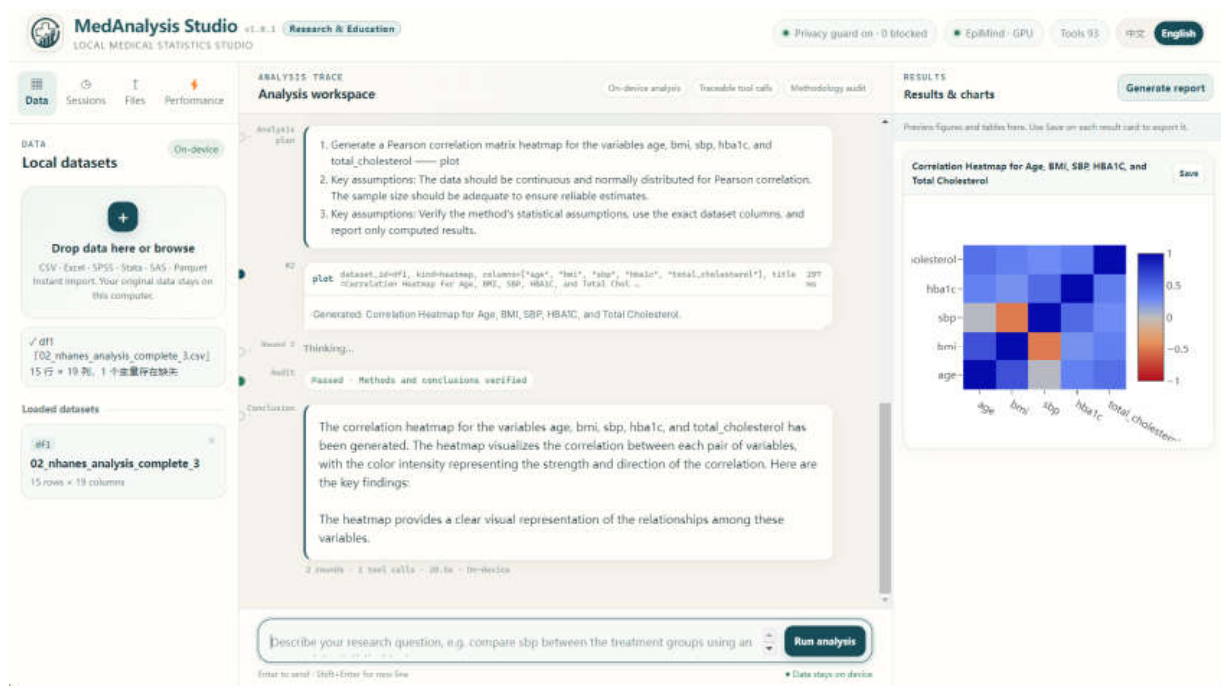
Figure 5.
Illustrative event-status classification interface (software functional display only).
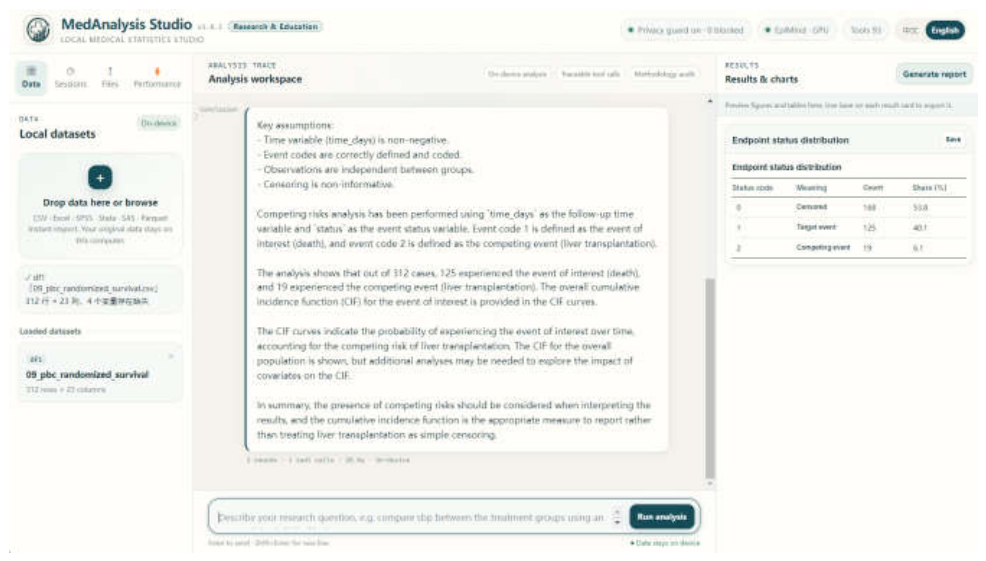

Table 1.
Configured statistical tools by module.
| Module | Tools configured | Examples of listed functions |
|---|---|---|
| Data management | 13 | Dataset inspection; joins; reshaping |
| Data cleaning | 12 | Missingness reports; outlier screening |
| Descriptive statistics | 7 | Summary statistics; baseline tables |
| Hypothesis testing | 8 | Group comparison; ANOVA; tests |
| Regression analysis | 12 | GLMs; mixed effects; model diagnostics |
| Survival analysis | 8 | Kaplan-Meier; competing-risk tools |
| Epidemiological analysis | 11 | Association measures; ROC; calibration |
| Machine learning | 5 | Classification; clustering; feature ranking |
| Time-series analysis | 2 | Series modeling; segmented trends |
| Scientific visualization | 9 | Statistical charts and research graphics |
| Report generation | 3 | Reports and reporting checklists |
| Privacy tools | 3 | Privacy-risk and disclosure-control functions |
| Total | 93 | Configured tools across 12 modules |
| Illustration | Displayed function | Scope of the figure |
|---|---|---|
| Figure 3 | Missingness-report interface | Output format and on-screen workflow only; not a data-quality research finding |
| Figure 4 | Correlation-heatmap interface | Plot presentation only; no clinical association is interpreted |
| Figure 5 | Event-status classification interface | Category-display format only; not an outcomes analysis or validation |
Disclaimer/Publisher’s Note: The statements, opinions and data contained in all publications are solely those of the individual author(s) and contributor(s) and not of MDPI and/or the editor(s). MDPI and/or the editor(s) disclaim responsibility for any injury to people or property resulting from any ideas, methods, instructions or products referred to in the content. |
© 2026 by the authors. Licensee MDPI, Basel, Switzerland. This article is an open access article distributed under the terms and conditions of the Creative Commons Attribution (CC BY) license (http://creativecommons.org/licenses/by/4.0/).
Copyright: This open access article is published under a Creative Commons CC BY 4.0 license, which permit the free download, distribution, and reuse, provided that the author and preprint are cited in any reuse.