

Submitted:
26 October 2026
Posted:
27 October 2026
You are already at the latest version
Abstract
Non-Saccharomyces yeasts are of growing interest as probiotic candidates, but strain-level charac-terization remains limited. We characterized Pichia kluyveri PK88™, isolated from coffee beans (NRRL deposit # 68561), using phenotypic assays, whole-genome sequencing, and in silico screen-ing. PK88™ was non-hemolytic and produced no detectable patulin, ochratoxin A, or aflatoxins. Genome analysis confirmed species identity (98.5–98.8% average nucleotide identity) and identi-fied no acquired antimicrobial-resistance genes, canonical virulence factors, or decarboxylases for harmful biogenic amines. By high-inoculum broth microdilution, MICs were low for echi-nocandins and amphotericin B and higher for fluconazole and posaconazole. Measured survival after acid, bile and anaerobic exposure was retained (93% at pH 2; 82–84% in bile), although sur-vival at pH 1 and under anaerobiosis was lower; hydrophobicity fell from 91% to 73–77% and auto-aggregation rose to 98–100%. PK88 supernatant inhibited Escherichia coli and Candida albi-cans in preliminary assays. In two independent experiments, Caco-2 cells exposed to PK88™ showed cytotoxicity ≤20% in every replicate up to 6 × 10⁴ organisms/well and variable increases at higher doses. These preliminary data support further evaluation.
Keywords:
Pichia kluyveri
; probiotic yeast
; non-Saccharomyces
; whole-genome sequencing
; antifungal suscep-tibility
; mycotoxins
; cell-surface hydrophobicity
; exopolysaccharide
; Caco-2
; cytotoxicity
1. Introduction
Probiotics are live microorganisms that confer a health benefit on the host when administered in adequate amounts. Most probiotics are dominated by bacterial genera such as Lactobacillus and Bifidobacterium, with Saccharomyces boulardii representing the principal yeast in clinical use. Yeast probiotics may offer distinct advantages, including intrinsic resistance to antibacterial antibiotics and robust survival through gastrointestinal transit. Interest has recently expanded toward non-Saccharomyces yeasts as a source of novel strains with probiotic and biotechnological potential [1].
Pichia kluyveri is a yeast widely used in food and beverage fermentation, notably in wine and coffee processing, where it contributes to aroma development [2,3]. Its long history of association with fermented foods makes it an attractive candidate for probiotic development. Through its documented history, P. kluyveri is not linked to food-associated pathogenicity. A rigorous, safety-first characterization is a prerequisite to any GRAS (Generally Recognized As Safe) evaluation.
For P. kluyveri, the pertinent precedent is strain DSM 33235, which received a no objection FDA GRAS determination (GRN 938) for use as a fermentation starter culture on the basis of its history of safe use and absence of toxin production [4].
Establishing a strain as a probiotic candidate conventionally requires evidence across two domains: (i) safety, including absence of hemolysis, absence of transferable virulence or toxin production, and a defined antimicrobial-susceptibility profile; and (ii) functional, probiotic-relevant properties, including tolerance to gastrointestinal stressors (acid, bile), adhesion-associated surface traits, and beneficial bioactivities [5].
In this study, we selected PK88™ as the lead candidate based on its natural occurrence in the human gut, on fruits and vegetables such as grapes, apples, cocoa beans, and coffee beans, and in commercially available starter cultures. Its safety-related and probiotic-relevant properties were subsequently evaluated using a panel of in vitro assays at 30 °C (optimal for yeast growth), with key functional assays repeated at 35 °C, whole-genome sequencing with in silico screening, and cytotoxicity testing in two cell models: murine CCL-1 fibroblasts exposed to cell-free supernatant and human Caco-2 intestinal epithelial cells exposed directly to PK88™ cells.
2. Results
2.1. Morphology and Surface β-Glucan
Calcofluor White staining of PK88TM revealed bright blue-white fluorescence outlining the cell walls, indicating intact chitin; cells were predominantly oval to round with clearly visible budding (Figure 1).
Flow cytometry of PK88TM cells stained with anti-β-glucan antibody (1:100) showed a distinct rightward shift in fluorescence relative to both isotype and secondary-only controls, which overlapped in the low-intensity region, confirming specific detection of surface β-glucan (Figure 2).
2.2. Safety Assessment
Hemolysis. PK88™ was non-hemolytic (γ-hemolysis) after 48 h at 30 °C, compared to a C. auris positive control that showed complete hemolysis, confirming assay performance (Figure 3).
2.3. Antifungal Susceptibility
The minimal inhibitory concentration (MIC) for PK88TM exposed to either fluconazole (≥ 64 µg/mL) or posaconazole (8 µg/mL) were higher than those for itraconazole (0.5 µg/mL), micafungin (0.03 µg/mL), anidulafungin (0.016 µg/mL), caspofungin (0.25 µg/mL), and amphotericin B (0.125 µg/mL). MIC for nystatin (4 µg/mL) would suggest that the levels normally achieved in oral use would effectively inhibit PK88™ growth (Table 1) [6]. P. kluyveri does not have formally established CLSI breakpoints, and a higher inoculum than specified in CLSI M27 was used. However, the European Committee on Antimicrobial Susceptibility Testing (EUCAST) has published guidance on interpretation of MICs for rare yeasts without breakpoints [6] showing Pichia kluyveri as resistant to fluconazole (in agreement with our data), and recommends MICs <0.1 for amphotericin B, as susceptible, and MICs < 0.06 for anidulafungin as susceptible, whereas values above should be reported as resistant in breakpoint tables. With no formal breakpoints, the endpoints in Table 1 are reported descriptively and were not classified as susceptible or resistant. The MIC for Nystatin can be interpreted per FDA guidance [7].
2.4. Mycotoxin Production
Culture supernatants contained no detectable mycotoxin activity for patulin, ochratoxin A, or total aflatoxins; absorbance values matched negative controls and fell below each assay’s limit of detection (data not shown).
2.5. Whole-Genome Confirmation of Identity
Hybrid long- and short-read sequencing produced a high-quality draft genome (~11.1 Mb; 86.2% complete BUSCOs; 0.2% duplicated, indicating minimal contamination). Average nucleotide identity to P. kluyveri reference genomes was 98.5–98.8%, and the strain resolved within a strongly supported monophyletic P. kluyveri clade (100% bootstrap support) in the whole-genome phylogeny, confirming the species assignment at genome-wide resolution (Supplementary Table S1–S2, Figure S1–S2).
2.6. In Silico Safety Screening
AMRFinderPlus identified no acquired antimicrobial-resistance genes. This tool is curated primarily for bacterial determinants, and resistance-associated mutations in azole or echinocandin target genes (e.g., ERG11, FKS1) were not analyzed; the genomic data therefore do not establish the basis or transferability of the elevated azole MICs described above. Only conserved housekeeping proteins (PP2A, LEU2, Rho1p) matched the Victors virulence database, and canonical Candida albicans virulence factors (HWP1/HWP2, ALS3, ECE1/candidalysin, secreted lipases) were absent. The strain encoded the complete housekeeping polyamine-biosynthesis pathway but lacked the histidine, tyrosine, and lysine decarboxylases required to generate the toxicologically relevant biogenic amines histamine, tyramine, and cadaverine. No mycotoxin biosynthetic gene clusters were detected, corroborating the negative mycotoxin immunoassays above. In the tiered allergenicity screen, eight predicted secreted proteins were flagged (four with predicted IgE epitopes); each was more similar to a conserved Pichia homolog than to the matched allergen (Table S5), although in silico screening cannot exclude allergenicity. Full results are provided in the Supplementary Materials (Table S3–S5).
2.7. Antimicrobial Activity of Cell-Free Supernatant
Growth of E. coli was completely inhibited by 50% (v/v) PK88™ cell-free supernatant. For C. albicans, inhibition (MIC50) was observed only at the 1:2 (50% v/v) dilution (Figure 4). However, supernatant pH was not neutralized and an uninoculated-medium control was not included, thus this inhibition may reflect acidification or nutrient depletion rather than specific antimicrobial compounds and is considered preliminary.
2.8. Functional and Probiotic-Relevant Properties
Functional assays were performed at 30 °C, and a subset (acid and gas production, acid, bile and oxygen tolerance, cell-surface hydrophobicity and auto-aggregation) was repeated at 35 °C, closer to body temperature. Both datasets are shown, and the values are compared in Table 2.
2.8.1. Acid and Gas Production
At 30 °C, all test organisms produced acid (medium color change) without gas (no Durham-tube bubbles), and the E. coli positive control produced both acid and gas. The same pattern was observed at 35 °C: after 24 h, the PK88™ and E. coli tubes showed a color change, and gas was observed only in the E. coli tube (Figure 5).
2.8.2. Acid, Bile, and Oxygen Tolerance
Survival was determined directly at pH 1 and pH 2, at 0.5%, 1% and 2% bile salts, and under aerobic and anaerobic conditions, at 30 °C and again at 35 °C (Figure 6; Table 2). At 30 °C, survival was 71.25% at pH 1 and 97.78% at pH 2; 98.48%, 98.91% and 67.40% at 0.5%, 1% and 2% bile salts; and 106.71% under aerobic and 84.24% under anaerobic conditions compared to the control. At 35 °C, survival was 61.42% at pH 1 and 93.05% at pH 2; 81.77%, 83.06% and 84.49% at 0.5%, 1% and 2% bile salts, respectively; and 97.9% under aerobic and 69.61% under anaerobic conditions. The qualitative tolerance pattern was retained at 35 °C, but survival at pH 1 and under anaerobic incubation was lower, and bile salts reduced survival to a similar extent at all three concentrations, whereas at 30 °C only 2% bile salts reduced survival markedly (Figure 6).
2.8.3. Cell-Surface Hydrophobicity
BATH adhesion was high for both hexane (90.88%) and chloroform (90.44%) (>90%), indicating high cell-surface hydrophobicity toward these two hydrocarbons (Figure 7a). This property is often used as a proxy for adhesion potential but does not itself demonstrate adhesion to epithelial cells, which was not tested. At 35 °C, hydrophobicity was lower (≈73% for hexane and ≈77% for chloroform), and the difference between the two solvents, not significant at 30 °C, was significant (p < 0.01; Figure 7d).
2.8.4. Auto-Aggregation
Auto-aggregation increased from 61.78% at 5 h to 89.11% at 24 h (Figure 7b) indicating time-dependent self-aggregation of PK88™ cells under static conditions. At 35 °C, auto-aggregation was already ≈98% at 5 h and ≈100% at 24 h (p < 0.0001; Figure 7e); these values are at or near the upper limit of the assay, so they may reflect saturation rather than a difference in aggregation kinetics.
2.8.5. Exopolysaccharide Production
EPS production increased significantly over time and reached 6 mg/mL at 48 h, indicating continued polysaccharide accumulation during extended culture (Figure 7c). EPS production was determined at 30 °C only.
2.9. Cell Viability in Murine Fibroblasts
Relative viability of murine CCL-1 fibroblasts exposed to PK88™ cell-free supernatant (Figure 8): The untreated control group demonstrated the highest baseline metabolic activity and was normalized to 100%; the XTT assay reflects mitochondrial dehydrogenase activity proportional to viable cell number. The mean cell viability following PK88™ cell-free supernatant treatment was 104.3 ± 17.1%. Because this assay uses a murine, non-intestinal cell line and cell-free supernatant, it does not model exposure of the intestinal epithelium to the organism; cytotoxicity was therefore also assessed in human Caco-2 cells (Figure 9).
2.10. Caco-2 Cytotoxicity
To assess cytotoxicity in a human intestinal epithelial model with direct exposure to the organism, Caco-2 cells were exposed to PK88™ cells at ten-fold increasing doses from 6 × 10² to 6 × 10⁹ organisms/well (in a 24-well plate, approximating a 108 CFU of Pichia to intestinal cells at 6 x 10² based on cm2) for 24 h, and cytotoxicity was measured by LDH release. The assay was performed twice as two independent experiments, which are reported separately (Figure 9; Table 3). In Experiment 1 (two batches), median cytotoxicity was 4.4%, 7.2% and 11.5% at 6 × 10², 6 × 10³ and 6 × 10⁴ organisms/well, and increased to 17.1%, 28.3% and 41.7% at 6 × 10⁵, 6 × 10⁶ and 6 × 10⁷ organisms/well; the two batches diverged from 6 × 10⁵ organisms/well onward (for example 10.5% and 46.2% at 6 × 10⁶ organisms/well), and the highest doses could not be evaluated because readings were saturated (a single value of 37.2% at 6 × 10⁸ organisms/well; none at 6 × 10⁹). In Experiment 2 (three replicates), cytotoxicity was at baseline at 6 × 10² to 6 × 10⁴ organisms/well (medians 0.8%, −4.5% and −0.1%), with medians of 12.4%, 15.1% and 23.2% at 6 × 10⁵ to 6 × 10⁷ organisms/well and 30.1% and 16.9% at 6 × 10⁸ and 6 × 10⁹ organisms/well, with variation between replicates at the highest doses (individual values 10.5% to 81.5%). The two experiments agreed that cytotoxicity was ≤20% in every replicate up to 6 × 10⁴ organisms/well (practical CFUs of 108-1010) and increased from 6 × 10⁵ organisms/well, but they differed in magnitude at intermediate doses, which were higher in Experiment 1, and neither showed a monotonic dose response at the highest doses. In Experiment 1, cytotoxicity with heat-killed PK88™ cells did not increase with dose from 6 × 10² to 6 × 10⁸ organisms/well (means of the two batches 11.7% to 22.2%) and was higher only at 6 × 10⁹ organisms/well (51.3%).
2.11. Extracellular Enzyme Activities
Extracellular enzyme activities were assessed at 35 °C by spot inoculation on solid media for 24 h. No zone of hemolysis was detected around PK88™ on egg-yolk agar (lipase; Figure 10a), and no clear zone of hemolysis was detected on skim-milk agar (protease; Figure 10c, two plate replicates). No urease activity was detected on urea agar with phenol red indicator (Figure 10b).
3. Discussion
The continued expansion of the probiotic field beyond traditional bacterial taxa and Saccharomyces boulardii has increased interest in non-Saccharomyces yeasts as potential next-generation probiotics [1]. Realizing this potential depends on demonstrating strain-level safety alongside the functional traits expected of a probiotic. Although Pichia kluyveri has a long history of use in food and beverage fermentation with no established association with foodborne disease, it has not been widely evaluated as a probiotic organism. This study combined phenotypic assays, whole-genome sequencing with in silico screening, and cytotoxicity testing in two cell models to characterize PK88™. Within the limits of these assays, PK88™ was non-hemolytic at 30 °C, produced no detectable mycotoxins by ELISA, carried no acquired antimicrobial-resistance genes or canonical virulence factors among the genes and tools screened, showed low MICs for echinocandins and amphotericin B and higher MICs for fluconazole and posaconazole under a high-inoculum method, and was not cytotoxic to murine CCL-1 fibroblasts exposed to cell-free supernatant. It also tolerated the acid, bile and oxygen conditions tested, showed high cell-surface hydrophobicity and auto-aggregation and produced exopolysaccharide, and its cell-free supernatant showed preliminary antimicrobial activity. These findings are consistent with, but do not by themselves establish, a favorable safety profile or probiotic function; the principal limitations are discussed below.
Historical safety data for the species and the in vitro results presented here are complementary but not equivalent lines of evidence. The absence of hemolysis, the absence of detectable mycotoxins (patulin, ochratoxin A, and total aflatoxins), and the absence of cytotoxicity toward CCL-1 cells are consistent with a favorable safety interpretation, with the caveats that mycotoxins were measured by ELISA in duplicate and that the CCL-1 assay used cell-free supernatant. P. kluyveri has no established clinical breakpoints and therefore the antifungal-susceptibility data should be interpreted with caution. Higher MICs were observed for fluconazole and posaconazole than for the echinocandins and amphotericin B, but the data do not allow us to conclude whether this reflects an intrinsic species-level property, a mutation-based mechanism, or a transferable determinant. The low echinocandin and amphotericin B MICs are of interest because they point to potential therapeutic options should invasive infection occur in a vulnerable host, but confirmation with the CLSI-specified inoculum is needed, although by the EUCAST definition [6] susceptibility towards anidulafungin is noted.
Cytotoxicity testing with murine CCL-1 fibroblasts and cell-free supernatant has clear limitations as a safety readout: the cells are neither human nor of intestinal origin, and cell-free supernatant does not represent exposure to the organism itself. To address these limitations, we additionally exposed human Caco-2 intestinal epithelial cells to PK88™ cells over a seven-log dose range (6 × 10² to 6 × 10⁹ organisms/well) in two independent experiments. Both experiments showed cytotoxicity ≤20% in every replicate up to 6 × 10⁴ organisms/well and an increase from 6 × 10⁵ organisms/well, but they differed in magnitude at intermediate doses (median at 6 × 10⁶ organisms/well 28.3% in Experiment 1 and 15.1% in Experiment 2). In Experiment 1, a heat-killed arm showed no dose trend up to 6 × 10⁸ organisms/well, which suggests that the rise in LDH release at higher doses depends on viable yeast and may reflect yeast growth, nutrient depletion or medium acidification at high densities rather than direct epithelial toxicity, although this was not tested directly. Using a ≤20% cytotoxicity threshold, 6 × 10⁴ organisms/well was the highest dose at which every replicate in both experiments passed.
Whole-genome sequencing addresses the gap between expressed phenotype and genetic potential directly. Assembly of a high-quality genome placed the strain unambiguously within P. kluyveri both by average nucleotide identity to reference genomes (98.5–98.8%, well above the 95% species threshold), and by a whole-genome phylogeny in which it fell within a strongly supported (100% bootstrap) monophyletic P. kluyveri clade. Therefore, the safety inferences drawn here map to a defined taxonomic unit rather than a presumptive identification. The screen for hazard-associated genes was consistent with the phenotypic findings. No acquired antimicrobial-resistance genes were detected by AMRFinderPlus. However, acquired resistance determinants and the tools used to screen for them are best characterized in bacteria [8], and we did not analyze resistance-associated mutations in azole or echinocandin target genes; the genomic data therefore cannot establish the mechanism or transferability of the elevated azole MICs. Targeted analysis of genes such as ERG11 and FKS1, together with susceptibility testing by a standard reference method, would address this.
No bona fide virulence determinants were identified: the only matches to the Victors virulence database were conserved housekeeping proteins, and canonical Candida albicans factors that mediate invasion and tissue damage (hyphal adhesins, candidalysin, secreted lipases) were absent. The genome encoded no mycotoxin biosynthetic gene clusters, in agreement with the negative mycotoxin immunoassays [9], and lacked the amino-acid decarboxylases required to generate the toxicologically relevant biogenic amines histamine, tyramine, and cadaverine. Only the housekeeping polyamine pathway, which can support spermidine synthesis, was retained. In the tiered in silico allergenicity assessment, the flagged proteins were consistently more similar to a conserved Pichia ortholog than to the matched allergen, which argues against a credible allergenicity risk, although in silico prediction cannot exclude allergenicity. Collectively, these genomic findings are consistent with the phenotypic data but do not replace further experimental safety evaluation.
On the functional side, PK88™ survived the acid, bile and oxygen conditions tested at both 30 °C and 35 °C; however, these were single, discrete exposures in the absence of digestive enzymes or a food matrix, and survival was measured directly only at the conditions shown, so they indicate tolerance rather than simulate gastrointestinal transit. Repeating the assays at 35 °C, closer to body temperature, preserved this qualitative pattern but changed its magnitude: survival at pH 1 and under anaerobic conditions was lower, and bile salts reduced survival to a similar extent at all three concentrations. Surface properties were more strongly temperature-dependent: cell-surface hydrophobicity was lower at 35 °C (≈73–77% versus >90% at 30 °C), and auto-aggregation was faster and higher (≈98% at 5 h versus 61.8% at 30 °C). Both are indirect, proxy indicators of adhesion potential; they do not demonstrate adhesion to epithelial cells or mucosal persistence, neither of which was assessed here. Exopolysaccharide production (6 mg/mL at 48 h at 30 °C), measured as total carbohydrate by the phenol–sulfuric acid method, has been linked to adhesion and stress protection in other organisms, but its composition and function in PK88™ were not characterized. Cell-free supernatant inhibited E. coli and C. albicans in a preliminary assay; because pH-neutralized and uninoculated-medium controls were not included, we cannot attribute this activity to specific antimicrobial compounds rather than to acidification or nutrient depletion, and we do not infer a pathogen-exclusion function. At 35 °C, PK88™ showed no extracellular lipase, urease or protease activity.
These observations can be placed in the context of prior characterizations of the species and, more broadly, the probiotic literature. Higher azole MICs combined with low echinocandin MICs are in line with susceptibility patterns reported for P. kluyveri and related yeasts [10,11,12,13,14], which suggests, but does not demonstrate, a species-level characteristic rather than a strain-specific acquisition. Rare cases of invasive P. kluyveri infection, including fungemia, have been reported [11], which underscores the relevance of antifungal susceptibility data and of strain-level safety evaluation. The surface-trait findings (hydrophobicity and auto-aggregation), established largely in probiotic bacteria, have been correlated with adhesion in lactobacilli and bifidobacteria [15,16,17], although these are indirect measures of adhesion, and are increasingly incorporated into yeast probiotic assessment frameworks [18]. Likewise, the functional value attributed to exopolysaccharide (EPS) production is grounded in work linking EPS layers to mucin adhesion, stress resistance, and immune modulation [19,20,21].
This study contributes to the evidence base for probiotic yeasts beyond S. boulardii by providing a preliminary, strain-level characterization that combines phenotypic, genomic and cell-based data. Surface β-glucan exposure, exopolysaccharide production, and the preliminary antimicrobial activity of the supernatant are observations that may merit investigation of adhesion- and immunomodulation-related mechanisms, but they are hypothesis-generating and were not tested here.
This study has several limitations. First, most assays used n=3, and therefore, estimates of variability are imprecise and statistical results should be considered preliminary. Second, only one strain was studied, the phenotypic and functional assays were performed at 30 °C, however a subset was repeated at 35 °C but hemolysis, mycotoxin, antimicrobial and EPS assays were not repeated at 35 °C, and all findings are in vitro. Third, the antifungal susceptibility assay used a higher inoculum than the CLSI reference method, and no breakpoints exist for the species, although EUCAST does make some recommendations for interpretation [6]. Fourth, gastrointestinal tolerance was assessed at a small number of discrete conditions without simulated digestive fluids, and the antimicrobial activity assay lacked pH-neutralized and uninoculated-medium controls. Fifth, hydrophobicity and auto-aggregation are indirect indicators, and adhesion to epithelial cells was not measured; Caco-2 cells were used here only for cytotoxicity.
4. Materials and Methods
4.1. Primary Growth Screening and Media Optimization
Strains were initially cultured on Potato Dextrose Agar (PDA) at 30 °C under aerobic conditions. For growth-promotion assessment, selected strains were inoculated into Sabouraud Dextrose Broth (SDB), RPMI 1640, and Potato Dextrose Broth (PDB) in 96-well flat-bottom microtiter plates to an initial OD600 ≈ 0.1 and incubated at 30 °C aerobically. OD600 was recorded at intervals (1, 2, 4, 6, 8, 16, and 24 h) against an uninoculated medium blank, and growth curves were plotted.
4.2. Microscopy
Selected strains were grown as planktonic cultures in PDB at 30 °C for 48 h. A thin smear was prepared, stained with 1–2 drops of Calcofluor White for 1–5 min at room temperature, air-dried, and examined by fluorescence microscopy at 100× using the DAPI channel.
4.3. Flow Cytometric Analysis of β-Glucan
Log-phase cells (1 × 10⁶ per sample) were pelleted and washed twice in phosphate buffered saline (PBS). Primary staining used rabbit antifungal β-glucan antibody (2.7 mg/mL) at 1:100 in PBS, with a rabbit IgG isotype control and secondary-only controls (1:100). After 30 min at room temperature with gentle agitation (protected from light) and two PBS washes, cells were stained with goat anti-rabbit IgG H&L Alexa Fluor 488 (Ab150077, Abcam, Waltham, MA) at 1:2,000 for 30 min in the dark, washed twice, and resuspended in 300 µL. Acquisition used a BD FACSAria-SORP; Alexa 488/FITC fluorescence (~525/30 nm) was detected with the 488 nm laser, collecting ≥10,000 events per sample with forward/side-scatter gating to exclude debris and aggregates.
4.4. Hemolytic Activity
4.5. Antifungal Susceptibility Testing
Susceptibility was determined by broth microdilution against eight antifungal agents: posaconazole, itraconazole, fluconazole, amphotericin B, micafungin, anidulafungin, caspofungin and nystatin. Two-fold serial dilutions were prepared in 96-well plates; inoculum was adjusted to 1 × 10⁶ cells/mL, which is higher than the final inoculum specified in CLSI M27 (0.5–2.5 × 10³ cells/mL) and may yield higher MICs than the reference method. Growth, sterility, and Candida parapsilosis (ATCC 22019) quality-control wells were included. Plates were read after 24–72 h at 35 °C. For amphotericin B the MIC endpoint was the lowest concentration giving an optically clear well (complete inhibition); for azoles and echinocandins the endpoint MIC was the lowest concentration producing ~50% inhibition versus growth control. P. kluyveri does not have formally established CLSI breakpoints; MICs are therefore reported descriptively, without susceptible or resistant categories.
4.6. Mycotoxin Production
Culture supernatants were analyzed for the mycotoxins patulin, ochratoxin A, and total aflatoxins using commercial ELISA kits per the manufacturer’s instructions: Patulin (Abraxis, Cat. 500106), Ochratoxin A (AFG Bioscience, Cat. EK715711), and Total Aflatoxins (Abcam, Cat. ab285282). Standards, controls, and samples were assayed in duplicate; absorbance was read at the kit-specified wavelength, and concentrations were interpolated from per-plate standard curves and expressed in parts per billion (ppb).
4.7. Antimicrobial Activity of Cell-Free Supernatant
Antimicrobial activity of cell-free PK88™ supernatants (CFS) was evaluated by a modified CLSI microbroth dilution method (M27-ED4). Strains were grown in PDB aerobically at 30 °C for 24–48 h; cultures were centrifuged (5,000 rpm, 10 min) and supernatants sterilized through 0.22 µm filters. Two-fold serial dilutions of CFS (50.0% to 0.19% v/v) were prepared in nutrient broth in 96-well plates. Test organisms, Escherichia coli, and Candida albicans, were adjusted to a 0.5 McFarland standard (≈1.0–2.0 × 10⁸ CFU/mL) and added to each well, with growth and sterility controls. After 24 h, wells were scored for visible growth; the MIC (bacteria) was the lowest CFS concentration with no visible growth, the MIC (C. albicans) was the lowest concentration giving ~50% growth inhibition.
4.8. Acid and Gas Production
Acid and gas production were evaluated in Andrade’s broth with 0.5% (w/v) glucose; each culture (~0.5 McFarland) was inoculated with an inverted Durham tube for gas detection. E. coli was a positive control for gas; uninoculated broth served as negative/sterility control. After 24–48 h at 30 °C (24 h in the 35 °C repeat), acid production was read as a medium color change and gas as bubbles in the Durham tube.
4.9. Acid, Bile, and Oxygen Tolerance
Cells grown on PDA (24 h, 30 °C) were suspended in PBS containing 0.05% Tween-20. For acid tolerance, suspensions were exposed to BHI at pH 1 and pH 2 (HCl-adjusted) for 3 h. For bile tolerance, suspensions were exposed to BHI supplemented with 0.5%, 1%, and 2% (w/v) bile salts for 4 h at 30 °C. For oxygen sensitivity, suspensions were incubated aerobically or anaerobically for 48 h at 30 °C. After each exposure, samples were serially diluted, plated on PDA, and incubated at 30 °C for 48 h; viable counts (colony forming units (CFU)/mL) were used to compute survival as (viable count after exposure / initial viable count) × 100. Survival was measured directly only at the conditions listed above (pH 1 and pH 2; 0.5%, 1% and 2% bile salts; aerobic and anaerobic incubation), relative to untreated controls; no other pH values or bile concentrations were tested. The assay was repeated at 35 °C (see Repeat Assays at 35 °C).
4.10. Cell-Surface Hydrophobicity (BATH)
Overnight cultures were harvested and resuspended to OD600 = 0.7. Cell suspension (3.0 mL) was mixed with 1.0 mL hydrocarbon (chloroform or hexane), incubated at 30 °C for 10 min, vortexed, and incubated a further 1 h for phase separation. The aqueous-phase OD600 was measured, and adhesion (%) was calculated as (A0 − At)/A0 × 100, where A0 and At are absorbance at time 0 and after 1 h.
4.11. Auto-Aggregation
Cultures (24 h, 30 °C) were centrifuged (6,000 rpm, 10 min), resuspended in 0.9% NaCl to the original volume, vortexed 10 s, and incubated at room temperature for 5 h. The upper suspension (0.1 mL) was diluted in 0.9 mL 0.9% NaCl and OD600 measured. Auto-aggregation (%) was calculated as (1 − At/A0) × 100 (A0 = 0 h; At = 5 h).
4.12. Exopolysaccharide (EPS) Quantification
Cultures (sampled at 24 h and 48 h, 30 °C) were boiled and centrifuged; EPS in the supernatant was precipitated with 85% trichloroacetic acid followed by cold ethanol (supernatant: ethanol = 1:3) at 4 °C overnight. EPS was quantified by the phenol–sulfuric acid method: 400 µL extract + 400 µL 5% phenol + 2 mL concentrated sulfuric acid, incubated at 30 °C for 10 min, with absorbance at 490 nm read against a glucose standard curve (0.2–10 mg/mL). This assay measures total carbohydrate in the ethanol-precipitated fraction and does not resolve polysaccharide composition.
4.13. XTT Assay in CCL-1 Murine Fibroblasts Exposed to Cell-Free Supernatant
CCL-1 cells (NCTC clone 929), an adherent mouse fibroblast cell line derived from subcutaneous connective tissue, were seeded onto 24-well plates (4 × 10⁶ cells) and incubated for 24 h at 37 °C in a humidified atmosphere containing 5% CO₂ to allow attachment. Following incubation, cells were treated with the indicated supernatants at 20% v/v and further incubated for 24 h under the same conditions. Untreated cells served as the control, and wells containing media without cells were used as blanks.
After treatment, XTT reagent was prepared according to the manufacturer’s instructions and added to each well. Plates were incubated for 4 h at 37 °C to allow formation of the formazan product. Absorbance was measured at 450 nm with a reference wavelength of 660 nm using a microplate reader.
Cell viability was calculated after subtracting blank values and correcting for background absorbance (A450 – A660). Percent viability was determined relative to untreated control cells (set at 100%). All experiments were performed in triplicate, and results are expressed as mean ± standard deviation.
4.14. Caco-2 Cytotoxicity Assay
Human colorectal adenocarcinoma Caco-2 cells (ATCC HTB-37) were used between passages 3 and 4. Cells were cultured in DMEM, high glucose supplemented with 10% fetal bovine serum, 1% non-essential amino acids, 2 mM L-glutamine, and 100 U/mL penicillin/100 µg/mL streptomycin at 37 °C in a humidified 5% CO2 atmosphere. For the experiments, cells were seeded in 12-well plates at 1 x 10⁵ cells/cm2. Cells were exposed for 24 h to live PK88™ cells at ten-fold increasing doses from 6 × 10² to 6 × 10⁹ organisms/well. Cytotoxicity was quantified by lactate dehydrogenase (LDH) release into the culture medium using CyQUANT LDH Cytotoxicity Assay Kit (Invitrogen, Carlsbad, CA) with duplicate wells per condition in Experiment 1 and triplicate wells for Experiment 2. Percent cytotoxicity was calculated as (test − vehicle) / (maximum lysis − vehicle) × 100 after subtracting the LDH activity attributable to the yeast, measured in parallel plates without Caco-2 cells. The assay was performed as two independent experiments on separate days, which are analyzed and reported separately. In Experiment 1, absorbance readings were saturated for the highest doses (6 × 10⁹ organisms/well in both batches and 6 × 10⁸ organisms/well in one batch), so no values were obtained for them. In Experiment 2, one LDH well (replicate 2, 6 × 10⁵ organisms/well) was identified as a technical artifact and excluded based on coefficient of variation for sample. Experiment 1 also included a parallel arm of heat-killed PK88™ cells (70 °C for 1 hour). This assay was included to assess cytotoxicity in a human intestinal epithelial model with direct exposure to the organism, complementing the CCL-1 assay performed with cell-free supernatant.
4.15. Whole-Genome Sequencing and In Silico Safety Assessment
Genomic DNA of PK88™ was sequenced commercially (CD Genomics) using a hybrid Illumina paired-end and Oxford Nanopore Technologies (ONT) strategy; ONT long reads were assembled de novo with Flye [24] and polished with Illumina reads using Pilon [25]. Assembly completeness was assessed with BUSCO [26]. Species identity was confirmed by average nucleotide identity (FastANI [27]; 95% species boundary) and by a maximum-likelihood whole-genome phylogeny built from universal fungal core genes (UFCG [28]) with 100 bootstrap replicates. Full assembly metrics, tool versions, and parameters are provided in the Supplementary Methods (Table S1–S2, Figure S1–S2).
The annotated genome and predicted proteome were screened in silico across five safety domains: acquired antimicrobial resistance (AMRFinderPlus [29]); virulence factors (BLASTp [30] against the Victors database [31], retaining hits with ≥80% identity and ≥70% query coverage); biogenic-amine formation (BLASTp screening of polyamine-biosynthesis and amino-acid-decarboxylase genes); allergenicity (a tiered pipeline centered on AllerCatPro 2.0 [32]); and mycotoxin biosynthetic gene clusters (antiSMASH [33], compared against MIBiG [34]). Databases, versions, and thresholds for all screens are detailed in the Supplementary Methods.
4.16. Repeat Assays at 35 °C
A subset of the functional assays was repeated at 35 °C, closer to body temperature, using the same protocols with the incubation temperature changed from 30 °C to 35 °C: acid and gas production (Andrade’s broth, 24 h); acid, bile and oxygen tolerance (growth on PDA for 24 h and cell suspensions of approximately 1 × 10⁷ cells/mL in PBS, exposures and plating incubation at 35 °C); cell-surface hydrophobicity (hydrocarbon incubation at 35 °C for 10 min); and auto-aggregation (cultures grown for 24 h at 35 °C, then incubated at room temperature for 5 h and 24 h). Hemolysis, mycotoxin production, antimicrobial activity of the supernatant, EPS production and the cell-based assays were not repeated at 35 °C.
4.17. Extracellular Enzyme Activity Assays
Lipase, protease and urease activities were assessed by spot inoculation of PK88™ on egg-yolk agar (lipase), skim-milk agar (protease) and urea agar with phenol red indicator (urease), with uninoculated plates as controls, and incubation at 35 °C for 24 h. Lipase and protease activities were scored by the presence of a halo or clear zone of hemolysis around the inoculum, and urease activity by a color change from yellow to pink.
4.18. Statistical Analysis
Unless otherwise stated, experimental assays were performed with three replicates; mycotoxin ELISAs were assayed in duplicate. Data are expressed as the mean ± standard deviation (SD). Statistical evaluations were conducted using GraphPad Prism software (Version 9.0). For multi-group survival comparisons (acid and bile salt tolerances), data were analyzed via an Ordinary One-Way Analysis of Variance (ANOVA), followed by a post-hoc Dunnett’s multiple comparisons test against the untreated control group. Homogeneity of variances was verified using the Brown-Forsythe test. Variations in cell surface hydrophobicity between distinct hydrocarbons were evaluated using an unpaired t-test with Welch’s correction to account for potential unequal variances. Time-dependent autoaggregation kinetics (5 h vs. 24 h) were analyzed using a two-tailed paired t-test. A P value threshold of less than 0.05 (P< 0.05) was established as the criterion for statistical significance across all tests (*P < 0.05, ** P < 0.01, *** P < 0.001, **** P < 0.0001, ns = non-significant). Caco-2 cytotoxicity data from the two independent experiments are presented separately as individual replicate values with medians (one to three replicates per dose and experiment); no inferential test was applied to these data. The 35 °C repeat assays were analyzed with the same tests, and exact P values are shown in Figure 6. Given the small number of replicates, statistical results should be considered preliminary.
5. Conclusions
In this preliminary characterization, P. kluyveri PK88™ was non-hemolytic at 30 °C, produced no detectable mycotoxins by ELISA, showed low MICs for echinocandins and amphotericin B and higher MICs for fluconazole and posaconazole under the assay conditions used, and was not cytotoxic to murine CCL-1 fibroblasts exposed to cell-free supernatant. Whole-genome analysis confirmed its identity as P. kluyveri and identified no acquired antimicrobial-resistance genes, canonical virulence factors, mycotoxin biosynthetic gene clusters, or decarboxylases for harmful biogenic amines with the tools applied. In two independent experiments with human Caco-2 intestinal epithelial cells, cytotoxicity was ≤20% in every replicate up to 6 × 10⁴ organisms/well and increased, with high variability, at higher doses. PK88™ also tolerated the acid, bile and oxygen conditions tested at 30 °C and 35 °C, with temperature-dependent differences in hydrophobicity and auto-aggregation, and produced exopolysaccharide at 30 °C. Although P. kluyveri has a history of use in fermented foods, rare invasive infections have been reported [11]. These data are insufficient to establish safety or probiotic efficacy, however, they support further evaluation of PK88™, including susceptibility testing by reference methods, adhesion assays on epithelial monolayers, and in vivo studies.
Supplementary Materials
The following supporting information can be downloaded at the website of this paper posted on Preprints.org, Table S1: Genome assembly statistics; Table S2: Average nucleotide identity (FastANI); Table S3: BLASTp virulence-factor screening hits; Table S4: Polyamine-biosynthesis orthologs; Table S5: Tiered allergenicity assessment; Figure S1: BUSCO genome-completeness assessment; Figure S2: Maximum-likelihood whole-genome phylogeny.
Author Contributions
Conceptualization, M.G., T.S.M., J.D. and E.G.; methodology, S.A., S.F., E.S.V. and T.S.M.; formal analysis, S.A., S.F. and E.S.V.; investigation, S.A., S.F., E.S.V., A.E., S.K.; resources, M.G. and J.D.; writing—original draft preparation, S.A., S.F. and T.S.M.; writing—review and editing, S.A.,S.F., E.G., S.K., J.D., M.G., T.S.M.; supervision, M.G. and T.S.M.; project administration, T.S.M., M.G.; funding acquisition, M.G. and J.D. All authors have read and agreed to the published version of the manuscript.
Funding
This research was supported in part by a research grant from BIOHM Health, LLC.
Institutional Review Board Statement
Not applicable (no human or animal subjects).
Informed Consent Statement
Not applicable.
Data Availability Statement
Sequencing data will be deposited in a public repository (e.g., NCBI GenBank/SRA) and the accession number provided here upon acceptance of the manuscript for publication.
Acknowledgments
During the preparation of this manuscript, the authors used Claude (Anthropic; [Sonnet]) for the purposes of formatting the manuscript into the journal template, copyediting and consistency checking, and summarizing the two Caco-2 datasets and assembling Table 2 for the 30 °C and 35 °C data. The authors have reviewed and edited the output and take full responsibility for the content of this publication.
Conflicts of Interest
This research was sponsored in part by a grant from BIOHM Health, LLC. The presentation of the results of this study does not constitute endorsement by any of the researchers or their affiliations. BIOHM Health, LLC had no role in the collection, analysis, or interpretation of the data. M.A.G. is a founding partner of BIOHM Health, LLC. E.G., E.S.V., J.D. and S.K. are employees of BIOHM Health, LLC.
References
- Vergara, S.C.; Leiva, M.J.; Mestre, M.V.; Vazquez, F.; Nally, M.C.; Maturano, Y.P. Non-saccharomyces yeast probiotics: revealing relevance and potential. FEMS Yeast Res. 2023, 23. [Google Scholar] [CrossRef] [PubMed]
- Escribano, R.; González-Arenzana, L.; Garijo, P.; Berlanas, C.; López-Alfaro, I.; López, R.; Gutiérrez, A.R.; Santamaría, P. Screening of enzymatic activities within different enological non-Saccharomyces yeasts. J. Food Sci. Technol. 2017, 54, 1555–1564. [Google Scholar] [CrossRef]
- Vicente, J.; Calderón, F.; Santos, A.; Marquina, D.; Benito, S. High Potential of Pichia kluyveri and Other Pichia Species in Wine Technology. Int. J. Mol. Sci. 2021, 22. [Google Scholar] [CrossRef] [PubMed]
- FDA. GRN No. 938 Pichia kluyveri DSM 33235. Available online: https://www.hfpappexternal.fda.gov/scripts/fdcc/index.cfm?set=GRASNotices&id=938 (accessed on 07/14/2026).
- Papadimitriou, K.; Zoumpopoulou, G.; Foligné, B.; Alexandraki, V.; Kazou, M.; Pot, B.; Tsakalidou, E. Discovering probiotic microorganisms: in vitro, in vivo, genetic and omics approaches. Front Microbiol. 2015, 6, 58. [Google Scholar] [CrossRef] [PubMed]
- European Committee on Antimicrobial Susceptibility Testing Antifungal Susceptibility Testing; S. EUCAST guidance on interpretation of MICs for rare yeast without breakpoints in breakpoint tables; European Committee on Antimicrobial Susceptibility Testing (EUCAST), 2024/06/19 2024. [Google Scholar]
- FDA. Nystatin Oral Suspension, USP [Package Insert / Prescribing Information]. 2020. [Google Scholar] [PubMed]
- Reygaert, W.C. An overview of the antimicrobial resistance mechanisms of bacteria. AIMS Microbiol. 2018, 4, 482–501. [Google Scholar] [CrossRef] [PubMed]
- Gallo, A.; Perrone, G. Current Approaches for Advancement in Understanding the Molecular Mechanisms of Mycotoxin Biosynthesis. Int. J. Mol. Sci. 2021, 22. [Google Scholar] [CrossRef] [PubMed]
- Astvad, K.M.T.; Arikan-Akdagli, S.; Arendrup, M.C. A Pragmatic Approach to Susceptibility Classification of Yeasts without EUCAST Clinical Breakpoints. J. Fungi 2022, 8, 141. [Google Scholar] [CrossRef] [PubMed]
- De Greef, F.; Hayette, M.P.; Rossi, C. Fungemia caused by Pichia kluyveri: An uncommon yeast infection. New Microbes New Infect. 2022, 49-50, 101018. [Google Scholar] [CrossRef] [PubMed]
- Desnos-Ollivier, M.; Bretagne, S.; Lortholary, O.; Dromer, F. Echinocandins Susceptibility Patterns of 2,787 Yeast Isolates: Importance of the Thresholds for the Detection of FKS Mutations. Antimicrob. Agents Chemother. 2022, 66, e0172521. [Google Scholar] [CrossRef] [PubMed]
- Ghojoghi, A.; Khodavaisy, S.; Zarei Mahmoudabadi, A.; Fatahinia, M. Antifungal susceptibility profile of Candida species and uncommon yeasts from drug abusers with oral candidiasis. BMC Oral Health 2024, 24, 1555. [Google Scholar] [CrossRef] [PubMed]
- McCarty, T.P.; Luethy, P.M.; Baddley, J.W.; Pappas, P.G. Clinical utility of antifungal susceptibility testing. JAC-Antimicrob. Resist. 2022, 4. [Google Scholar] [CrossRef] [PubMed]
- Hariwal, A.; Chethan, J. Autoaggregation, Coaggregation and Hydrophobicity—A Mechanism to Explain Oral Probiotic Function by Isolates from Dairy Source. J. Chem. Health Risks 2024, 14, 1735–1743. [Google Scholar]
- Pan, W.H.; Li, P.L.; Liu, Z. The correlation between surface hydrophobicity and adherence of Bifidobacterium strains from centenarians’ faeces. Anaerobe 2006, 12, 148–152. [Google Scholar] [CrossRef] [PubMed]
- Racioppo, A.; Accettulli, A.; d’Amelio, A.; Corbo, M.R.; Sinigaglia, M.; Speranza, B.; Bevilacqua, A. Effects of different environmental stresses on cell surface hydrophobicity of lactobacilli, bifidobacteria and propionibacteria. BMC Microbiol. 2025, 25, 409. [Google Scholar] [CrossRef] [PubMed]
- Alkalbani, N.S.; Osaili, T.M.; Al-Nabulsi, A.A.; Olaimat, A.N.; Liu, S.-Q.; Shah, N.P.; Apostolopoulos, V.; Ayyash, M.M. Assessment of Yeasts as Potential Probiotics: A Review of Gastrointestinal Tract Conditions and Investigation Methods. J. Fungi 2022, 8, 365. [Google Scholar] [CrossRef] [PubMed]
- Dertli, E.; Mayer, M.J.; Narbad, A. Impact of the exopolysaccharide layer on biofilms, adhesion and resistance to stress in Lactobacillus johnsonii FI9785. BMC Microbiol. 2015, 15, 8. [Google Scholar] [CrossRef] [PubMed]
- Lu, Y.; Han, S.; Zhang, S.; Wang, K.; Lv, L.; McClements, D.J.; Xiao, H.; Berglund, B.; Yao, M.; Li, L. The role of probiotic exopolysaccharides in adhesion to mucin in different gastrointestinal conditions. Curr. Res. Food Sci. 2022, 5, 581–589. [Google Scholar] [CrossRef] [PubMed]
- Shukla, A.; Tangney, M. Bacterial exopolysaccharides and live biotherapeutics: Orchestrating immune modulation and therapeutic potential in the gut microbiome era. BioMed Pharmacother. 2025, 191, 118510. [Google Scholar] [CrossRef] [PubMed]
- Méndez-Zamora, A.; Gutiérrez-Avendaño, D.O.; Arellano-Plaza, M.; De la Torre González, F.J.; Barrera-Martínez, I.; Gschaedler Mathis, A.; Casas-Godoy, L. The non-Saccharomyces yeast Pichia kluyveri for the production of aromatic volatile compounds in alcoholic fermentation. FEMS Yeast Res. 2021, 20. [Google Scholar] [CrossRef] [PubMed]
- Yasmin, I.; Saeed, M.; Khan, W.A.; Khaliq, A.; Chughtai, M.F.J.; Iqbal, R.; Tehseen, S.; Naz, S.; Liaqat, A.; Mehmood, T.; et al. In Vitro Probiotic Potential and Safety Evaluation (Hemolytic, Cytotoxic Activity) of Bifidobacterium Strains Isolated from Raw Camel Milk. Microorganisms 2020, 8, 354. [Google Scholar] [CrossRef] [PubMed]
- Kolmogorov, M.; Yuan, J.; Lin, Y.; Pevzner, P.A. Assembly of long, error-prone reads using repeat graphs. Nat. Biotechnol. 2019, 37, 540–546. [Google Scholar] [CrossRef] [PubMed]
- Walker, B.J.; Abeel, T.; Shea, T.; Priest, M.; Abouelliel, A.; Sakthikumar, S.; Cuomo, C.A.; Zeng, Q.; Wortman, J.; Young, S.K.; et al. Pilon: an integrated tool for comprehensive microbial variant detection and genome assembly improvement. PLoS ONE 2014, 9, e112963. [Google Scholar] [CrossRef] [PubMed]
- Seppey, M.; Manni, M.; Zdobnov, E.M. BUSCO: Assessing Genome Assembly and Annotation Completeness. Methods Mol. Biol. 2019, 1962, 227–245. [Google Scholar] [CrossRef] [PubMed]
- Jain, C.; Rodriguez, R.L.; Phillippy, A.M.; Konstantinidis, K.T.; Aluru, S. High throughput ANI analysis of 90K prokaryotic genomes reveals clear species boundaries. Nat. Commun. 2018, 9, 5114. [Google Scholar] [CrossRef] [PubMed]
- Kim, D.; Gilchrist, C.L.M.; Chun, J.; Steinegger, M. UFCG: database of universal fungal core genes and pipeline for genome-wide phylogenetic analysis of fungi. Nucleic Acids Res. 2023, 51, D777–d784. [Google Scholar] [CrossRef] [PubMed]
- Feldgarden, M.; Brover, V.; Fedorov, B.; Haft, D.H.; Prasad, A.B.; Klimke, W. Curation of the AMRFinderPlus databases: applications, functionality and impact. Microb. Genom. 2022, 8. [Google Scholar] [CrossRef] [PubMed]
- Altschul, S.F.; Gish, W.; Miller, W.; Myers, E.W.; Lipman, D.J. Basic local alignment search tool. J. Mol. Biol. 1990, 215, 403–410. [Google Scholar] [CrossRef] [PubMed]
- Sayers, S.; Li, L.; Ong, E.; Deng, S.; Fu, G.; Lin, Y.; Yang, B.; Zhang, S.; Fa, Z.; Zhao, B.; et al. Victors: a web-based knowledge base of virulence factors in human and animal pathogens. Nucleic Acids Res. 2019, 47, D693–d700. [Google Scholar] [CrossRef] [PubMed]
- Nguyen, M.N.; Krutz, N.L.; Limviphuvadh, V.; Lopata, A.L.; Gerberick, G.F.; Maurer-Stroh, S. AllerCatPro 2.0: a web server for predicting protein allergenicity potential. Nucleic Acids Res. 2022, 50, W36–w43. [Google Scholar] [CrossRef] [PubMed]
- Blin, K.; Shaw, S.; Augustijn, H.E.; Reitz, Z.L.; Biermann, F.; Alanjary, M.; Fetter, A.; Terlouw, B.R.; Metcalf, W.W.; Helfrich, E.J.N.; et al. antiSMASH 7.0: new and improved predictions for detection, regulation, chemical structures and visualisation. Nucleic Acids Res. 2023, 51, W46–w50. [Google Scholar] [CrossRef] [PubMed]
- Terlouw, B.R.; Blin, K.; Navarro-Muñoz, J.C.; Avalon, N.E.; Chevrette, M.G.; Egbert, S.; Lee, S.; Meijer, D.; Recchia, M.J.J.; Reitz, Z.L.; et al. MIBiG 3.0: a community-driven effort to annotate experimentally validated biosynthetic gene clusters. Nucleic Acids Res. 2023, 51, D603–d610. [Google Scholar] [CrossRef] [PubMed]
Figure 1.
PK88™ images observed under light and fluorescence microscopy (calcofluor white) at 100x magnification using DAPI channel, scale bar indicates 10μm.
Figure 1.
PK88™ images observed under light and fluorescence microscopy (calcofluor white) at 100x magnification using DAPI channel, scale bar indicates 10μm.
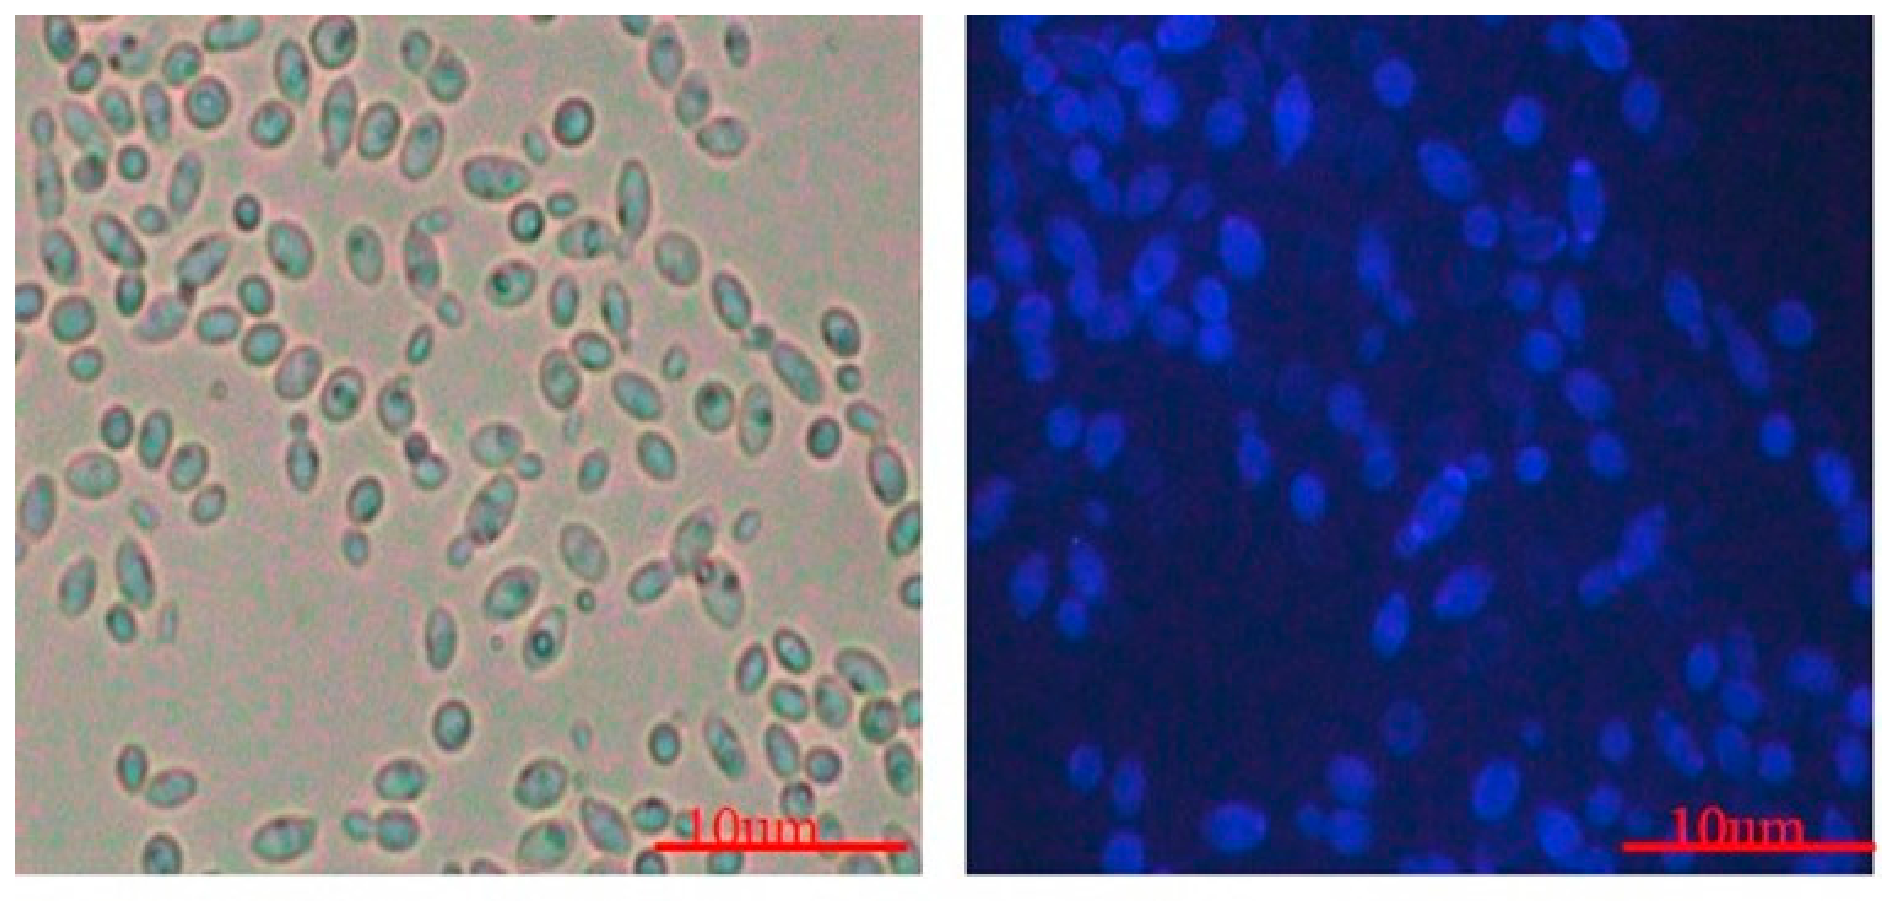
Figure 2.
(A) Flow cytometric detection of β-glucan on PK88™ cells. Cells were stained with rabbit anti-fungal β-glucan antibody at 1:100 dilution, followed by goat anti-rabbit IgG Alexa Fluor 488 secondary antibody (1:2000). Quadrants were set using an isotype control. (B) Fluorescence microscopy of β-glucan localization in the cell wall of PK88™.
Figure 2.
(A) Flow cytometric detection of β-glucan on PK88™ cells. Cells were stained with rabbit anti-fungal β-glucan antibody at 1:100 dilution, followed by goat anti-rabbit IgG Alexa Fluor 488 secondary antibody (1:2000). Quadrants were set using an isotype control. (B) Fluorescence microscopy of β-glucan localization in the cell wall of PK88™.
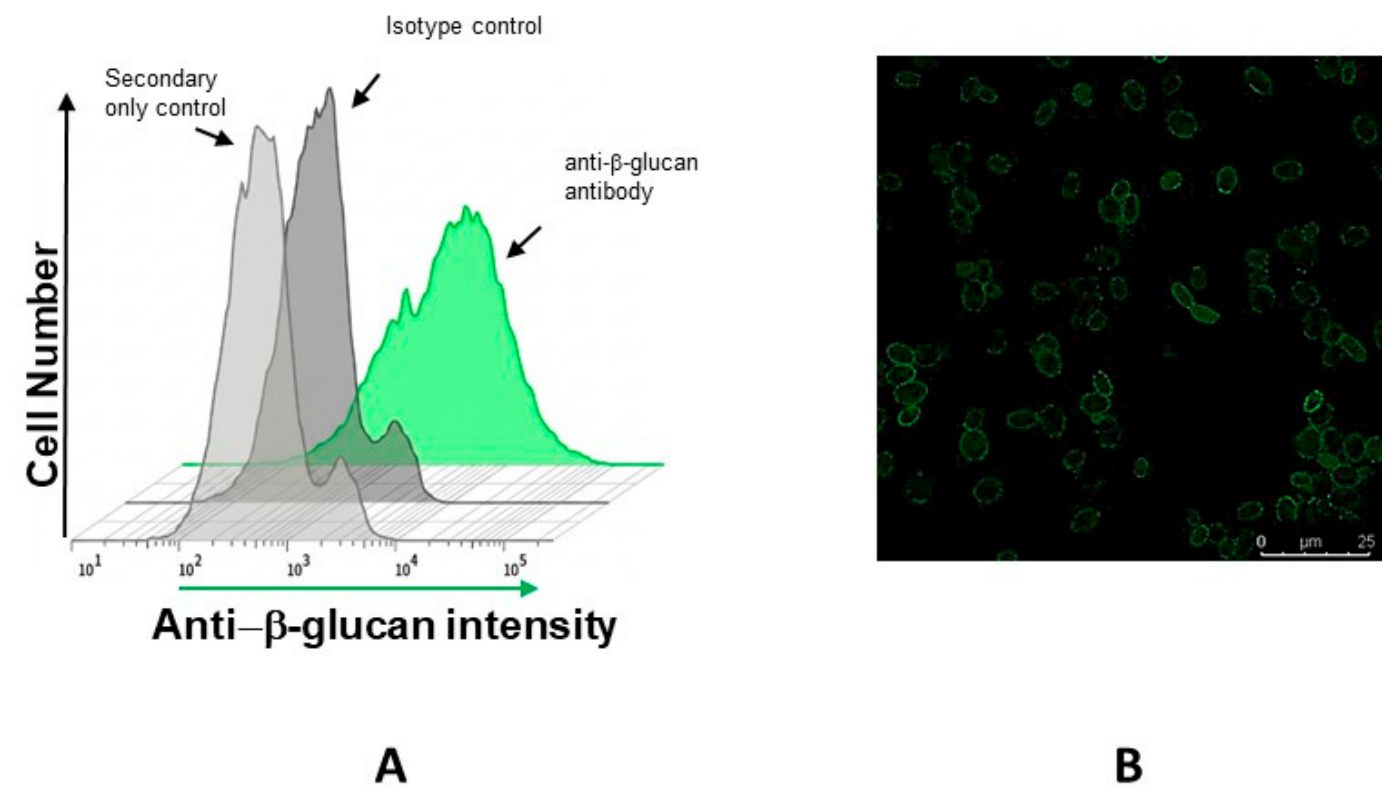
Figure 3.
Hemolytic activity of test strain: PK88™ compared with the control strain C. auris.
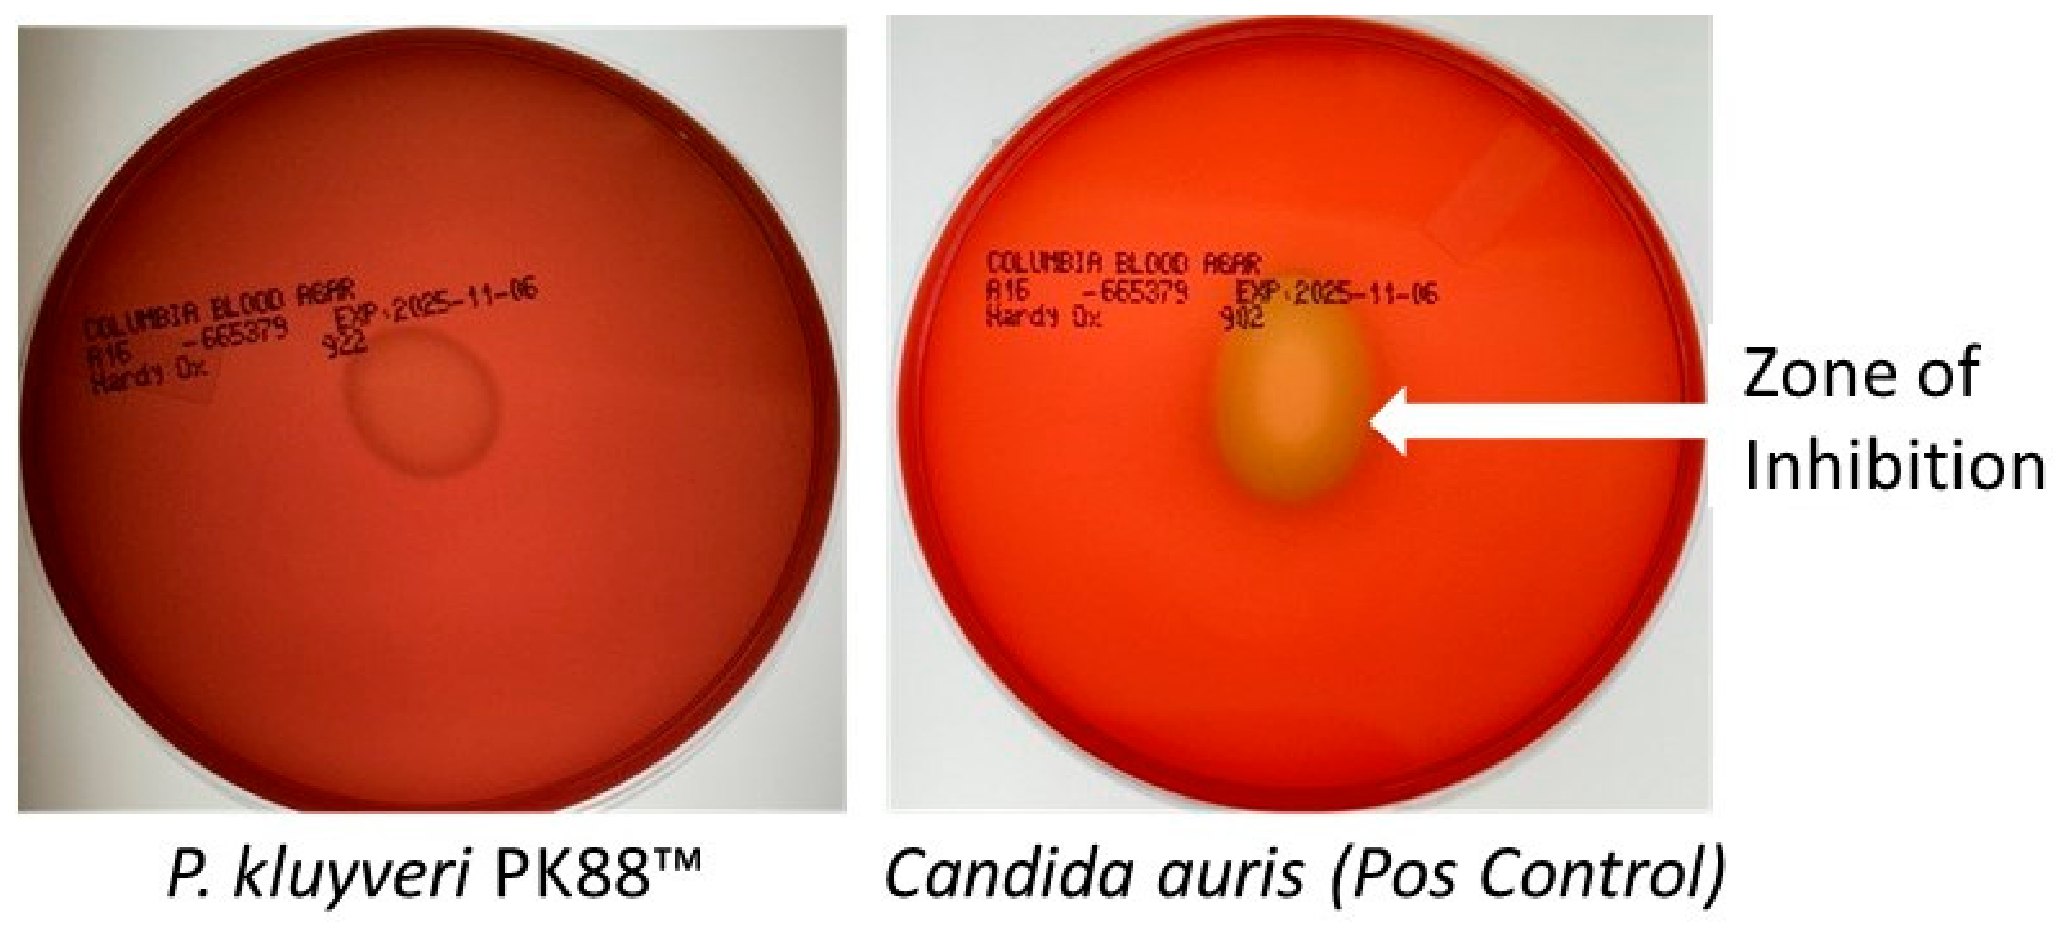
Figure 4.
Preliminary antimicrobial activity of PK88™ cell-free supernatant against E. coli and C. albicans.
Figure 4.
Preliminary antimicrobial activity of PK88™ cell-free supernatant against E. coli and C. albicans.
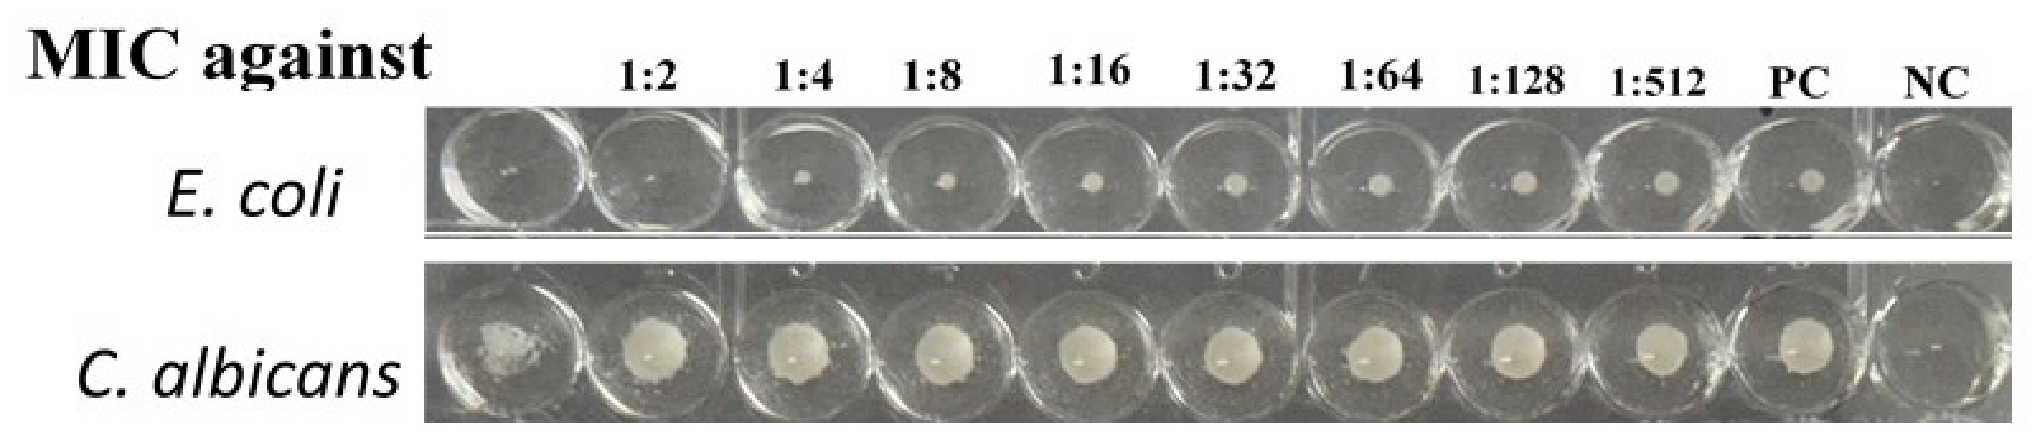
Figure 5.
Acid and gas production at 30 °C and 35 °C. (A) 30 °C. (B) 35 °C, 0 h. (C) 35 °C, 24 h. A color change to red in Andrade’s broth with glucose indicates acid production. PK88™ (P. kluyveri) and E. coli produced acid at both temperatures, and gas (bubbles in the inverted Durham tube) was observed only with E. coli (positive control). Negative control, uninoculated broth.
Figure 5.
Acid and gas production at 30 °C and 35 °C. (A) 30 °C. (B) 35 °C, 0 h. (C) 35 °C, 24 h. A color change to red in Andrade’s broth with glucose indicates acid production. PK88™ (P. kluyveri) and E. coli produced acid at both temperatures, and gas (bubbles in the inverted Durham tube) was observed only with E. coli (positive control). Negative control, uninoculated broth.
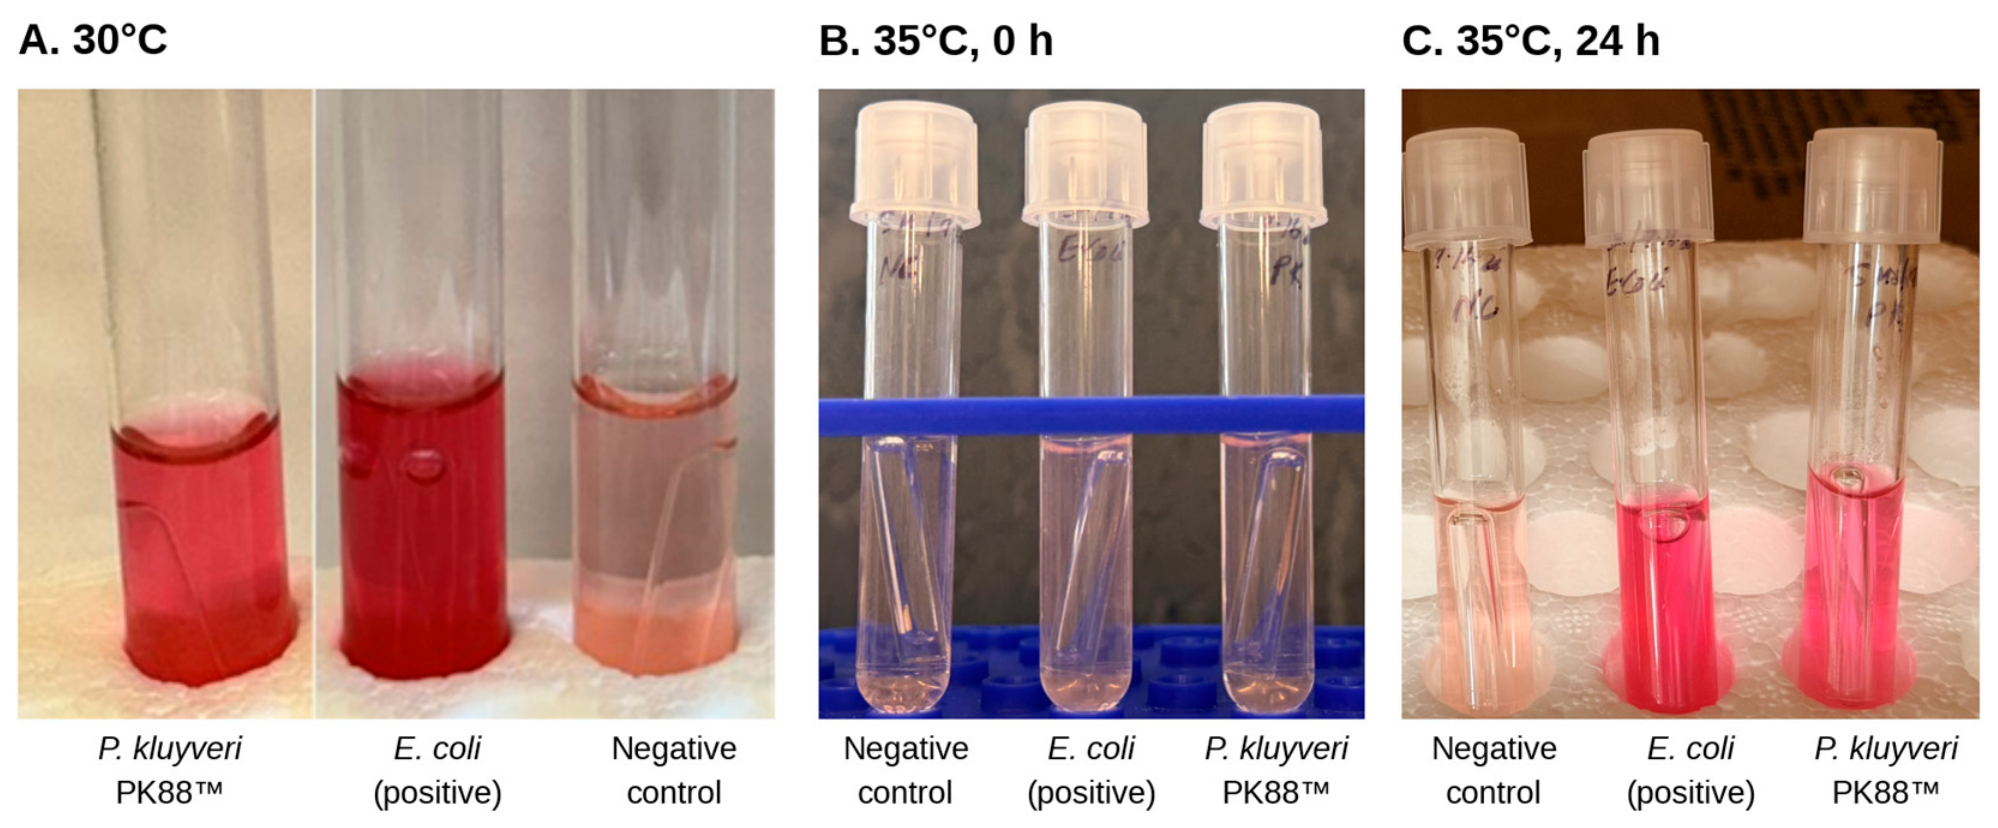
Figure 6.
Survival of PK88™ after exposure to acid (a, d), bile salts (b, e) and aerobic or anaerobic incubation (c, f) at 30 °C (a–c) and 35 °C (d–f). All conditions were measured directly. Bars show mean survival (%) ± standard deviation of three technical replicates (n = 3); P values above the brackets are from Dunnett’s multiple comparisons test against the untreated control (One-way ANOVA).
Figure 6.
Survival of PK88™ after exposure to acid (a, d), bile salts (b, e) and aerobic or anaerobic incubation (c, f) at 30 °C (a–c) and 35 °C (d–f). All conditions were measured directly. Bars show mean survival (%) ± standard deviation of three technical replicates (n = 3); P values above the brackets are from Dunnett’s multiple comparisons test against the untreated control (One-way ANOVA).
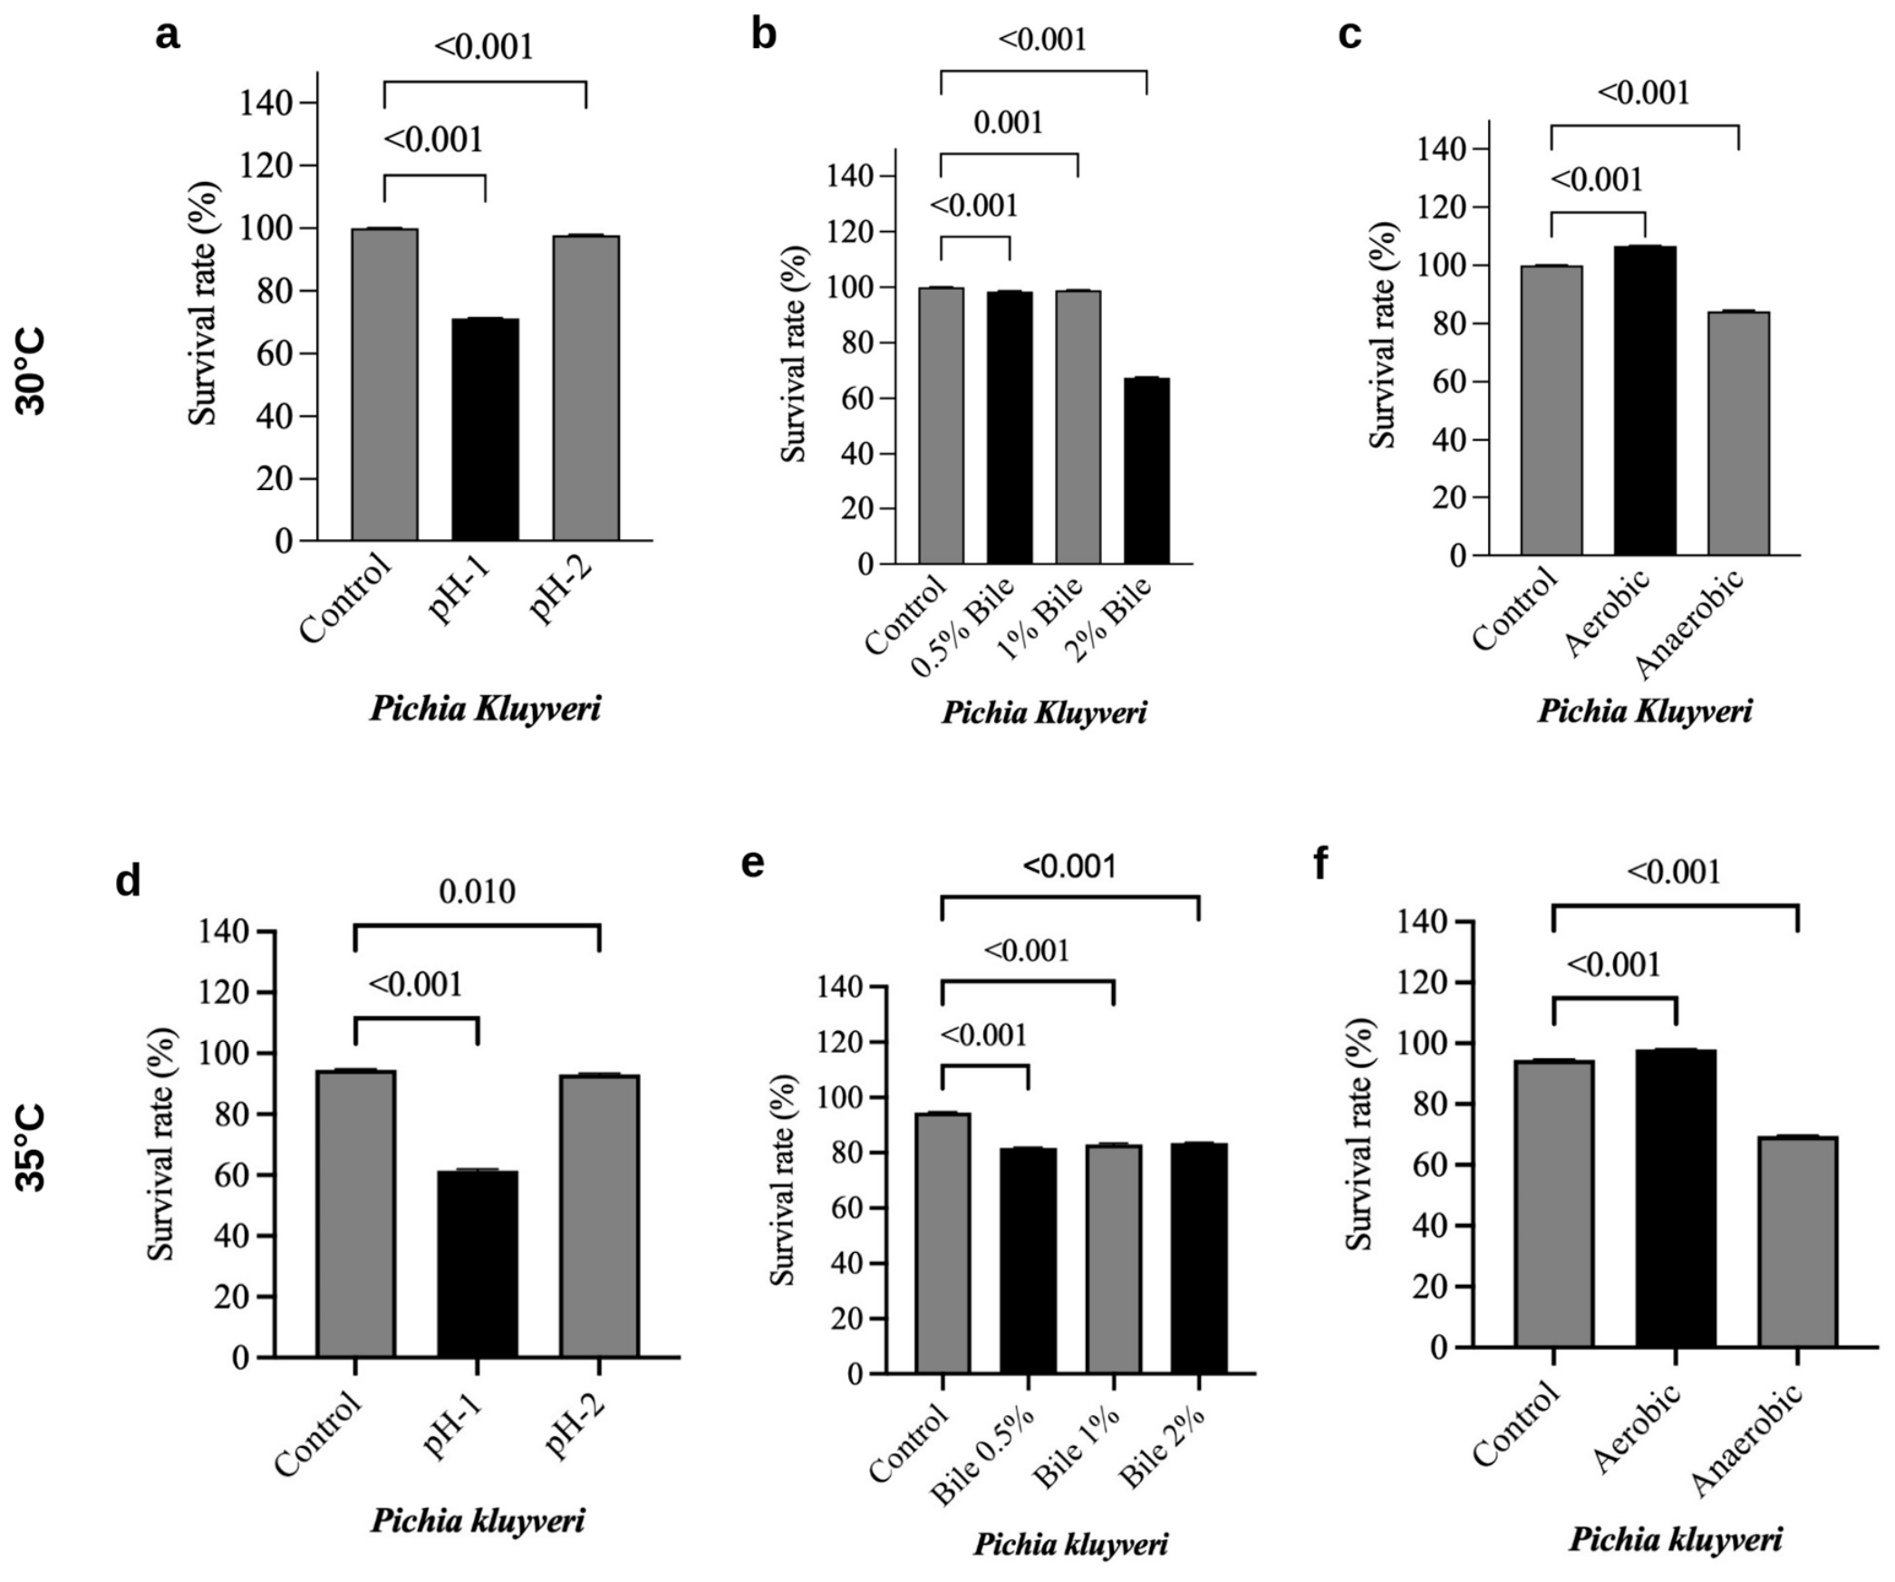
Figure 7.
Surface and matrix properties of PK88™ at 30 °C (top row, a–c) and 35 °C (bottom row, d and e): a) Cell surface hydrophobicity profile assessed by the microbial adhesion to hydrocarbons (BATH) assay toward hexane and chloroform solvents. Statistical significance between the solvent groups was evaluated using an unpaired t-test with Welch’s correction (ns = non-significant, p ≥ 0.05). b) Time-dependent autoaggregation kinetics measured after 5 hours and 24 hours of static incubation. Statistical variation between the two time points was analyzed via a two-tailed paired t-test, asterisks (****) denote extremely significant differences relative to the control group (p < 0.0001), and (**) denote significant differences relative to the control group (p < 0.01). c) Total quantitative yield of crude exopolysaccharide (EPS) produced under optimized culture conditions. All columns and data points illustrate the mean values ± standard deviation derived from replicates (n = 3). d) Cell-surface hydrophobicity at 35 °C (hexane and chloroform; unpaired t-test with Welch’s correction, ** p < 0.01). e) Auto-aggregation at 35 °C after 5 h and 24 h (paired t-test, **** p < 0.0001). EPS production was not assayed at 35 °C.
Figure 7.
Surface and matrix properties of PK88™ at 30 °C (top row, a–c) and 35 °C (bottom row, d and e): a) Cell surface hydrophobicity profile assessed by the microbial adhesion to hydrocarbons (BATH) assay toward hexane and chloroform solvents. Statistical significance between the solvent groups was evaluated using an unpaired t-test with Welch’s correction (ns = non-significant, p ≥ 0.05). b) Time-dependent autoaggregation kinetics measured after 5 hours and 24 hours of static incubation. Statistical variation between the two time points was analyzed via a two-tailed paired t-test, asterisks (****) denote extremely significant differences relative to the control group (p < 0.0001), and (**) denote significant differences relative to the control group (p < 0.01). c) Total quantitative yield of crude exopolysaccharide (EPS) produced under optimized culture conditions. All columns and data points illustrate the mean values ± standard deviation derived from replicates (n = 3). d) Cell-surface hydrophobicity at 35 °C (hexane and chloroform; unpaired t-test with Welch’s correction, ** p < 0.01). e) Auto-aggregation at 35 °C after 5 h and 24 h (paired t-test, **** p < 0.0001). EPS production was not assayed at 35 °C.
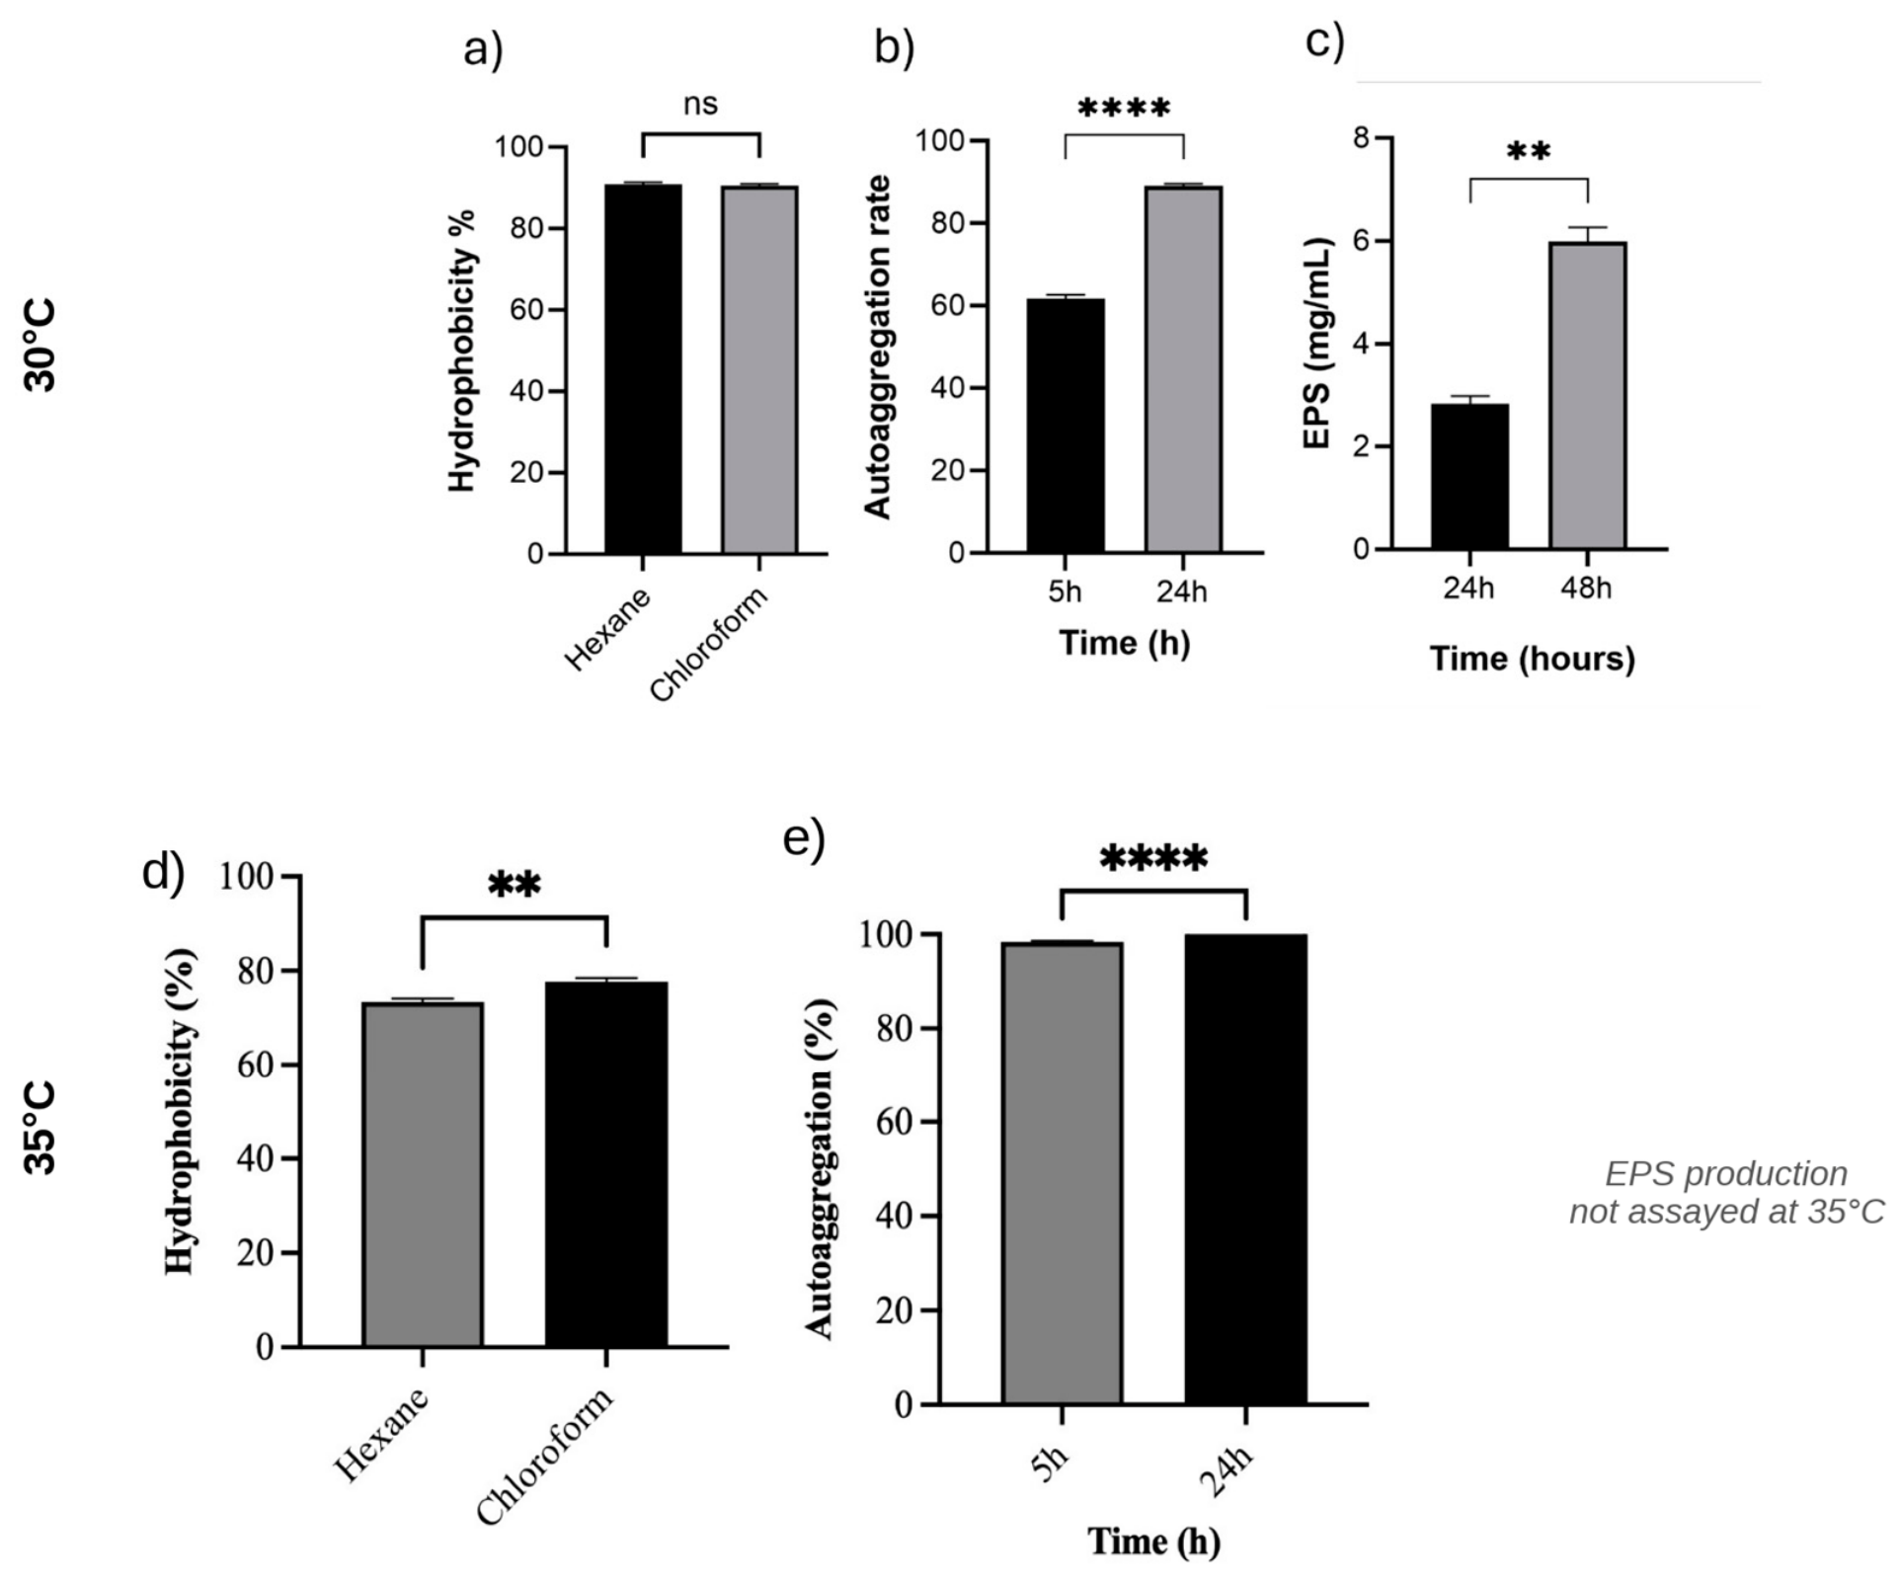
Figure 8.
Cell viability was assessed using NCTC clone 929 CCL-1 cells and the XTT assay evaluated following 24-hour post exposure under standard culture conditions to cell-free supernatants from PK88TM. The mean CCL-1 cell viability calculated after the 24h supernatant exposure is shown (n = 3). Viability following PK88™ supernatant treatment was 104.3 ± 17.1%.
Figure 8.
Cell viability was assessed using NCTC clone 929 CCL-1 cells and the XTT assay evaluated following 24-hour post exposure under standard culture conditions to cell-free supernatants from PK88TM. The mean CCL-1 cell viability calculated after the 24h supernatant exposure is shown (n = 3). Viability following PK88™ supernatant treatment was 104.3 ± 17.1%.
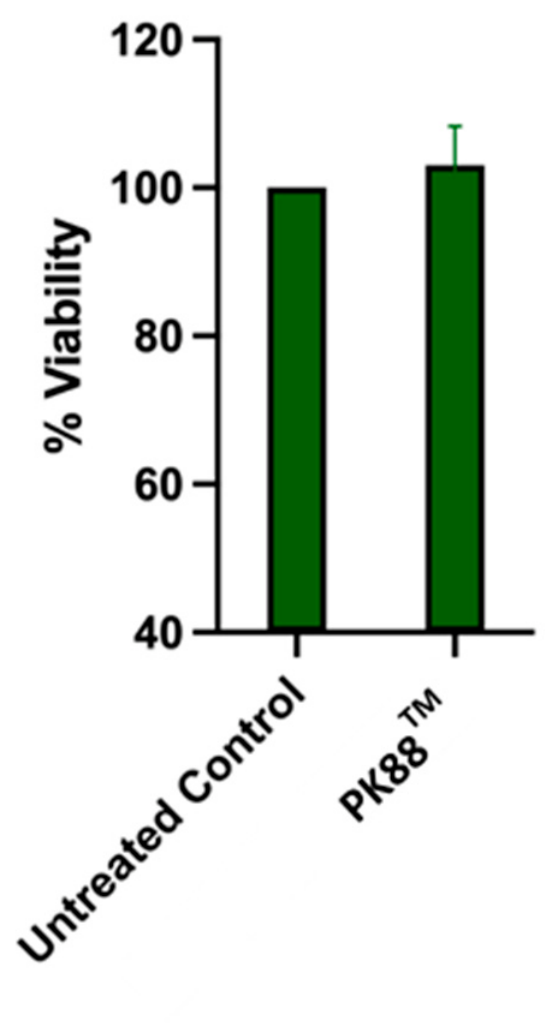
Figure 9.
Cytotoxicity toward human Caco-2 intestinal epithelial cells after 24 h of exposure to PK88™ cells, shown for two independent experiments. Percent cytotoxicity was determined by LDH release. Open circles, Experiment 1 (two batches; no values at 6 × 10⁹ organisms/well, or at 6 × 10⁸ organisms/well in one batch, because readings were saturated); filled circles, Experiment 2 (three replicates; one well excluded at 6 × 10⁵ organisms/well as a technical artifact). Each point is an individual replicate, and horizontal bars indicate the median of each experiment. Doses are expressed as organisms per well.
Figure 9.
Cytotoxicity toward human Caco-2 intestinal epithelial cells after 24 h of exposure to PK88™ cells, shown for two independent experiments. Percent cytotoxicity was determined by LDH release. Open circles, Experiment 1 (two batches; no values at 6 × 10⁹ organisms/well, or at 6 × 10⁸ organisms/well in one batch, because readings were saturated); filled circles, Experiment 2 (three replicates; one well excluded at 6 × 10⁵ organisms/well as a technical artifact). Each point is an individual replicate, and horizontal bars indicate the median of each experiment. Doses are expressed as organisms per well.
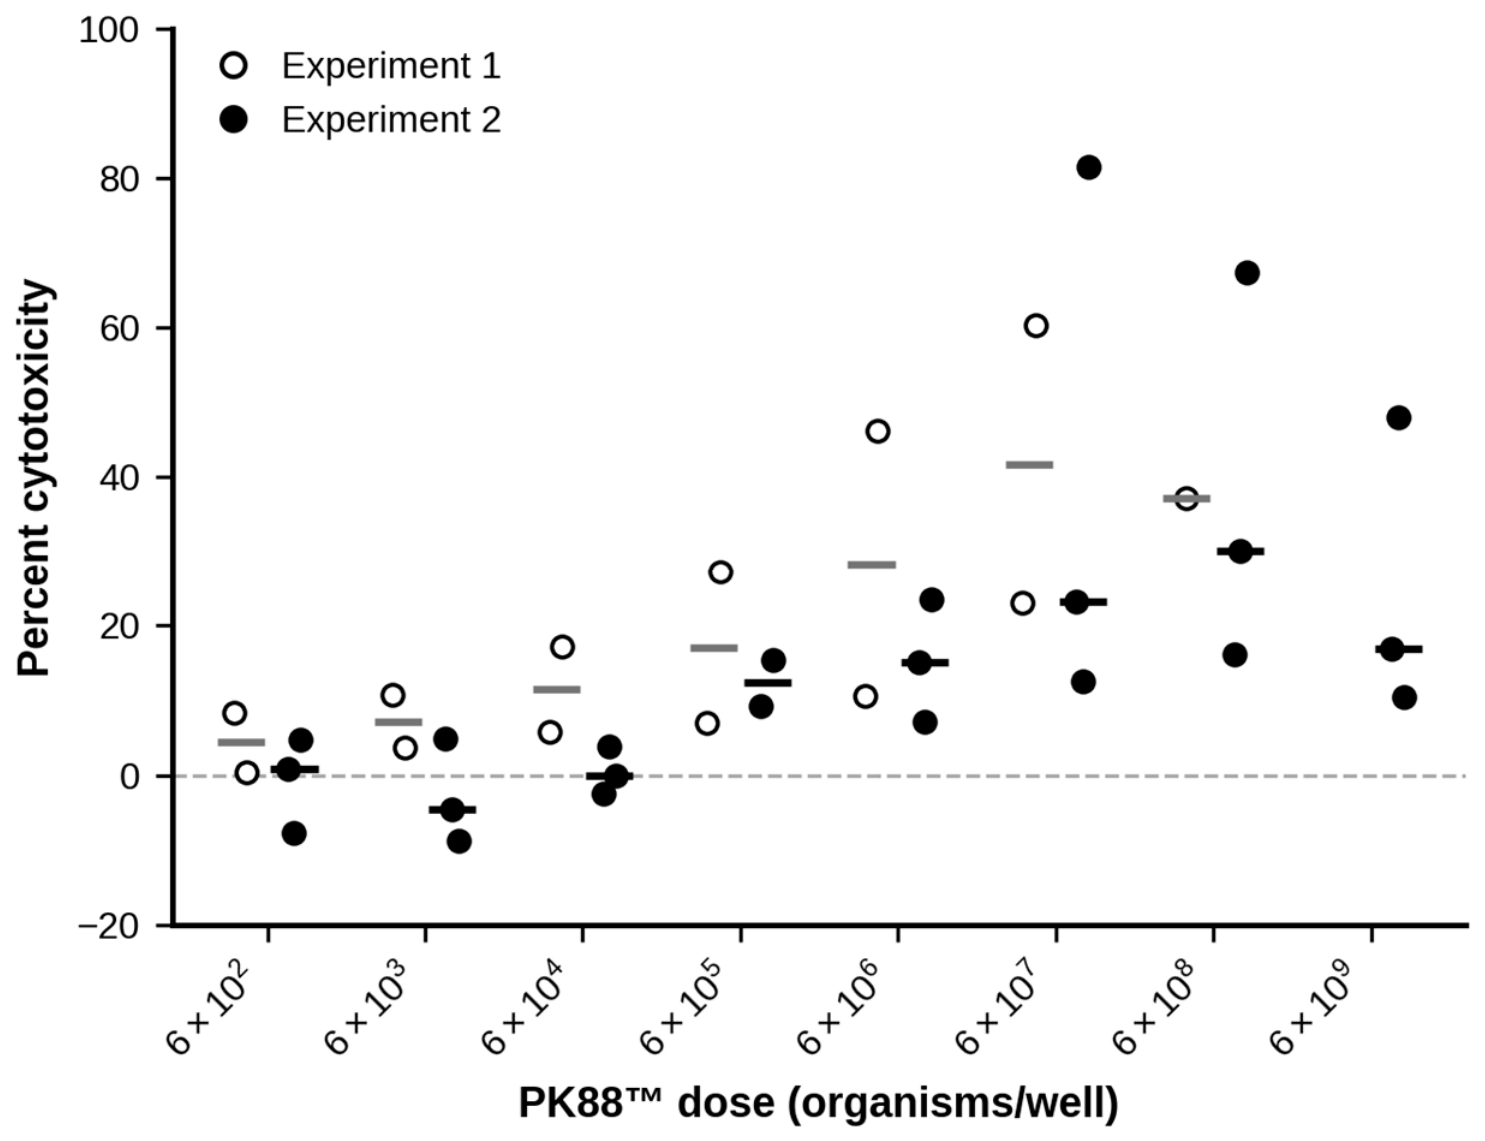
Figure 10.
Extracellular enzyme activity of PK88™ (Pichia kluyveri) at 35 °C after 24 h on solid media (spot inoculation; uninoculated plate, control). (a) Lipase, egg-yolk agar: no halo around the inoculum. (b) Urease, urea agar with phenol red, no color change. (c) Protease, skim-milk agar, two plate replicates: no clear zone of hemolysis.
Figure 10.
Extracellular enzyme activity of PK88™ (Pichia kluyveri) at 35 °C after 24 h on solid media (spot inoculation; uninoculated plate, control). (a) Lipase, egg-yolk agar: no halo around the inoculum. (b) Urease, urea agar with phenol red, no color change. (c) Protease, skim-milk agar, two plate replicates: no clear zone of hemolysis.
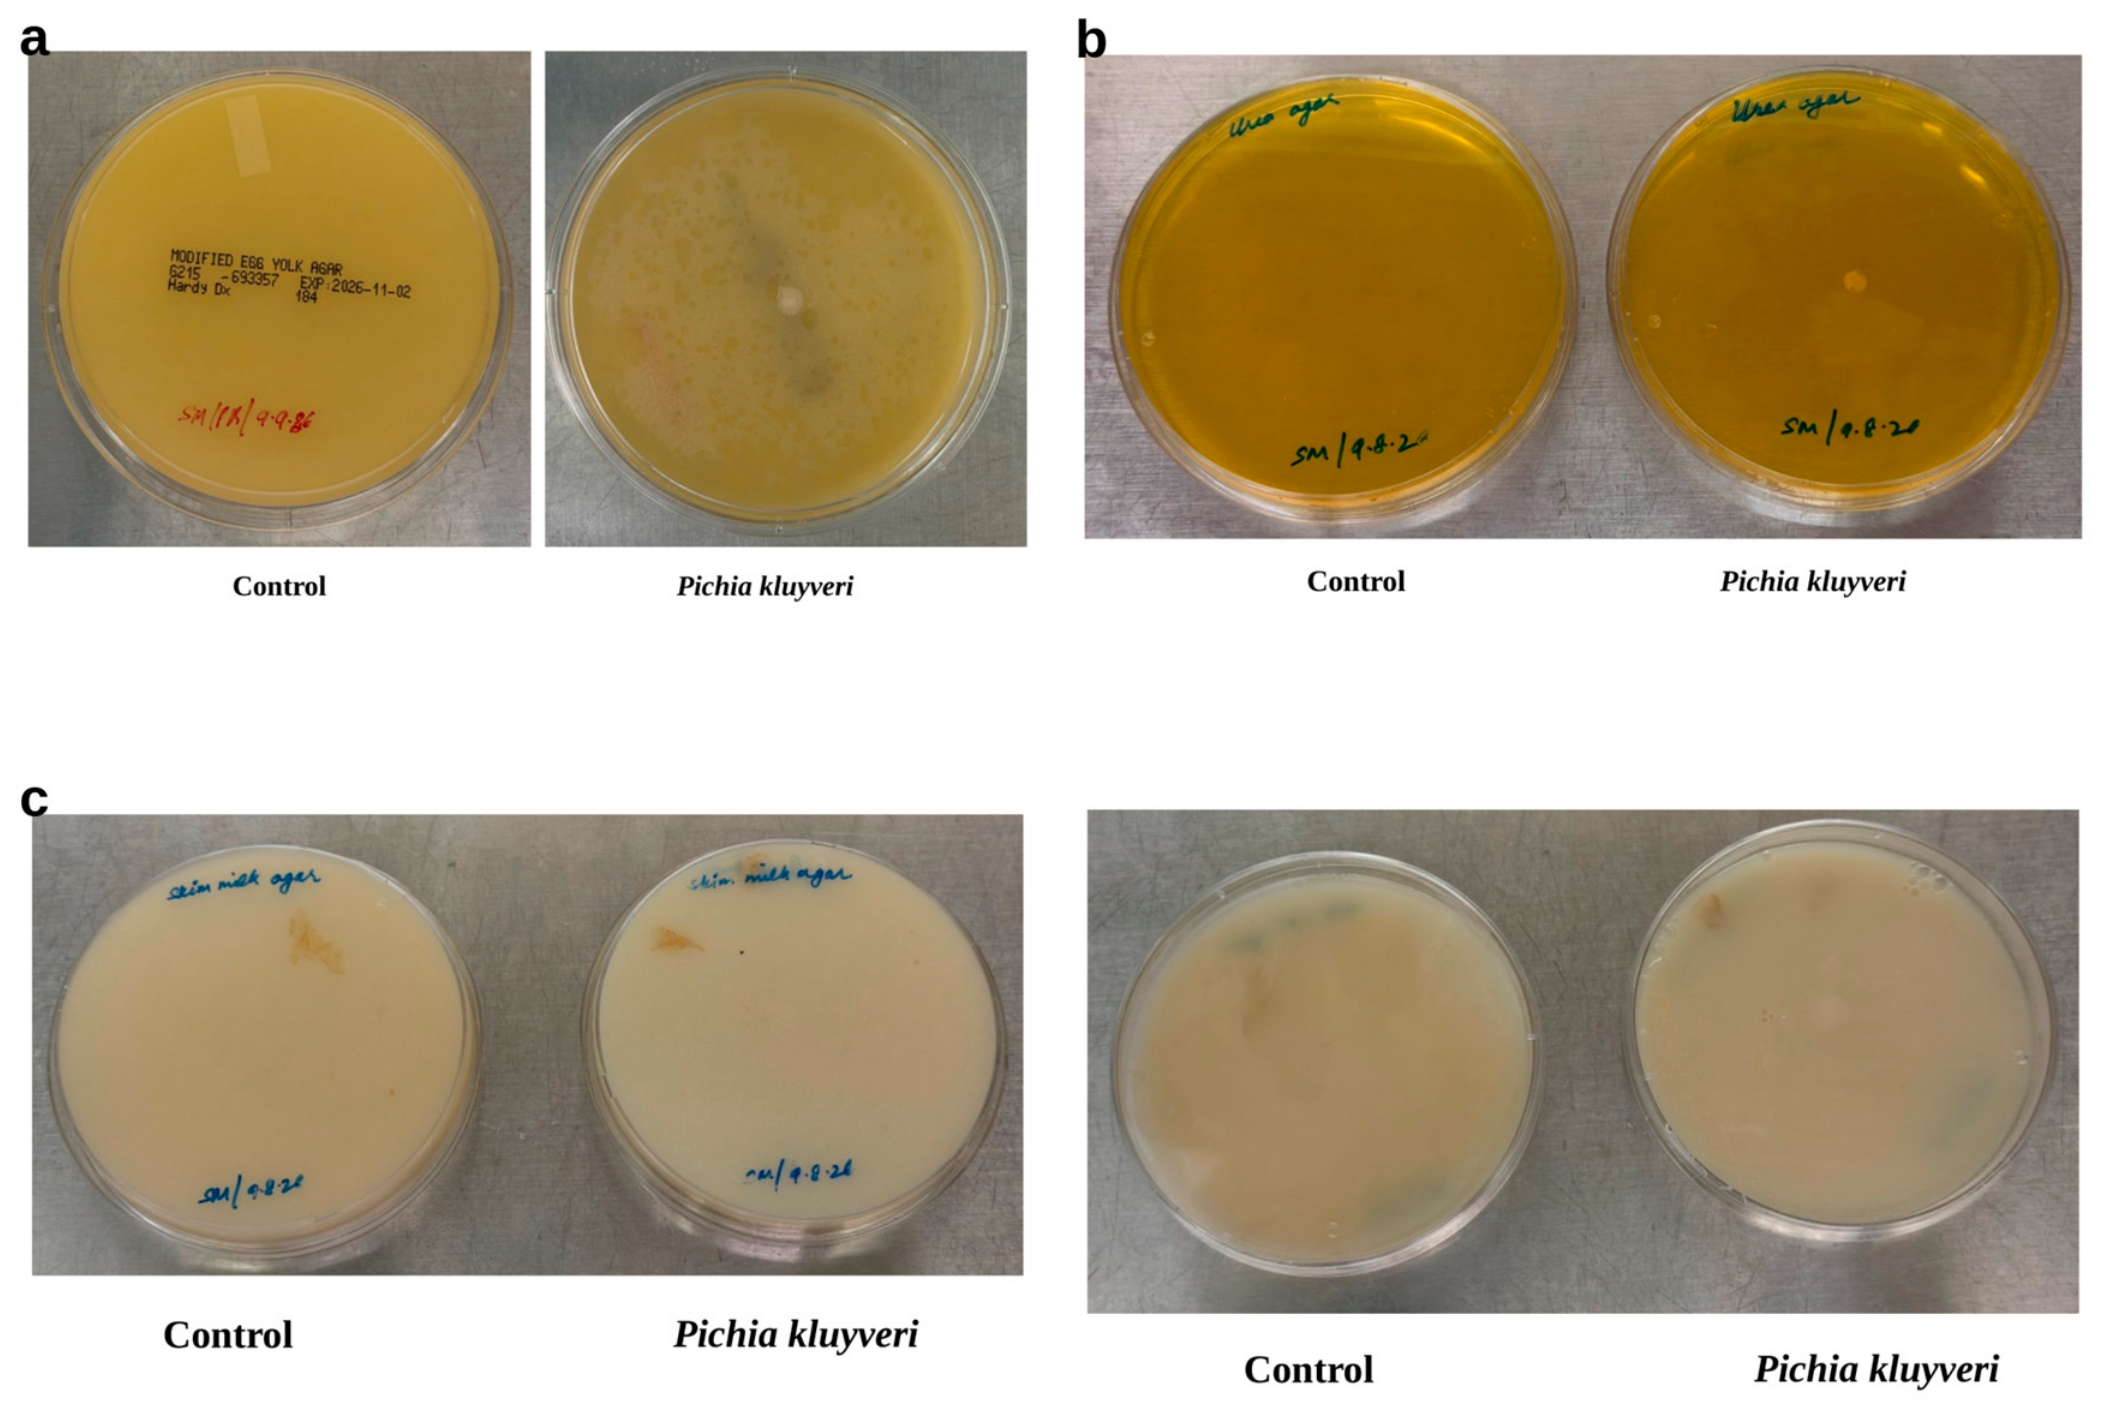

Table 1.
Antifungal susceptibility testing of PK88™.
| Antifungal drug | Tested range (µg/mL) | Observed MIC (µg/mL) |
|---|---|---|
| Micafungin | 8-0.016 | 0.03 |
| Anidulafungin | 8-0.016 | 0.016 |
| Caspofungin | 8-0.016 | 0.25 |
| Amphotericin B | 8-0.016 | 0.125 |
| Fluconazole | 64-0.125 | 64 |
| Posaconazole | 8-0.016 | 8 |
| Itraconazole | 16-0.031 | 0.5 |
| Nystatin | 64-0.125 | 4 |
Table 2.
Comparison of PK88™ functional assays at 30 °C and 35 °C.
| Assay | 30 °C | 35 °C |
|---|---|---|
| Acid survival, pH 1 (%) | 71.25 | 61.42 |
| Acid survival, pH 2 (%) | 97.78 | 93.05 |
| Bile survival, 0.5% (%) | 98.48 | 81.77 |
| Bile survival, 1% (%) | 98.91 | 83.06 |
| Bile survival, 2% (%) | 67.40 | 84.49 |
| Aerobic survival (%) | 106.71 | 97.9 |
| Anaerobic survival (%) | 84.24 | 69.61 |
| Hydrophobicity, hexane (%) | 90.88 | 73.33 |
| Hydrophobicity, chloroform (%) | 90.44 | 77.61 |
| Auto-aggregation, 5 h (%) | 61.78 | 98.40 |
| Auto-aggregation, 24 h (%) | 89.11 | 105.53 |
| EPS, 24 h / 48 h (mg/mL) | 2.71/6.0 | not assayed |
| Control survival as plotted (%) | 100 | 95 |
| Acid and gas production | acid, no gas | acid, no gas |
Survival is percent of the control as plotted; the 35 °C controls were plotted at 95%. Acid and gas production: acid in PK88™ and E. coli, and gas only in E. coli, at both temperatures.
Table 3.
Caco-2 cytotoxicity (% LDH release; median with range) by dose in two independent experiments.
Table 3.
Caco-2 cytotoxicity (% LDH release; median with range) by dose in two independent experiments.
| Dose (organisms/well) | Exp. 1 n | Exp. 1 median (range) | Exp. 2 n | Exp. 2 median (range) |
|---|---|---|---|---|
| 6 × 10² | 2 | 4.4 (0.4 to 8.3) | 3 | 0.8 (−7.7 to 4.7) |
| 6 × 10³ | 2 | 7.2 (3.6 to 10.8) | 3 | −4.5 (−8.8 to 4.9) |
| 6 × 10⁴ | 2 | 11.5 (5.8 to 17.2) | 3 | −0.1 (−2.5 to 3.8) |
| 6 × 10⁵ | 2 | 17.1 (7.0 to 27.2) | 2 | 12.4 (9.3 to 15.4) |
| 6 × 10⁶ | 2 | 28.3 (10.5 to 46.2) | 3 | 15.1 (7.1 to 23.6) |
| 6 × 10⁷ | 2 | 41.7 (23.1 to 60.3) | 3 | 23.2 (12.6 to 81.5) |
| 6 × 10⁸ | 1 | 37.2 | 3 | 30.1 (16.1 to 67.4) |
| 6 × 10⁹ | 0 | — | 3 | 16.9 (10.5 to 48.1) |
Percent cytotoxicity = (test − vehicle) / (maximum lysis − vehicle) × 100, after subtracting yeast-only LDH background. n, number of values (Experiment 1, batches; Experiment 2, replicates). Dash, no valid reading (saturated absorbance). Experiment 2 replicate 2 at 6 × 10⁵ organisms/well was excluded as a technical artifact (exceeded the coefficient of variation by greater than 2SD).
Disclaimer/Publisher’s Note: The statements, opinions and data contained in all publications are solely those of the individual author(s) and contributor(s) and not of MDPI and/or the editor(s). MDPI and/or the editor(s) disclaim responsibility for any injury to people or property resulting from any ideas, methods, instructions or products referred to in the content. |
© 2026 by the authors. Licensee MDPI, Basel, Switzerland. This article is an open access article distributed under the terms and conditions of the Creative Commons Attribution (CC BY) license (http://creativecommons.org/licenses/by/4.0/).
Copyright: This open access article is published under a Creative Commons CC BY 4.0 license, which permit the free download, distribution, and reuse, provided that the author and preprint are cited in any reuse.