

Submitted:
26 October 2026
Posted:
27 October 2026
You are already at the latest version
Abstract
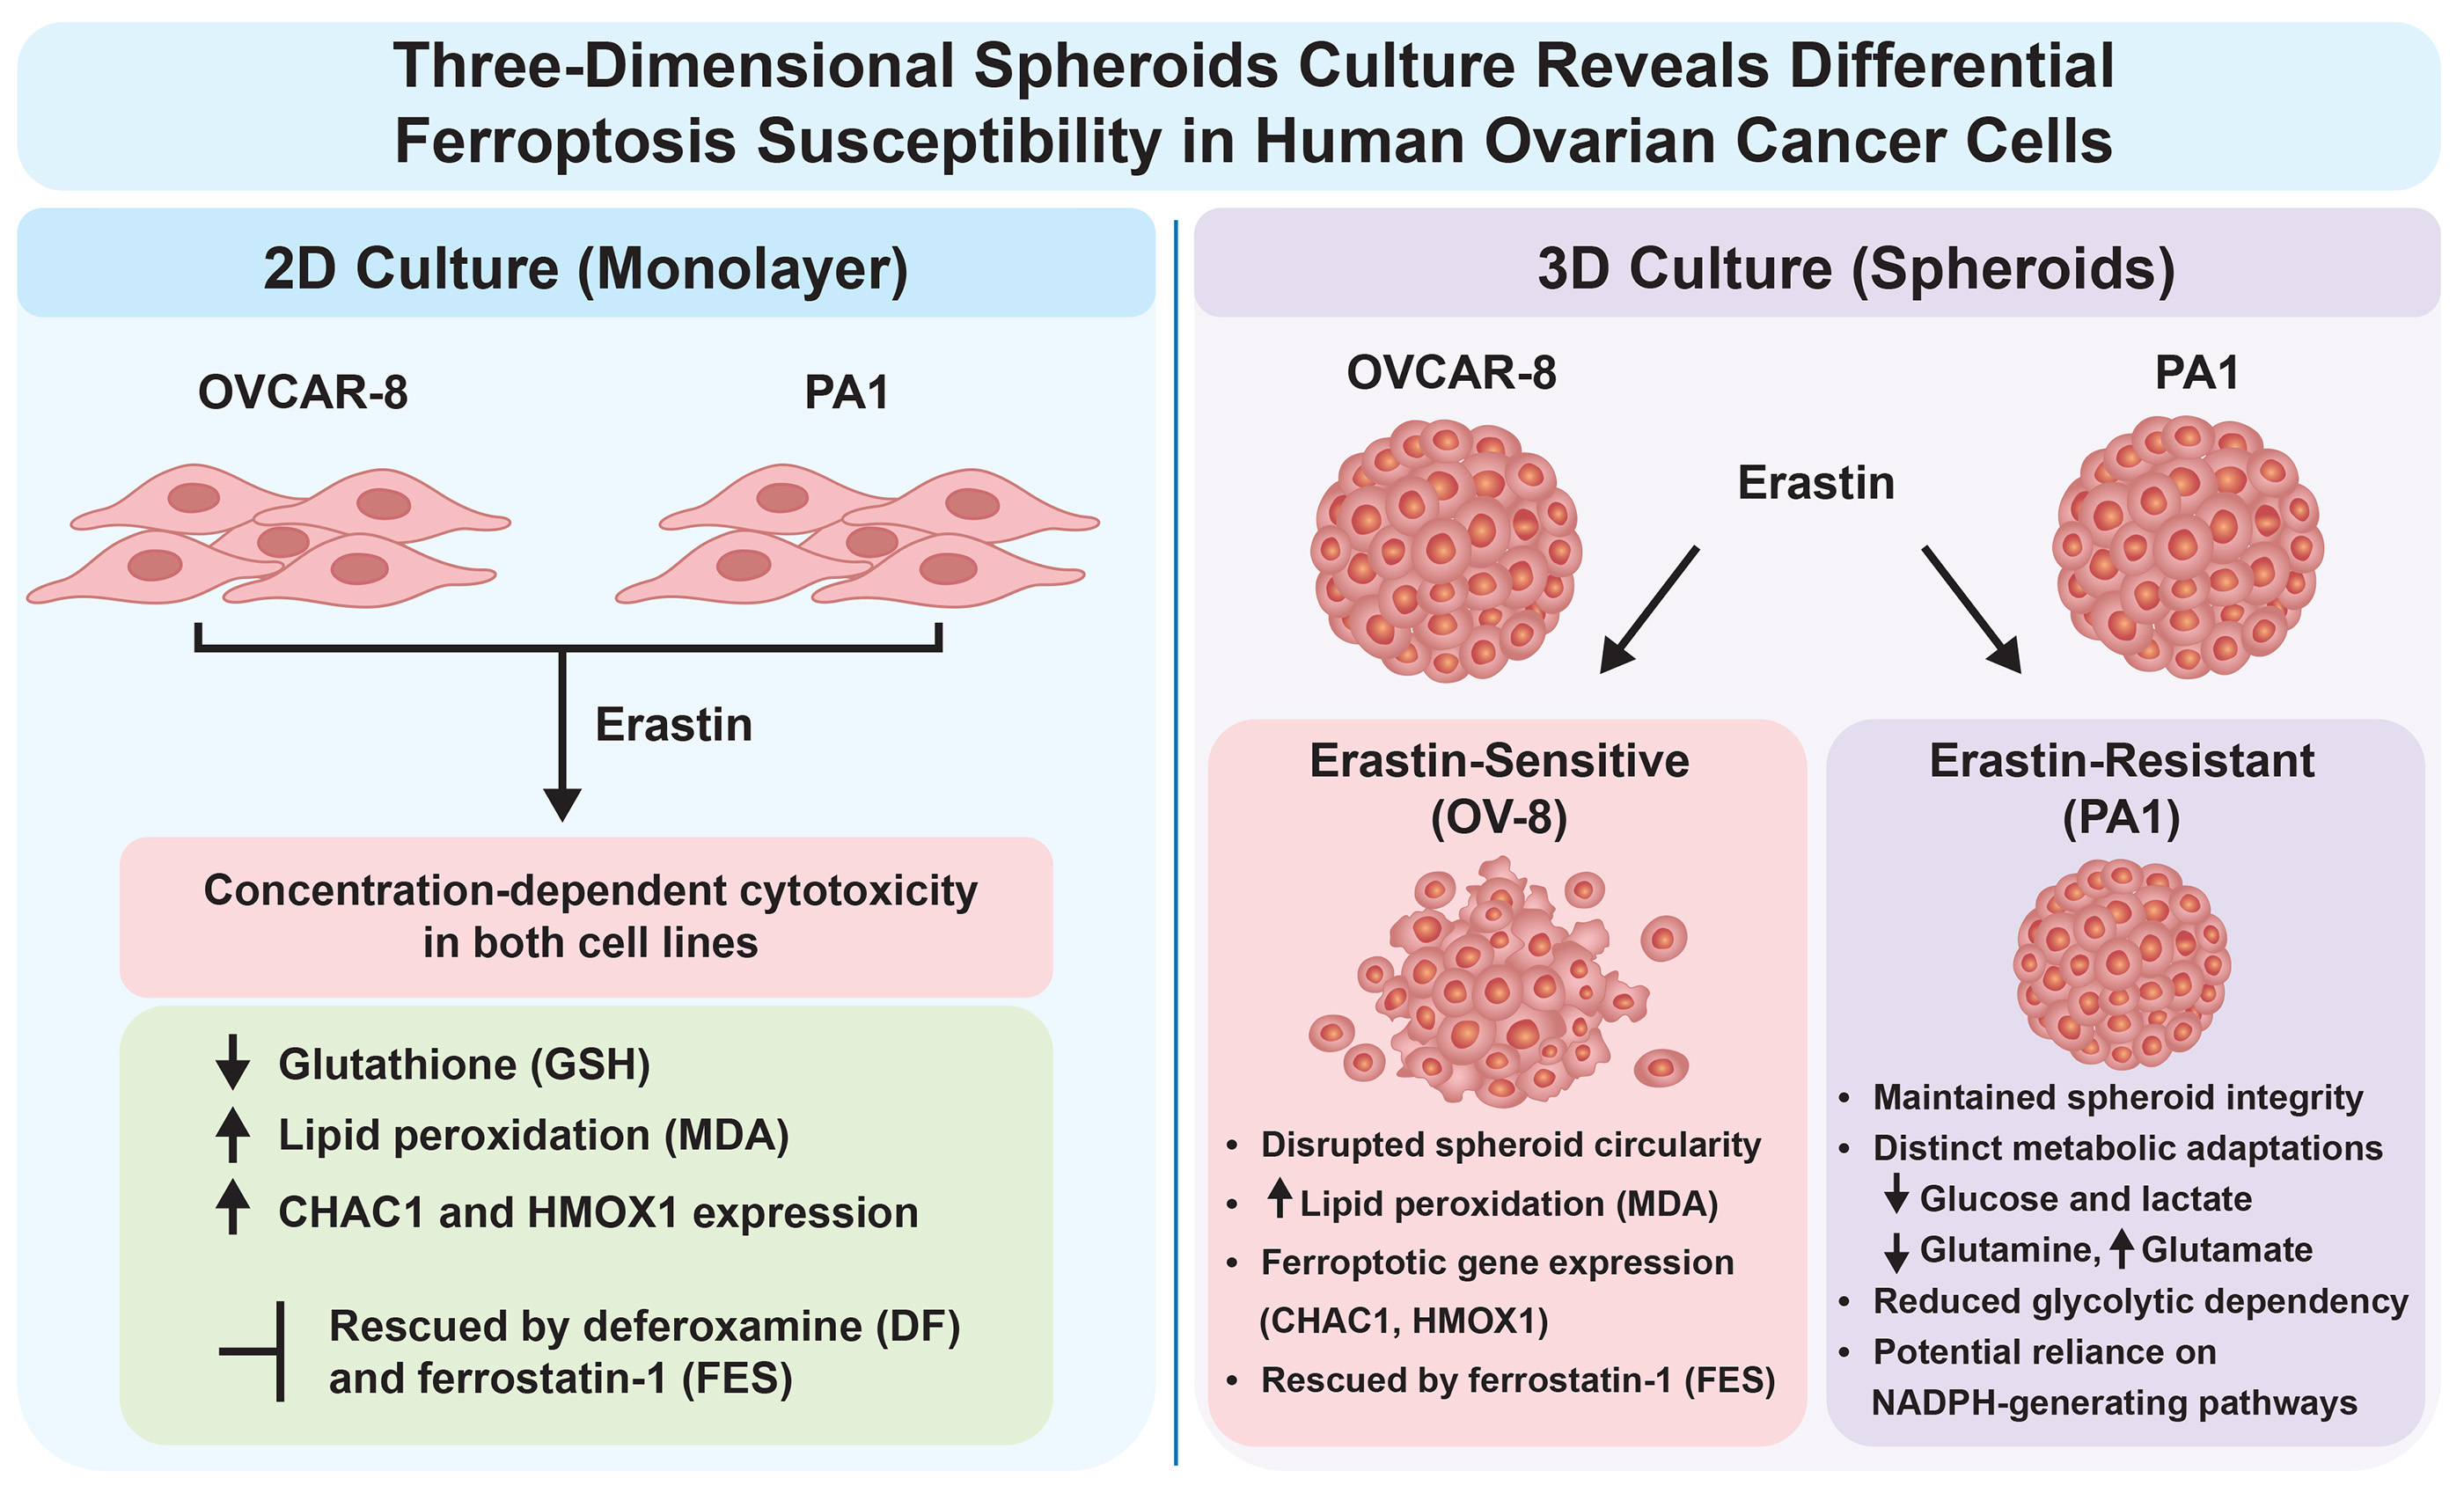
Ferroptosis, an iron-dependent form of regulated cell death driven by lipid peroxidation, represents a promising therapeutic vulnerability in recalcitrant tumors. However, standard two-dimensional (2D) monolayer models fail to reproduce the physiological architecture and metabolic constraints governing redox homeostasis in solid tumors. Here, we evaluated erastin-induced ferroptosis in OVCAR-8 (OV-8) and PA1 ovarian cancer cells cultured as 2D monolayers and three-dimensional (3D) spheroids. In 2D culture, erastin induced comparable concentration-dependent cytotoxicity in both lines, which was attenuated by deferoxamine and ferrostatin-1 (FES), and accompanied by glutathione depletion, malondialdehyde (MDA) accumulation, and upregulation of CHAC1 and HMOX1. Strikingly, 3D culture revealed a profound phenotypic divergence: OV-8 spheroids remained sensitive—displaying disrupted architecture, elevated MDA, and loss of cell viability that was rescued by ferrostatin-1—whereas PA1 spheroids acquired significant resistance to erastin. NMR-based metabolomic profiling of 2D cultures revealed that erastin induced concurrent depletion of intracellular glucose and lactate in PA1 cells, reflecting diminished glycolytic dependence and potential redirection toward NADPH-generating pathways. Concomitant glutamine depletion and glutamate accumulation suggest enhanced glutaminolysis for NADPH generation and antioxidant support. Conversely, OV-8 cells accumulated structural and alternative amino acids. These findings demonstrate that 3D tumor architecture reveals cell-line-specific redox and metabolic adaptations obscured in 2D culture, underscoring the importance of physiologically relevant models for evaluating ferroptosis-targeted therapeutics.
Keywords:
erastin
; ferroptosis
; ovarian tumor cells
; 2D culture
; 3D spheroids
; lipid peroxidation
1. Introduction
Ovarian cancer (OC) constitutes one of the most fatal gynecologic malignancies in women. Globally, it is responsible for 3.4% of all malignancies and 4.7% of cancer-related deaths among females [1]. In 2023, there were approximately 19,710 new cases and 13,270 deaths from OC in the United States alone [2,3]. Most OC patients suffer from abdominal pain or swelling, causing them to miss the optimal treatment window [4]. As a result, more than 70% of patients are diagnosed at an advanced stage and have poor prognosis. Due to tumor heterogeneity, OC is subdivided into epithelial, germ cell, and sex cord-stromal subtypes. Epithelial ovarian cancer (EOC) accounts for approximately 90% of OC and includes serous (52%), endometrioid (10%), clear cell (6%), or mucinous carcinomas (6%), with a quarter being more rare or unspecified subtypes [5]. Among them, high-grade serous ovarian cancer (HGSOC) is the most common [6,7]. The standard treatment is tumor cytoreductive surgery combined with chemotherapy. Due to their outstanding anti-tumor effects and relatively clear mechanisms of action, platinum analogues, including cisplatin, carboplatin and oxaliplatin, are widely used in the treatment of OC in the clinic [8,9]. Despite receiving standard-of-care therapy (optimal cytoreductive surgery followed by adjuvant chemotherapy), most patients develop resistance to chemotherapy, resulting in a 5-year survival rate of approximately 30–40% worldwide [1,9].
Treatment of human cancers, including ovarian cancers, requires innovative approaches due to difficulties in treating them in the clinic. Additionally, newer and better tumor model systems are needed. One of the newer models of cell death involves drug-induced generation of reactive oxygen species (ROS) which in the presence of iron leads to the formation of hydroxyl radicals [10]. Hydroxyl radicals are extremely reactive and in the presence of unsaturated lipid generate lipid radicals, leading to destruction of cellular membranes via lipid peroxidation and ultimately causing cell death, known as ferroptosis [11,12]. A number of compounds, known as ferroptosis inducing agents (FINs), cause iron-dependent death in tumor cells and have been reported to be extremely effective against a variety of tumors, including drug resistant tumors expressing ABC transporters and RAS mutated tumors [13,14,15]. Additionally, FINS have been reported to sensitize with Doxorubicin, Topotecan and cis-platin [15,16,17].
In recent years, biomedical research has shifted toward developing more clinically relevant models to study human physiology and disease [18,19]. Driven by the goal of tailoring medical interventions to individual patient characteristics, personalized medicine has gained prominence in the search for more effective, targeted treatments. Within this context, three-dimensional (3D) cell culture models—particularly spheroids—have emerged as valuable tools that bridge the gap between traditional 2D monolayer systems and in vivo tissue structures and functions [18,19]. Characterized as spherical cellular aggregates, spheroids exhibit enhanced physiological relevance by recreating the cell–cell and cell–matrix interactions found in native tissues [19]. However, while mechanisms of lipid peroxidation and iron-dependent cell death are well-characterized in traditional monolayer formats [20,21], how these pathways adapt to the complex spatial architecture of three-dimensional (3D) spheroids remains poorly understood.
In this manuscript, we describe effects of erastin (ER) in two human ovarian cell lines, OVCAR-8 (OV-8) and PA1, in 2D culture and in 3D spheroids. In 2D culture, we found that ER exhibited a similar cytotoxic profile across both OV-8 and PA1 cells and that ER induced ferroptotic cell death in both cell types as evidenced by loss of cellular GSH, MDA formation and rescue of ER cytotoxicity by deferoxamine (DFO) and Ferrostatin-1 (FES). In contrast, in 3D spheroids, PA1 cells acquired a ferroptotic-resistance phenotype (significant decrease in MDA formation and ER-dependent cell death) while OV-8 spheroid remained sensitive to ER-induced ferroptotic cell death (MDA formation and recue of toxicity by ferrostatin-1), suggesting a different metabolic-redox response in PA1 cells to ER-induced ferroptosis.
2. Materials and Methods
Erastin, (2-[1-[4-[2-(4-Chlorophenoxy)acetyl]-1-piperazinyl]ethyl]-3-(2-ethoxyphenyl)-4(3H)-quinazolinone), Ferrostatin-1 and Deferoxamine (DFO) were purchased from Cayman Chemical (Ann Arbor, MI, USA) and were dissolved in DMSO. Stock solutions were stored at −80 °C. Fresh drug solutions, prepared from the stock solutions, were used in all experiments. Primers for the selected genes were purchased from Origene (Gaithersburg, MD, USA, Table 1). Cell TiterGlo for the cytotoxicity studies was obtained from Promega (Madison, WI, USA).
2.1. Cell Culture
Authenticated human ovarian OVCAR-8 and PA1 cells (ovarian teratocarcinoma line, ATCC CRL-1572) were obtained from NCI repository and ATCC, Manassas, VA, USA, respectively. Cells were grown in Phenol Red-free RPMI 1640 media (pH = 7.0) supplemented with 10% fetal bovine serum and antibiotics. Cell cultures were incubated in an incubator at 37OC and 5% CO2 with saturating humidity. Cells were routinely used for 20-25 passages, after which the cells were discarded, and a new cell culture was started from the frozen stock.
2.2. Cytotoxicity Studies
The cytotoxicity studies were carried out with CellTiterGLO (Promega, Madison, WI, USA) or the Trypan Blue assay as described previously [20]. Briefly, for the cellTiterGlo assay, roughly 2500-3000 cells/well were seeded in opaque white, 96-well plates and allowed to attach overnight. Cells were then treated with various concentrations of ER and incubated for 72h. Following 72 h incubations, cytotoxicity of ER was determined according to the manufacturer’s instructions.
For the Trypan Blue assay for cytotoxicity, about 25,000-50,000 cells/well were seeded onto a 6-well plate (in duplicate) and allowed to attach for 18h. Various concentrations of drugs (ER or combinations of ER), and minimally cytotoxic concentrations of ferrostatin-1, (FES), or DFO were added to cells in fresh complete media (2 mL) and were incubated for 24h. When used, FES or DFO were preincubated with cells for 2 h before the addition of ER. DMSO (0.01-0.1%) was included as the vehicle control when used. Following trypsinization, surviving cells were collected and 15 µL of cell mixtures were combined with 15 µL of trypan blue and counted in a TC20 automatic cell counter (Bio-Rad, Hercules, CA, USA).
The cytotoxicity studies in 3D spheroids were carried out by seeding 2,500-3,000 cells/well in 96-well round-bottom, ultra-low attachment (ULA) microplates (black-walled/clear-bottom; Corning, Corning, NY, USA) and allowing spheroids to form following low centrifugation. Media was changed on day 3 and treatment with ER was carried out on day 5. Following the ER exposure for 72 h, 100 µl media was removed and replaced with 100 µl of Cell TiterGlo 3D (Promega, Madison, WI, USA). The mixture was incubated for 30 min with shaking at room temperature. 100 µl of lysed solution was then transferred into a ThermoFisher NucTM FluoroNucTM/LumiNucTM 96 Well plate and luminescence were measured. Effects of ferrostatin-1 on erastin cytotoxicity was similarly examined by preincubating ferrostatin-1 with spheroids for about 2-3h before ER was added. The mixtures were incubated for 24h and cytotoxicity was determined as described using Cell TiterGlo 3D.
2.3. Lipid Peroxidation Assay
Assay for the peroxidation of cellular lipids was carried out by measuring the formation of MDA using 2-thiobarbituric acid as previously published [22,23]. Briefly, about 2-2.5 x 10⁶ cells/ml in the serum free media were incubated with various concentrations of ER for 4h at 37C. Following incubations, cells were washed with ice-cold PBS, and cells were suspended in PBS. The proteins were precipitated by adding 10% trichloroacetic acid (2 mL) and the mixtures were centrifuged (5 min at x 1000g). Aliquots (1.5 mL) of the supernatant fractions were then reacted with 1.5 mL of 2% 2-thiobarbituric acid, and the chromophore was developed at 90 °C for 10 min. After the samples were cooled, the absorbance at 532 nm was determined. MDA formation in spheroids formed from OV-8 and PA1 cells was similarly examined by pooling spheroids from 96 wells, washed with PBS and then suspended in serum free media and treated with ER for 4 h at 37 °C.
2.4. Reverse Transcription Quantitative PCR
The expression levels of selected transcripts were examined by real-time polymerase chain reaction (RT-PCR) using absolute SYBR green ROX Mix (ThermoFisher Scientific, Rochester, NY, USA) as previously described [24]. Cells (1 x 10⁶, OV-8 and PA1) were treated with ER (5 µM) for 24h. Total RNA was isolated using Trizol following treatment with ER and purified using silica-membrane spin-column kits. Similarly, RNA was isolated and purified from 3D spheroids of OV-8 and PA1 cells following treatment with ER (5.0 µM). Data were analyzed using ΔΔCt method of relative quantification in which cycle times were normalized to β-actin from the same sample. Primers for the selected genes were purchased from Origene (Gaithersburg, MD, USA, Table 1). All real-time fluorescence detection was carried out on an iCycler (Bio-Rad, Hercules, CA, USA). Experiments were carried out three different times and results are expressed as the mean ± SEM. Analyses were performed using unpaired Student’s t-test and considered significant when p <0.05.
2.5. Metabolomic Studies Using NMR
For metabolomic studies both OV-8 and PA1 cells were grown to 70-80% confluency (in quadruplicates, 1 x 10⁶ cells) and treated with ER (5 µM) for 24h. Following treatment, cells were washed (x 2) with ice-cold PBS and extracted with 75% analytical grade ethanol and stored at -80C. Frozen cells were disrupted with a microsonicator tip for 2 bursts of 15s, with the tubes kept in an ice bath. Samples were centrifuged at 2000 x g at 4C for 30 minutes. The supernatant was removed to clean tubes and dried in a speed vac for 1.5 h at 50C. Dried samples were kept frozen until rehydrated. 550 µL of NMR sample buffer (2H-phosphate buffered saline, 1.5 mM Azide, 100 uM Trimethylsilypropanesulfonate) was added to the dried samples before NMR. NMR µspectra were acquired on an 800 MHz Agilent DD2 console equipped with a cryogenically cooled probe. A 1-dimensional NOESY sequence with 4s acquisition time, 1s recycle delay, 256 transients and 100 ms mixing time was used. Resonance assignment and individual metabolite profiling were executed using Chenomx NMR Suite software (Chenomx Inc., Edmonton, Alberta, Canada). Downstream multivariate processing, cube-root transformations, Pareto scaling, and hierarchical clustering visualization were executed utilizing the Viime platform ([25].
Statistical Analysis: The results are expressed as mean ± SEM of minimum of 3 independent experiments. One-way analysis of variance (ANOVA) or Student’s t-test was used for statistical analysis using Graph Pad Prism 10.2 (GraphPad Software, Inc, Boston, MA, USA). For multiple comparisons, the Tukey Multiple comparison test was utilized and were considered statistically significant when p < 0.05.
3. Results
3.1. Cytotoxicity Studies with Erastin in 2D Culture
Previous studies have shown that ER is cytotoxic to human ovarian tumor cells [23]. In this study, ER was found to be highly cytotoxic to both human OV-8 and PA1 cells and exhibited a comparable cytotoxic profile across both OV-8 and PA1 cells, showing no statistically significant differences (Figure 1).
3.2. Effects of DFO and Ferrostatin-1 on Erastin Cytotoxicity
As ER is a known inducer of ferroptosis, we used both DFO and FES, inhibitors of ferroptosis [26,27,28] to evaluate ER cytotoxicity in OV-8 PA1 cells cell lines. As shown in Figure 2, both DFO and FES significantly attenuated ER cytotoxicity in both cells. At higher concentrations, DFO was found to be extremely cytotoxic in these cells, indicating that the DFO toxicity is consistent with an important requirement for iron homeostasis in ovarian tumor cells. These results further suggest that ER mediates cellular death through ferroptosis in OV-8 and PA1 cells.
3.3. ER Induces Lipid Peroxidation in OV-8 and PA1 Cells in 2D Culture
Formation of lipid peroxides by ER in OV-8 and PA1 cells was examined following treatment with various concentrations of ER. A significant amount of lipid peroxidation was detected, measured as MDA, in both cell lines. Formation of MDA was dose-dependent in both cell lines (Figure 3).
3.4. RT-PCR Studies
Gene expression changes following ER treatment of OV-8 and PA1cells were examined using RT-PCR methods. Examinations of the expression levels of markers associated with oxidative stress and ferroptosis [23] at 24 h is shown in Figure 4A. We found that CHAC1 and HMOX1 genes, indicators of oxidative stress and ferroptosis, were significantly induced by ER in both OV-8 and PA1 cell lines. Furthermore, ER treatment also significantly down-regulated GPX4, indicating GPX4 may be involved in ER-induced cell death. However, SLC7A11 gene was not affected by ER in either cell lines. COX2 gene, also known as PTGS, was significantly induced by ER in OV-8 cells while it was not affected in PA1 cells. ER also significantly modulated transferrin receptor gene TFRC in both cell lines, indicating involvement of iron in cell death.
3.5. Metabolomic Study Using NMR in 2D Culture
To elucidate the underlying biochemical alterations driving ER-induced ferroptosis—and to uncover potential survival networks—we conducted high-field NMR-guided metabolomic analyses following 24 hours of ER treatment. Multivariate analysis and hierarchical clustering revealed distinct, cell-line-dependent metabolic profiles between OV-8 and PA1 cells; specifically, these models exhibited a dramatic divergence in how they process carbohydrate and amino acid resources under intense oxidative strain. As shown in Figure 5 and Figure 6, ER treatment reduced GSH levels in both cell lines, with a statistically significant decrease observed in OV-8 cells (ANOVA, p < 0.05). In PA1 cells, GSH levels also showed a decrease following ER treatment, however; this change did not reach statistical significance (p < 0.4).
Additionally, intracellular glutamate accumulated significantly in the ER-treated group (shown in green) in both cell lines (p< 0.05). Unlike traditional hyper-glycolytic responses where a decrease in glucose is mirrored by an accumulation of extracellular lactate (Warburg effect), ER treatment of PA1 cells triggered a simultaneous depletion of both intracellular glucose and lactate. While further studies are required to definitively map these fluxes, this concurrent depletion suggests a non-glycolytic routing of carbohydrate resources, potentially shifting glucose utilization toward alternative survival pathways to combat oxidative stress. Intracellular glutamine is also significantly depleted (shown in green) in PA1 cells following ER treatment. This may suggest that PA1 cells are actively consuming glutamine (converting it to glutamate via glutaminolysis) to maintain mitochondrial energy output during ER-induced stress [29]. In contrast, in OV-8 cells, ER treatment increased proline, alanine, branched amino acids (isoleucine and leucine) and glycerol-3-phosphocholine, indicating differential effects of ER in this cell line (Figure 5).
3.6. Studies in 3D Spheroids
To further elucidate and understand the mechanisms of ER-induced ferroptosis in ovarian cells, we carried out studies in spheroids formed from OV-8 and PA1 cells as spheroids provide a closer representation of the native tissue microenvironment than 2D culture.
3.7. Cytotoxicity of Erastin in OVCAR-8 and PA1 Spheroids
Figure 7 shows bright light images of spheroids formed from OV-8 and PA1 cells and the cytotoxicity of ER in spheroids.
To determine whether the cell-line-dependent cytotoxic effects of ER were accompanied by structural alterations in three-dimensional architecture, we performed a quantitative morphometric analysis of OV-8 and PA1 spheroids following 72 h of ER treatment. Spheroid structural integrity and shape deformation were evaluated by calculating the circularity index using the standard geometric formula:
where, A is the area of the spheroid cross section and P is the perimeter of the spheroid boundary length. In this index, a value approaching 1.0 indicates a perfectly uniform, spherical aggregate, whereas decreasing values reflect structural fragmentation, cell shedding, or irregular boundary deformation.
Circularity Index = 4πA /P2
Both human OV-8 and PA1 cells successfully self-assembled into dense, highly symmetric three-dimensional aggregates with equivalent baseline circularity indices of approximately 0.88 (Figure 7C). However, following treatment with ER, a significant divergence in morphological stability emerged between OV-8 and PA1 cell spheroids, similar to the cell viability profiles. OV-8 cell spheroids, sensitive to ER, showed a concentration-dependent structural disruption and the highest concentration of ER, the circularity index dropped from the 0.88 baseline down to a mean value of 0.69 (Figure 7C). This drop in circularity was accompanied with noticeable degradations and loss of a defined boundary, a swelling appearance, and extensive cell shedding from the outer rim of the aggregate (Figure 7A). In contrast, the ER-resistant PA1 cell spheroids demonstrated no significant morphological changes. Even at the highest concentrations of ER, PA1 cell spheroids maintained tightly packed structural core and the circularity index for PA1 cell spheroids remained statistically unchanged from baseline, and remained steady at approximately 0.87 (Figure 7C,B).
3.8. Ferrostatin-1 Attenuates Erastin Cytotoxicity in OV-8 Spheroids
Preincubation of ferrostatin-1 with OV-8 spheroids significantly attenuated ER cytotoxicity as noted with 2D culture model (Figure 7E). However, assessment of ferrostatin-1 could not be carried out in PA1 cell 3D spheroids as they showed significant resistance to ER.
3.9. Erastin-dependent Lipid Peroxidation in OV-8 Spheroids
Formation of lipid peroxides by ER in OV-8 and PA1 cell spheroids was also examined following treatment with ER. While significant amounts of lipid peroxidation were detected in OV-8 spheroids (Figure 7F) no significant MDA was detected in PA1 cell spheroids.
3.10. RT-PCR Studies in Ovarian Cell Spheroids
Gene expression changes following ER treatment of spheroids of OV-8 and PA1 cells showed significant differences compared to gene expression to 2D culture model of as shown in Figure 4B. We found that the expressions of CHAC1 and HMOX1 genes, indicators of oxidative stress and ferroptosis, remained elevated only in OV-8 spheroids. In contrast, these genes were significantly muted/reduced in PA1 cell spheroids. ER treatment significantly down-regulated GPX4 in OV-8 cell spheroids in contrast to PA1 spheroids, indicating GPX4 may be involved in ER-induced cell death in OV-8 spheroids. SLC7A11 gene showed a robust increase by ER in OV-8 spheroids compared to PA1 cell spheroids. COX2 gene was significantly induced by ER in OV-8 cell spheroids while it was not affected in PA1 cell spheroids. ER also significantly increased TFRC gene expression in OV-8 cell spheroids without significantly effecting it in PA1 cell spheroids, indicating iron played a part in cell death in OV-8 spheroids.
4. Discussion
The principal finding of this study is that cellular organization profoundly influences susceptibility to ER-induced ferroptotic stress in ovarian cancer cells. OVCAR-8 and PA1 cells showed broadly comparable ER sensitivity in conventional 2D culture, with pharmacologic rescue, lipid peroxidation, GSH depletion, and ferroptosis-associated transcriptional responses supporting ferroptotic cell death in both lines. In contrast, their responses diverged markedly in 3D culture: OV-8 cell spheroids retained ER sensitivity, whereas PA1 cell spheroids displayed a resistant phenotype. This divergence emphasizes that ferroptosis susceptibility measured in monolayer culture may not predict responses in a more spatially organized tumor model.
In 2D culture, ER-induced cytotoxicity was attenuated by both DFO and FES. Because DFO limits iron availability and FES traps lipid radicals, protection by these mechanistically distinct agents supports an iron- and lipid-peroxidation-dependent component of ER-induced cell death. Consistent with this interpretation, ER increased MDA formation in both cell lines. These biochemical and pharmacologic findings were accompanied by decreased GSH and changes in ferroptosis- and oxidative stress-associated transcripts, including GPX4, CHAC1, HMOX1, and TFRC.
NMR guided metabolomic studies carried out in 2D culture further support ferroptosis mediated cell death as ER treatment significantly decreased cellular GSH in OV-8 cells, albeit less so in PA1 cells. Furthermore, ER treatment significantly accumulated intracellular glutamate in both cell lines, suggesting that ER blocked the export pathway (Xc-), trapping glutamate inside the cells. The metabolic divergence unmasked by our NMR profiling in 2D culture provides a highly plausible, though currently hypothetical, framework for the intrinsic ferroptosis resistance observed in PA1 spheroids. The simultaneous collapse of glucose and lactate pools under ER stress suggests that glycolysis is not being accelerated to generate ATP. Instead, we hypothesize that these carbon resources are actively diverted toward the pentose phosphate pathway (PPP). This proposed pathway shift would theoretically allow the resistant cells to maximize the generation of NADPH [30], a vital cofactor required to fuel the glutathione-dependent and independent antioxidant systems protecting the cellular lipidome from peroxidation. This metabolic adaptation model is further supported by the concomitant exhaustion of glutamine and accumulation of glutamate, implying a coordinated mobilization of glutaminolysis [31] to sustain mitochondrial maintenance while primary glucose networks are re-routed. However, our present metabolomic measurements do not establish pathway flux. Additional work such as isotope-tracing or complementary functional studies would be required to determine whether specific pathways such as the pentose phosphate pathway, glutaminolysis, or mitochondrial metabolism directly mediate the observed responses. In contrast, in OV-8 cells, ER treatment increased proline, alanine, branched amino acids (isoleucine and leucine) and glycerol-3-phosphocholine, indicating totally different divergent effects of ER in this cell line (Figure 5).
The most striking difference emerged after growth as 3D spheroids. OV-8 spheroids remained sensitive to ER, showed increased MDA formation, and were protected by ferrostatin-1. In contrast, PA1 spheroids maintained high viability across the ER concentration range and showed little or no detectable MDA response. The morphometric data provide an independent structural correlate of this divergence: high-dose ER significantly reduced OV-8 spheroid circularity, whereas PA1 spheroids largely maintained their morphology. Together, these findings indicate that PA1 cells acquire a robust ER-resistant phenotype in the 3D state rather than being intrinsically resistant under all culture conditions.
The transcriptional data are consistent with this phenotypic divergence. In OV-8 cell spheroids, ER maintained strong induction of CHAC1 and HMOX1, decreased GPX4, and increased SLC7A11 and TFRC. These responses were substantially attenuated in PA1 spheroids. Although changes in transcript abundance do not by themselves define ferroptosis, their concordance with viability, FES rescue, and MDA formation strengthens the conclusion that the two spheroid models experience different levels of ferroptotic stress.
Several features of the 3D microenvironment could contribute to the PA1-resistant phenotype. Spheroid architecture alters cell-cell contact, nutrient and oxygen availability, redox state, and metabolic organization, any of which could modify cystine utilization, GSH homeostasis, lipid composition, iron handling, or antioxidant capacity. The present study was not designed to identify the specific mechanism responsible for PA1 resistance, and this remains an important question for future investigation. Direct measurements of lipid ROS, GSH/GSSG and NADPH redox state, GPX4 protein/activity, iron pools, and metabolic flux in matched 2D and 3D cultures would help distinguish between these possibilities.
These findings have implications for the experimental evaluation of ferroptosis-based anticancer strategies. Conventional 2D culture identified both OV-8 and PA1 cells as ER-sensitive, whereas 3D culture revealed a resistance phenotype that would otherwise have been missed. The cell-line-dependent divergence in erastin sensitivity observed here highlights a critical challenge in translating ferroptosis-inducing therapies, a bottleneck previously discussed regarding intrinsic cellular antioxidant defenses [21]. Thus, incorporating 3D tumor models may improve identification of context-dependent ferroptosis resistance and provide a more stringent platform for evaluating ferroptosis-inducing agents and combination therapies. In summary, our data demonstrate that OV-8 and PA1 ovarian cancer cells respond similarly to erastin in 2D culture but diverge markedly in 3D spheroids, with PA1 acquiring resistance while OV-8 remains ferroptosis-sensitive.
5. Conclusions
This study establishes that three-dimensional tumor architecture profoundly alters the cellular redox state, unmasking cell-line-specific metabolic networks that govern ferroptosis susceptibility in ovarian cancer. While erastin induces uniform glutathione depletion, lipid peroxidation, and ferroptotic cell death in conventional 2D monolayers, growth in 3D spheroids reveals a sharp phenotypic divergence: OVCAR-8 spheroids remain highly sensitive to erastin-driven oxidative stress, whereas PA1 spheroids acquire a significant resistance phenotype. High-field NMR profiling in 2D culture suggests this acquired resistance may be due to non-glycolytic routing of carbohydrate resources and active glutaminolysis to potentially fuel NADPH-generating pathways under intense oxidative duress. Consequently, definitive elucidation of these adaptive antioxidant responses requires future functional flux analyses, specifically isotope-tracing studies of the pentose phosphate pathway and mitochondrial metabolism. Ultimately, these findings demonstrate that traditional 2D screening can entirely obscure context-dependent survival mechanisms, establishing 3D spheroid models as an essential, high-stringency validation platform for the translation of redox-targeted cancer therapeutics.
Author Contributions
Authors also acknowledge use of AI for editing, improving language, readability and organization of the manuscript.
Funding
Authors declare that financial support was received for research and publication by the intramural research program (grant number CARCI-HEI # and ZIC-ES-103362 GAM) of the National Institute of Environmental Health Sciences, NIH. Statements contained herein do not necessarily represent the statements, opinions, or conclusions of NIEHS, NIH, or the US Government.
Institutional Review Board Statement
Not applicable.
Informed Consent Statement
Not applicable.
Data Availability Statement
Data are contained within the manuscript and are available upon request.
Acknowledgments
Authors would like to thank Drs. Sydney Bony and Ryan Olsen for critical review of the manuscript.
Conflicts of Interest
The authors declare no actual or potential conflicts of interest.
Abbreviations
ROS, reactive oxygen species; 170; ER, Erastin, 2-[1-[4-[2-(4-Chlorophenoxy)acetyl]-1-piperazinyl]ethyl]-3-(2-ethoxyphenyl)-4(3H)-quinazolinone; FES, Ferrostatin-1; MDA, Malondialdehyde; GSH, Glutathione; HMOX1/OX1; Heme Oxygenase 1; CHAC1, Glutathione Specific Gamma-Glutamylcyclotransferase 1; GPX4, Glutathione Peroxidase 4; RT-PCR, real-time polymerase chain reaction.
References
- Sung, H.; Ferlay, J.; Siegel, R.L.; Laversanne, M.; Soerjomataram, I.; Jemal, A.; Bray, F. Global Cancer Statistics 2020: GLOBOCAN Estimates of Incidence and Mortality Worldwide for 36 Cancers in 185 Countries. CA Cancer J. Clin. 2021, 71, 209–249. [Google Scholar] [CrossRef] [PubMed]
- Siegel, R.L.; Miller, K.D.; Wagle, N.S.; Jemal, A. Cancer statistics, 2023. CA Cancer J. Clin. 2023, 73, 17–48. [Google Scholar] [CrossRef] [PubMed]
- Siegel, R.L.; Kratzer, T.B.; Giaquinto, A.N.; Sung, H.; Jemal, A. Cancer statistics, 2025. CA Cancer J. Clin. 2025, 75, 10–45. [Google Scholar] [CrossRef] [PubMed]
- Goff, B.A.; Mandel, L.S.; Melancon, C.H.; Muntz, H.G. Frequency of symptoms of ovarian cancer in women presenting to primary care clinics. JAMA 2004, 291, 2705–2712. [Google Scholar] [CrossRef]
- Pei, J.; Qiu, H.; Wang, W.; Wang, Y.; Wang, M.; Wang, D.; Li, J.; Qin, Y. The Contribution and Perspectives of Proteomics to Epithelial Ovarian Cancer. Proteom. Clin. Appl. 2025, 19, e202300220. [Google Scholar] [CrossRef] [PubMed]
- Torre, L.A.; Trabert, B.; DeSantis, C.E.; Miller, K.D.; Samimi, G.; Runowicz, C.D.; Gaudet, M.M.; Jemal, A.; Siegel, R.L. Ovarian cancer statistics, 2018. CA Cancer J. Clin. 2018, 68, 284–296. [Google Scholar] [CrossRef] [PubMed]
- Wang, Y.; Duval, A.J.; Adli, M.; Matei, D. Biology-driven therapy advances in high-grade serous ovarian cancer. J. Clin. Invest 2024, 134. [Google Scholar] [CrossRef] [PubMed]
- Tchounwou, P.B.; Dasari, S.; Noubissi, F.K.; Ray, P.; Kumar, S. Advances in Our Understanding of the Molecular Mechanisms of Action of Cisplatin in Cancer Therapy. J. Exp. Pharmacol. 2021, 13, 303–328. [Google Scholar] [CrossRef] [PubMed]
- Marques, C.; Ferreira da Silva, F.; Sousa, I.; Nave, M. Chemotherapy-free treatment of recurrent advanced ovarian cancer: myth or reality? Int. J. Gynecol. Cancer 2023, 33, 607–618. [Google Scholar] [CrossRef] [PubMed]
- Goldstein, S.; Meyerstein, D.; Czapski, G. The Fenton reagents. Free Radic. Biol. Med. 1993, 15, 435–445. [Google Scholar] [CrossRef] [PubMed]
- Dixon, S.J.; Lemberg, K.M.; Lamprecht, M.R.; Skouta, R.; Zaitsev, E.M.; Gleason, C.E.; Patel, D.N.; Bauer, A.J.; Cantley, A.M.; Yang, W.S.; et al. Ferroptosis: an iron-dependent form of nonapoptotic cell death. Cell 2012, 149, 1060–1072. [Google Scholar] [CrossRef] [PubMed]
- Gaschler, M.M.; Stockwell, B.R. Lipid peroxidation in cell death. Biochem Biophys. Res. Commun. 2017, 482, 419–425. [Google Scholar] [CrossRef] [PubMed]
- Zhou, H.H.; Chen, X.; Cai, L.Y.; Nan, X.W.; Chen, J.H.; Chen, X.X.; Yang, Y.; Xing, Z.H.; Wei, M.N.; Li, Y.; et al. Erastin Reverses ABCB1-Mediated Docetaxel Resistance in Ovarian Cancer. Front Oncol. 2019, 9, 1398. [Google Scholar] [CrossRef] [PubMed]
- Frye, W.J.E.; Huff, L.M.; Gonzalez Dalmasy, J.M.; Salazar, P.; Carter, R.M.; Gensler, R.T.; Esposito, D.; Robey, R.W.; Ambudkar, S.V.; Gottesman, M.M. The multidrug resistance transporter P-glycoprotein confers resistance to ferroptosis inducers. Cancer Drug Resist 2023, 6, 468–480. [Google Scholar] [CrossRef] [PubMed]
- Perera, L.; Brown, S.M.; Silver, B.B.; Tokar, E.J.; Sinha, B.K. Ferroptosis Inducers Erastin and RSL3 Enhance Adriamycin and Topotecan Sensitivity in ABCB1/ABCG2-Expressing Tumor Cells. Int. J. Mol. Sci. 2025, 26. [Google Scholar] [CrossRef] [PubMed]
- Cheng, Q.; Bao, L.; Li, M.; Chang, K.; Yi, X. Erastin synergizes with cisplatin via ferroptosis to inhibit ovarian cancer growth in vitro and in vivo. J. Obstet. Gynaecol. Res. 2021, 47, 2481–2491. [Google Scholar] [CrossRef] [PubMed]
- Huang, W.; Guo, Y.; Qian, Y.; Liu, X.; Li, G.; Wang, J.; Yang, X.; Wu, M.; Fan, Y.; Luo, H.; et al. Ferroptosis-inducing compounds synergize with docetaxel to overcome chemoresistance in docetaxel-resistant non-small cell lung cancer cells. Eur. J. Med. Chem. 2024, 276, 116670. [Google Scholar] [CrossRef] [PubMed]
- Duval, K.; Grover, H.; Han, L.H.; Mou, Y.; Pegoraro, A.F.; Fredberg, J.; Chen, Z. Modeling Physiological Events in 2D vs. 3D Cell Culture. Physiology 2017, 32, 266–277. [Google Scholar] [CrossRef] [PubMed]
- Kerslake, R.; Belay, B.; Panfilov, S.; Hall, M.; Kyrou, I.; Randeva, H.S.; Hyttinen, J.; Karteris, E.; Sisu, C. Transcriptional Landscape of 3D vs. 2D Ovarian Cancer Cell Models. Cancers 2023, 15. [Google Scholar] [CrossRef] [PubMed]
- Silver, B.B.; Murphy, C.; Tokar, E.J.; Sinha, B.K. Ferroptosis Suppressor Protein 1 (FSP1)-CoQ10-NADPH-Axis Is Responsible for Erastin Resistance in MCF-7 Breast Cancer Cells. Antioxidants 2026, 15. [Google Scholar] [CrossRef] [PubMed]
- Sinha, B.K. Ferroptosis Resistance: Redundant Antioxidant Networks Are a Barrier to Cancer Therapy. Antioxidants 2026, 15. [Google Scholar] [CrossRef] [PubMed]
- Mimnaugh, E.G.; Kennedy, K.A.; Trush, M.A.; Sinha, B.K. Adriamycin-enhanced membrane lipid peroxidation in isolated rat nuclei. Cancer Res. 1985, 45, 3296–3304. [Google Scholar] [PubMed]
- Sinha, B.K.; Murphy, C.; Brown, S.M.; Silver, B.B.; Tokar, E.J.; Bortner, C.D. Mechanisms of Cell Death Induced by Erastin in Human Ovarian Tumor Cells. Int. J. Mol. Sci. 2024, 25, 8666. [Google Scholar] [CrossRef] [PubMed]
- Sinha, B.K.; Tokar, E.J.; Bortner, C.D. Molecular Mechanisms of Cytotoxicity of NCX4040, the Non-Steroidal Anti-Inflammatory NO-Donor, in Human Ovarian Cancer Cells. Int. J. Mol. Sci. 2022, 23. [Google Scholar] [CrossRef] [PubMed]
- Choudhury, R.; Beezley, J.; Davis, B.; Tomeck, J.; Gratzl, S.; Golzarri-Arroyo, L.; Wan, J.; Raftery, D.; Baumes, J.; O’Connell, T.M. Viime: Visualization and Integration of Metabolomics Experiments. J. Open Source Softw. 2020, 5. [Google Scholar] [CrossRef] [PubMed]
- Li, Y.; Zeng, X.; Lu, D.; Yin, M.; Shan, M.; Gao, Y. Erastin induces ferroptosis via ferroportin-mediated iron accumulation in endometriosis. Hum. Reprod. 2021, 36, 951–964. [Google Scholar] [CrossRef] [PubMed]
- Miotto, G.; Rossetto, M.; Di Paolo, M.L.; Orian, L.; Venerando, R.; Roveri, A.; Vuckovic, A.M.; Bosello Travain, V.; Zaccarin, M.; Zennaro, L.; et al. Insight into the mechanism of ferroptosis inhibition by ferrostatin-1. Redox Biol. 2020, 28, 101328. [Google Scholar] [CrossRef] [PubMed]
- Liu, P.; Feng, Y.; Li, H.; Chen, X.; Wang, G.; Xu, S.; Li, Y.; Zhao, L. Ferrostatin-1 alleviates lipopolysaccharide-induced acute lung injury via inhibiting ferroptosis. Cell Mol. Biol. Lett. 2020, 25, 10. [Google Scholar] [CrossRef] [PubMed]
- Yoo, H.C.; Yu, Y.C.; Sung, Y.; Han, J.M. Glutamine reliance in cell metabolism. Exp. Mol. Med. 2020, 52, 1496–1516. [Google Scholar] [CrossRef] [PubMed]
- TeSlaa, T.; Ralser, M.; Fan, J.; Rabinowitz, J.D. The pentose phosphate pathway in health and disease. Nat. Metab. 2023, 5, 1275–1289. [Google Scholar] [CrossRef] [PubMed]
- Jin, L.; Alesi, G.N.; Kang, S. Glutaminolysis as a target for cancer therapy. Oncogene 2016, 35, 3619–3625. [Google Scholar] [CrossRef] [PubMed]
Figure 1.
Concentration-dependent cytotoxicity of erastin in OV-8 and PA1 cells following 72 h of treatment. Data are expressed as percent cell survival relative to untreated controls.
Figure 1.
Concentration-dependent cytotoxicity of erastin in OV-8 and PA1 cells following 72 h of treatment. Data are expressed as percent cell survival relative to untreated controls.
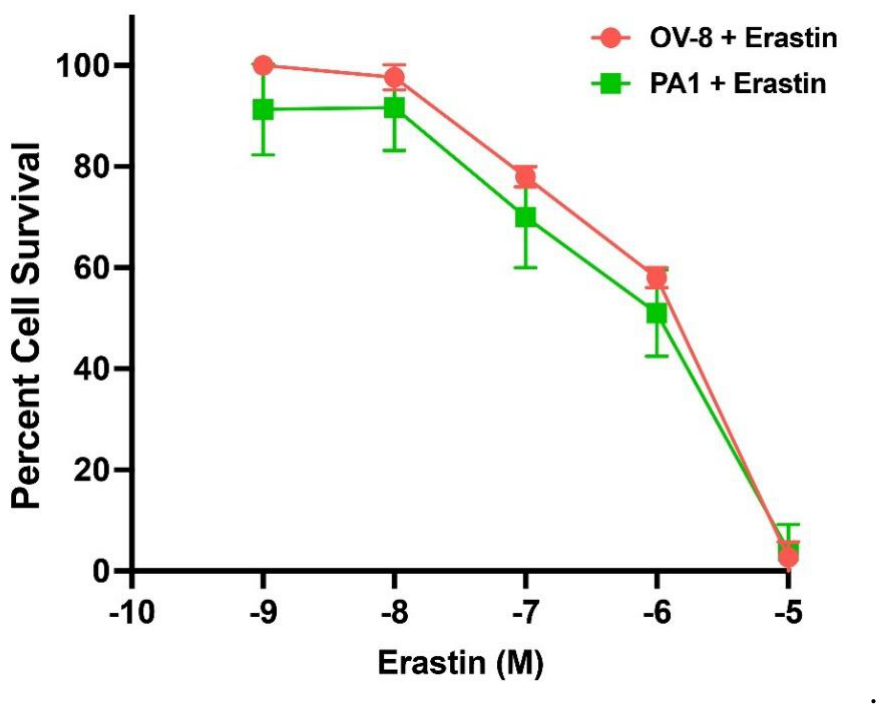
Figure 2.
Effects of deferoxamine (DFO) and ferrostatin-1 (FES) on erastin cytotoxicity in 2D ovarian cancer cells. DFO cytotoxicity was evaluated in OV-8 (A) and PA1 (D) cells. The effects of DFO (10 µM) and FES (5 µM) on erastin cytotoxicity were examined in OV-8 (B, C) and PA1 (E, F), respectively. DFO or FES was added 2 h before erastin, and cells were incubated for an additional 24 h before viability determination. Statistical symbols are as indicated in the panels. **, *** p values <0.005 and <0.001 respectively, compared to untreated control. #, ## and ### p values, <0.05, 0.005 and 0.001, respectively verses the corresponding ER-only groups.
Figure 2.
Effects of deferoxamine (DFO) and ferrostatin-1 (FES) on erastin cytotoxicity in 2D ovarian cancer cells. DFO cytotoxicity was evaluated in OV-8 (A) and PA1 (D) cells. The effects of DFO (10 µM) and FES (5 µM) on erastin cytotoxicity were examined in OV-8 (B, C) and PA1 (E, F), respectively. DFO or FES was added 2 h before erastin, and cells were incubated for an additional 24 h before viability determination. Statistical symbols are as indicated in the panels. **, *** p values <0.005 and <0.001 respectively, compared to untreated control. #, ## and ### p values, <0.05, 0.005 and 0.001, respectively verses the corresponding ER-only groups.
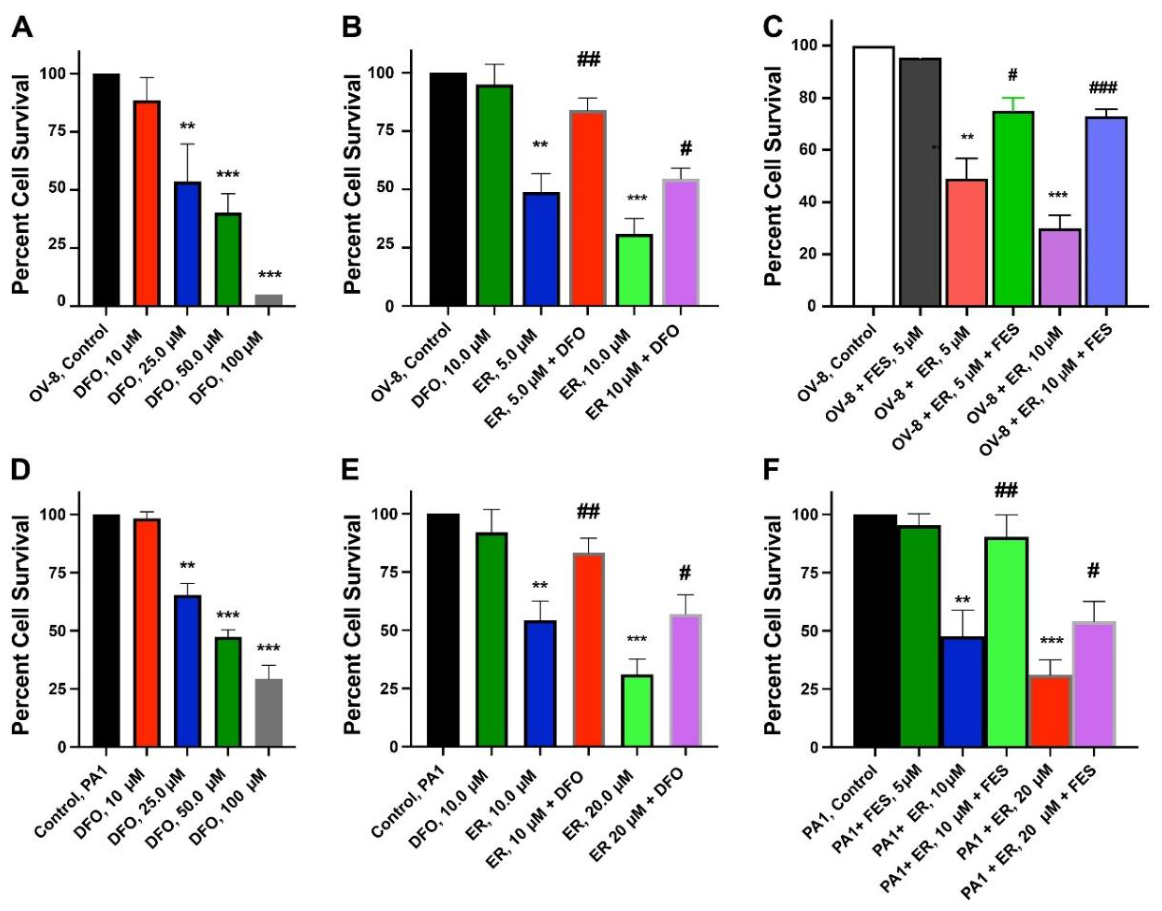
Figure 3.
Erastin-induced lipid peroxidation in OV-8 and PA1 cells. Cells were treated with the indicated concentrations of erastin for 4 h, and malondialdehyde (MDA) formation was measured by absorbance at 532 nm. *** p values <0.001, verses untreated control. # compared to PA1, 10 µM vs PA1, 20 µM.
Figure 3.
Erastin-induced lipid peroxidation in OV-8 and PA1 cells. Cells were treated with the indicated concentrations of erastin for 4 h, and malondialdehyde (MDA) formation was measured by absorbance at 532 nm. *** p values <0.001, verses untreated control. # compared to PA1, 10 µM vs PA1, 20 µM.
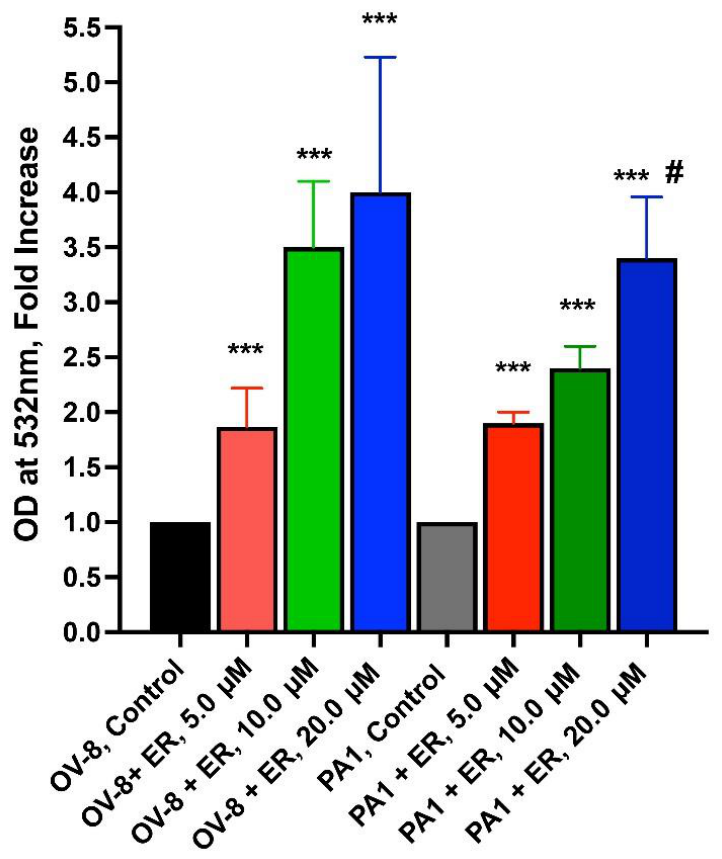
Figure 4.
Effects of erastin (5.0 µM, 24 h) on oxidative stress- and ferroptosis-related gene expression in OV-8 and PA1 cells grown in 2D culture (A) or as 3D spheroids (B). Transcript levels were determined by real-time RT-PCR and normalized to β-actin. *, **, and *** indicate p < 0.05, p < 0.005, and p < 0.001, respectively, versus the corresponding untreated control.
Figure 4.
Effects of erastin (5.0 µM, 24 h) on oxidative stress- and ferroptosis-related gene expression in OV-8 and PA1 cells grown in 2D culture (A) or as 3D spheroids (B). Transcript levels were determined by real-time RT-PCR and normalized to β-actin. *, **, and *** indicate p < 0.05, p < 0.005, and p < 0.001, respectively, versus the corresponding untreated control.
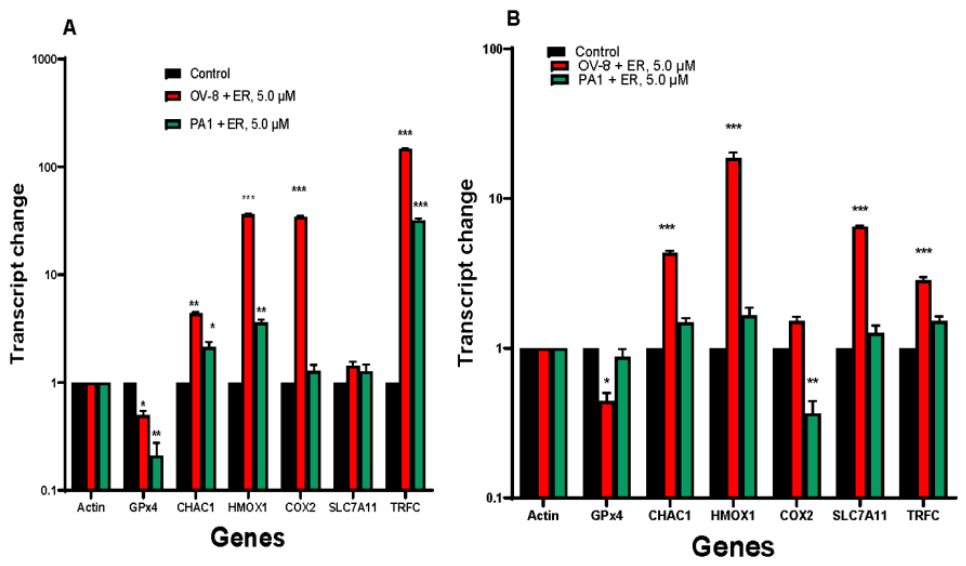
Figure 5.
NMR metabolomic profile of OV-8 cells following treatment with erastin (5.0 µM) for 24 h. Blue indicates untreated control samples and green indicates erastin-treated samples. In the hierarchical cluster analysis heatmap, Blue represents decreased while Red indicates increased.
Figure 5.
NMR metabolomic profile of OV-8 cells following treatment with erastin (5.0 µM) for 24 h. Blue indicates untreated control samples and green indicates erastin-treated samples. In the hierarchical cluster analysis heatmap, Blue represents decreased while Red indicates increased.
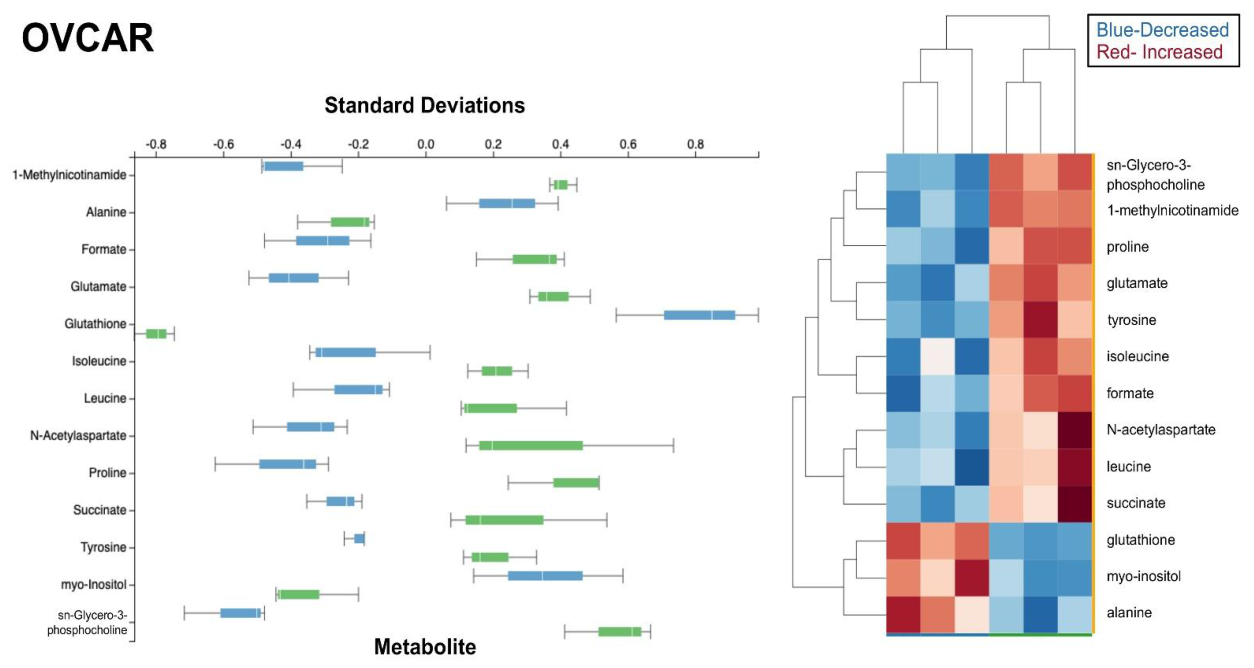
Figure 6.
NMR metabolomic profile of PA1 cells following treatment with erastin (5.0 µM) for 24 h. Blue indicates untreated control samples and green indicates erastin-treated samples. In the hierarchical cluster analysis heatmap, Blue represents decreased while Red indicates increased.
Figure 6.
NMR metabolomic profile of PA1 cells following treatment with erastin (5.0 µM) for 24 h. Blue indicates untreated control samples and green indicates erastin-treated samples. In the hierarchical cluster analysis heatmap, Blue represents decreased while Red indicates increased.
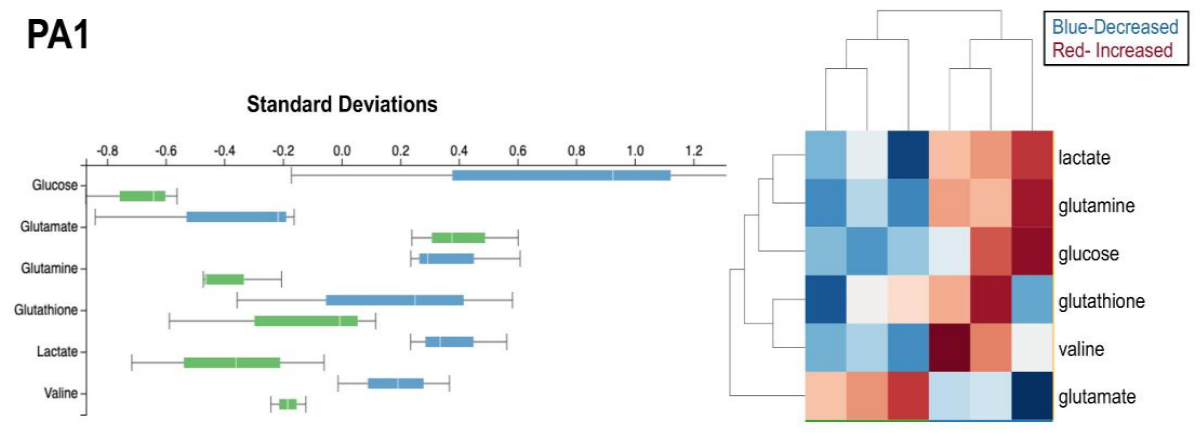
Figure 7.
Differential ER response of OV-8 and PA1 3D spheroids. Representative bright-field images show OV-8 (A) and PA1 (B) spheroids formed from 2,500 seeded cells. Spheroids were allowed to form for 5 days and then treated with ER (10-9 to 10-5 M) for 72 h. Images were acquired using a Zeiss Observer Z1 microscope. (C) Spheroid circularity after 72 h of ER exposure (n = 3 wells per condition; mean ± SD). (D) Erastin cytotoxicity in OV-8 and PA1 spheroids measured using CellTiter-Glo 3D. (E) Effect of FES pretreatment on ER cytotoxicity in OV-8 spheroids. FES was added 2-3 h before ER and viability was measured after an additional 24 h. (F) Erastin-induced lipid peroxidation in OV-8 and PA1 spheroids after 4 h, measured as MDA absorbance at 532 nm. Statistical comparisons are indicated in the panels. *** p values <0.001, compared to untreated control. ##, ###, p values 0.005 and 0.001, respectively compared to ER treated groups.
Figure 7.
Differential ER response of OV-8 and PA1 3D spheroids. Representative bright-field images show OV-8 (A) and PA1 (B) spheroids formed from 2,500 seeded cells. Spheroids were allowed to form for 5 days and then treated with ER (10-9 to 10-5 M) for 72 h. Images were acquired using a Zeiss Observer Z1 microscope. (C) Spheroid circularity after 72 h of ER exposure (n = 3 wells per condition; mean ± SD). (D) Erastin cytotoxicity in OV-8 and PA1 spheroids measured using CellTiter-Glo 3D. (E) Effect of FES pretreatment on ER cytotoxicity in OV-8 spheroids. FES was added 2-3 h before ER and viability was measured after an additional 24 h. (F) Erastin-induced lipid peroxidation in OV-8 and PA1 spheroids after 4 h, measured as MDA absorbance at 532 nm. Statistical comparisons are indicated in the panels. *** p values <0.001, compared to untreated control. ##, ###, p values 0.005 and 0.001, respectively compared to ER treated groups.
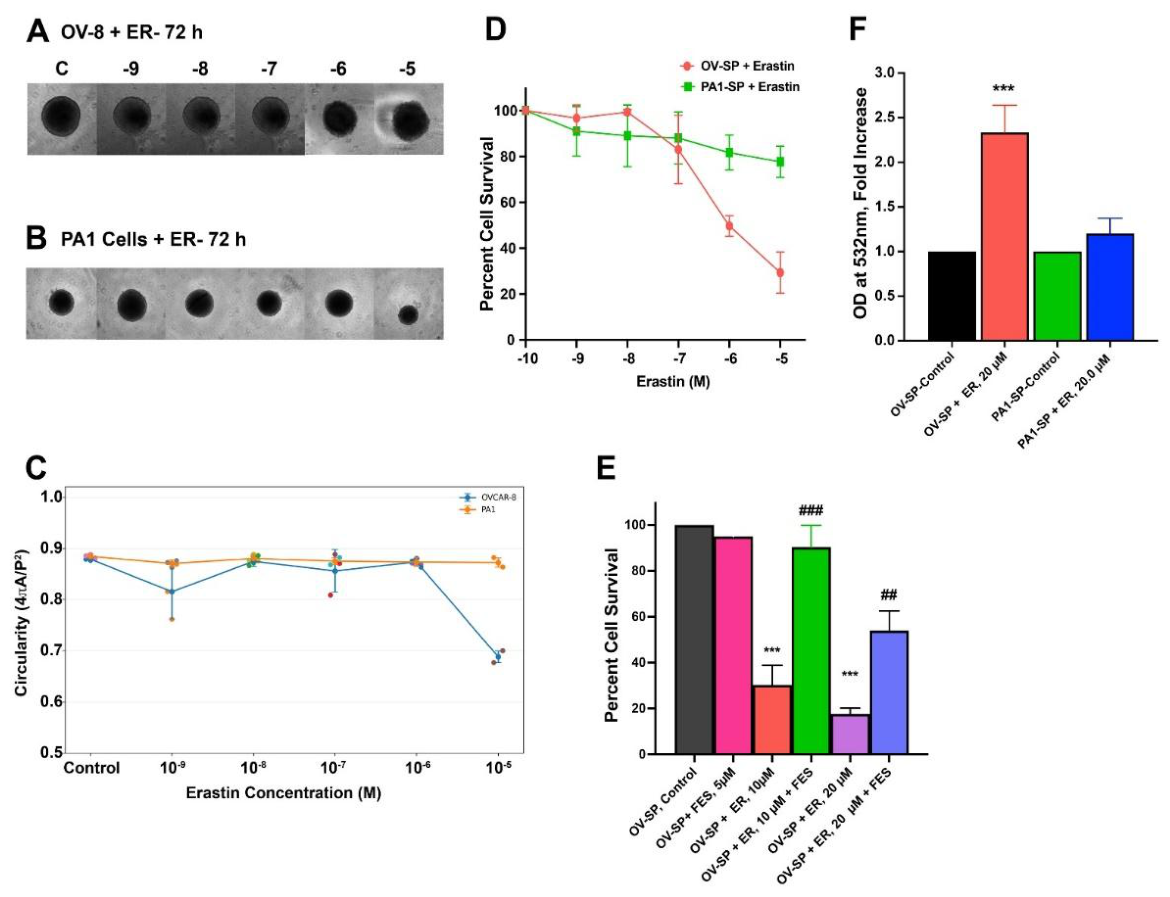

Table 1.
Primers used and their sequences.
| Gene | Forward | Reverse |
| Beta-Actin | CACCATTGGCAATGAGCGGTTC | AGGTCTTTGCGGATGTCCACGT |
| GPX4 | ACAAGAACGGCTGCGTGGTGAA | GCCACACACTTGTGGAGCTAGA |
| CHAC1 | GTGGTGACGCTCCTTGAAGATC | GAAGGTGACCTCCTTGGTATCG |
| HMOX1 | CCAGGCAGAGAATGCTGAGTTC | AAGACTGGGCTCTCCTTGTTGC |
| SLC7A11 | TCCTGCTTTGGCTCCATGAACG | AGAGGAGTGTGCTTGCGGACAT |
| COX2 (PTGS2) | CGGTGAAACTCTGGCTAGACAG | GCAAACCGTAGATGCTCAGGGA |
| TRFC | ATCGGTTGGTGCCACTGAATGG | ACAACAGTGGGCTGGCAGAAAC |
Disclaimer/Publisher’s Note: The statements, opinions and data contained in all publications are solely those of the individual author(s) and contributor(s) and not of MDPI and/or the editor(s). MDPI and/or the editor(s) disclaim responsibility for any injury to people or property resulting from any ideas, methods, instructions or products referred to in the content. |
© 2026 by the authors. Licensee MDPI, Basel, Switzerland. This article is an open access article distributed under the terms and conditions of the Creative Commons Attribution (CC BY) license (http://creativecommons.org/licenses/by/4.0/).
Copyright: This open access article is published under a Creative Commons CC BY 4.0 license, which permit the free download, distribution, and reuse, provided that the author and preprint are cited in any reuse.