

Submitted:
26 October 2026
Posted:
27 October 2026
You are already at the latest version
Abstract
Development projects in highly vulnerable territories frequently underperform not because of poor technical design but because the organizational, territorial and contextual conditions required for implementation are not in place. In Canaan (Haiti), for example, many post-earthquake interventions were fragmented, duplicated one another and failed to deliver durable improvements, which is the practical problem addressed here. This article develops and operationalizes an ex ante multi-criteria framework, HEP-ZAV (an assessment tool for development projects in high-vulnerability zones), that assesses the suitability of a development project before implementation. Rather than treating weighting as the core task, the framework first transforms an integrated territorial diagnosis into a structured evaluation matrix of three levels, eleven factors and fifty-six sub-factors operationalized through indicators. The relative importance of the elements is established through a group Analytic Hierarchy Process with consistency and consensus diagnostics, and the model is implemented in a transparent decision-support tool that reports a three-component suitability profile instead of a single score. Because retrospective project data are unavailable, the behavior of the instrument is characterized through a Monte Carlo experiment of 100,000 projects and two sensitivity analyses, which show that, under the simulation assumptions, the three dimensions remain computationally separated and that the expert-derived weights increase score dispersion while the factor-importance ranking remains robust. The framework is a transferable ex ante screening instrument, not yet a validated predictor of project success.
Keywords:
ex ante evaluation
; development projects
; highly vulnerable territories
; territorial suitability
; ter-ritorial vulnerability
; place-based evaluation
; territorial decision support
; multi-criteria decision analysis
; analytic hierarchy process
; Monte Carlo simulation
; Haiti
1. Introduction
Development projects implemented in highly vulnerable territories operate in a decision environment that differs fundamentally from conventional project settings. In these territories the feasibility of an intervention depends not only on the quality of its technical design or the resources assigned to it, but also on the capacity of the implementing organization, the degree to which the proposed intervention matches territorial needs and constraints, and the wider conditions under which implementation must take place. Environmental hazards, infrastructure deficits, socioeconomic deprivation, institutional weakness, limited service provision, governance problems and insecurity frequently coexist and interact. As a consequence, an intervention that appears sound when judged solely by its internal design may still be poorly suited to the territory in which it is expected to operate, and may underperform or fail during implementation. This concern is well documented in post-disaster and fragile contexts, where reconstruction and development interventions must reconcile urgency, scarce resources, social needs and long-term resilience at the same time [1,2,3]. This perspective is consistent with the Sendai Framework for Disaster Risk Reduction, which emphasizes understanding disaster risk, strengthening risk governance, investing in resilience and integrating risk reduction into recovery, rehabilitation and reconstruction through the principle of Build Back Better [4]. It is also recognized in operational recovery frameworks, since the GFDRR Disaster Recovery Framework Guide stresses that resilient recovery requires coordinated planning, institutional arrangements, implementation capacity, attention to vulnerable groups and the integration of disaster-risk reduction into recovery decisions [5].
This situation defines a specific problem for ex ante evaluation. Before implementation, decision makers must determine whether a proposed intervention is sufficiently prepared, territorially appropriate and operationally feasible. The information required to answer this question is heterogeneous. Some components can be measured quantitatively, such as hazard exposure, infrastructure coverage, operating costs or employment generation, whereas others depend on qualitative or semi-quantitative evidence, including prior implementation experience, knowledge of the local context, institutional coordination, community participation, adaptability or security conditions. Multi-criteria decision analysis (MCDA) has become the standard family of methods for structuring this kind of heterogeneous and partly conflicting evidence, and it is now widely applied to disaster management, resilience and site-selection decisions through decision-support tools built on techniques such as AHP, TOPSIS or BWM [6,7]. The same logic increasingly underpins ex ante appraisals of project feasibility across sectors [8]. The central challenge, however, is not simply to accumulate indicators or to apply a weighting algorithm. It is to transform dispersed territorial and project knowledge into a coherent evaluation structure in which the relevant components are explicitly identified, organized, weighted and translated into an operational decision-support procedure.
The present study starts from the premise that, in these settings, the most consequential step in building such a system is the identification and structuring of what should be evaluated. Methodological reviews of multi-criteria sustainability assessment have repeatedly shown that the selection and definition of criteria and indicators is a central, yet frequently under-reported, methodological choice, and that problem structuring must precede any weighting or aggregation step [9,10,11]. We therefore treat the selection of factors, sub-factors, descriptors and indicators as a substantive scientific task rather than as a preliminary technical step. In highly vulnerable territories these components must reflect the mechanisms through which projects succeed, encounter difficulties or fail. The evaluation structure must capture not only the characteristics of the proposed project, but also the capabilities of the actors responsible for implementation and the characteristics of the territorial environment that can enable or constrain delivery. This concern connects the framework to a growing body of work that incorporates territorial and local knowledge directly into the construction of vulnerability criteria, rather than importing generic indicator lists [12,13]. The resulting evaluation matrix constitutes the knowledge base of the decision-support system, and the subsequent weighting and computation make that knowledge operational.
Canaan, Haiti, provides the reference context from which this methodological problem was developed. The territory experienced rapid and largely unplanned urban expansion following the 2010 earthquake and has since been characterized by severe deficits in infrastructure and public services, socioeconomic vulnerability, exposure to natural hazards, governance difficulties and insecurity. In this setting a large number of development and reconstruction interventions were launched by governmental and non-governmental actors, yet many were poorly coordinated, duplicated one another or failed to translate into durable improvements for the population. This recurrent experience of fragmented and largely ineffective interventions is the practical problem that motivates the present work: the need for an instrument able to assess, before implementation, whether a proposed project is genuinely suited to the territory and to the organization that would deliver it, instead of adding one more poorly adapted project to those already undertaken. The field research underlying this article examined these previous interventions, together with the governance arrangements, the risks faced by the population and the dynamics of land occupation. It documented, for example, that a large settlement and housing programme supported by international donors rehoused tens of thousands of displaced people and built schools and health facilities, but that it coexisted with numerous overlapping interventions by different agencies and non-governmental organizations that duplicated one another in housing, water and sanitation, that were frequently short-term emergency responses without durable effect, and that in some cases produced facilities, such as schools built without the corresponding basic services, which could not be sustained. It was this systematic analysis of past project success and failure that brought to light the factors conditioning project viability [14]. The resulting body of evidence, synthesized through SWOT and an integrated PESTEL diagnosis, made it possible to translate those recurrent conditions into a structured set of evaluation components. Canaan is therefore used as the reference context for knowledge extraction and methodological construction, not as an empirical test of the predictive performance of the model.
Against this background, the aim of the article is to develop and operationalize a multi-criteria framework for the ex ante evaluation of development projects in highly vulnerable territories, designated HEP-ZAV (from the Spanish Herramienta de Evaluacion de Proyectos en Zonas de Alta Vulnerabilidad, that is, an assessment tool for projects in high-vulnerability zones). The framework follows a sequential logic. First, knowledge derived from the territorial diagnosis is transformed into an evaluation matrix of dimensions, factors, sub-factors, descriptors and indicators. Second, the relative importance of factors and sub-factors is established through a group Analytic Hierarchy Process (AHP), with explicit consistency and group-consensus checks [10,11]. Third, the conceptual model and the resulting weights are implemented in a transparent, spreadsheet-based decision-support tool that guides project scoring, aggregates the evaluation at different hierarchical levels and compares the assessed project with an ideal reference condition. AHP is therefore used as a weighting mechanism within a broader knowledge-based evaluation architecture rather than as the principal methodological contribution. This positioning is deliberate, because precedents for AHP in development and participatory planning already exist [15], and the normative criteria of international evaluation, namely relevance, coherence, effectiveness, efficiency, impact and sustainability, already define which questions an evaluation should ask without prescribing how to structure, weight and operationalize the evidence [16].
The proposed framework distinguishes three complementary domains of project suitability, which are kept analytically separate throughout the assessment. The first concerns the capacity of the implementing team, including its experience, technical and human resources, adaptability and knowledge of the territory. The second concerns the relationship between the intervention and the territory, encompassing socioeconomic conditions, natural hazards and climate resilience, environmental impacts, infrastructure and services, governance, equity and community participation. The third concerns contextual feasibility, particularly the lessons derived from previous projects and the security conditions under which implementation would occur. These domains are preserved as a three-component profile in the final output, so that weaknesses are not concealed through premature aggregation into a single score. The intention is not only to indicate whether a project appears suitable, but also to locate its principal limitations and to identify which aspects may require redesign before implementation. This separation of implementation capacity and contextual feasibility addresses a gap repeatedly noted in critical and post-disaster settings, where contextual constraints such as security, governance and institutional continuity are acknowledged individually but rarely integrated as primary evaluation dimensions within a single decision structure [3].
On this basis, the study makes four related contributions. First, it provides a systematic and reproducible procedure for converting a complex territorial diagnosis into a project-evaluation matrix. Second, it establishes a transparent group-AHP weighting procedure that includes consistency and consensus diagnostics. Third, it operationalizes the complete evaluation process in a decision-support tool in which the matrix structure, AHP weights, project scores, hierarchical aggregation and comparison with an ideal project are dynamically linked and fully traceable. Fourth, because standardized retrospective data for a sufficiently broad set of completed projects are not available, it characterizes the behavior of the instrument through a Monte Carlo experiment of 100,000 simulated projects, complemented by weight-perturbation and equal-weight sensitivity analyses, in order to examine the dispersion, effective dimensionality and robustness of the three suitability dimensions. The framework is conceived primarily as a diagnostic and decision-support instrument. The simulation demonstrates the internal functioning and the discriminating properties of the system, and it is not interpreted as empirical validation of the ability of the model to predict project success or failure, which remains a task for subsequent research.
The remainder of the article is organized as follows. Section 2 reviews the state of the art on development-project evaluation in vulnerable contexts, multi-criteria decision support, AHP-based weighting and related applications, and uses this literature to position the contribution. Section 3 describes the methodological process used to construct the evaluation system, the expert-based AHP weighting procedure, the design of the decision-support tool and the Monte Carlo and sensitivity protocol. Section 4 presents the resulting evaluation matrix, the weighting structure, the consistency and consensus results, the operational implementation and the simulation-based characterization of the instrument. Section 5 discusses the contribution, transferability and limitations of the architecture, Section 6 summarizes the main conclusions and the priorities for empirical validation, and Section 7 lists the references.
2. State of the Art and Positioning of the Proposed Framework
This section does not restate the decision problem outlined above. Its purpose is to locate the proposed framework within the existing literature on multi-criteria decision support, to compare it analytically with the most closely related lines of work, and to make explicit the gap that the study addresses.
2.1. Multi-Criteria Decision Support in Vulnerable and Disaster-Affected Contexts
Multi-criteria decision analysis (MCDA) is well established for structured decisions in hazard-exposed and disaster-affected territories. Representative applications address the siting of protective or emergency infrastructure, the planning of evacuation and the location of temporary facilities. Wood et al. [17] framed tsunami vertical-evacuation planning as a geospatial multi-criteria problem; Nyimbili and Erden [18] compared best-worst weighting for emergency-facility planning across two groups of decision makers; and Amin Hosseini et al. [19] combined GIS with a MIVES-knapsack model to select optimal sites for temporary housing after disasters. Related studies rank emergency assembly areas or prioritize stakeholder interactions for resilience using AHP and TOPSIS [6,7]. The same family of methods underpins much of hazard and vulnerability mapping, where AHP, frequently combined with TOPSIS or fuzzy logic, is used to prioritize flood, landslide and wildfire vulnerability [20,21,22,23]. These works show that MCDA reliably supports siting, prioritization and resource-allocation decisions. In every case, however, the decision object is the selection or ranking of alternatives, that is, where to locate a facility, which project to fund first or which stakeholder to engage, and not an ex ante judgment of whether a single proposed intervention is implementable in a given territory and where its weaknesses are located.
2.2. The Construction of Criteria and Indicators as a Methodological Problem
A recurrent conclusion of the MCDA literature is that weighting is only one component of a decision model and that the prior definition of criteria and indicators determines much of its scientific quality. A growing number of studies make this construction explicit. Fuzzy Delphi screening has been used to select sustainability indicators for neighborhood assessment [24], and local and indigenous knowledge has been incorporated, through the analytic network process, into the mapping of flood vulnerability in informal settlements [13]. These approaches either screen indicators drawn from the literature or elicit them from participatory sources. What remains uncommon is the derivation of the complete evaluation structure from an integrated, multi-source territorial diagnosis that combines documentary, socioeconomic, spatial, governance and security evidence, followed by its reorganization around the specific question of project implementability. Formal problem-structuring approaches, such as value-focused thinking combined with soft systems methodology, have likewise been used to organize objectives and criteria before any numerical analysis [25], and indicator-based performance frameworks show how context-specific indicators can be assembled and weighted for territorial assessment [26]. This is the point at which the present framework departs from most existing work.
2.3. AHP and the Aggregation of Group Judgments
Within MCDA, AHP continues to be widely used for hierarchical problems because it decomposes a decision into levels, derives priorities from pairwise comparisons and provides an explicit test of logical consistency [10]. When several experts participate, the aggregation of judgments and the measurement of agreement become distinct methodological concerns. Recent contributions refine the group setting by reducing incompatibility among individual judgments [27] and by promoting homogeneity across group members through projection methods [28], while other approaches build consensus matrices and optimize stakeholder weights under the row geometric mean aggregation [29,30,31], and accessible online environments support group elicitation together with consistency and consensus diagnostics [32]. This body of work confirms that the machinery for transparent group weighting is mature, and it clarifies that two different properties must be reported: the internal consistency of each set of comparisons and the degree of convergence among participants. The present study adopts this machinery rather than attempting to extend it.
2.4. Vulnerability and Resilience Assessment: Weighting, Uncertainty and Robustness
Vulnerability and resilience assessment is one of the most active fields of MCDA application, because exposure, sensitivity and adaptive capacity depend on numerous indicators whose relative importance is not self-evident. Studies combine weighted indicators to quantify social vulnerability, increasingly with machine-learning or hybrid procedures intended to improve reliability [33], and they model the resilience of housing infrastructure to flood hazard through integrated quantitative frameworks [34]. A consistent lesson of this literature is that the outputs of weighted composite assessments can change when indicator weights, inclusion rules or scoring assumptions are modified. This observation motivates the explicit examination of robustness and sensitivity, which the present study incorporates through a simulation-based characterization of the instrument instead of a single illustrative calculation.
2.5. From Conceptual Frameworks to Operational Decision-Support Tools
A methodological framework becomes more useful when its structure is translated into a repeatable and auditable procedure. Several studies therefore implement indicator-based decision-support systems that connect criteria, weights and scores within a single computational environment, for example to evaluate wastewater-treatment configurations with resource recovery [35,36] or to support disaster-management decisions [7]. Comparable hybrid decision-support frameworks have been developed for resource and sustainability trade-offs in other domains [37,38]. These systems demonstrate the value of separating the conceptual model from the computational layer and of making every result traceable to its inputs. They are, however, typically developed for environmental or engineering domains, and the knowledge content and the calculation layer are seldom linked in a way that preserves the territorial reasoning behind the criteria.
2.6. Research Gap and Positioning of the Present Study
The reviewed literature indicates that the relevant methodological components already exist separately: mature MCDA and AHP weighting, explicit procedures for criterion and indicator construction, group-consensus diagnostics, vulnerability and resilience indices, disaster-oriented decision tools and operational decision-support systems. The gap lies in how these components are connected when the decision problem is the ex ante suitability of a development project in a highly vulnerable territory. Four aspects define this gap. First, criteria are usually imported from the literature or elicited in a participatory way, whereas they are rarely derived from an integrated territorial diagnosis and reorganized around project implementability. Second, most applications address the ranking or prioritization of alternatives, or the measurement of vulnerability, rather than a diagnostic judgment that keeps implementation capacity, project-territory compatibility and contextual feasibility analytically separate. Third, compensability and the robustness of results to weights and scores are seldom examined, even though composite assessments are known to be sensitive to these choices. Fourth, conceptual frameworks and operational tools are frequently developed independently, so the chain that runs from territorial knowledge to a traceable and transferable instrument is rarely complete. The framework presented in this article is positioned at the intersection of these four aspects, and Table 1 summarizes how a set of representative contributions relates to it.
Beyond the academic MCDA literature, international organizations have developed complementary instruments for project screening, disaster recovery and territorial resilience. The UNDP Social and Environmental Screening Procedure provides ex ante identification and categorization of social and environmental risks at an early stage of project preparation [39]; the Sendai Framework and the GFDRR Disaster Recovery Framework Guide, already noted, emphasize risk-informed and resilient recovery [4,5]; and the UN-Habitat City Resilience Profiling Tool structures multidimensional information on urban systems, stakeholders, shocks and stresses in order to identify resilience gaps and priorities [40]. These instruments show the growing institutional importance of systematic, context-sensitive assessment, and the framework proposed here is complementary to them rather than a substitute. It addresses a related but distinct methodological problem, namely translating a territorial diagnosis into a weighted and traceable evaluation of whether the implementing organization, the proposed intervention and the contextual conditions jointly provide a suitable basis for implementation. Its decision scale also differs from territorial resilience profiling, because the object of assessment is not the resilience of the territory itself but the suitability of a specific project within that territorial context.
The relevance of separating organizational, project-specific and contextual conditions is also supported by the international-development project literature. In a systematic review of international development project success, Chasanah et al. [41] identified human factors, project characteristics, management and the external environment as the principal families of determinants reported across the literature. The present framework is consistent with this multidimensional view, although it reorganizes these general determinants into three explicitly territorialized diagnostic domains, namely implementing-team capacity, project-territory compatibility and contextual feasibility, rather than adopting the same categories.
3. Materials and Methods
3.1. Overall Methodological Design
The study followed a sequential design in which territorial evidence was progressively transformed into an operational multi-criteria project-evaluation system. The process comprised seven linked stages: (1) construction of the territorial evidence base; (2) identification and hierarchical organization of evaluation factors, sub-factors and indicators; (3) expert-based weighting through the Analytic Hierarchy Process (AHP); (4) implementation of the hierarchy and weights in a spreadsheet-based calculation tool; (5) project scoring and weighted aggregation; (6) generation of a diagnostic output consisting of three independent suitability dimensions and a comparison with an ideal reference project; and (7) characterization of the behavior of the instrument through a Monte Carlo experiment and a sensitivity analysis. The framework was designed as an ex ante decision-support instrument rather than as a predictive model of project success, so the method evaluates whether the conditions required for implementation are present at the time of assessment. The calculation architecture preserves three analytically distinct dimensions throughout the process: the capacity of the implementing team (Level 1), the relationship between the project and the territory (Level 2), and the contextual conditions affecting implementation, in particular previous project experience and security (Level 3). The final output is therefore a three-component project profile rather than a single composite score. Figure 1 summarizes this workflow.
3.2. Reference Context and Generation of Evaluation Criteria
The evaluation structure was derived from the integrated diagnosis of Canaan, Haiti, developed in the underlying research on post-disaster urbanization, governance, natural and anthropogenic hazards and socioeconomic vulnerability [14]. Canaan was used not because its specific conditions are assumed to be universal, but because it offers a real territorial problem in which multiple sources of vulnerability interact. The evidence base included documentary analysis, field and survey information, participatory work, territorial and GIS analysis, the review of development projects previously implemented in the area, the analysis of governance instruments and an integrated PESTEL diagnosis covering political and legal, economic, sociocultural, technological and environmental dimensions. Candidate evaluation components were extracted from this diagnosis by identifying conditions that could reasonably affect the feasibility, implementation, sustainability or territorial adequacy of a development intervention. Each component was then assigned to one of three questions: whether the implementing team had the capabilities required to deliver the intervention; whether the proposed intervention was compatible with territorial needs, risks, environmental conditions, infrastructure, governance and social priorities; and whether the wider context, including previous project experience and insecurity, created favorable or adverse conditions for implementation. For each sub-factor, a descriptor was written to define the construct to be assessed and a set of operational indicators was proposed. The working instrument uses three indicators per sub-factor, although the framework allows indicators to be replaced or supplemented when the information required for a particular context is unavailable or when a more appropriate empirical measure exists. Indicators may be quantitative, qualitative or semi-quantitative, and their role is to provide an explicit evidential basis for assigning the sub-factor score rather than to act as independent criteria with additional weights. It is important to distinguish the two roles played by the reference context in this process. The diagnosis of Canaan, and the doctoral research from which it derives, determined what should be evaluated, namely the factors, sub-factors and indicators that capture the conditions under which projects succeed or fail in a highly vulnerable territory. The relative importance of those elements, by contrast, was not fixed by Canaan but assigned subsequently by the expert panel (Section 3.4), which judged the weights while keeping in mind a project that must be implemented under conditions such as those of Canaan.
3.3. Hierarchical Structure of the Model
The final hierarchy contains 3 evaluation levels, 11 major factors and 56 sub-factors, each operationalized through three proposed indicators, which yields an intended set of 168 indicator-level observations for a complete assessment. Level 1 contains two factors and nine sub-factors; Level 2 contains seven factors and 36 sub-factors; and Level 3 contains two factors and 11 sub-factors. Table 2 summarizes the structure. The complete list of descriptors and indicators is provided as Supplementary Material, since these definitions form part of the reproducible specification of the instrument.
3.4. Expert Elicitation and AHP Weighting
Weights were assigned to factors and sub-factors through a collaborative AHP procedure. Ten experts participated in the elicitation, with expertise in territorial planning, natural hazards, environmental planning and economics. The hierarchy was divided into three online group sessions corresponding to the three evaluation levels. Participants received written instructions and completed pairwise comparisons within each branch of the hierarchy using the conventional AHP fundamental scale, in which equal importance is represented by 1 and increasing preference is expressed up to 9, with reciprocal values representing the opposite direction of preference [10]. The elicitation was implemented with the AHP Online System, which derives priority vectors and supports group decision making together with consistency and consensus diagnostics [32]. Individual judgments were combined by weighted geometric mean aggregation, a procedure whose consistency properties in the aggregated comparison matrix are well established [42].
Logical consistency was checked for each pairwise-comparison matrix through the consistency ratio, computed as
CR = CI / RI (1)
where CI is the consistency index of the comparison matrix and RI is the random consistency index corresponding to the matrix order. Judgments were considered acceptable when CR is lower than or equal to 0.10. In addition to matrix consistency, the group process was characterized through the consensus measure provided by the software. Consistency and consensus serve different purposes: the consistency ratio evaluates the internal logical coherence of the comparisons, whereas the consensus measure characterizes the convergence among participants. Both were retained as quality-control indicators, following the distinction between the different methodological components of AHP [11]. The priority vector obtained for each group of elements constitutes a local weight. To obtain the contribution of each sub-factor to its complete evaluation level, local factor and sub-factor weights were multiplied. For sub-factor j belonging to factor f,
Wj = 100 x w(f) x w(j|f) (2)
where w(f) is the local weight of factor f, w(j|f) is the local weight of sub-factor j within that factor, and the resulting global sub-factor weight is expressed as a percentage of its evaluation level. By construction, the global sub-factor weights within each level sum to 100 percent.
3.5. Operational Implementation
The model was implemented in a spreadsheet so that the full evaluation process could be executed without specialized decision-support software once the AHP weights were available. The spreadsheet is not only a reporting interface: it operationalizes the hierarchy, stores the direction and weight of each criterion, provides the descriptors and indicators used to support scoring, computes weighted contributions, aggregates factor and level scores and generates the comparison with the ideal reference project. The active architecture comprises a parameter sheet that stores the hierarchy and AHP weights, three evaluation sheets corresponding to the three levels, and a results sheet that integrates the factor and level scores and compares them with the ideal benchmark. The evaluation sheets retrieve the weights from the parameter sheet through direct cell references, so that a revised calibration can be propagated by updating the weight table rather than editing each evaluation sheet. The complete evaluation application is delivered as an Excel workbook in the Zenodo repository as Supplementary Material, in a fully translated English version.
Each of the 168 indicators is scored directly on a 0 to 5 suitability scale, or marked N/A when the supporting evidence is missing or unavailable (Table 3). The tool then computes the score of each sub-factor as the arithmetic mean of the scores of its indicators, excluding any indicator marked N/A, and this mean is the consolidated sub-factor score that enters the aggregation. Only values within the closed interval from 0 to 5, or N/A, are admissible. Missing evidence is therefore recorded as N/A and never as a zero, because a zero denotes the least favorable condition and must remain distinguishable from the absence of evidence; indicators marked N/A are excluded from the sub-factor mean rather than counted as zero performance.
All indicators are expressed in a common suitability direction. For adverse conditions, that is, exposure, impact or threat variables such as hazard exposure, environmental impact or crime, the evaluator assesses the degree to which the project is adapted to, or mitigates, the adverse condition rather than the raw intensity of the hazard or impact, for example a location and design well suited to the flood hazard or effective mitigation of the impact of crime. Consequently, a score of 5 always denotes the most favorable condition and a score of 0 the least favorable one, and no score inversion is performed. Because every dimension already shares the same direction, the same calculation applies to every row of the instrument. Once the mean score of sub-factor j has been obtained, it is converted to a fraction of the maximum attainable score and multiplied by the global weight,
Cj = (sj / 5) x Wj (3)
so that a score of 5 contributes the full weight of the sub-factor and a score of 0 contributes nothing. Weighted contributions are summed within each factor and across all factors of the same level. Because the global weights of each level sum to 100 percent, the level score is directly expressed on a 0 to 100 scale. For level l,
Ll = Sum of Cj = Sum of (sj / 5) x Wj (4)
Because the global weights within each level always sum to 100 percent, each level score is compared with the same ideal benchmark even when some indicators, or whole sub-factors, are marked N/A. Missing evidence therefore lowers the apparent level score rather than being neutral, so the instrument reports each level score together with its evidence-coverage percentage and flags any level whose coverage falls below 100 percent, so that the comparison with the ideal benchmark is read with appropriate caution. A level score of 72.4 with an evidence coverage of 83.3 percent, for instance, is not equivalent to the same score obtained under full coverage.
3.6. Project Suitability Profile and Ideal-Project Benchmark
The model does not collapse the three levels into a single final number. Project suitability is represented as an ordered three-component profile,
A(P) = [ L1, L2, L3 ] (5)
where the three components represent implementing-team capacity, project-territory compatibility and contextual implementation conditions. This design preserves the origin of weaknesses and avoids full compensation across fundamentally different dimensions, so that a project can be strong in one dimension and weak in another without the latter being hidden by a global average. To provide a common diagnostic reference, the spreadsheet defines an ideal project in which every sub-factor attains the maximum favorable score of 5; under this condition each level reaches 100 and each factor reaches the sum of its constituent global weights. For factor f, the absolute and relative gaps with respect to the ideal project are
G(f) = M(f) - E(f) (6)
G(f) % = [ ( M(f) - E(f) ) / M(f) ] x 100 (7)
where M(f) is the factor score under the ideal project and E(f) is the evaluated factor score. The relative gap provides a normalized measure of the factor-specific deficit, so that large values identify the components in which the evaluated project is furthest from the reference condition and therefore the aspects that may require redesign or mitigation before implementation.
3.7. Monte Carlo Experiment and Sensitivity Analysis
Because standardized retrospective data for a sufficiently broad set of completed projects were not available, the study does not attempt external predictive validation. Instead, the behavior of the computational model was characterized through a Monte Carlo experiment, complemented by two sensitivity analyses. In intuitive terms, rather than testing the instrument with a single project, the Monte Carlo experiment evaluates it with a very large number of randomly generated projects and examines the pattern formed by all the results, so that the general behavior of the tool, and not the outcome of one particular case, becomes visible. The purpose is therefore not to predict whether any real project would succeed, but to understand how the instrument itself behaves: whether its scale is well centered, which dimensions are stable or volatile, whether the three dimensions carry independent information, and how sensitive the results are to the weights. This approach follows established practice in multi-criteria research, where sensitivity analysis is used to examine the stability of priorities and rankings in AHP [43] and Monte Carlo simulation is used to assess the robustness of group multi-criteria evaluations [44].
A population of 100,000 synthetic projects was generated. For each project, every sub-factor received an independent suitability score drawn from a continuous uniform distribution on the interval from 0 to 5, equivalently a value of s/5 drawn from a uniform distribution on the unit interval. Because all dimensions are expressed in the same suitability direction, the simulation is invariant to whether a dimension is favorable or adverse in origin. It should be emphasized that these inputs are generated independently by construction, so the simulation characterizes how the instrument propagates and aggregates independent inputs rather than testing an empirical hypothesis about the real dimensions. Each simulated project was propagated through the complete calculation chain defined in Equations (3) to (7), producing the three level scores and the factor-level gaps. The dispersion of each level was also verified analytically through the variance decomposition
Var(Ll) = Sum of Wj2 x Var(sj / 5) (8)
which holds because the sub-factor scores are independent, and the concentration of weights within each level was summarized through the effective number of sub-factors,
neff,l = 1 / Sum of ( Wj / 100 )2 (9)
defined as the reciprocal of the Herfindahl concentration index of the normalized level weights. The cross-dimensional correlations among the three level scores were examined through the pairwise Pearson correlation of the simulated level scores. Two sensitivity analyses were then performed. In the first, the AHP weights were replaced by equal weights within each level, with every sub-factor receiving a weight of 100 divided by the number of sub-factors in its level, and the resulting score distributions were compared with those obtained under the AHP weights. In the second, each weight was multiplied by a random factor drawn from a normal distribution with mean 1 and standard deviation 0.20, constrained to remain positive and renormalized within each level to sum to 100; the procedure was repeated over 2,000 replications, and the stability of the factor-importance ranking was measured through the Spearman rank correlation between the perturbed and the baseline weights. All simulations used a fixed random seed for reproducibility and were implemented in Python with the NumPy and SciPy libraries. The code and the workbook are archived together with the Supplementary Material.
3.8. Quality Control and Reproducibility
Quality control operates at three stages. First, the AHP elicitation is checked through the consistency ratio and the group-consensus measure. Second, spreadsheet scoring requires all entered indicator values to remain within the admissible 0 to 5 range or to be marked N/A, and the adverse dimensions, expressed directly as suitability conditions, share the same direction as the rest so that a higher score is always more favorable. Third, the global sub-factor weights within each level are verified to sum to 100 percent, which guarantees that a project scoring 5 on every sub-factor reaches the 100-point benchmark. The architecture supports reproducibility by separating parameters from project-specific observations, so that a new project can be assessed by entering new scores without modifying the hierarchy or the formulas, while a context-specific recalibration can be performed by replacing the weights and, where justified, adapting the descriptors or indicators. For replication, the complete workbook, the hierarchy specification, the indicator definitions, the aggregated weights and the simulation code are made available as Supplementary Material. The model is intentionally modular: transfer to another vulnerable territory should preserve the calculation logic but not necessarily the original weighting structure, which should be re-elicited when contextual priorities differ materially.
4. Results
The methodological process produced three linked outputs: a hierarchical evaluation matrix that converts the territorial knowledge base into an explicit set of assessment dimensions, factors, sub-factors and indicators; an expert-derived weighting structure obtained through AHP; and a decision-support tool that integrates the matrix, the weights and the project scores and compares an evaluated project with an ideal reference. These outputs are presented first, followed by the simulation-based characterization of the instrument.
4.1. Final Structure of the Project-Evaluation Matrix
The knowledge-structuring procedure resulted in a hierarchical matrix of three evaluation levels, 11 major factors and 56 sub-factors, each operationalized through three proposed indicators, which gives an intended set of 168 indicator-level observations for a complete assessment. The structure separates three sources of project suitability: the capacity of the implementing team (Level 1), the compatibility between the project and the territory (Level 2), and the contextual conditions under which implementation would take place (Level 3). Level 2 concentrates the largest part of the matrix and integrates socio-economic feasibility, natural hazards and climate resilience, environmental impacts, infrastructure and services, governance, equity and community participation. Level 3 explicitly incorporates the experience gained from previous interventions and the security conditions of the area. The complete matrix, with descriptors and indicators, is provided as Supplementary Material.
4.2. AHP-Derived Weighting Structure
The expert weighting process produced differentiated priorities within each level (Table 4). The weights are normalized within their respective levels, so they should be read as relative importance inside each level rather than on a single eleven-factor scale. Within Level 1, experience and implementation capacity accounted for 58.5 percent of the level and knowledge of the geographical context for 41.5 percent; the technical capacity of the team was the most influential sub-factor (25.2 percent of the level), followed by human capacity (13.3 percent) and previous experience with similar projects (12.2 percent). Level 2 displayed a more distributed pattern: natural-hazard exposure and climate resilience received the largest factor weight (27.5 percent), followed by socio-economic aspects (24.6 percent), while flood exposure was the most influential individual sub-factor (9.2 percent). In Level 3, insecurity and crime received 54.2 percent and experience from previous projects 45.8 percent, with the impact of crime on economic and social development as the highest-weighted sub-factor of the level (18.7 percent).
4.3. Consistency and Agreement of the Expert Weighting
The pairwise-comparison exercise showed acceptable internal consistency across the three evaluation components, with consistency ratios below the conventional 0.10 threshold in all cases. Group consensus was consistently above 70 percent. These results indicate that the weighting structure was generated from judgments that were internally coherent and showed a substantial degree of agreement among participants. They should be interpreted as evidence on the quality of the elicitation process and not as validation of the predictive performance of the framework.
4.4. Operational Implementation
The conceptual matrix and the weighting system were implemented as a linked decision-support tool. A master sheet stores the hierarchy and the AHP weights; three evaluation sheets operationalize the three levels; and a results sheet integrates the factor and level scores and compares them with the ideal benchmark. The evaluator scores each indicator on the 0 to 5 scale, or marks it N/A; the tool averages the indicator scores into the sub-factor score, excluding any indicator marked N/A, converts that score into a weighted contribution and aggregates the contributions to factor and level totals. Changes in the weight table or in the project scores propagate automatically to the final diagnostic output. The output is not limited to a single project score: the tool produces a three-component suitability profile and retains the contribution of every factor, so that the final assessment can be traced back to the specific components responsible for high or low performance. Alongside the profile, the tool returns for each evaluation a ranked list of the factors with the largest gaps with respect to the ideal benchmark and identifies the binding dimension, that is, the lowest of the three level scores, together with the evidence coverage of each level, so that attention is directed to the components and the dimension that most constrain implementation. The operational workbook is made openly available as an Excel application in the Zenodo repository.
s4.5. Simulation-Based Characterization of the Instrument
The behavior of the completed instrument was characterized through the Monte Carlo experiment described in Section 3. Across 100,000 random projects, the three dimensions each produced a mean score close to 50, which confirms that the ideal benchmark is calibrated so that a uniformly average project reaches the midpoint of the scale. The dispersion of the three dimensions differed markedly (Table 5 and Figure 2). Level 2 was the most stable, with a standard deviation of 5.9 points, whereas Levels 1 and 3 were more volatile, with standard deviations of 10.7 and 9.4 points (Figure 3a). This difference is explained by the concentration of weights: Level 2 distributes its weight across 36 sub-factors, with an effective number of about 24, whereas Levels 1 and 3 behave as if driven by roughly 7 and 10 sub-factors respectively (Figure 3b). The simulated standard deviations matched the values obtained analytically from the variance decomposition, which confirms the internal consistency of the implementation.
Under this independent-input simulation design, the three dimensions remained computationally separated and exhibited near-zero cross-dimensional correlations among the simulated level scores. The three-component profile therefore carries three non-redundant pieces of information under these assumptions, and collapsing it into a single composite would average out and conceal this variation. Only 12.4 percent of the random projects fell below 50 in all three dimensions at the same time, and a comparable 12.5 percent exceeded 50 in all three. The education-centre pilot evaluated in Appendix A, with level scores of 67.7, 54.0 and 47.8, lies at approximately the 95th, 75th and 41st percentiles of the respective distributions, so it represents a project that is comparatively strong in implementing-team capacity, moderate in project-territory compatibility, and constrained mainly by its contextual dimension.
The variance decomposition also identified the sub-factors that dominate each dimension (Figure 4). In Level 1, the technical capacity of the team alone accounted for about 46 percent of the variance of the level (Figure 4a), and in Level 3 the impact of crime on development accounted for about 33 percent (Figure 4c). Level 2 showed a much flatter profile, with flood exposure and operating costs as the main contributors (Figure 4b). This indicates that the scores of Levels 1 and 3 are driven by one or two sub-factors, which is relevant both for the quality of the evidence required in those sub-factors and for any future attempt to produce a more parsimonious version of the instrument.
4.6. Sensitivity Analysis
The first sensitivity analysis compared the AHP weights with an equal-weight scheme (Figure 5). The resulting project scores remained strongly correlated with the AHP scores, with correlations of 0.90, 0.82 and 0.93 for Levels 1, 2 and 3 (Figure 5a-c), which indicates that the ordering of projects is fairly robust to the weighting scheme. At the same time, the AHP weights produced a wider dispersion of scores than equal weights in every level, visible in each panel of Figure 5. This wider dispersion follows in part from the fact that, with independent inputs of equal variance, a more concentrated set of weights mechanically increases the variance of the aggregate; it indicates greater score dispersion under the simulation assumptions rather than demonstrating greater discriminating power on real projects. The second analysis perturbed every weight by a random factor with a standard deviation of 20 percent over 2,000 replications. The factor-importance ranking was highly stable in Level 1 and Level 2, with mean Spearman correlations of 0.97 and 0.96, whereas Level 3 was less stable because its two factors, with weights of 45.8 and 54.2 percent, are close enough to exchange their order under moderate perturbation. This behavior identifies the relative importance of the two Level-3 factors as the element of the weighting structure most in need of confirmation with a larger expert panel.
4.7. Summary of the Resulting Framework
Taken together, the results produce a complete ex ante project-evaluation architecture: a territorially grounded knowledge matrix, an expert-derived weighting system, an operational tool and a diagnostic output that retains the three principal dimensions of project suitability while identifying factor-specific deficits. The simulation shows that the instrument behaves as an integrated and internally consistent diagnostic system, that under its independent-input assumptions the three dimensions remain computationally separated and carry different information, and that the expert-derived weights increase score dispersion while the factor-importance ranking remains robust to moderate perturbation, with the single exception of the relative weight of the two contextual factors. The scientific implications, transferability and limitations of this architecture are examined in the following section.
5. Discussion
5.1. From Territorial Knowledge to an Evaluative Matrix
The principal contribution of the framework is not a new multi-criteria algorithm but the formalization of a knowledge structure that links territorial diagnosis, implementation capacity, project-territory compatibility and contextual feasibility, together with the translation of that structure into an operational instrument. This places the construction of the evaluation matrix at the center of the research rather than at its margin. The multi-criteria literature supports this emphasis, because the mapping of indicator models from an initial and often intuitive problem-structuring stage to a quantified decision model is a decisive step whose quality conditions the entire assessment [45]. In the present case, the hierarchy of three levels, eleven factors and fifty-six sub-factors is the formalized output of a broader territorial learning process that combined documentary, field, participatory, spatial, governance and security evidence with PESTEL and SWOT synthesis. The added value of the matrix is therefore not the number of variables it contains but the decision logic that organizes them around three analytically different sources of project suitability.
5.2. Relationship with Conventional Development-Evaluation Frameworks
The framework is complementary to, rather than a substitute for, established development-evaluation approaches. The OECD-DAC criteria of relevance, coherence, effectiveness, efficiency, impact and sustainability provide a normative set of lenses for judging the merit of an intervention, and the OECD itself stresses that these criteria are not a method and must be interpreted according to the intervention and its context [16]. The logical framework approach and the theory of change operate mainly at the design stage, where they organize intervention logic, assumptions and causal pathways. The present framework does not replace these tools. It adds a weighted diagnostic layer that asks whether the organizational, territorial and contextual conditions required for implementation are sufficiently favorable, and where redesign is needed, before an intervention is approved. In practice a theory of change could explain how an intervention is expected to work, while the proposed framework would assess whether the implementing team, the project design and the territory are compatible with that logic. The multidimensional orientation of the framework is also consistent with the integrated perspective of the 2030 Agenda for Sustainable Development, particularly its objectives of reducing the vulnerability of exposed populations, strengthening resilient human settlements and improving inclusive and accountable institutions [46], although the framework assesses project suitability rather than measuring progress toward the Sustainable Development Goals.
5.3. Comparison with Ranking and Outranking Methods, and the Question of Compensation
The role of AHP in the framework is narrower than in many project-selection studies. AHP derives the relative importance of factors and sub-factors through expert pairwise comparison, whereas the projects themselves are not compared pairwise, so each project can be evaluated independently against the same reference structure and ideal benchmark. This differs from ranking and outranking approaches such as TOPSIS, VIKOR, ELECTRE and PROMETHEE, which are designed to order a set of competing alternatives. Those methods are appropriate when the decision is explicitly comparative, for example when seismic-risk levels are ranked with a combined-weight TOPSIS model [47], when water-energy strategies are ordered through ELECTRE III outranking [48], or when disaster-recovery facilities are selected with a combined FUCOM and ELECTRE procedure [49]. The framework presented here asks a different question: how suitable is a given project, and where are its weaknesses, regardless of whether another project is currently being considered.
This distinction has direct implications for compensation. The additive weighted aggregation used within each level is partially compensatory, so strong performance in one sub-factor can offset weak performance in another. The decision to keep the three level scores separate rather than collapsing them into one value reduces, but does not eliminate, this property. The compensability of multi-criteria models is a well-studied concern. The distinction between weak and strong compensation has been analyzed explicitly in the prioritization of public investments [50], and partially non-compensatory procedures such as the generalized PROSA method have been proposed precisely to prevent excellent performance in some criteria from masking unacceptable performance in others when strong sustainability is required [51]. In highly vulnerable territories this concern is substantive, because extreme insecurity, unacceptable hazard exposure or the absence of minimum implementation capacity may be conditions under which good performance elsewhere should not render a project acceptable. A future version of the framework could therefore introduce critical thresholds or veto rules. If the decision problem later becomes the selection of one project among several admissible ones, the diagnostic scores and criterion structure produced here could feed a second-stage ranking or portfolio-selection method, in the spirit of portfolio decision analysis in environmental decision making [52].
5.4. Comparison with Post-Disaster and Vulnerability Frameworks
The content of the matrix allows a direct comparison with related frameworks. Post-disaster and vulnerability studies increasingly combine technical, economic, social and environmental criteria, and some incorporate implementation-related concerns such as infrastructure resilience or investment prioritization for resilient coastal communities [53]. The present framework shares this multidimensional orientation but adds two elements that are less commonly separated. First, it evaluates the capacity and territorial knowledge of the implementing team as a dedicated dimension rather than treating implementation capability as an implicit assumption. Second, it isolates contextual feasibility, including previous project experience and insecurity, from the intrinsic characteristics of the proposed project. This separation is consistent with the finding that, in critical and post-disaster settings, contextual constraints such as security, governance and institutional continuity are frequently acknowledged but rarely integrated as primary dimensions within a single decision structure [3]. The comparison also indicates where the matrix could be extended, for instance with explicit sub-factors for supply-chain reliability or land-tenure security, whose importance may be limited in some settings but decisive under blockade, displacement or prolonged institutional collapse. The matrix should therefore be read as a transferable architecture rather than a closed universal list, in line with applications that adapt vulnerability criteria to local conditions and incorporate local and indigenous knowledge [13].
5.5. Interdependence, Uncertainty and the Robustness of Results
Two methodological assumptions deserve comment. First, the AHP hierarchy assumes a reasonably clear separation between elements, yet several factors, in particular governance, participation, equity, socio-economic conditions and insecurity, are conceptually interrelated. When interdependence is important, network-oriented or hybrid methods can represent it more faithfully, for example through a DEMATEL-AHP suitability framework that models the influence relations among criteria [54]. Second, evaluators may be unable to justify precise scores on the 0 to 5 scale. Fuzzy and grey extensions of AHP have been developed to accommodate this kind of uncertainty in vulnerability assessment [55,56], and they could be incorporated without altering the conceptual architecture. More generally, the reliability of multi-criteria sustainability results has itself become a subject of study, with evidence that conclusions can change with weights, indicators and aggregation choices [33,57]. The Monte Carlo and sensitivity analyses reported in this article respond to that concern, although they characterize the behavior of the instrument rather than its predictive accuracy.
5.6. Interpretation and Diagnostic Value of the Instrument
The expert weights provide substantive information about how feasibility was conceptualized in the Canaan context. The dominance of implementation capacity in Level 1 supports the decision to treat the implementing team as an explicit object of evaluation, and the large weight of insecurity in Level 3 shows how the framework translates territorial context into a formal variable, since security conditions in Canaan affect staff access, beneficiary participation and the continuity of activities. The simulation adds a further layer of interpretation. Because the weights of Level 1 and Level 3 are concentrated in one or two sub-factors, the scores of these two dimensions are effectively driven by the technical capacity of the team and by the impact of crime on development, whereas Level 2 behaves as a genuinely multidimensional composite. This concentration is not a defect, but it indicates where the quality of the evidence matters most and where a more parsimonious instrument could later be built. The near-zero cross-dimensional correlations found under the simulation, although partly a consequence of the independent-input design, are consistent with the design choice of reporting a three-component profile, because a single composite would average out information that the separate dimensions preserve.
Reporting the three level scores separately makes it possible to distinguish, for example, a project with a strong design but an inexperienced team from a project with adequate capacity but severe contextual constraints. The education-centre pilot in Appendix A shows this property, because a comparatively strong implementing-team dimension coexists with a moderate project-territory dimension and a constrained contextual dimension, and the underlying factor gaps differ considerably, which directs attention to specific corrective actions such as securing maintenance financing, adding hazard mitigation or strengthening security arrangements.
5.7. The Instrument as an Operational Decision-Support Tool
The implementation is part of the contribution because it links the conceptual matrix with an executable procedure in which weights, scores and diagnostic outputs are connected and traceable. Spreadsheet software is widely available and auditable, which is an advantage in development settings. It also has clear limitations, including the risk of input errors, the accidental modification of formulas and weak version control. The current workbook should therefore be regarded as a reproducible prototype rather than a final technological form. A future web-based implementation could incorporate controlled data entry, the automatic treatment of adverse criteria, the explicit handling of missing data, version histories, evidence attachments, scenario comparison and automated sensitivity analysis, while reproducing the methodological logic rather than altering the criteria without a new validation process.
5.8. Limitations and Research Agenda
Several limitations define a clear research agenda. The framework was derived from a single reference territory, which provides depth but limits claims of universal applicability; replication in flood-prone rural territories, refugee settlements, post-conflict environments or small-island communities would help to separate structurally stable dimensions from those that require recalibration. The expert panel consisted of ten specialists in territorial planning, natural hazards, environmental planning and economics, without development practitioners, local representatives or security specialists; a larger and more heterogeneous panel could modify both the weights and the structure, and the sensitivity analysis already shows that the relative weight of the two Level-3 factors is the least stable element. The assumption of hierarchical independence is imperfect, and network methods could be tested if the objective shifts from transparent diagnosis to the modeling of interdependencies. The results rest on simulation rather than on retrospective or prospective application to real projects, so the framework demonstrates operational feasibility and internal behavior, not predictive validity. Finally, the matrix is deliberately broad, which creates a data-collection burden; a future empirical phase should test whether a parsimonious subset of indicators reproduces most of the diagnostic information, a reduction that the variance analysis suggests is plausible for the most concentrated dimensions but that should be grounded in evidence rather than convenience.
6. Conclusions
This study developed and operationalized HEP-ZAV, an ex ante multi-criteria framework for assessing development projects in highly vulnerable territories. Its main contribution is not the use of AHP but the transformation of a territorial diagnosis into a structured, weighted and traceable evaluation matrix that keeps three sources of project suitability separate: the capacity of the implementing team, the compatibility between the intervention and the territory, and the contextual conditions of implementation. Applied to Canaan (Haiti), the diagnosis was formalized into a hierarchy of three levels, eleven factors and fifty-six sub-factors, weighted by a group AHP exercise with consistency ratios below 0.10 and group consensus above 70 percent, and implemented in a decision-support tool delivered as an Excel application in the Zenodo repository [14].
Because retrospective project data were unavailable, the behavior of the instrument was characterized through a Monte Carlo experiment of 100,000 projects and two sensitivity analyses. These confirmed that the tool behaves as an internally consistent diagnostic system, that under the independent-input simulation design its three dimensions remain computationally separated, and that the expert-derived weights increase score dispersion while the factor-importance ranking remains robust to moderate perturbation, with the sole exception of the relative weight of the two contextual factors. These results describe the internal behavior of the instrument and are not evidence of its ability to predict project success or failure.
The framework is transferable because its architecture separates general decision domains from context-specific content, so the three-level logic can be retained while factors, indicators and weights are recalibrated for other vulnerable territories, from post-disaster reconstruction to informal settlements, flood-prone areas or institutionally fragile contexts. Its limitations should nonetheless be kept in view: a single reference territory, a panel of ten experts, the absence of validation against real project outcomes, a partially compensatory aggregation, interdependent criteria, and a scoring process that mixes quantitative and qualitative evidence.
The central message is that ex ante evaluation in highly vulnerable territories should begin not with a weighting algorithm but with an explicit representation of the knowledge needed to understand why projects may or may not be feasible in a given place. The priorities for the next phase are empirical validation against completed projects, fuzzy or interval scoring, replication with independent panels, non-compensatory thresholds for critical conditions, and a web-based version of the tool. In its present form the framework offers a coherent prototype whose value lies in structuring complex evidence, making assumptions explicit and identifying critical weaknesses before implementation.
Supplementary Materials
The evaluation application is delivered as an Excel workbook (in English) in the Zenodo repository, together with the full hierarchy and descriptors, the aggregated AHP weights, and the Python code for the Monte Carlo and sensitivity analyses. Available online at: https://doi.org/10.5281/zenodo.23612995.
Author Contributions
Conceptualization, R.D., J.M.P.-B. and M.R.-P.; methodology, R.D., J.M.P.-B. and M.R.-P.; software, R.D.and M.R.-P.; validation, R.D., J.M.P.-B. and M.R.-P.; formal analysis, R.D., J.M.P.-B. and M.R.-P.; investigation, R.D., J.M.P.-B. and M.R.-P.; resources, R.D., J.M.P.-B. and M.R.-P.; data curation, R.D., J.M.P.-B. and M.R.-P.; writing - original draft preparation, R.D., J.M.P.-B. and M.R.-P.; writing - review and editing, R.D., J.M.P.-B. and M.R.-P.; visualization, R.D., J.M.P.-B. and M.R.-P.; supervision, R.D., J.M.P.-B. and M.R.-P.; project administration J.M.P.-B. and M.R.-P.; funding acquisition, J.M.P.-B. and M.R.-P. All authors have read and agreed to the published version of the manuscript.
Funding
This research was funded by the Office for Development Cooperation (Oficina de Cooperacio al Desenvolupament Solidari, OCDS) of the University of the Balearic Islands (UIB), through the call for University Development Cooperation Projects (Projectes de Cooperacio Universitaria al Desenvolupament), under the project “Design of a diagnostic and self-assessment tool for projects in areas of high socio-environmental vulnerability: the case of Canaan (Haiti)” (2017 to 2021), directed by J.M.P.-B., within the cooperation framework between the UIB and the State University of Haiti; and by a research-stay grant (2023) funded by the OCDS of the UIB and the Government of the Balearic Islands (Govern de les Illes Balears).
Data Availability Statement
The evaluation instrument (Excel application) and the simulation code are openly available in the Zenodo repository at https://doi.org/10.5281/zenodo.23612995. No other new data were created.
Conflicts of Interest
The authors declare no conflicts of interest.
Appendix A. Illustrative Application: Evaluation of an Education-Centre Pilot
To show how HEP-ZAV is applied in practice, this appendix reports a complete evaluation of a hypothetical pilot project: the construction of a primary education centre in a sector of Canaan. The case is illustrative and is not an empirical validation; its purpose is to make visible the kind of diagnostic output the instrument produces for a single project. The project is assumed to be led by a technically experienced non-governmental organization working with a local partner. Each indicator was scored on the 0 to 5 suitability scale defined in Section 3.5, the indicator scores were consolidated into the fifty-six sub-factors, and the group AHP weights of Section 4.2 were applied through the spreadsheet tool. The completed workbook for this case, including the evidence and justification recorded for every indicator, is provided in the Zenodo repository.
Table A1 summarizes the results by factor and Figure A1 displays the resulting profile. The project obtains a three-component suitability profile of A(P) = [67.7, 54.0, 47.8] on the 0 to 100 scale, with the evidence confidence of the assessment rated Moderate for the implementing-team and project-territory dimensions and Low for the contextual dimension. In this illustrative case every indicator was scored, so the evidence coverage of each level is complete and the comparison with the ideal benchmark is fully interpretable. Consistent with the logic of the model, the three dimensions are read side by side rather than averaged into a single figure.

Table A1.
Factor-level results of the education-centre pilot. Attainment is the share of the factor weight achieved by the project; contribution is the points the factor adds to its level score (0 to 100).
Table A1.
Factor-level results of the education-centre pilot. Attainment is the share of the factor weight achieved by the project; contribution is the points the factor adds to its level score (0 to 100).
| Factor | Weight (% of level) | Attainment (%) | Contribution to level |
|---|---|---|---|
| 1.1. Experience and implementation capacity | 58.5 | 77.3 | 45.24 |
| 1.2. Verified knowledge of the geographical area | 41.5 | 54.0 | 22.42 |
| Level 1: Implementing-team capacity | 100 | 67.7 | 67.66 |
| 2.1. Socio-economic aspects of the project | 24.6 | 48.1 | 11.84 |
| 2.2. Exposure to natural hazards and resilience | 27.5 | 48.1 | 13.22 |
| 2.3. Impact on the natural environment | 11.9 | 57.3 | 6.82 |
| 2.4. Infrastructure and services | 12.2 | 60.3 | 7.36 |
| 2.5. Governance | 8.7 | 63.2 | 5.50 |
| 2.6. Equity and social justice | 9.1 | 67.9 | 6.18 |
| 2.7. Community participation and empowerment | 6.0 | 51.7 | 3.10 |
| Level 2: Project-territory compatibility | 100 | 54.0 | 54.02 |
| 3.1. Experience acquired from other projects | 45.8 | 52.1 | 23.88 |
| 3.2. Insecurity and crime | 54.2 | 44.1 | 23.88 |
| Level 3: Contextual feasibility | 100 | 47.8 | 47.76 |
Figure A1.
Diagnostic output for the education-centre pilot: (a) the three-dimensional suitability profile against the ideal project, with the gap to the ideal; (b) the attainment of each factor, expressed as the share of the factor weight achieved. The dashed line at 50 marks the mid-point of the scale.
Figure A1.
Diagnostic output for the education-centre pilot: (a) the three-dimensional suitability profile against the ideal project, with the gap to the ideal; (b) the attainment of each factor, expressed as the share of the factor weight achieved. The dashed line at 50 marks the mid-point of the scale.

The profile locates the weaknesses of the project precisely. Implementing-team capacity is the strongest dimension (67.7), reflecting a technically capable organization, although its verified knowledge of the area reaches only 54 percent of the attainable weight. The project-territory dimension is moderate (54.0): the facility responds to a genuine service gap in education, but the long-term financing of operation and maintenance and the adaptation to flood and other natural hazards are its main shortfalls. The contextual dimension is the binding constraint (47.8), dominated by the insecurity and crime factor, which carries the largest weight at level 3 and attains only 44 percent. Expressed as relative deficits with respect to the ideal benchmark, the five largest factor gaps are insecurity and crime (55.9 percent), the socio-economic aspects of the project (51.9 percent), exposure to natural hazards (51.9 percent), community participation (48.3 percent) and experience from previous projects (47.9 percent). Used before approval, this diagnosis would direct project improvement toward maintenance financing, hazard-sensitive design and security arrangements rather than toward the technical design of the building, which is precisely the screening and improvement role for which the instrument is intended.
References
- Mohammadnazari, Z.; Mousapour Mamoudan, M.; Alipour-Vaezi, M.; Aghsami, A.; Jolai, F.; Yazdani, M. Prioritizing post-disaster reconstruction projects using an integrated multi-criteria decision-making approach: A case study. Buildings 2022, 12, 136. [Google Scholar] [CrossRef]
- Joseph, J.; Jadhav, A.V. A pragmatic approach to operationalize impartiality: A case study of transition shelter reconstruction in the context of Nepal earthquake 2015. Int. J. Disaster Risk Reduct. 2024, 108, 104446. [Google Scholar] [CrossRef]
- Ashour, A.; Cruz, C.O. Decision-making for post-disaster housing reconstruction in critical zones: A systematic review of criteria, strategies, and research gap. Buildings 2026, 16, 3049. [Google Scholar] [CrossRef]
- United Nations Office for Disaster Risk Reduction (UNDRR). Sendai Framework for Disaster Risk Reduction 2015-2030; United Nations: Geneva, Switzerland, 2015; Available online: https://www.undrr.org/publication/sendai-framework-disaster-risk-reduction-2015-2030 (accessed on 24 October 2026).
- Global Facility for Disaster Reduction and Recovery (GFDRR). Disaster Recovery Framework Guide, Revised Version; World Bank Group: Washington, DC, USA, 2020; Available online: https://www.gfdrr.org/en/publication/disaster-recovery-framework-guide (accessed on 24 October 2026).
- Atmaca, E.; Aktas, E.; Ozturk, H.N. Evaluated post-disaster and emergency assembly areas using multi-criteria decision-making techniques: A case study of Turkey. Sustainability 2023, 15, 8350. [Google Scholar] [CrossRef]
- Elkady, S.; Mehryar, S.; Hernantes, J.; Labaka, L. Prioritizing stakeholder interactions in disaster management: A TOPSIS-based decision support tool for enhancing community resilience. Prog. Disaster Sci. 2024, 22, 100320. [Google Scholar] [CrossRef]
- Abdullah, A.G.; Utami, H.P.; Gunawan, B.; Ratmono, B.M.; Pasaribu, N.T. Multi-criteria decision-making for wind power project feasibility: Trends, techniques, and future directions. Clean. Eng. Technol. 2025, 27, 100987. [Google Scholar] [CrossRef]
- Lindfors, A. Assessing sustainability with multi-criteria methods: A methodologically focused literature review. Environ. Sustain. Indic. 2021, 12, 100149. [Google Scholar] [CrossRef]
- Saaty, T.L. Decision making with the analytic hierarchy process. Int. J. Serv. Sci. 2008, 1, 83–98. [Google Scholar] [CrossRef]
- Ishizaka, A.; Labib, A. Review of the main developments in the analytic hierarchy process. Expert Syst. Appl. 2011, 38, 14336–14345. [Google Scholar] [CrossRef]
- Dulawan, J.M.T.; Imamura, Y.; Konishi, T.; Amaguchi, H.; Ohara, M. A systematic framework for assessing social vulnerability to flood for integrated flood risk management: A case study in Metro Manila, Philippines. Int. J. Disaster Risk Reduct. 2024, 112, 104778. [Google Scholar] [CrossRef]
- Membele, G.M.; Naidu, M.; Mutanga, O. Application of analytic network process (ANP), local and indigenous knowledge in mapping flood vulnerability in an informal settlement. Nat. Hazards 2024, 120, 2929–2951. [Google Scholar] [CrossRef]
- Desravines, R. La Exposicion de Canaan (Haiti) a los Riesgos Naturales y Antropicos: Proyectos de Desarrollo Urbano y Gobernanza Postcatastrofe, desde 2010 hasta 2023. Ph.D. Thesis, Universitat de les Illes Balears, Palma, Spain, 2024. Available online: https://aplicaciones.ciencia.gob.es/teseo/#/tesis/O841270/detalle (accessed on 24 October 2026).
- De Marinis, P.; Sali, G. Participatory analytic hierarchy process for resource allocation in agricultural development projects. Eval. Program Plan. 2020, 80, 101793. [Google Scholar] [CrossRef]
- OECD. Applying Evaluation Criteria Thoughtfully; OECD Publishing: Paris, France, 2021. [Google Scholar] [CrossRef]
- Wood, N.; Jones, J.; Schelling, J.; Schmidtlein, M. Tsunami vertical-evacuation planning in the US Pacific Northwest as a geospatial, multi-criteria decision problem. Int. J. Disaster Risk Reduct. 2014, 9, 68–83. [Google Scholar] [CrossRef]
- Nyimbili, P.H.; Erden, T. Comparative evaluation of GIS-based best-worst method (BWM) for emergency facility planning: Perspectives from two decision-maker groups. Nat. Hazards 2021, 105, 1031–1067. [Google Scholar] [CrossRef]
- Amin Hosseini, S.M.; Ghalambordezfooly, R.; de la Fuente, A. Sustainability model to select optimal site location for temporary housing units: Combining GIS and the MIVES-knapsack model. Sustainability 2022, 14, 4453. [Google Scholar] [CrossRef]
- Boultif, M.; Hafnaoui, M.A. Prioritizing flood vulnerability hotspots: An integrated AHP and TOPSIS framework, case study of El Bayadh city, western Algeria. J. Afr. Earth Sci. 2026, 240, 106166. [Google Scholar] [CrossRef]
- Al-Juaidi, A.E.M.; Emam, A.A. Flood vulnerability assessment of Wadi Numan, Makkah: Insights from advanced multicriteria decision analysis and fuzzy logic techniques. J. Hydrol. Eng. 2026, 31, 04026004. [Google Scholar] [CrossRef]
- Salehpour Jam, A.; Mosaffaie, J.; Sarfaraz, F.; Shadfar, S.; Akhtari, R. GIS-based landslide susceptibility mapping using hybrid MCDM models. Nat. Hazards 2021, 108, 1025–1046. [Google Scholar] [CrossRef]
- Khelali, M.; Bensekhria, A.; Bouhata, R.; Djabri, A.D.; Hanini, W.; Sanga, A.; Ominde, J.; Jung, A. An integrated remote sensing and AHP framework for forest fire vulnerability assessment in Gironde, France. Nat. Hazards 2026, 122, 626. [Google Scholar] [CrossRef]
- Renthlei, E.; George, A. Toward holistic neighbourhood sustainability assessment: Integrating fuzzy Delphi method for sustainable indicator selection for Aizawl city. Local Environ. 2025, 30, 622–641. [Google Scholar] [CrossRef]
- Bernardo, H.; Gaspar, A.; Antunes, C.H. A combined value focused thinking-soft systems methodology approach to structure decision support for energy performance assessment of school buildings. Sustainability 2018, 10, 2295. [Google Scholar] [CrossRef]
- Caldatto, F.C.; Bortoluzzi, S.C.; de Lima, E.P.; Gouvea da Costa, S.E. Urban sustainability performance measurement of a small Brazilian city. Sustainability 2021, 13, 9858. [Google Scholar] [CrossRef]
- Aguaron, J.; Escobar, M.T.; Moreno-Jimenez, J.M. Reducing incompatibility in a local AHP-group decision making context. Ann. Oper. Res. 2023, 326, 1–26. [Google Scholar] [CrossRef]
- Groselj, P. Symmetric projection group approach for promoting homogeneity in the analytic hierarchy process. Comput. Oper. Res. 2021, 133, 105343. [Google Scholar] [CrossRef]
- Dong, Y.; Zhang, G.; Hong, W.-C.; Xu, Y. Consensus models for AHP group decision making under row geometric mean prioritization method. Decis. Support Syst. 2010, 49, 281–289. [Google Scholar] [CrossRef]
- Aguaron, J.; Escobar, M.T.; Moreno-Jimenez, J.M. The precise consistency consensus matrix in a local AHP-group decision making context. Ann. Oper. Res. 2016, 245, 245–259. [Google Scholar] [CrossRef]
- Duleba, S.; Blahota, I. Optimizing stakeholder weights in group AHP for consensus creation, a contribution to the MAMCA methodology. Ann. Oper. Res. 2026, 357, 837–857. [Google Scholar] [CrossRef]
- Goepel, K.D. Implementation of an online software tool for the analytic hierarchy process (AHP-OS). Int. J. Anal. Hierarchy Process 2018, 10, 469–487. [Google Scholar] [CrossRef]
- Nguyen, T.L.; Le, N.H. Enhancing the reliability of social vulnerability assessment to natural hazards through combined machine learning methods: A case study in Vietnam. Nat. Hazards Res. 2026, 6, 283–298. [Google Scholar] [CrossRef]
- Sen, M.K.; Dutta, S.; Kabir, G.; Pujari, N.N.; Laskar, S.A. An integrated approach for modelling and quantifying housing infrastructure resilience against flood hazard. J. Clean. Prod. 2021, 288, 125526. [Google Scholar] [CrossRef]
- Juznic-Zonta, Z.; Guisasola, A.; Baeza, J.A. Smart-Plant Decision Support System (SP-DSS): Defining a multi-criteria decision-making framework for the selection of WWTP configurations with resource recovery. J. Clean. Prod. 2022, 367, 132873. [Google Scholar] [CrossRef]
- Renfrew, D.; Vasilaki, V.; Katsou, E. Indicator based multi-criteria decision support systems for wastewater treatment plants. Sci. Total Environ. 2024, 915, 169903. [Google Scholar] [CrossRef]
- Davis, D.; Zvirgzdins, J.; Weerakoon, T.G.; Geipele, I.; Cheshara, L. Hybrid multiple-criteria decision-making (MCDM) framework for optimizing water-energy nexus. Sustainability 2026, 18, 3097. [Google Scholar] [CrossRef]
- Sorkhab, M.B.; Gray, N.; Wall, D.; Murphy, J.D.; O’Shea, R. A perspective on the role of multi-criteria decision-making in assessing the sustainability of alternative shipping fuels. J. Clean. Prod. 2026, 571, 148658. [Google Scholar] [CrossRef]
- United Nations Development Programme (UNDP). UNDP’s Social and Environmental Screening Procedure (SESP); UNDP: New York, NY, USA, 2021; Available online: https://www.undp.org/publications/undps-social-and-environmental-screening-procedure-sesp (accessed on 24 October 2026).
- United Nations Human Settlements Programme (UN-Habitat). Guide to the City Resilience Profiling Tool; UN-Habitat: Nairobi, Kenya, 2018; Available online: https://unhabitat.org/guide-to-the-city-resilience-profiling-tool (accessed on 24 October 2026).
- Chasanah, N.; Gunawan, I.; Baroudi, B. International development project success: A literature review. J. Int. Dev. 2024, 36, 146–171. [Google Scholar] [CrossRef]
- Xu, Z.S. On consistency of the weighted geometric mean complex judgement matrix in AHP. Eur. J. Oper. Res. 2000, 126, 683–687. [Google Scholar] [CrossRef]
- Ivanco, M.; Hou, G.; Michaeli, J. Sensitivity analysis method to address user disparities in the analytic hierarchy process. Expert Syst. Appl. 2017, 90, 111–126. [Google Scholar] [CrossRef]
- Vavatsikos, A.P.; Tsesmetzis, E.; Koulinas, G.; Koulouriotis, D. A robust group decision making framework using fuzzy TOPSIS and Monte Carlo simulation for wind energy projects multicriteria evaluation. Oper. Res. 2022, 22, 6055–6073. [Google Scholar] [CrossRef]
- Wolfslehner, B.; Vacik, H. Mapping indicator models: From intuitive problem structuring to quantified decision-making in sustainable forest management. Ecol. Indic. 2011, 11, 274–283. [Google Scholar] [CrossRef]
- United Nations. Transforming Our World: The 2030 Agenda for Sustainable Development; A/RES/70/1; United Nations: New York, NY, USA, 2015; Available online: https://sdgs.un.org/2030agenda (accessed on 24 October 2026).
- Zhu, J.; Zhang, Y.; Zhang, J.; Chen, Y.; Liu, Y.; Liu, H. Multi-criteria seismic risk assessment based on combined weight-TOPSIS model and CF-logistic regression model: A case study of Songyuan City, China. Sustainability 2023, 15, 11216. [Google Scholar] [CrossRef]
- Zhou, Q.; Dou, L.; Wang, S. Data-driven multi-criteria outranking of water-energy strategies using ELECTRE III. Front. Environ. Sci. 2026, 14, 1840064. [Google Scholar] [CrossRef]
- Uslu, A.; Uslu, G. Sustainable selection of disaster recovery centers: A comparative GIS analysis and FUCOM-based ELECTRE I approach for digital infrastructure resilience. Sustainability 2026, 18, 4543. [Google Scholar] [CrossRef]
- De Mare, G.; Granata, M.F.; Nestico, A. Weak and strong compensation for the prioritization of public investments: Multidimensional analysis for pools. Sustainability 2015, 7, 16022–16038. [Google Scholar] [CrossRef]
- Ziemba, P. Towards strong sustainability management: A generalized PROSA method. Sustainability 2019, 11, 1555. [Google Scholar] [CrossRef]
- Lahtinen, T.J.; Hamalainen, R.P.; Liesio, J. Portfolio decision analysis methods in environmental decision making. Environ. Model. Softw. 2017, 94, 73–86. [Google Scholar] [CrossRef]
- Ayyildiz, E.; Imamoglu, G.; Kose, Y.; Murat, M. Prioritizing infrastructure investment alternatives in industrial zones for resilient coastal communities using an integrated Pythagorean fuzzy decision-making approach. J. Coast. Conserv. 2026, 30, 95. [Google Scholar] [CrossRef]
- Tian, Y.; Zhang, G.; Sang, Z.; Chen, Y.; Yan, F. A DEMATEL-AHP-based suitability assessment framework for geothermal water extraction from low- to medium-temperature sedimentary-basin resources: A case study of Lindian County, China. Geomech. Geophys. Geo-Energy Geo-Resour. 2026, 12, 132. [Google Scholar] [CrossRef]
- Roy, D.; Dhar, A.; Desai, V.R. A grey fuzzy analytic hierarchy process-based flash flood vulnerability assessment in an ungauged Himalayan watershed. Environ. Dev. Sustain. 2024, 26, 18181–18206. [Google Scholar] [CrossRef]
- Guler, M.; Buyukozkan, G. Cybersecurity maturity assessment using an incomplete hesitant fuzzy AHP method and Bonferroni means operator. Expert Syst. Appl. 2025, 282, 127268. [Google Scholar] [CrossRef]
- Rad, M.; Sonesson, U.; Hoglund, E.; Ostergren, K. Multi-criteria decision analysis (MCDA) for sustainability assessment: How reliable are the results? Sustain Futur. 2026, 11, 101657. [Google Scholar] [CrossRef]
Figure 1.
Methodological workflow used to construct, operationalize and characterize the HEP-ZAV framework.
Figure 1.
Methodological workflow used to construct, operationalize and characterize the HEP-ZAV framework.
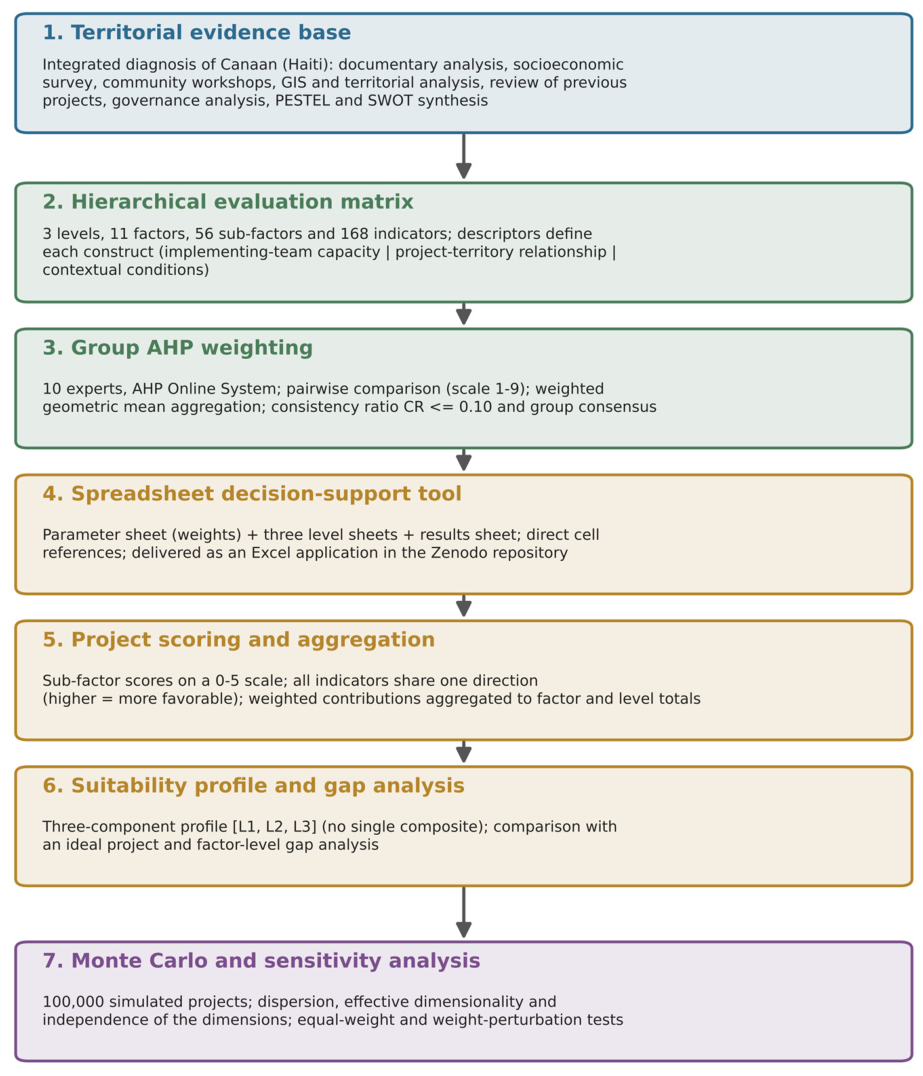
Figure 2.
Monte Carlo distribution of the three suitability dimensions (N = 100,000). Dotted lines mark the education-centre pilot evaluated in Appendix A.
Figure 2.
Monte Carlo distribution of the three suitability dimensions (N = 100,000). Dotted lines mark the education-centre pilot evaluated in Appendix A.
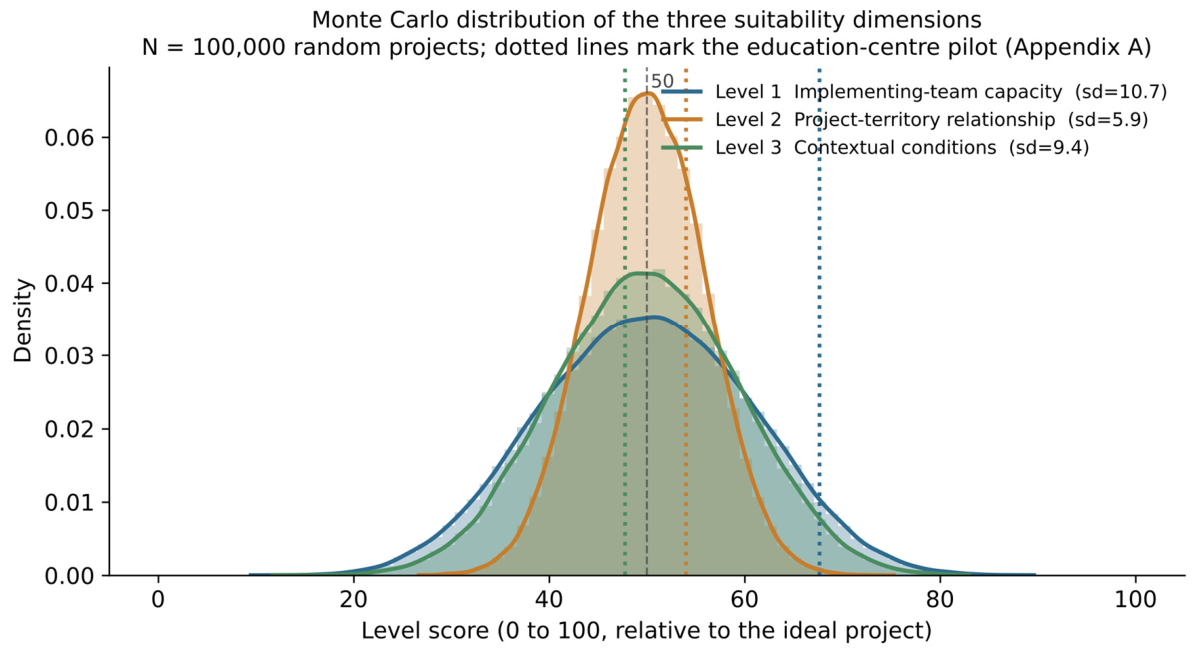
Figure 3.
Dispersion of each dimension and concentration of weights, expressed as the effective number of sub-factors.
Figure 3.
Dispersion of each dimension and concentration of weights, expressed as the effective number of sub-factors.
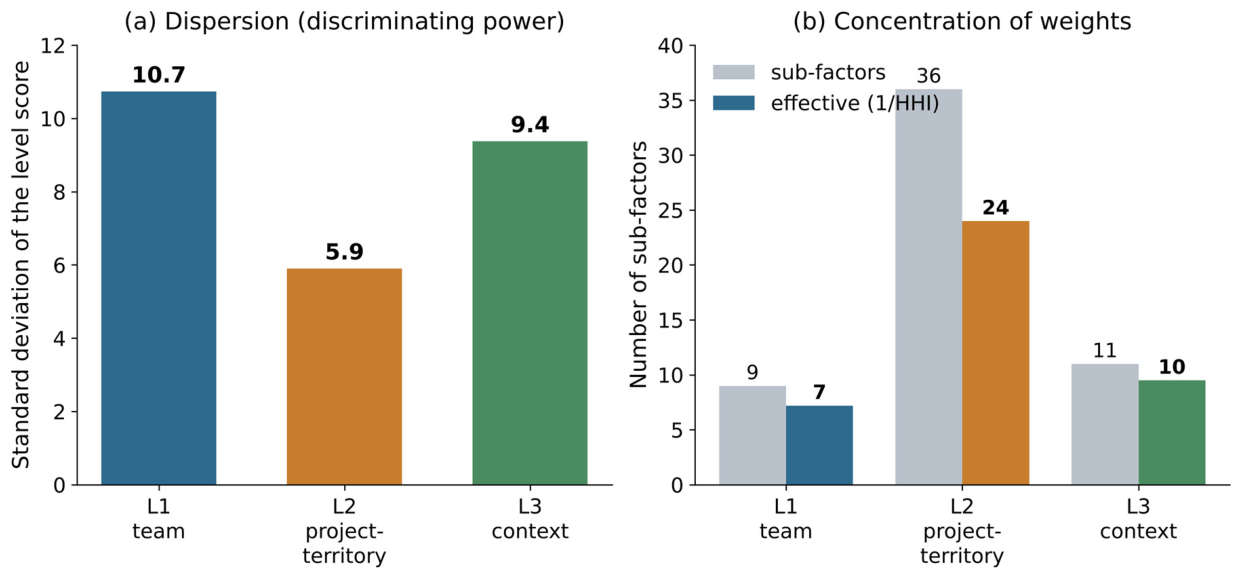
Figure 4.
Sub-factors that dominate the variance of each dimension.
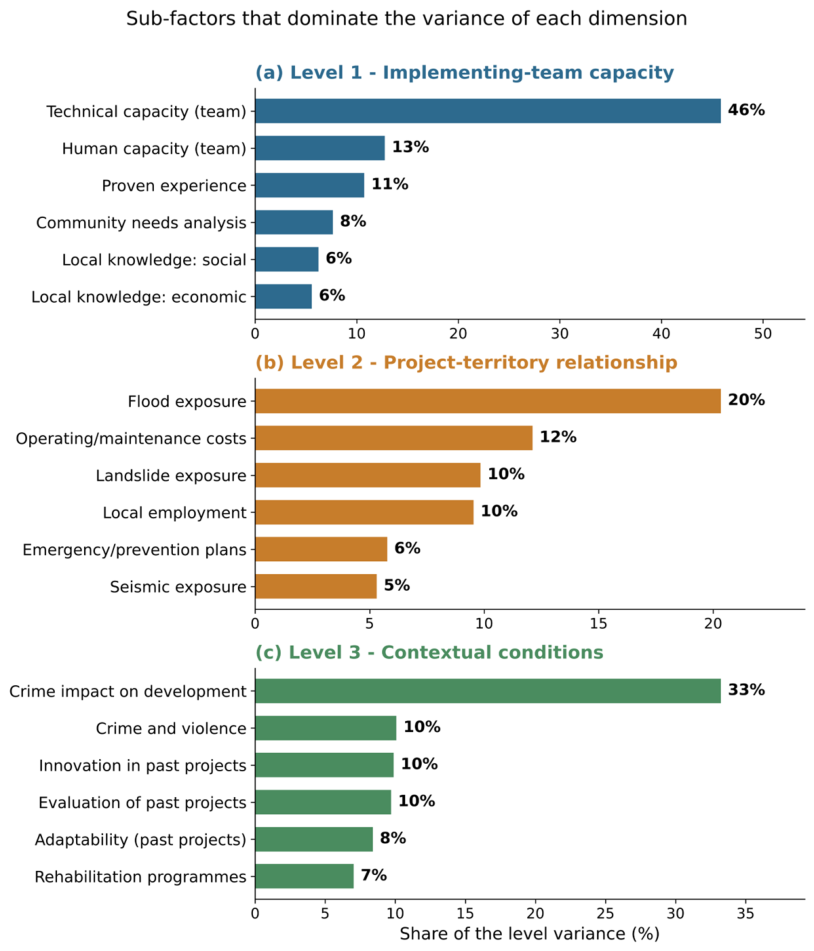
Figure 5.
Sensitivity to the weighting scheme: AHP weights compared with equal weights, by level.
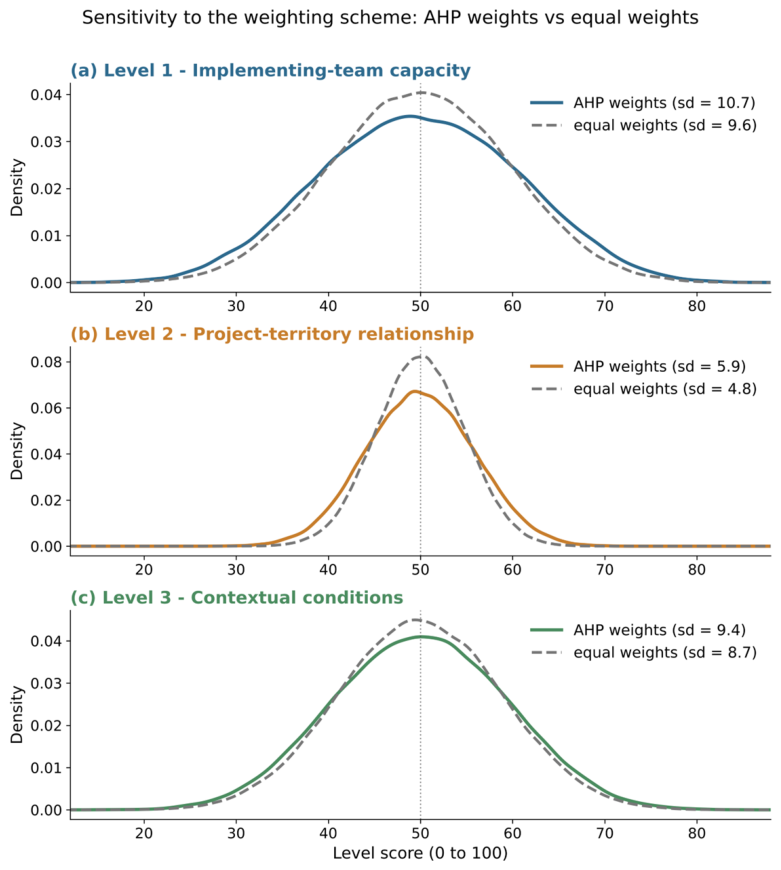
Table 1.
Comparative positioning of representative MCDA contributions in relation to the proposed framework.
Table 1.
Comparative positioning of representative MCDA contributions in relation to the proposed framework.
| Study | Decision problem | Construction of criteria | Weighting or evaluation | Difference from this study |
|---|---|---|---|---|
| Wood et al. [17] | Evacuation siting | Spatial criteria from hazard analysis | GIS multi-criteria scoring | Ranks sites, not ex ante project suitability |
| Nyimbili & Erden [18] | Emergency-facility location | Criteria from literature and experts | Best-worst method, two groups | Facility ranking, no project-territory diagnosis |
| Amin Hosseini et al. [19] | Temporary-housing site selection | Predefined sustainability criteria | MIVES-knapsack with GIS | Optimizes location, not implementability |
| Atmaca et al. [6] | Assembly-area evaluation | Predefined disaster criteria | AHP and other MCDM methods | Comparative ranking with a single composite |
| Membele et al. [13] | Flood-vulnerability mapping | Local and indigenous knowledge | Analytic network process | Measures vulnerability, not project suitability |
| Renthlei & George [24] | Indicator selection | Fuzzy Delphi screening | Indicator weighting | Builds indicators, no operational project tool |
| Elkady et al. [7] | Stakeholder prioritization | Criteria from resilience literature | TOPSIS decision-support tool | Prioritizes interactions, not project diagnosis |
| This study (HEP-ZAV) | Ex ante project suitability | Integrated territorial diagnosis | Group AHP in a traceable tool | Three separate suitability dimensions, no ranking required |
Table 2.
Hierarchical organization of the evaluation framework.
| Level | Content | Factors | Sub-factors | Indicators |
|---|---|---|---|---|
| Level 1 | Implementing-team capacity | 2 | 9 | 27 |
| Level 2 | Project-territory relationship | 7 | 36 | 108 |
| Level 3 | Contextual conditions for implementation | 2 | 11 | 33 |
| Total | 11 | 56 | 168 |
Table 3.
Scoring scale applied to each indicator. The sub-factor score is the mean of the scores of its indicators, excluding any indicator marked N/A.
Table 3.
Scoring scale applied to each indicator. The sub-factor score is the mean of the scores of its indicators, excluding any indicator marked N/A.
| Score | Interpretation |
|---|---|
| 0 | Least favourable / critical condition |
| 1 | Very low suitability |
| 2 | Low suitability |
| 3 | Moderate suitability |
| 4 | High suitability |
| 5 | Very high / fully favourable suitability |
| N/A | Missing or unavailable evidence; excluded from the sub-factor mean |
Table 4.
AHP-derived weights of the eleven major factors, with the most influential sub-factor of each factor.
Table 4.
AHP-derived weights of the eleven major factors, with the most influential sub-factor of each factor.
| Level | Factor | Factor weight (% of level) | Most influential sub-factor (% of level) |
|---|---|---|---|
| 1 | 1.1 Experience and implementation capacity | 58.5 | Technical capacity (25.2) |
| 1 | 1.2 Knowledge of the geographical context | 41.5 | Community needs analysis (10.3) |
| 2 | 2.1 Socio-economic aspects | 24.6 | Operating and maintenance costs (7.1) |
| 2 | 2.2 Natural hazards and climate resilience | 27.5 | Flood exposure (9.2) |
| 2 | 2.3 Impact on the natural environment | 11.9 | Abiotic impact and mitigation (3.8) |
| 2 | 2.4 Infrastructure and services | 12.2 | Basic infrastructure (3.3) |
| 2 | 2.5 Governance | 8.7 | Inter-administration collaboration (2.1) |
| 2 | 2.6 Equity and social justice | 9.1 | Equitable distribution of benefits (2.7) |
| 2 | 2.7 Community participation and empowerment | 6.0 | Participation in planning (2.2) |
| 3 | 3.1 Experience from previous projects | 45.8 | Innovation in past projects (10.2) |
| 3 | 3.2 Insecurity and crime | 54.2 | Crime impact on development (18.7) |
Table 5.
Monte Carlo summary statistics for the three suitability dimensions (N = 100,000).
| Dimension | Mean | SD | p5 | p50 | p95 | Effective sub-factors | P(level >= 50) |
|---|---|---|---|---|---|---|---|
| Level 1 (team capacity) | 50.0 | 10.7 | 32.3 | 50.0 | 67.6 | 7.2 of 9 | 50.1% |
| Level 2 (project-territory) | 50.0 | 5.9 | 40.3 | 50.0 | 59.7 | 24.0 of 36 | 50.0% |
| Level 3 (context) | 50.0 | 9.4 | 34.6 | 50.0 | 65.4 | 9.5 of 11 | 49.9% |
Disclaimer/Publisher’s Note: The statements, opinions and data contained in all publications are solely those of the individual author(s) and contributor(s) and not of MDPI and/or the editor(s). MDPI and/or the editor(s) disclaim responsibility for any injury to people or property resulting from any ideas, methods, instructions or products referred to in the content. |
© 2026 by the authors. Licensee MDPI, Basel, Switzerland. This article is an open access article distributed under the terms and conditions of the Creative Commons Attribution (CC BY) license.
Copyright: This open access article is published under a Creative Commons CC BY 4.0 license, which permit the free download, distribution, and reuse, provided that the author and preprint are cited in any reuse.