

Submitted:
24 October 2026
Posted:
26 October 2026
You are already at the latest version
Abstract
Molecular diagnostics and next-generation sequencing have greatly expanded our ability to identify and characterize microorganisms within the vaginal environment. However, identifying which microorganisms are present does not fully describe the ecological state in which they interact with the host. Routine vaginal microscopy provides complementary information by simultaneously revealing microbial morphology and abundance, epithelial status, microbial organization, cytolytic changes, and the host inflammatory response. Yet, while disease-specific diagnostic systems standardize selected microscopic findings, no common framework exists to represent this broader ecological information as a whole. To address this gap, we developed the Vaginal Radar Assessment Diagram (V-RAD), a conceptual framework that translates routine microscopic observations into a standardized graphical representation of the vaginal ecosystem. V-RAD integrates six independently assessed dimensions covering microbial composition and abundance, epithelial status, microbial spatial organization, host–microbiota interaction, and inflammatory response, preserving their individual contribution without reducing them to a composite score. Representative profiles illustrate how the framework can describe physiological conditions, classical dysbiotic syndromes, mixed presentations, and transitional states within the same graphical language. By making the multidimensional information generated during microscopy explicit and comparable, V-RAD may provide a common framework for documenting vaginal ecology, following its changes over time, and integrating microscopic findings with current and emerging diagnostic technologies.
Keywords:
V-RAD
; vaginal microscopy
; vaginal ecosystem
; vaginal dysbiosis
; vaginal microbiome
; bacterial vaginosis
; aerobic vaginitis
; vaginitis
1. Introduction
Despite the remarkable advances in molecular diagnostics and next-generation sequencing (NGS), microscopic examination of vaginal specimens remains an indispensable component of routine clinical practice (Sherrard et al., 2018; France et al., 2020; Vieira-Baptista et al., 2023; Mendling et al., 2026). It remains the only routinely available diagnostic technique capable of simultaneously assessing microbial morphology, epithelial maturation, inflammatory infiltrate, microbial abundance, microscopic features consistent with biofilm formation, and cytological alterations during a single examination (Nugent et al., 1991; Donders et al., 2002). This unique ability to integrate microbial, cellular, and host-response information during a single examination allows immediate correlation with clinical findings and continues to make vaginal microscopy an essential complement to molecular diagnostic approaches rather than a competing methodology (Agoni, 2026).
To improve the reproducibility of microscopic diagnosis, several standardized scoring systems have been developed over the past decades. The Nugent score (Nugent et al., 1991) has become the laboratory reference standard for bacterial vaginosis (BV), whereas the Ison-Hay classification (Ison and Hay, 2002) proposed a simplified grading system that was later expanded to acknowledge inflammatory microscopic patterns. The Donders score (Donders et al., 2002) subsequently introduced a structured approach for the diagnosis of aerobic vaginitis (AV). Collectively, these methods have substantially improved the diagnosis and reproducibility of individual vaginal disorders and have become integral components of both routine clinical practice and clinical research (Sherrard et al., 2018; Vieira-Baptista et al., 2023).
However, while disease-specific scoring systems have standardized the interpretation of individual vaginal disorders, each was developed to evaluate a specific biological domain rather than to provide a comprehensive representation of the vaginal ecosystem. During routine microscopic examination, clinicians simultaneously evaluate a much broader spectrum of biological features than those incorporated into any individual scoring system. Microbial composition, epithelial maturation, inflammatory response, microbial organization, cytological changes, and overall microbial abundance are all assessed concurrently before being interpreted according to one or more diagnostic frameworks. Consequently, vaginal microscopy inherently generates multidimensional ecological information, whereas current diagnostic systems typically translate these observations into disease-oriented classifications (Agoni et al., 2026).
This conceptual limitation becomes particularly evident in ecological conditions that do not fit neatly within a single diagnostic category. Mixed dysbiotic states, transitional ecological conditions, physiological hormonal changes, post-treatment microbiota alterations, and overlapping microscopic patterns often require the observer to integrate multiple biological observations before determining which diagnostic framework is most appropriate. In daily practice, experienced microscopists routinely perform this multidimensional assessment as part of their diagnostic reasoning. Nevertheless, this observational process remains largely implicit and lacks a standardized method for documenting, communicating, and comparing the overall ecological state of the vaginal ecosystem.
To address this unmet need, we developed the Vaginal Radar Assessment Diagram (V-RAD), a conceptual framework designed to standardize the multidimensional representation of the ecological information generated during routine vaginal microscopy. The V-RAD provides a common descriptive and representational framework that complements existing diagnostic systems while preserving the multidimensional nature of microscopic observations.
The aim of this paper is to introduce the conceptual basis of the V-RAD framework, describe its biological rationale and methodological structure, and illustrate its potential as a standardized graphical language for representing the multidimensional ecological information generated during vaginal microscopy.
2. Conceptual Foundation
The V-RAD (Vaginal Radar Assessment Diagram) was conceived from a simple conceptual premise: an adequate representation of the vaginal ecosystem should preserve its multidimensional biological structure rather than compress it into a single numerical value. Microscopic examination simultaneously captures multiple ecological dimensions—including microbial composition, epithelial status, biofilm-associated organization, microbial abundance, cytolytic activity, and inflammatory response—that reflect distinct biological processes. Although these dimensions collectively contribute to the ecological state of the vaginal environment, they are not biologically interchangeable and should not necessarily be interpreted as components of a single linear continuum.
Conventional microscopic scoring systems have provided valuable diagnostic standardization by translating complex observations into numerical scores (Nugent et al., 1991; Donders et al., 2002; Ison and Hay, 2002). However, any scalar metric necessarily summarizes heterogeneous biological variables into a single value. While this simplification facilitates classification, it may obscure the individual contribution of each ecological dimension and reduce the ability to recognize biologically distinct but numerically similar microscopic patterns.
The V-RAD was developed to address this representational rather than diagnostic challenge. Its purpose is not to replace existing scoring systems, redefine diagnostic criteria, or generate an alternative classification of vaginal disorders. Instead, it provides a standardized visual language that preserves the distinct contributions of multiple ecological dimensions while integrating them into a single graphical profile.
Within this framework, each axis represents a distinct biological dimension rather than a disease-specific feature. The resulting radar profile therefore constitutes a multidimensional ecological profile of the microscopic specimen, allowing complex biological patterns to emerge from the simultaneous visualization of independent variables rather than being inferred from a single composite score. In this respect, the V-RAD shifts the emphasis from score generation to information preservation.
The design of the V-RAD also reflects a cognitive objective. Beyond biological accuracy, an effective representation should remain immediately interpretable by the observer. For this reason, the model seeks a balance between ecological completeness and visual simplicity, preserving the principal dimensions of the vaginal ecosystem while maintaining a graphical structure that facilitates pattern recognition, comparison between specimens, longitudinal follow-up, and communication among clinicians and researchers.
Overall, the V-RAD should be regarded as a conceptual representation framework rather than a diagnostic instrument. It provides a standardized method for visualizing the multidimensional ecological state of the vaginal ecosystem without assigning diagnostic labels or replacing clinical judgement. The diagnostic value, reproducibility, and clinical applications of this framework remain to be established through dedicated validation studies.
3. Definition of the Ecological Dimensions
The V-RAD framework is based on the assumption that the ecological state of the vaginal ecosystem cannot be adequately represented by a single biological variable. Instead, it emerges from the interaction of multiple complementary dimensions that collectively describe the host–microbiota interface. The objective of the V-RAD is not to capture every measurable feature of the vaginal environment, but to identify a limited set of biologically meaningful dimensions that can be assessed during routine microscopic examination and integrated into a standardized visual representation.
The selection of the V-RAD dimensions reflects a conceptual synthesis of existing scientific knowledge informed by the authors’ clinical and microscopic expertise, rather than a systematic variable-selection procedure. It was guided by two complementary principles: biological relevance and cognitive interpretability. Each axis was chosen to represent a distinct ecological domain with recognized biological significance, while the total number of dimensions was intentionally limited to preserve graphical simplicity and facilitate visual pattern recognition. Accordingly, the framework does not aim to encompass all potentially relevant vaginal parameters. The identification of specific microorganisms, such as Candida or Trichomonas, primarily serves etiological diagnosis, whereas vaginal pH, although both a consequence and a modulator of ecological interactions, does not represent one of the biological dimensions directly assessed by the framework. Consequently, V-RAD profiles cannot independently establish or exclude vulvovaginal candidiasis, for which appropriate etiological assessment remains necessary. Although additional dimensions could theoretically be incorporated, increasing the complexity of the model would not necessarily improve its ecological descriptive value or practical interpretability.
The current version of the V-RAD comprises six ecological dimensions: Lactobacillary Dominance, Epithelial Maturation, Biofilm Diffusion, Cellular Cytolysis, Microbial Load, and Inflammatory Infiltrate. Together, these dimensions encompass the principal biological components that characterize the microscopic ecological state of the vaginal ecosystem, including microbial composition, epithelial condition, spatial organization of microorganisms, metabolic interaction with the host, overall microbial abundance, and host inflammatory response.
These dimensions should be regarded as complementary descriptors rather than independent or mutually exclusive variables. Biological relationships among them may exist and are expected to vary across physiological and pathological conditions. Nevertheless, each dimension provides information that cannot be fully inferred from the others and therefore contributes uniquely to the overall ecological profile.
Accordingly, each V-RAD axis is evaluated separately using predefined microscopic criteria and represented graphically without mathematical aggregation into a composite score. The radar profile itself constitutes the primary output of the framework, preserving the multidimensional structure of the microscopic observations. Interpretation of the ecological profile arises from the integrated evaluation of the resulting ecological configuration rather than from a single numerical value.
The biological rationale and scoring criteria for each ecological dimension are described in the following sections.
4. Structure of the V-RAD Framework
The V-RAD is a radar-based graphical framework designed to represent the multidimensional ecological state of the vaginal ecosystem in a standardized and immediately interpretable format. The model consists of six equally spaced radial axes arranged at 60° intervals around a common center, each corresponding to a predefined ecological dimension (Figure 1). To ensure consistency of representation and facilitate visual comparison across specimens, the orientation of the axes is fixed and remains unchanged in all V-RAD diagrams.
Each axis is divided into three ordinal levels (0, 1, and 2), represented by three concentric hexagons. The innermost hexagon corresponds to score 0, the intermediate hexagon to score 1, and the outermost hexagon to score 2. The score assigned to each axis is determined independently according to predefined microscopic criteria specific to that biological dimension. Consequently, the numerical direction of the scale does not imply a uniform biological interpretation across all axes; rather, it reflects the ordinal progression of the variable represented by that specific dimension.
Once the six axis scores have been assigned, the corresponding points are connected sequentially to generate the V-RAD profile. The resulting polygon represents the ecological profile of the microscopic specimen at the time of examination. The V-RAD therefore produces a graphical profile rather than a composite numerical score, preserving the contribution of each biological dimension within an integrated visual representation.
The uniform graphical representation of the six axes does not imply equal biological or clinical relevance, nor does it constitute a weighting system. The relative importance of each dimension may vary according to the ecological and clinical context. The V-RAD assigns no diagnostic weights to individual axes; their equal graphical prominence serves exclusively to ensure a consistent multidimensional representation.
The current version of the framework includes the following six ecological dimensions, arranged in clockwise order starting from the vertical axis: Lactobacillary Dominance, Epithelial Maturation, Biofilm Diffusion, Cellular Cytolysis, Microbial Load, and Inflammatory Infiltrate. This fixed spatial arrangement is an integral component of the framework, enabling direct comparison among different specimens and facilitating recognition of recurrent ecological configurations.
The V-RAD is intended to represent the ecological state of a vaginal specimen at a given point in time rather than to provide a static characterization of the vaginal ecosystem. Accordingly, repeated examinations of the same patient can be displayed as sequential radar profiles, allowing qualitative visualization of ecological changes during disease evolution, spontaneous recovery, or therapeutic intervention without reducing these dynamic processes to changes in a single numerical score.3.1. Subsection
5. Biological Dimensions
The V-RAD framework is based on six predefined ecological dimensions that collectively describe the microscopic state of the vaginal ecosystem. Each dimension represents a distinct biological property that can be assessed during routine microscopic examination using standardized qualitative criteria. Rather than defining diagnostic categories, the six dimensions provide complementary information on microbial composition, epithelial status, microbial organization, microbial abundance, host–microbiota interaction, and inflammatory response. Together, they constitute the multidimensional ecological profile generated by the V-RAD framework.
5.1. Lactobacillary Dominance (LD)
5.1.1. Biological Rationale
Lactobacillary Dominance describes the relative predominance of lactobacilli within the vaginal bacterial community. This dimension characterizes the ecological balance between lactobacilli and the remaining bacterial morphotypes rather than the absolute quantity of bacteria present in the specimen. Consequently, Lactobacillary Dominance reflects bacterial composition, whereas overall bacterial abundance is represented separately by the Microbial Load dimension.
5.1.2. Microscopic Assessment
Lactobacillary Dominance is assessed by estimating the relative proportion of lactobacillary morphotypes compared with the remaining bacterial flora observed during microscopic examination. The observer determines whether lactobacilli are largely replaced by mixed bacterial flora, coexist with other bacterial morphotypes without a clearly predominant component, or constitute the predominant bacterial population.
5.1.3. Scoring Criteria
LD0 indicates absent or markedly underrepresented lactobacilli relative to other bacterial morphotypes; LD1 indicates the coexistence of lactobacilli and other bacterial morphotypes without clear predominance; and LD2 indicates marked predominance of lactobacilli over other bacterial morphotypes.
5.2. Epithelial Maturation (EM)
5.2.1. Biological Rationale
Epithelial Maturation describes the structural and maturational status of the vaginal epithelium. Because the vaginal epithelium represents the biological interface between the host and the resident microbiota, its structural condition constitutes an essential component of the vaginal ecosystem. The degree of epithelial maturation influences the ecological environment in which host–microbiota interactions occur and therefore represents a distinct dimension of ecological assessment.
The abundance of parabasal cells primarily reflects epithelial maturation and hormonal status. However, increased numbers of parabasal cells may also indicate enhanced epithelial turnover or desquamation associated with specific physiological or pathological conditions. Consequently, interpretation of this dimension should always consider the clinical context, particularly patient age and hormonal status, together with the overall microscopic findings.
5.2.2. Microscopic Assessment
Epithelial Maturation is assessed by evaluating the presence of parabasal cells within the epithelial cell population. The relative abundance of parabasal cells provides a practical microscopic indicator of epithelial maturation and can be estimated directly during routine microscopic examination without the need for quantitative cytological indices. Although parabasal cells primarily reflect epithelial maturation, their biological significance should be interpreted in conjunction with the clinical setting and the overall ecological profile.
5.2.3. Scoring Criteria
EM0 indicates marked predominance of parabasal epithelial cells; EM1 indicates the coexistence of parabasal and mature epithelial cells without clear predominance; and EM2 indicates marked predominance of mature epithelial cells over parabasal cells.
5.3. Biofilm Diffusion (BD)
5.3.1. Biological Rationale
Biofilm Diffusion describes the extent of clue cell-associated bacterial adhesion observed on vaginal epithelial cells, serving as an indirect microscopic indicator of adherent polymicrobial biofilm. Rather than reflecting bacterial composition or abundance, this dimension characterizes the spatial organization of microorganisms and their interaction with the epithelial surface. Biofilm-associated bacterial adhesion therefore represents a distinct ecological property of the vaginal microbiota. Within the current V-RAD framework, this dimension is limited to biofilm patterns that are directly recognizable by routine light microscopy.
5.3.2. Microscopic Assessment
Biofilm Diffusion is assessed by evaluating the presence and distribution of clue cells during microscopic examination. Clue cells represent the most practical microscopic surrogate marker of adherent polymicrobial biofilm in routine clinical practice. The assessment considers both the abundance and the distribution of clue cells across the microscopic field.
5.3.3. Scoring Criteria
BD0 indicates absent or markedly underrepresented clue cells relative to other epithelial cells; BD1 indicates the presence of clue cells without clear predominance; and BD2 indicates marked predominance of clue cells over epithelial cells without bacterial coating.
5.4. Cellular Cytolysis (CC)
5.4.1. Biological Rationale
Cellular Cytolysis describes the extent of epithelial cell lysis observed within the vaginal specimen. This dimension reflects the interaction between the vaginal microbiota and the epithelial surface and therefore represents a biological property distinct from microbial composition, microbial abundance, epithelial maturation, or inflammatory response.
5.4.2. Microscopic Assessment
Cellular Cytolysis is assessed by estimating the degree of epithelial cell disruption observed during microscopic examination. The evaluation is based on the relative abundance of bare nuclei compared with nuclei contained within intact epithelial cells. The assessment reflects the overall extent of cytolysis within the microscopic field.
5.4.3. Scoring Criteria
CC0 indicates absent or markedly underrepresented bare nuclei relative to nuclei within intact epithelial cells; CC1 indicates the presence of bare nuclei without clear predominance; and CC2 indicates marked predominance of bare nuclei over nuclei within intact epithelial cells.
5.5. Microbial Load (ML)
5.5.1. Biological Rationale
Microbial Load describes the overall bacterial abundance present within the vaginal specimen, irrespective of bacterial composition. Unlike Lactobacillary Dominance, which reflects the relative predominance of lactobacilli, this dimension characterizes the total quantity of bacteria visible microscopically. These two dimensions therefore provide complementary information on the microbial component of the vaginal ecosystem.
5.5.2. Microscopic Assessment
Microbial Load is assessed by estimating the overall abundance of bacterial morphotypes observed throughout the microscopic field, including both lactobacilli and non-lactobacillary bacteria. The assessment reflects global bacterial density and is performed independently of bacterial composition.
5.5.3. Scoring Criteria
ML0 indicates isolated bacteria or small bacterial clusters, with readily identifiable bacteria-free spaces; ML1 indicates a loosely woven bacterial carpet, with rare bacteria-free spaces and frequent bacterial aggregates; and ML2 indicates a densely packed bacterial carpet, with absent or sporadic bacteria-free spaces and widespread bacterial crowding.
5.6. Inflammatory Infiltrate (II)
5.6.1. Biological Rationale
Inflammatory Infiltrate describes the magnitude of the host inflammatory cellular response observed within the vaginal specimen. This dimension characterizes the inflammatory component of the vaginal ecosystem and represents the host response independently of microbial composition, epithelial maturation, microbial abundance, or biofilm organization.
5.6.2. Microscopic Assessment
Inflammatory Infiltrate is assessed by estimating the abundance of leukocytes observed throughout the microscopic field. The evaluation reflects the overall density of inflammatory cells and is based exclusively on microscopic observation without distinguishing leukocyte subpopulations or activation status.
5.6.3. Scoring Criteria
II0 indicates absent or sporadic leukocytes; II1 indicates readily identifiable leukocytes, frequently forming aggregates; and II2 indicates massive leukocyte infiltration.
5.7. Integrated Interpretation of the V-RAD Dimensions)
The six V-RAD dimensions describe complementary biological properties of the vaginal ecosystem and are evaluated independently according to standardized microscopic criteria. No individual dimension is intended to define physiological or pathological conditions in isolation. Rather, the ecological state of the vaginal ecosystem is represented by the overall configuration of the six-dimensional profile, in which each axis contributes distinct biological information without being mathematically aggregated into a composite score. This principle constitutes one of the defining features of the V-RAD framework.
6. Structure of the V-RAD Framework
6.1. Principles of Profile Interpretation
The V-RAD profile is generated by combining the six independently assessed ecological dimensions into a single radar diagram. Interpretation is based on the overall ecological configuration rather than on individual axis values, as each dimension contributes complementary information describing a specific biological property. The resulting profile therefore provides an integrated ecological representation while preserving the individual contribution of each biological dimension.
6.2. Representative Ecological Profiles
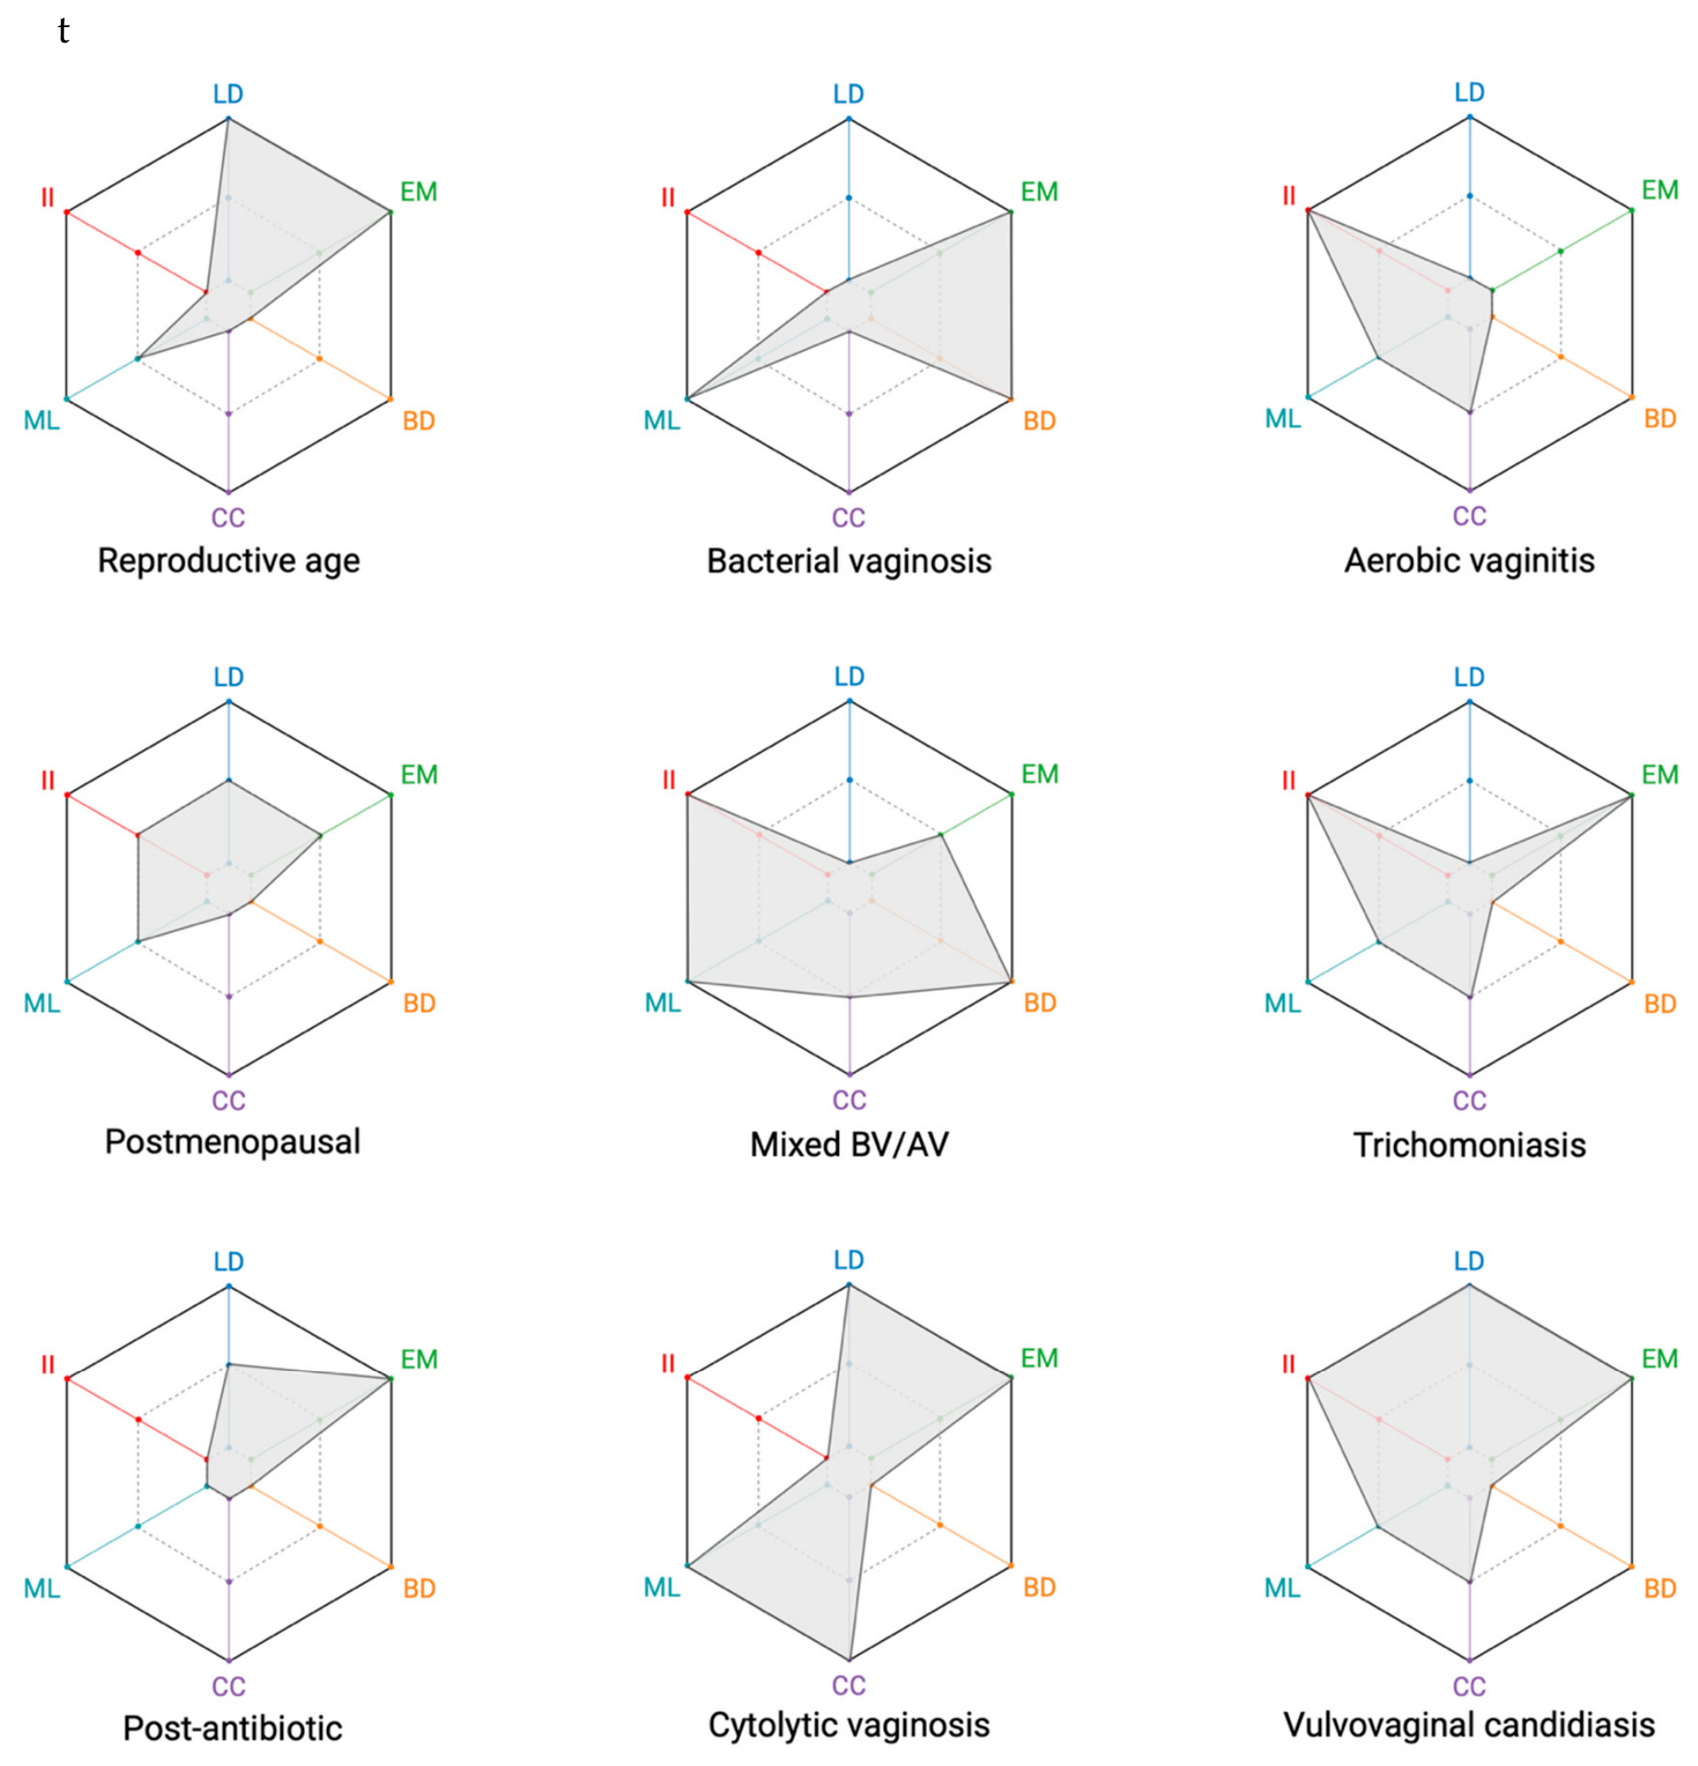
Figure 2 illustrates representative V-RAD profiles corresponding to common physiological and dysbiotic vaginal ecological conditions. These profiles are conceptual examples derived from their characteristic microscopic features and are intended solely to demonstrate the representational capabilities of the V-RAD framework. They should not be interpreted as validated diagnostic templates or as encompassing the full biological variability observed in clinical practice.
Although several conditions share individual microscopic characteristics, their overall V-RAD configurations differ substantially because each ecological dimension contributes independently to the final profile. Conversely, conditions that appear clinically related may exhibit distinct multidimensional patterns, reflecting differences in microbial composition, epithelial status, microbial organization, bacterial load, cytolytic activity, and host inflammatory response. By preserving these dimensions individually, the V-RAD provides a graphical representation of ecological complexity that would not be apparent from a single numerical score.
The representative profiles were selected to illustrate the broad spectrum of ecological states commonly encountered during routine vaginal microscopy, including physiological reproductive-age microbiota, physiological postmenopausal microbiota, bacterial vaginosis, aerobic vaginitis, cytolytic vaginosis, vulvovaginal candidiasis, trichomoniasis, mixed bacterial vaginosis/aerobic vaginitis, and post-antibiotic low-biomass states. Together, these examples demonstrate how the same graphical language can consistently represent physiological conditions, classical infectious syndromes, mixed ecological states, and transitional conditions within a unified framework.
Rather than replacing established diagnostic criteria, these representative profiles illustrate how multiple microscopic observations can be integrated into a standardized visual representation while preserving the biological contribution of each ecological dimension. The diagnostic interpretation remains the responsibility of the clinician and should always be considered in conjunction with clinical findings and conventional microbiological assessment.
6.3. Representative Ecological Profiles
Because the V-RAD profile represents the ecological state of a specimen at a specific point in time, sequential examinations may be displayed as consecutive radar diagrams. This enables qualitative visualization of ecological changes occurring during spontaneous evolution, disease progression, or following therapeutic intervention without reducing these dynamic processes to changes in a single numerical score.
Unlike conventional diagnostic scores, which summarize findings into a single value, sequential V-RAD profiles allow individual ecological dimensions to evolve independently over time. For example, restoration of lactobacillary dominance may precede complete resolution of inflammation, whereas microbial load may normalize before biofilm disappears. Displaying these changes graphically enables clinicians to appreciate the multidimensional trajectory of vaginal ecology rather than simply comparing isolated scores.
Repeated V-RAD profiles may therefore facilitate longitudinal assessment of vaginal ecology by providing a consistent graphical representation of multidimensional microscopic findings over time.
7. Discussion
Routine microscopic evaluation of vaginal specimens is inherently multidimensional. During microscopic examination, clinicians simultaneously assess multiple biological features, including bacterial composition, epithelial maturation, biofilm formation, cytolysis, microbial abundance, and inflammatory infiltrate. These observations are subsequently interpreted within one or more disease-specific diagnostic frameworks, such as Nugent scoring (Nugent et al., 1991) for bacterial vaginosis or the Donders score (Donders et al., 2002) for aerobic vaginitis. Consequently, the observational process itself is intrinsically broader than any individual diagnostic classification.
The V-RAD framework was conceived to formalize this observational layer rather than to replace existing diagnostic systems. Instead of generating an alternative diagnostic score, it provides a standardized graphical representation of the multidimensional microscopic findings that precede disease-specific interpretation. In this perspective, the V-RAD does not compete with established diagnostic criteria but operates at a different conceptual level by describing the ecological information from which different diagnostic classifications may subsequently be derived.
Importantly, the V-RAD does not introduce a new observational process but makes explicit the multidimensional assessment already performed during routine microscopy. By providing a structured graphical representation of this observational phase, it formalizes an otherwise implicit cognitive process without altering subsequent diagnostic interpretation.
This distinction may be particularly relevant when evaluating ecological conditions that do not fit neatly into a single diagnostic category. Mixed dysbiotic states, transitional conditions, physiological hormonal changes, or post-treatment microbiota often require the observer to integrate multiple microscopic findings before deciding which diagnostic framework is most appropriate. Rather than forcing these observations into a predefined diagnostic pathway, the V-RAD preserves the complete multidimensional ecological profile, allowing the full spectrum of microscopic findings to remain visible throughout the interpretative process.
Unlike conventional scoring systems, which are necessarily designed to answer specific diagnostic questions, the V-RAD aims to describe the ecological state of the vaginal ecosystem independently of the final diagnostic label. This conceptual separation between ecological representation and diagnostic interpretation constitutes one of the defining characteristics of the framework. By providing a common graphical language for multidimensional microscopic observations, the V-RAD may facilitate standardized documentation, communication among clinicians, longitudinal comparison of serial examinations, and the systematic description of complex ecological states in clinical research.
The present work introduces the V-RAD as a conceptual framework and should not be interpreted as the validation of a new diagnostic system. The illustrative profiles presented in this manuscript are intended exclusively to demonstrate the representational capabilities of the framework and should not be regarded as diagnostic templates or reference standards. Future studies will be required to evaluate interobserver reproducibility, clinical applicability, integration with existing diagnostic systems, and the relationship between V-RAD profiles and established clinical and microbiological diagnoses across diverse patient populations. By providing a standardized graphical representation of multidimensional microscopic observations, the V-RAD may facilitate future methodological developments, including computational approaches to ecological pattern recognition.
8. Conclusions
The V-RAD introduces a standardized graphical framework for representing the multidimensional ecological state of the vaginal ecosystem. Rather than replacing existing diagnostic systems, it formalizes the multidimensional microscopic observations that routinely precede disease-specific diagnostic interpretation, providing a common visual language for documenting ecological complexity.
By preserving individual biological dimensions instead of reducing them to a single composite score, the V-RAD offers an alternative conceptual approach to the representation of vaginal ecology. This framework allows physiological conditions, dysbiotic states, mixed presentations, and transitional ecological patterns to be described using a unified graphical model while maintaining the contribution of each individual microscopic parameter.
Although the present work is limited to the conceptual development of the framework, the V-RAD establishes the biological rationale and methodological foundation for future validation studies. Further research will determine its reproducibility, clinical utility, and potential role as a standardized framework for the graphical representation of vaginal microscopy findings.
Author Contributions
Conceptualization, L.A.; methodology, L.A.; investigation, L.A.; writing—original draft preparation, L.A.; writing—review and editing, L.A. and F.DS.; supervision F.DS. All authors have read and agreed to the published version of the manuscript.
Funding
This research received no external funding.
Institutional Review Board Statement
Not applicable.
Informed Consent Statement
Not applicable.
Data Availability Statement
The original contributions presented in the study are included in the article, further inquiries can be directed to the corresponding author.
Conflicts of Interest
The authors declare that the research was conducted in the absence of any commercial or financial relationships that could be construed as a potential conflict of interest.
Abbreviations
The following abbreviations are used in this manuscript:
| AV | Aerobic Vaginitis |
| CC | Cellular Cytolysis |
| BD | Biofilm Diffusion |
| BV | Bacterial Vaginosis |
| EM | Epithelial Maturation |
| II | Inflammatory Infiltrate |
| LD | Lactobacillary Dominance |
| ML | Microbial Load |
| NGS | Next-Generation Sequencing |
| V-RAD | Vaginal Radar Assessment Diagram |
References
- Agoni, L. Old but gold: an historical perspective of wet mount microscopy and its current role for the diagnosis of vaginitis. Front. Reprod. Heal. 2026, 8, 1755906. [Google Scholar] [CrossRef]
- Agoni, L.; Martinelli, C.; De Seta, F. Bacterial Vaginosis vs. Aerobic Vaginitis: An Unresolved Conundrum? Biology 2026, 15, 1393. [Google Scholar] [CrossRef]
- Donders, G. G. G.; Vereecken, A.; Bosmans, E.; Dekeersmaecker, A.; Salembier, G.; Spitz, B. Definition of a type of abnormal vaginal flora that is distinct from bacterial vaginosis: aerobic vaginitis. BJOG Int. J. Obstet. Gynaecol. 2002, 109, 34–43. [Google Scholar] [CrossRef]
- France, M. T.; Ma, B.; Gajer, P.; Brown, S.; Humphrys, M. S.; Holm, J. B.; et al. VALENCIA: a nearest centroid classification method for vaginal microbial communities based on composition. Microbiome 2020, 8, 166. [Google Scholar] [CrossRef]
- Ison, C. A.; Hay, P. E. Validation of a simplified grading of Gram stained vaginal smears for use in genitourinary medicine clinics. Sex. Transm. Infect. 2002, 78, 413. [Google Scholar] [CrossRef]
- Mendling, W.; Oliveira, C.; Grinceviciene, S.; De Seta, F.; Stockdale, C. K.; Verstraelen, H.; et al. MICROSCOPY ATLAS | ISSVD PRACTICAL GUIDE TO DIAGNOSIS AND MANAGEMENT; Ad Médic: Lda, 2026. [Google Scholar] [CrossRef]
- Nugent, R. P.; Krohn, M. A.; Hillier, S. L. Reliability of diagnosing bacterial vaginosis is improved by a standardized method of gram stain interpretation. J. Clin. Microbiol. 1991, 29, 297–301. [Google Scholar] [CrossRef]
- Sherrard, J.; Wilson, J.; Donders, G.; Mendling, W.; Jensen, J. S. 2018 European (IUSTI/WHO) International Union against sexually transmitted infections (IUSTI) World Health Organisation (WHO) guideline on the management of vaginal discharge. Int. J. STD AIDS 2018, 29, 1258–1272. [Google Scholar] [CrossRef]
- Vieira-Baptista, P.; Stockdale, C. K.; Sobel, J. (Eds.) International Society for the Study of Vulvovaginal Disease Recommendations for the Diagnosis and Treatment of Vaginitis; Ad Médic, Lda: Lisbon, 2023. [Google Scholar] [CrossRef]
Figure 1.
Structure of the Vaginal Radar Assessment Diagram (V-RAD). The V-RAD consists of six predefined ecological dimensions arranged in a fixed clockwise orientation: Lactobacillary Dominance (LD), Epithelial Maturation (EM), Biofilm Diffusion (BD), Cellular Cytolysis (CC), Microbial Load (ML), and Inflammatory Infiltrate (II). Each axis is independently scored on a three-level ordinal scale (0–2), represented by three concentric hexagons. The resulting radar profile provides a standardized graphical representation of the multidimensional ecological state of the vaginal ecosystem while preserving the independent contribution of each biological dimension. Scores 0, 1, and 2 indicate increasing levels of the specific characteristic represented by each axis and do not imply a common biological interpretation across dimensions. The operational scoring criteria for each dimension are detailed in Section 5. Created in BioRender.com.
Figure 1.
Structure of the Vaginal Radar Assessment Diagram (V-RAD). The V-RAD consists of six predefined ecological dimensions arranged in a fixed clockwise orientation: Lactobacillary Dominance (LD), Epithelial Maturation (EM), Biofilm Diffusion (BD), Cellular Cytolysis (CC), Microbial Load (ML), and Inflammatory Infiltrate (II). Each axis is independently scored on a three-level ordinal scale (0–2), represented by three concentric hexagons. The resulting radar profile provides a standardized graphical representation of the multidimensional ecological state of the vaginal ecosystem while preserving the independent contribution of each biological dimension. Scores 0, 1, and 2 indicate increasing levels of the specific characteristic represented by each axis and do not imply a common biological interpretation across dimensions. The operational scoring criteria for each dimension are detailed in Section 5. Created in BioRender.com.
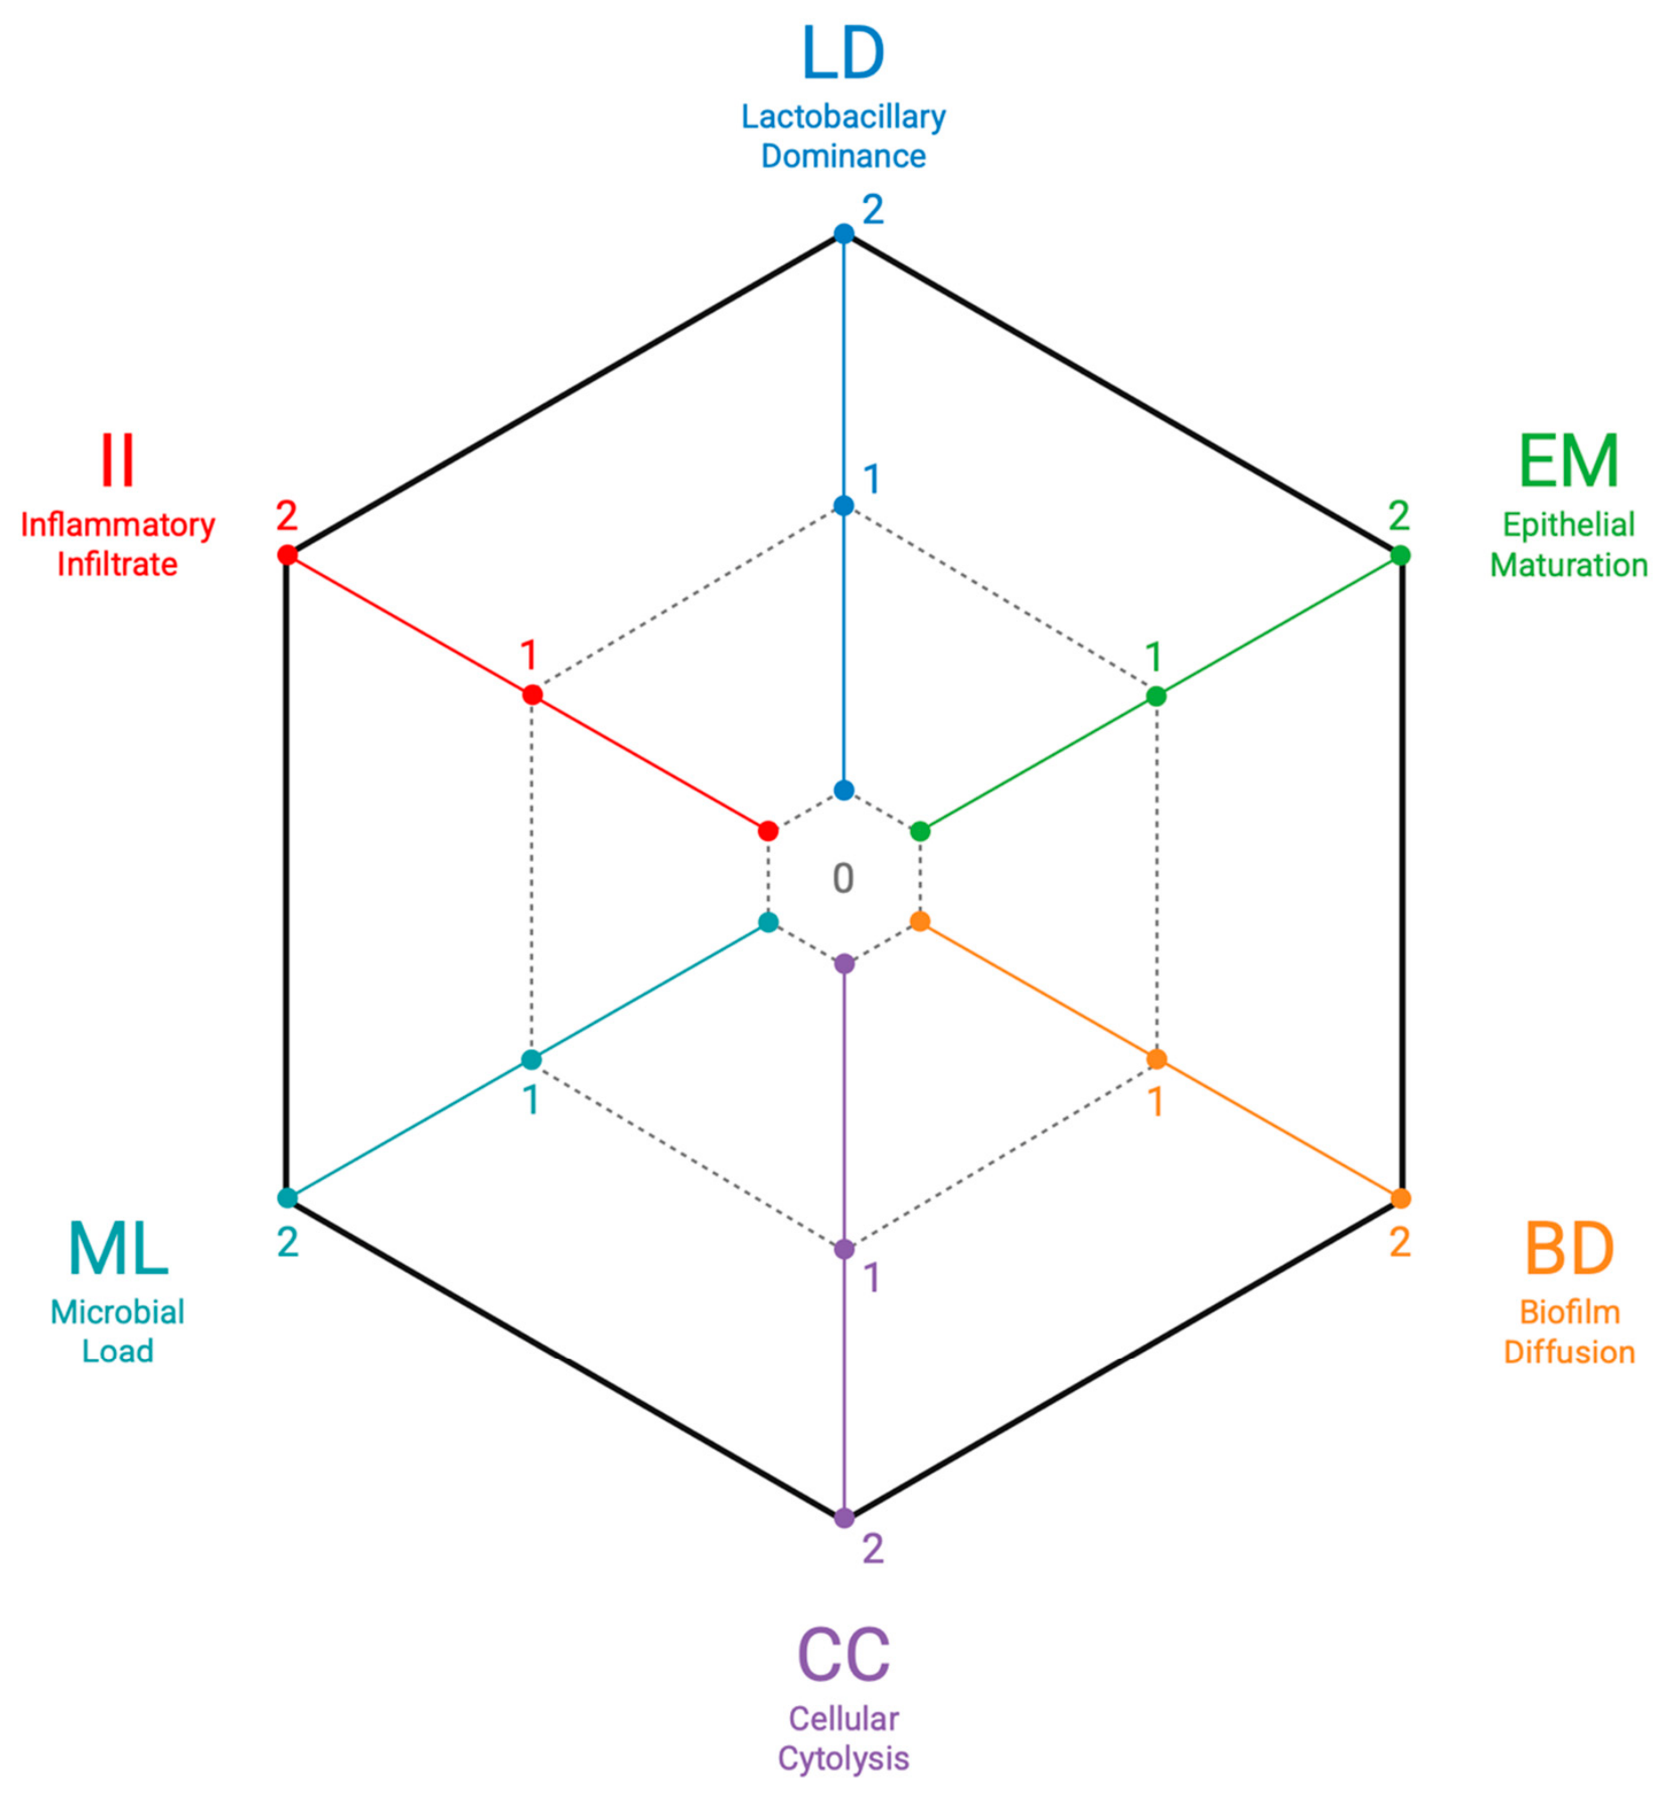
Figure 2.
Illustrative V-RAD profiles representing common vaginal ecological conditions. The radar diagrams shown are conceptual examples derived from the characteristic microscopic features of each condition and are intended solely to illustrate the representational capabilities of the V-RAD framework. They should not be interpreted as validated diagnostic templates or as encompassing the full biological variability observed in clinical practice. Created in BioRender.com.
Figure 2.
Illustrative V-RAD profiles representing common vaginal ecological conditions. The radar diagrams shown are conceptual examples derived from the characteristic microscopic features of each condition and are intended solely to illustrate the representational capabilities of the V-RAD framework. They should not be interpreted as validated diagnostic templates or as encompassing the full biological variability observed in clinical practice. Created in BioRender.com.
Disclaimer/Publisher’s Note: The statements, opinions and data contained in all publications are solely those of the individual author(s) and contributor(s) and not of MDPI and/or the editor(s). MDPI and/or the editor(s) disclaim responsibility for any injury to people or property resulting from any ideas, methods, instructions or products referred to in the content. |
© 2026 by the authors. Licensee MDPI, Basel, Switzerland. This article is an open access article distributed under the terms and conditions of the Creative Commons Attribution (CC BY) license.
Copyright: This open access article is published under a Creative Commons CC BY 4.0 license, which permit the free download, distribution, and reuse, provided that the author and preprint are cited in any reuse.