

Submitted:
23 October 2026
Posted:
26 October 2026
You are already at the latest version
Abstract
In this article, the review and critical evaluation of the proximity-based urbanism will be provided with an explicit focus on the 15-minute city and similar X-minute city ideas. The key point is that proximity is a necessary but not sufficient condition for achieving spatial equity because proximate facilities might still be either too expensive, dangerous, difficult for usage by disabled people and elderly people, temporal unavailable, low-quality, or not appropriate for local conditions. The review will be based on the peer-reviewed and landmark literature available until June 2026 and will cover four main themes including proximity-based urban planning, accessibility and spatial equity, open geospatial data, and AI urban analytics. In particular, the research will be conducted not as PRISMA review, systematic review, bibliometric analysis, or empirical validation but as conceptual review and framework paper.The article provides several contributions including clarification of the conceptual differences between proximity, accessibility, and spatial equity, organization of the evidence base via the use of the transparent corpus and the evidence role framework, and development of the Open-Data Explainable Proximity Planning Framework. The framework includes nine interconnected layers including (1) proximity planning goals, (2) open geospatial data infrastructure, (3) accessibility measurement, (4) spatial-equity diagnosis, (5) AI/urban analytics, (6) explainability, (7) governance safeguards, (8) planning decision support, and (9) policy intervention and monitoring. The paper promotes the idea of the planning led with the assistance of AI where the open data and explainable analytics can facilitate the diagnosis, scenario comparison, and public justification of decisions.
Keywords:
15-minute city
; X-minute city
; spatial equity
; accessibility justice
; open geospatial data
1. Introduction
The 15-minute city stands out among other concepts in contemporary urban policy debates. The idea’s attraction lies in the simple rule of thumb: everyday services and opportunities need to be within walking, cycling, or local transport commuting distance. The larger class of X-minute city paradigms builds on similar ideas but applies different thresholds (5, 10, 15, and 20 minutes) to accommodate various urban forms and mobility systems [1,2,3,4]. Current research has also identified how the concept is used in practice, signaling a trend from academic discussion to policy branding, performance measuring, and urban planning [38].
The attractiveness of the idea is also its fundamental weakness. Proximity is easy to describe but hard to manage in reality. Neighborhoods might seem 15-minute compliant, while their inhabitants face low quality, high costs, dangerous paths, poor pedestrian environment, limited capacity, short opening hours, inaccessibility for disabled people, and lack of public transportation. In this way, the real challenge is not just proximity but the ability of diverse inhabitants to use available nearby opportunities in an effective, safe, sufficient, affordable, and meaningful way [5,6,7].
Such an issue is especially relevant in the context of fast growth of the literature on proximity cities. Reviews focused on metrics show significant methodological diversity in proximity thresholds, travel modes, basket of amenities, spatial units, and accessibility indicators [4]. Large-scale studies using open data demonstrate large disparities in proximity performance between and within cities as well as global inequalities in access to basic services [39]. Meanwhile, research on urban peripheries and suburbs suggests avoiding interpretation of the 15-minute city as an urban-core paradigm that can be applied equally to all types of settlements [23,41].
Open geospatial data make it easier to measure this debate. OpenStreetMap (OSM), points of interest (POI), GTFS transit feeds, population grids, pedestrian network, sidewalk data.
AI and urban analytics add another layer to this debate. Machine learning, computer vision, natural language processing, large language models, clustering, prediction, and explainable AI are increasingly discussed in relation to urban planning, smart-city governance, walkability assessment, land-use analysis, perception, and decision support [10,11,12,13,14,15,16,17,18,47]. Recent planning scholarship stresses that AI can support different planning phases, but also that planners need social-technical evaluation, transparency, accountability, and awareness of bias before such tools can be considered legitimate [17,18,47,48].
The gap addressed in this article is therefore integrative. Existing reviews and empirical studies have examined 15-minute city concepts, X-minute metrics, accessibility equity, open spatial data, AI in planning, AI governance, AI-assisted walkability, and urban analytics. However, these streams remain insufficiently connected. This article asks how open geospatial data and explainable AI can be organized into a planning-oriented framework for diagnosing spatial equity in proximity-based urbanism.
The paper makes three contributions. First, it clarifies why proximity, accessibility, and spatial equity should not be treated as interchangeable terms. Second, it strengthens the review design through a transparent narrative-review method, corpus organization, search-string table, and evidence-role logic. Third, it develops an operational Open-Data Explainable Proximity Planning Framework that links data, metrics, AI-enabled diagnosis, explanation, governance, planning decision support, and monitoring.
2. Literature Review
2.1. Proximity-Based Urbanism and X-Minute Cities
The 15-minute city is part of a broader shift from mobility-centered planning to accessibility-centered planning. Mobility-centered planning asks how quickly people can move across urban space; accessibility-centered planning asks whether residents can reach the opportunities and services required for everyday life [24]. The X-minute city translates this accessibility logic into communicable time thresholds, but these thresholds are planning assumptions rather than universal measures [2,3,4].
Recent studies have sharpened this point. The global framework developed by Bruno et al. shows substantial heterogeneity in access to essential services and argues that proximity models must be generalized for different population densities and urban structures [39]. The limitations pointed out by Mouratidis concern issues related to sustainability, fairness, livability, and spatial thinking, warning that the ideas of proximity might be oversimplified when conceived of as an established spatial equation [6]. The empirical literature on outskirts and peripheries proves once again that the issue of short distances cannot be separated from public transport and city design [23,41,45].
2.2. Spatial Equity, Accessibility Justice, and Capability
Equity-aware proximity planning requires a normative move from mere recognition of nearby services to the assessment of the distribution, adequacy, and usability of the access. Distributive equity refers to unequal distribution of services and opportunities between locations or social groups. Adequacy equity examines whether all individuals receive enough of an opportunity. Capabilities analysis considers how capable residents are to use opportunities, given their income, physical mobility, need to care for others, personal safety, age, gender, and time constraints [5,24,25,26,27,28,29].
It is crucial to distinguish between these types of approaches since many proximity indicators make use of thresholds which appear objective but involve normative choices nonetheless. The questions are related to the determination of what kind of service is important, what transport mode is assumed, what walking speed is used, and what time period is considered. The other factors are whether individuals with disabilities, older residents, caregivers, or poorer groups are accounted for, and whether quality and capacity of services are involved. Studies related to variation in walking access of individuals and time periods, age-related active accessibility, and X-minute city walkability show that equal spatial distance does not necessarily mean equal access [32,35,43].
2.3. Open Geospatial Data and Measurable Accessibility
Open geospatial data have made proximity-city research more reproducible and comparable. OSM networks, POI databases, GTFS transit feeds, population grids, sidewalk data, and street-view imagery allow accessibility analysis at neighborhood, metropolitan, and cross-city scales [5,9,20,34,40]. Studies using open geospatial data can identify where access is weak, how accessibility varies by mode and service category, and which neighborhoods may require priority intervention.
However, open data should not be treated as neutral evidence. OSM completeness, POI category accuracy, transit-feed reliability, population-grid resolution, and street-view coverage vary across places [34]. These limitations can bias accessibility scores and undermine the validity of equity diagnosis. Therefore, open-data proximity studies should include data audits, validation procedures, uncertainty registers, sensitivity analysis, and documentation of assumptions.
2.4. AI-Enabled Urban Analytics, Explainability, and Governance
AI-driven analytics may help with pattern recognition, perceptual modeling, development of neighborhood typologies, scenarios evaluation, and identification of gaps in access, so long as the underlying assumptions and data restrictions are made transparent. Recent studies on the use of AI in planning show that the use of AI is possible throughout all planning stages, ranging from data analytics, spatial diagnosis, policy design, citizen engagement to monitoring [17,18]. Studies on the use of AI in smart cities and algorithmic urban planning also suggest growing application in forecasting, classification, simulation, optimization and decision support [10,47].
At the same time, governance is a major issue. AI may perpetuate historical biases, hide value-laden choices, invent or exaggerate certainty, avoid accountability and politicize planning in a technical way [16,19,47,48,49]. Therefore, explanation in urban planning cannot be confined only to feature significance and model transparency. It should include public explanation, uncertainty, contestation, participation and documentation of how evidence leads to decisions [21,22,48,49]. The major review streams and the remaining integration gap addressed by this study are summarized in Table 1.
2.5. From Proximity to Equity-Sensitive Accessibility
The main drawback of proximity-based approach to planning is the consideration of proximity as a sufficient measure of access. Residents actually access services and facilities based on a range of attributes, including network distance, travel time, service quality, cost, safety, availability at a certain time, accessibility to people with disabilities, and social acceptability. Proximity of a park does not mean that it is well-maintained; proximity of a clinic does not imply affordability; proximity of a school may mean that the school is oversubscribed; presence of sidewalks on maps does not guarantee usability.
Therefore, equity-oriented proximity planning requires three assessments of accessibility opportunities. Firstly, distributional assessment – whether there are inequalities in distribution of access opportunities between different neighborhoods and population segments. Secondly, a sufficiency assessment – whether everybody has access to some acceptable minimum of services. Thirdly, a capability assessment – whether residents are capable to access their spatial opportunity given their abilities, conditions, and constraints [24,25,26,27,28,29].
Perception and safety are other critical issues. Traditionally, accessibility measures are represented through networks with origin points, destination points, and costs. Yet, for residents routes are experienced through fear, comfort, aesthetic value, maintenance, exposure to traffic, weather conditions, light, and social meanings. Perceptions and AI-enabled analyses of walkability and perception can help to supplement traditional network analysis provided that the limitations of image data, cultural assumptions, training sample, and proxy values are carefully analyzed [8,12].
Peripheral and suburban environments also need to be considered for proximity planning. Central areas of cities are more likely to provide short thresholds of accessibility due to clustering of services, workplaces, and multimodal connections. However, in contrast to central cities, peripheries might require particular approaches to local services, active modes of transport, public transit, polycentric growth, and metropolitan connection [23,41,45]. The goal in such contexts is not to reduce standards of access, but to develop a particular way to reach sufficiency.
2.6. Open Geospatial Data and Accessibility Measurement
2.6.1. From Concept to Measurement
Only with explicit specification of the underlying assumptions does the proximity city concept provide any analytical insights. Scholars and urban planners need to identify the important destinations, consider the modes of transport used, apply temporal thresholds, define the representation of origins and destinations, and decide on whether to measure accessibility based on counts, travel time, gravity measures, composite indexes, inequality indexes, or others [3,4,5].
This can be achieved with the use of open data through repeated measurements. However, measurement decisions themselves remain normative. While the cumulative opportunity index makes the process transparent, it is still dependent on choice of amenities and threshold values. Gravity measures reflect distance decay effect but can pose problems of communication. Composite indexes allow for the dashboard view but hide decision-making around weights. Inequality indexes help to demonstrate unequal distributions but do not, in themselves, reveal anything about causality. Enough thresholds are desirable from the point of justice in urban planning but require justifiable criteria. The principal accessibility and equity metric families used in X-minute city research are summarized in Table 2.
2.6.2. Data Sources for Proximity and Equity Analysis
Various sources of open geospatial data support different kinds of analysis. Street data allows routing on foot, by bicycle, and by public transport. Data about Points of Interest (POI) allow categorization of destinations. GTFS feeds describe planned services of public transportation. Population grids help assess population-weighted accessibility and measure inequalities. The use of sidewalk network data improves realism of pedestrian analysis. Street-level images help assess issues related to perceived safety, maintenance, presence of greenery, and route quality. While municipal data can have higher authority when it comes to local services, they can also be less comparable across cities [5,8,9,12,34,40]. The open geospatial data sources used for proximity and equity analysis, together with their planning value and limitations, are summarized in Table 3.
2.6.3. From Mapping to Diagnosis
Most maps generated by researches contain information about neighborhoods that exceed the predefined threshold. Although such maps provide better understanding, they cannot be sufficient to perform a planning diagnosis. Lack of access could be caused by absent destination, inadequate network of streets, infrequent transit, hazardous route, inaccessible infrastructure, improper service alignment, low quality, inconvenient opening hours, high cost or discrimination. Therefore, diagnostics should establish connections between the patterns and the potential mechanisms of planning.
Here the AI and explainable analytics could be applied. It is not necessary to use the AI to generate an isochrone or to count amenities. Its real value could be seen when multiple layers of information are combined to find out patterns, classify neighborhoods, determine probable access gaps, calculate perception-based barriers or analyze different scenarios of intervention. Here transparency is needed because their outputs will affect resource allocation and justification.
2.7. AI and Explainable Urban Analytics for Planning Evidence
2.7.1. AI as a Planning-Support Layer, Not a Planning Substitute
In this review, AI is not viewed as the subject matter of investigation. What matters here is proximity-based planning and the spatial justice issues it involves. The relevance of AI is limited to how AI can contribute to measurement, diagnosis, explanation, scenario comparison, or monitoring. Such a distinction is important since planning is a normative and democratic activity, not merely a technical optimization process.
The use of AI analytics may help with: pattern recognition over large geospatial datasets; extraction of street level features from imagery data; clustering of neighborhoods according to accessibility, vulnerability, and urban morphology; simulation of accessibility impacts; analysis of planning documents or public comments; and scenario comparison of interventions. However, such uses of AI must always be constrained by considerations of planning. Outputs from models need to be used as pieces of evidence for public deliberation, not as the final decision-makers themselves [10,17,18,47].
2.7.2. Explainability as Public Justification
Explanation in the context of urban planning is characterized by four different types. First of all, there is model explanation that includes such types of explanation as feature importance, local explanation, counterfactual reasoning, and surrogate model. The second type of explanation is related to causal caution, which helps not to present statistical relationship as causal one. The third type of explanation is stakeholder explanation, which is the interpretation of technical results into planning narrative. The fourth type is accountability documentation.
Tools such as LIME and SHAP can support local or feature-level explanations, but they do not by themselves produce planning legitimacy [36,37]. A feature may be statistically important without representing a causal planning lever. A model may be accurate but rely on biased data. A dashboard may be visually convincing while hiding normative choices. Therefore, explainable urban analytics should connect model outputs to planning mechanisms, uncertainty statements, and participatory validation.
2.7.3. Governance Safeguards for Urban AI
Governance safeguards are not a final add-on after the technical pipeline has been built. They should be present from problem definition through data collection, modeling, explanation, intervention selection, and monitoring. In proximity planning, governance begins with apparently simple choices: which services count, whose needs are represented, which thresholds are legitimate, and which groups are prioritized.
The ethical concerns of AI in planning include bias, privacy, misinformation, accountability gaps, lack of transparency, and overreliance on automated judgment [48]. Critical accounts of generative AI and anticipatory urban governance also warn that AI systems can become quasi-oracular sources of future-oriented policy authority if uncertainty and contestability are not built into the process [49]. For proximity planning, this means that every analytical output should be accompanied by a record of assumptions, limitations, and routes for public challenge. The AI and urban analytics methods relevant to proximity planning, including their potential uses, planning value, and principal risks, are outlined in Table 4.
3. Research Methodology
3.1. Review Type and Purpose
This article is a narrative and critical review with a conceptual framework contribution. It is not intended to be a systematic review, a scoping review, a bibliometric review, a meta-analysis, or a PRISMA review. This review does not purport to identify or screen out all studies that fit the criteria through an exhaustive methodology. Instead, it summarizes selected peer-reviewed and seminal literature in order to connect various separate concepts such as proximity planning, spatial equity, open geospatial data, and AI-enabled urban analytics.
The review relies on evidence in five different functions. First, proximity city conceptual studies explain the planning principles and assumptions behind 15-minute and X-minute urbanism [1,2,3,4,38,39]. Second, studies of accessibility and open data provide examples of methods for quantifying proximity and spatial equity [5,9,20,23,32,34,40,45]. Third, transport justice, accessibility, and capabilities frameworks form the normative approach separating proximity from equitable access [24,25,26,27,28,29,30,31]. Fourth, studies of AI and urban analytics give an example of how computational techniques can be used for prediction, perceptual analysis, planning support, and urban governance [10,11,12,13,14,15,16,17,18,46,47]. Finally, critical governance literature highlights the issues associated with bias, opacity, loss of public trust, accountability, and substituting political decision-making for technology [16,19,21,22,47,48,49].
3.2. Literature Identification and Evidence Organization
To improve transparency while preserving the narrative-review character of the article, the corpus was organized through a structured but non-PRISMA identification strategy. Searches were conducted across major scholarly databases and publisher platforms, with emphasis on peer-reviewed journal articles, books, and landmark theoretical works available up to June 2026. The recent update prioritized 2024-2026 publications on 15-minute city implementation, open geospatial measurement, AI in urban planning, urban digital twins, explainability, and AI governance.
Backward and forward citation checking was used selectively to identify foundational sources that anchor the conceptual argument. The review corpus was then coded thematically according to evidence role: conceptual framing, accessibility measurement, spatial-equity theory, open-data infrastructure, AI/urban analytics, explainability, governance, planning decision support, and monitoring. Because the corpus is selective, conclusions should be interpreted as a conceptual synthesis and research agenda rather than as a statistically representative map of the field. The corpus organization and evidence-role protocol used for this narrative review are summarized in Table 5.
3.3. Guiding Questions
The synthesis is organized around five guiding questions: (1) How have 15-minute and X-minute city studies conceptualized proximity, accessibility, and neighborhood completeness? (2) How have recent studies critiqued proximity-only approaches from the perspective of equity, perception, peripheries, and governance? (3) What open geospatial data sources and accessibility metrics are used to operationalize proximity-based planning? (4) How are AI and urban analytics being used to support walkability, accessibility, perception, and planning decision-making? (5) What framework can connect open data, spatial equity, explainable AI, and governance into proximity-city planning?
4. Research Results and Discussions
4.1. Open-Data Explainable Proximity Planning Framework
4.1.1. Rationale
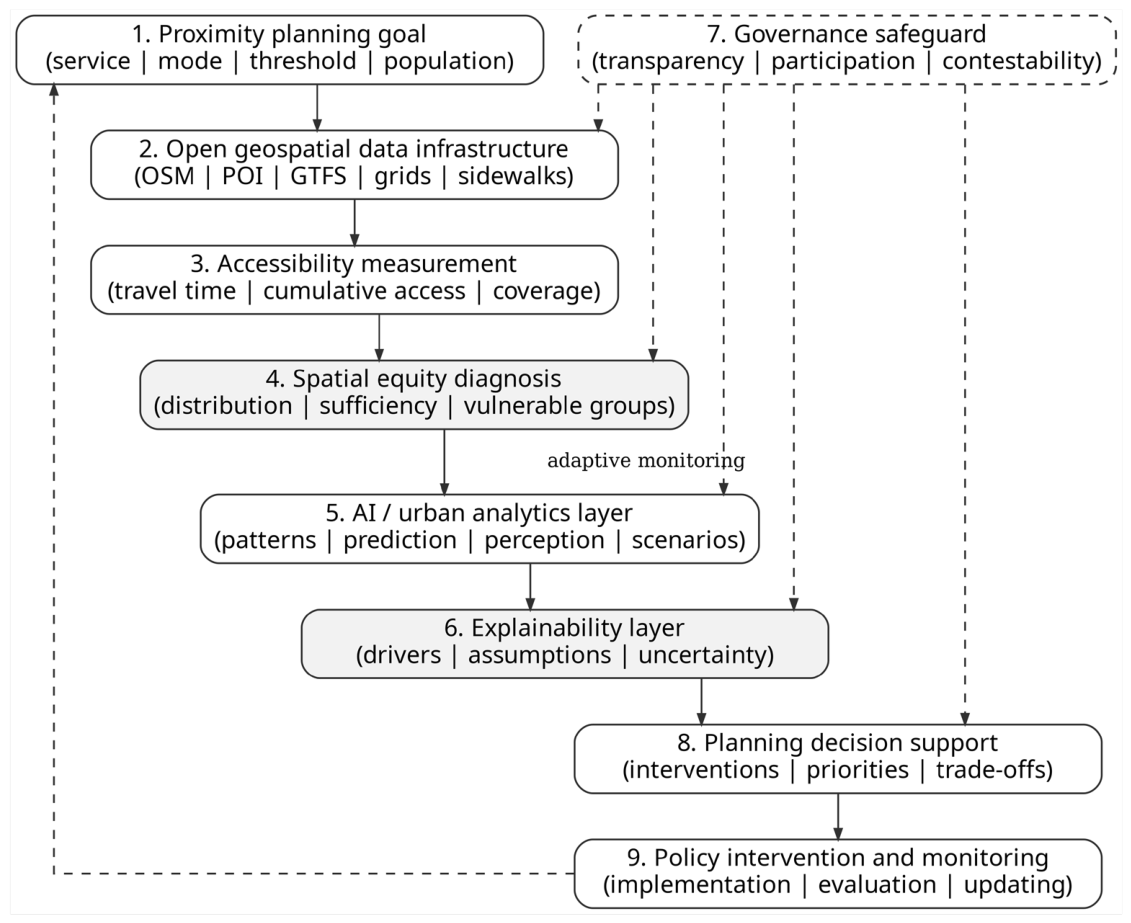
The preceding sections show that proximity-based planning requires more than a spatial threshold. The 15-minute and X-minute city literature provides a communicable planning concept. Accessibility studies provide metrics and open-data methods. Spatial-equity literature provides justice criteria. AI and urban analytics offer pattern detection, perception analysis, and scenario comparison. Governance scholarship provides safeguards against opacity and technocratic decision-making. The proposed framework connects these streams into a planning process.
The Open-Data Explainable Proximity Planning Framework is not an empirical model and does not claim that explainable AI automatically improves planning outcomes. It is a conceptual and operational framework for organizing evidence. Its purpose is to help planners move from proximity goals to transparent data, explicit measurement, equity diagnosis, interpretable analytics, governed decision support, and monitoring.
4.1.2. Framework Figure
Figure recreation note. The figure can be recreated in Word, Graphviz, or any vector-drawing tool as nine rounded rectangles connected by downward arrows. The governance safeguard is shown as a dashed node connected to the data, equity, AI, explainability, and decision-support layers. A dashed feedback arrow returns policy monitoring to the initial proximity goal, representing iterative learning.
4.1.3. Operational Layers
The framework has nine connected layers. Each layer should be operationalized through input data or assumptions, a specific analytical task, a planning output, an explicit governance risk, and at least one example indicator. This prevents the framework from remaining a purely descriptive diagram and turns it into a planning-audit structure. The inputs, analytical tasks, planning outputs, governance risks, and example indicators associated with the nine framework layers are detailed in Table 6.
Figure 1.
Open-Data Explainable Proximity Planning Framework. The DOT-style diagram links proximity goals, open geospatial data, accessibility measurement, spatial-equity diagnosis, AI/urban analytics, explainability, governance safeguards, decision support, and policy intervention/monitoring through an adaptive feedback loop.
Figure 1.
Open-Data Explainable Proximity Planning Framework. The DOT-style diagram links proximity goals, open geospatial data, accessibility measurement, spatial-equity diagnosis, AI/urban analytics, explainability, governance safeguards, decision support, and policy intervention/monitoring through an adaptive feedback loop.
4.1.4. From Indicators to Planning Action
The framework is designed to prevent pass/fail proximity mapping from being mistaken for planning action. If low access is caused by lack of destinations, relevant interventions may include facility siting, land-use change, service incentives, or public-service provision. If the problem is poor connectivity, interventions may involve crossings, pedestrian links, sidewalk upgrades, traffic calming, and cycling infrastructure. If weak transit is the barrier, planners may consider route restructuring, frequency improvements, or multimodal integration. If safety or perception is the barrier, maintenance, lighting, design, social programming, and community safety measures may be more relevant. If affordability is the problem, spatial proximity alone is insufficient.
Planning decision support should therefore compare intervention scenarios rather than produce a single access score. Adding new services may improve access but create gentrification pressures. Sidewalk improvements may increase walkability while leaving service affordability unresolved. Transit improvements may strengthen metropolitan accessibility while not solving local service shortages. The framework requires planners to make these trade-offs explicit.
4.2. Discussion: Research Agenda and Planning Implications
As such, the literature suggests that future generations of research on proximity-cities need to move from simply measuring proximity to models that are understandable, equitable, and governance-focused in the context of proximity planning. This research agenda does not seek to replace urban planners with artificial intelligence systems, but to build up the evidence base that supports urban planning decisions, by: (a) setting clear thresholds, (b) auditing open data, (c) diagnosing access deficiencies, (d) using AI systems only in situations where they add value through their explanatory power, and (e) reporting how evidence influences decision-making.
Methodological examples from other domains can inform the evaluation of urban analytics. Synthetic-data augmentation for imbalanced breast-cancer classification [50] and staged random-forest intrusion detection in IoT networks [51] illustrate why data balance and class-specific performance deserve attention alongside aggregate accuracy. For proximity planning, the corresponding research question is whether model errors differ across neighborhoods and population groups; synthetic samples cannot replace missing observations about local access.
Graph–language integration links relational representations, retrieved evidence, and reasoning [52], while autonomous zero-trust network-slicing research examines trust management and policy enforcement across connected domains [53]. These perspectives suggest research directions for evidence traceability and controlled access in urban decision-support platforms. Their usefulness for spatial-equity diagnosis requires urban-specific and participatory evaluation. These four cross-domain sources are contextual additions outside the June 2026 review corpus and do not provide empirical validation of the proposed planning framework.
In Urban Science and other urban-planning journals, this framework also draws attention to a specific interdisciplinary opportunity. AI and open data are only meaningful for urban planning if and when their technical output is translated into spatial diagnosis and interventions as well as public accountability. The future research directions, recommended approaches, planning value, and risks identified by the review are summarized in Table 7.
4.3. Review Limitations and Boundary Conditions
The present paper employs a narrative and critical review approach rather than that of systematic reviews. As such, it does not provide PRISMA screening figures, quality assessments scores, full coverage of all databases searched or meta-analysis. The merit of the paper is in its ability to integrate knowledge between disciplines; the weakness of the paper is in its selectively curated and reviewed corpus.
The review is likely to underestimate the literature about technical GeoAI studies, studies by government about algorithmic accountability, studies about informal mobilities, non-English planning literature and locally conducted accessibility studies. In this regard, the proposed conceptual framework serves more like an agenda for further research and a planning audit tool but not a fully operationalized model, which requires empirical validation in different urban environments especially those that are peripheral, small, Global South and data-scarce.
Another limitation is open data and governance of AI. While open geospatial data can improve transparency and reproducibility of results, they might be incomplete, outdated, spatially unbalanced and biased. AI analytics could help diagnose problems and analyze scenarios, however, such analysis depends on data, assumptions, model design and governance.
5. Conclusions
The 15-minute city and its larger family of X-minute cities emphasize the issues related to accessibility, local living, active mobility, and neighborhood completeness. The strength of these concepts in terms of conceptualization lies in their communicability, and the weakness lies in the assumption of proximity being a sufficient measure of spatial justice. This review argues that proximity is a necessary but insufficient concept: the challenge of planning is to enable different populations to access necessary services effectively, safely, affordably, and sufficiently.
The current literature review includes all the necessary elements of a better approach to planning – proximity city concepts, accessibility indicators, open geospatial data, theory of spatial equity, urban analysis enhanced by AI technologies, explainability techniques, and mechanisms of governance. The contribution of this paper consists in bringing these components together into the framework of Open Data Explainable Proximity City Planning.
This framework consists of the following elements: proximity city objectives, data infrastructure, accessibility measurement, spatial equity diagnosis, urban analytics enabled by artificial intelligence, explanation, governance, decision-making, and monitoring.
This paper provides a conceptual review, not an empirical validation of any particular technique. The usefulness of the suggested framework can be estimated only with the help of its application to open data case studies, participatory planning practices, and longitudinal evaluation of the implemented interventions. The main message of this review is that proximity planning should be led by planning and assisted by AI. Artificial intelligence will help to diagnose, interpret, simulate, and communicate evidence. But it will not replace public consultation, professional judgment, or democratic responsibility.
Funding
The author(s) received no specific funding for this work.
Ethical approval
Not applicable. This article is a literature-based review and does not involve human participants, fieldwork, experiments, private data, or intervention with human subjects.
Data availability
Not applicable. No new empirical dataset was generated or analyzed. The article synthesizes published literature.
Competing interests
The author(s) declare no competing interests.
Use of generative AI and AI-assisted technologies
AI-assisted tools were used to support language editing, manuscript structuring, and formatting preparation. The author(s) reviewed, verified, and approved the final manuscript and remain responsible for all content, citations, interpretations, and conclusions.
References
- Khavarian-Garmsir, A. R., Sharifi, A., & Sadeghi, A. (2023). The 15-minute city: Urban planning and design efforts toward creating sustainable neighborhoods. Cities, 132, 104101. [CrossRef]
- Sepehri, B., & Sharifi, A. (2025). X-minute cities as a growing notion of sustainable urbanism: A literature review. Cities, 161, 105902. [CrossRef]
- Logan, T. M., Hobbs, M. H., Conrow, L. C., Reid, N. L., Young, R. A., & Anderson, M. J. (2022). The x-minute city: Measuring the 10-, 15-, 20-minute city and an evaluation of its use for sustainable urban design. Cities, 131, 103924. [CrossRef]
- Carvalho, T., Farber, S., Manaugh, K., & El-Geneidy, A. (2025). Assessing the readiness for 15-minute cities: A literature review on performance metrics and implementation challenges worldwide. Transport Reviews, 45(5), 801-827. [CrossRef]
- Milias, V., Tsigdinos, S., Tzouras, P. G., & Kepaptsoglou, K. (2025). Assessing equitable access in X-minute cities through open spatial data. Environment and Planning B: Urban Analytics and City Science. [CrossRef]
- Mouratidis, K. (2024). Time to challenge the 15-minute city: Seven pitfalls for sustainability, equity, livability, and spatial analysis. Cities, 153, 105274. [CrossRef]
- Guzman, L. A., Oviedo, D., & Cantillo-Garcia, V. A. (2024). Is proximity enough? A critical analysis of a 15-minute city considering individual perceptions. Cities, 148, 104882. [CrossRef]
- Delavar, Y., Gamble, S., & Saldana-Ochoa, K. (2025). Past, present, and future perspectives on the integration of AI into walkability assessment tools: A systematic review. Urban Planning, 10, Article 8518. [CrossRef]
- Rhoads, D., Sole-Ribalta, A., & Borge-Holthoefer, J. (2023). The inclusive 15-minute city: Walkability analysis with sidewalk networks. Computers, Environment and Urban Systems, 100, 101936. [CrossRef]
- Son, T. H., Weedon, Z., Yigitcanlar, T., Sanchez, T., Corchado, J. M., & Mehmood, R. (2023). Algorithmic urban planning for smart and sustainable development: Systematic review of the literature. Sustainable Cities and Society, 94, 104562. [CrossRef]
- Lartey, D., & Law, K. M. Y. (2025). Artificial intelligence adoption in urban planning governance: A systematic review of advancements in decision-making and policy-making. Landscape and Urban Planning, 258, 105337. [CrossRef]
- Zhang, S., Yu, X., & Ma, J. (2025). Vision AI reveals waste-safety perception relationships in urban environments. npj Urban Sustainability, 5, 83. [CrossRef]
- Huang, T., Ye, X., Yigitcanlar, T., Xu, B., Newman, G., Zhao, B., Ennemoser, B., Wu, D., Kim, J., & Wang, D. (2026). Artificial intelligence in urban design: A systematic review. Cities, 169, 106527. [CrossRef]
- Drici, H., & Carpio-Pinedo, J. (2025). Urban land use mix and AI: A systematic review. Cities, 165, 106102. [CrossRef]
- Liu, K., Yigitcanlar, T., Mehmood, R., Corchado, J. M., & Fu, X. (2025). Large Language Models in urban planning: A systematic review and conceptual framework. Journal of Urban Technology. [CrossRef]
- Cugurullo, F., Caprotti, F., Cook, M., Karvonen, A., McGuirk, P., & Marvin, S. (2024). The rise of AI urbanism in post-smart cities: A critical commentary on urban artificial intelligence. Urban Studies, 61(6), 1168-1182. [CrossRef]
- Wang, T., & Yorke-Smith, N. (2025). Introduction: AI for and in urban planning. Urban Planning, 10, Article 9417. [CrossRef]
- Othengrafen, F., Sievers, L., & Reinecke, E. (2025). From vision to reality: The use of artificial intelligence in different urban planning phases. Urban Planning, 10, Article 8576. [CrossRef]
- Yigitcanlar, T., Desouza, K. C., Butler, L., & Roozkhosh, F. (2020). Contributions and risks of artificial intelligence in building smarter cities: Insights from a systematic review of the literature. Energies, 13(6), 1473. [CrossRef]
- Vale, D., & Lopes, A. S. (2023). Accessibility inequality across Europe: A comparison of 15-minute pedestrian accessibility in cities with 100,000 or more inhabitants. npj Urban Sustainability, 3, Article 55. [CrossRef]
- Bovens, M. (2007). Analysing and assessing accountability: A conceptual framework. European Law Journal, 13(4), 447-468. [CrossRef]
- Arnstein, S. R. (1969). A ladder of citizen participation. Journal of the American Institute of Planners, 35(4), 216-224. [CrossRef]
- Poorthuis, A., & Zook, M. (2023). Moving the 15-minute city beyond the urban core: The role of accessibility and public transport in the Netherlands. Journal of Transport Geography, 110, 103629. [CrossRef]
- Geurs, K. T., & van Wee, B. (2004). Accessibility evaluation of land-use and transport strategies: Review and research directions. Journal of Transport Geography, 12(2), 127-140. [CrossRef]
- Lucas, K. (2012). Transport and social exclusion: Where are we now? Transport Policy, 20, 105-113. [CrossRef]
- Martens, K. (2016). Transport Justice: Designing Fair Transportation Systems. Routledge.
- Sheller, M. (2018). Mobility Justice: The Politics of Movement in an Age of Extremes. Verso.
- Sen, A. (1999). Development as Freedom. Oxford University Press.
- Nussbaum, M. C. (2011). Creating Capabilities: The Human Development Approach. Harvard University Press.
- Kwan, M.-P. (2012). The uncertain geographic context problem. Annals of the Association of American Geographers, 102(5), 958-968. [CrossRef]
- Openshaw, S. (1984). The Modifiable Areal Unit Problem. Geo Books.
- Willberg, E., Fink, C., & Toivonen, T. (2023). The 15-minute city for all? Measuring individual and temporal variations in walking accessibility. Journal of Transport Geography, 106, 103521. [CrossRef]
- Caprotti, F., Duarte, C., & Joss, S. (2024). The 15-minute city as paranoid urbanism: Ten critical reflections. Cities, 155, 105497. [CrossRef]
- Haklay, M. (2010). How good is volunteered geographical information? A comparative study of OpenStreetMap and Ordnance Survey datasets. Environment and Planning B: Planning and Design, 37(4), 682-703. [CrossRef]
- Giuffrida, N., Molter, A., Pilla, F., & Ottomanelli, M. (2024). On the equity of the x-minute city from the perspective of walkability. Transport Engineering, 16, 100244. [CrossRef]
- Ribeiro, M. T., Singh, S., & Guestrin, C. (2016). “Why should I trust you?”: Explaining the predictions of any classifier. Proceedings of the 22nd ACM SIGKDD International Conference on Knowledge Discovery and Data Mining, 1135-1144. [CrossRef]
- Lundberg, S. M., & Lee, S.-I. (2017). A unified approach to interpreting model predictions. Advances in Neural Information Processing Systems, 30.
- Allam, Z., Khavarian-Garmsir, A. R., Lassaube, U., Chabaud, D., & Moreno, C. (2024). Mapping the implementation practices of the 15-minute city. Smart Cities, 7(4), 2094-2109. [CrossRef]
- Bruno, M., Monteiro Melo, H. P., Campanelli, B., & Loreto, V. (2024). A universal framework for inclusive 15-minute cities. Nature Cities, 1(10), 633-641. [CrossRef]
- Osorio-Arjona, J., & Albarran-Perianez, J. D. (2025). Assessing the multidimensionality of the 15-min city in Seville through open geospatial data. ISPRS International Journal of Geo-Information, 14(12), 472. [CrossRef]
- Arias-Molinares, D., Geurs, K., Grigolon, A., Ulak, B., Duran-Rodas, D., McCormick, B., Baguet, J., van Vessem, C., Adjeroud, H., Dorrzapf, L., Charalampidou, G., Bobicic, O., & Esztergar-Kiss, D. (2025). Exploring the 15-minute city concept for the urban outskirts: A systematic literature review. European Transport Research Review, 17, Article 50. [CrossRef]
- Lu, M., & Diab, E. (2025). Developing a 15-minute city policy? Understanding differences between policies and physical barriers. Transportation Research Part A: Policy and Practice. [CrossRef]
- Plaza-Herrera, D., & Mercade-Aloy, J. (2025). Inclusive 15-minute cities: An age-sensitive assessment of active accessibility in the metropolitan area of Barcelona. Cities. [CrossRef]
- Popescu, I. A., & Nicolescu, L. (2025). How smart is the 15-minute city? Evaluating the role of technology in advancing accessibility, mobility, and well-being. Transportation Research Part A: Policy and Practice. [CrossRef]
- Droin, A., Wurm, M., Weigand, M., & Debray, H. (2026). The influence of urban structure types on the x-minuteness of cities: An accessibility analysis of 15 German cities. Environment and Planning B: Urban Analytics and City Science. [CrossRef]
- Kalfas, D., Kalogiannidis, S., Spinthiropoulos, K., Chatzitheodoridis, F., & Ziouziou, E. (2025). Enhancing predictive urban planning in European smart cities through AI-driven digital twin technology: A case study of Greece. Urban Science, 9(7), 267. [CrossRef]
- Wolniak, R., & Stecula, K. (2024). Artificial intelligence in smart cities: Applications, barriers, and future directions: A review. Smart Cities, 7(3), 1346-1389. [CrossRef]
- Sanchez, T. W., Brenman, M., & Ye, X. (2025). The ethical concerns of artificial intelligence in urban planning. Journal of the American Planning Association, 91(2), 294-307. [CrossRef]
- Cugurullo, F., & Xu, Y. (2025). When AIs become oracles: Generative artificial intelligence, anticipatory urban governance, and the future of cities. Policy and Society, 44(1), 98-115. [CrossRef]
- Abbaszadeh Bavil Soflaei, M. R., Samadzamini, K., & Salehpour, A. (2025). Beyond imbalance: advancing breast cancer diagnosis with synthetic data and ML modeling. Network Modeling Analysis in Health Informatics and Bioinformatics, 14(1), 34. [CrossRef]
- Salehpour, A., Hosseinioun, P., & Balafar, M. A. (2026). A two-stage intrusion detection framework in IoT using random forest for binary and multi-class classification. International Journal of Grid and Utility Computing, 17(3), 214–237. [CrossRef]
- Salehpour, A., Souri, A., Zhou, S., & Li, K. (2027). Graph–language synergy in intelligent information systems: A systems-level review of GNN–LLM integration, GraphRAG, and knowledge-grounded reasoning. Computer Standards & Interfaces, 99, 104179. [CrossRef]
- Salehpour, A., & Souri, A. (2026). Autonomous zero-trust security assurance for multi-domain network slicing: a systematic review of 5G-advanced and 6G research. International Journal of Computers and Applications, 1–22. [CrossRef]

Table 1.
Existing review streams and the remaining integration gap.
| Review stream | What it covers | Main contribution | Remaining gap for this review |
| 15-minute city conceptual reviews | Proximity, density, diversity, digitalization, sustainability, neighborhood completeness. | Clarify the conceptual foundations of proximity-based urbanism. | Limited integration with explainable analytics, open-data diagnosis, and operational decision support. |
| X-minute city metric reviews | 5-, 10-, 15-, and 20-minute variants, thresholds, amenity baskets, modes, and performance metrics. | Document methodological diversity in measuring proximity. | Equity, explainability, and governance are often secondary to measurement. |
| Open-data accessibility studies | OSM, POI, GTFS, population grids, sidewalks, and cross-city comparison. | Provide reproducible evidence for accessibility and service coverage. | Often stop at mapping rather than explaining causes or interventions. |
| Spatial equity and accessibility justice literature | Distributional justice, sufficientarian thresholds, transport disadvantage, capability, and vulnerable groups. | Connect accessibility measurement to justice. | Needs stronger integration into X-minute city operational frameworks. |
| AI in urban planning and smart-city reviews | Algorithmic planning, digital twins, smart governance, prediction, clustering, and planning support. | Show analytical potential of AI-enabled planning tools. | Often broad and not grounded in proximity-city spatial-equity problems. |
| Critical urban AI/governance literature | Ethics, bias, accountability, transparency, public trust, and technocratic risk. | Warns against opaque or unaccountable urban AI. | Needs translation into practical safeguards for proximity-planning analytics. |
Table 2.
Accessibility and equity metrics for X-minute city studies.
| Metric family | What it measures | Strength | Limitation | Planning use |
| Amenity count | Number or presence of reachable destinations within a threshold. | Simple and communicable. | Treats services as equivalent and may ignore quality or capacity. | Screening neighborhood completeness. |
| Travel-time/distance metric | Network distance or travel time to destinations. | Easy to map and explain. | Thresholds and speeds may be arbitrary. | Assessing walking, cycling, or transit reach. |
| Cumulative opportunity | Count of destinations reachable within a time or distance band. | Widely used and transparent. | Sensitive to destination selection and threshold choice. | Comparing service access across neighborhoods. |
| Gravity/accessibility intensity | Opportunities weighted by distance or impedance. | Models gradual decline in access. | Less intuitive for policymakers. | Estimating accessibility intensity. |
| Population-weighted access | Residents covered by an access standard. | Links access to people rather than only places. | Depends on population-grid resolution. | Identifying underserved populations. |
| Composite score | Multiple indicators combined into one index. | Useful for dashboards and ranking. | Weighting choices may be opaque. | Benchmarking and prioritization. |
| Inequality index | Distributional unevenness across places or groups. | Supports equity diagnosis. | Does not identify causes alone. | Equity audit and spatial targeting. |
| Sufficientarian threshold | Whether minimum access standards are met. | Directly relevant to justice-oriented planning. | Requires normative standard setting. | Identifying unmet need. |
Source: synthesized from accessibility, X-minute city, and spatial-equity literature [3,4,5,20,32,35,39,43].
Table 3.
Open geospatial data sources for proximity and equity analysis.
| Data source | Typical use | Planning value | Main limitation |
| OSM street networks | Walking/cycling network analysis, isochrones, connectivity measures. | Reproducible route-based accessibility. | Pedestrian detail and completeness vary by place. |
| Points of interest | Identifying supermarkets, schools, parks, healthcare, transit stops, and other destinations. | Enables amenity-based proximity analysis. | Category accuracy and update frequency vary. |
| GTFS transit feeds | Scheduled public transport accessibility and service reach. | Represents transit-based access. | May omit reliability, crowding, informal transport, and service disruption. |
| Population grids | Population-weighted accessibility and inequality measures. | Links accessibility to residents. | May miss daytime population and informal settlement patterns. |
| Sidewalk data | Pedestrian-specific access and barrier analysis. | Improves realism for walking accessibility. | Often unavailable, incomplete, or inconsistent. |
| Street-view imagery | Built-environment perception, safety, greenery, and maintenance. | Adds ground-level experiential evidence. | Coverage, date, perspective, and image bias must be considered. |
| Municipal open data | Parks, schools, services, zoning, infrastructure, and local plans. | Often authoritative for local planning. | Weak cross-city comparability and inconsistent metadata. |
| Participatory/survey data | Perceived barriers, safety, needs, preferences, and lived experience. | Adds human-centered evidence. | Costly, localized, and less scalable. |
Table 4.
AI and urban analytics methods relevant to proximity planning.
| Method | Possible use in proximity planning | Planning value | Main risk |
| Machine learning prediction | Model access deficits, service gaps, or built-environment outcomes. | Identifies patterns not captured by simple metrics. | Opaque or biased predictions. |
| Clustering/typology analysis | Group neighborhoods by access, density, service mix, vulnerability, and morphology. | Supports targeted policy packages. | Can oversimplify complex places. |
| Computer vision | Extract sidewalk, greenery, maintenance, disorder, or safety proxies from imagery. | Adds ground-level evidence. | Image bias and temporal mismatch. |
| Natural language processing / LLMs | Analyze plans, policy documents, or public comments. | Supports qualitative synthesis and participation analysis. | Ungrounded or fabricated outputs; weak accountability. |
| Explainable AI | Identify drivers of access inequality or perception outcomes. | Improves interpretability for planners. | May be misread as causal proof. |
| Scenario modeling / digital twins | Estimate effects of adding services, transit, infrastructure, or land-use changes. | Supports comparison of alternatives. | Requires transparent assumptions and high-quality data. |
| Dashboard analytics | Present indicators, uncertainty, and monitoring results. | Improves communication. | Can encourage superficial benchmarking. |
Table 5.
Corpus organization and evidence-role protocol for the narrative review.
| Review component | Specification used in this article |
| Review type | Narrative and critical review; conceptual framework article; not PRISMA, not bibliometric, not meta-analytic. |
| Date range | Foundational literature plus peer-reviewed work available up to June 2026; recent-update emphasis on 2024-2026 publications. |
| Search locations | Scopus/Web of Science indexed literature where available; Google Scholar for forward/backward citation tracking; publisher platforms including Elsevier, Springer Nature, Taylor & Francis, SAGE, MDPI, Cogitatio, Oxford University Press, and Nature Portfolio. |
| Example search strings | “15-minute city” OR “X-minute city” OR “proximity city” AND accessibility/equity/justice; “15-minute city” AND OpenStreetMap/GTFS/POI/open data; “urban planning” AND artificial intelligence/governance; walkability AND AI/computer vision; “explainable AI” AND urban/planning/accessibility. |
| Inclusion logic | Peer-reviewed journal articles, books, and landmark theoretical works relevant to proximity planning, accessibility, equity, open geospatial data, AI/urban analytics, explainability, or governance. |
| Exclusion logic | Blogs, newspaper commentary, non-peer-reviewed opinion pieces, generic smart-city papers without relevance to accessibility/equity/governance, and purely technical AI papers without an urban-planning link. |
| Evidence roles | Conceptual framing; empirical measurement; open-data infrastructure; AI/urban analytics; equity and justice theory; critical governance; decision-support translation. |
| Synthesis strategy | Thematic coding and conceptual integration from planning goal to data, measurement, diagnosis, explanation, governance, intervention, and monitoring. |
Table 6.
Operationalizing the Open-Data Explainable Proximity Planning Framework.
| Framework layer | Input data / assumptions | Analytical task | Planning output | Governance risk | Example indicator |
| 1. Proximity planning goal | Service basket; travel mode; threshold; target population; spatial scale; equity standard. | Define the planning question and normative scope. | Transparent definition of what the X-minute target means. | Symbolic goal-setting without accountability. | Service categories, mode assumptions, and target threshold documented. |
| 2. Open geospatial data infrastructure | OSM, POI, GTFS, population grids, sidewalks, street-view imagery, municipal datasets. | Audit data coverage, metadata, completeness, and comparability. | Validated evidence base and uncertainty register. | Data gaps misrepresent underserved places. | Completeness rate, update date, metadata quality, missing-category audit. |
| 3. Accessibility measurement | Networks, destinations, travel speeds, transit schedules, origins, service capacity. | Calculate travel time, cumulative access, gravity score, and population coverage. | Accessibility maps and service-specific profiles. | Threshold and metric choices appear neutral while shaping results. | Share of residents reaching essential services within defined threshold. |
| 4. Spatial-equity diagnosis | Socio-demographic data; vulnerability indicators; peripheral/core classifications; group needs. | Compare distribution, sufficiency, and group-sensitive access. | Equity audit and priority-area identification. | Equity reduced to a single score or average. | Gini/Lorenz, minimum-service threshold, worst-quartile access. |
| 5. AI / urban analytics layer | Built-environment features, perception proxies, neighborhood typologies, historical indicators. | Detect patterns, cluster areas, model deficits, compare scenarios. | Diagnostic evidence and scenario alternatives. | Opaque, biased, or overconfident model outputs. | Cluster type, predicted access deficit, scenario-based access gain. |
| 6. Explainability layer | Model features, assumptions, uncertainty intervals, counterfactual conditions, causal cautions. | Translate statistical output into planning-relevant mechanisms. | Planner- and stakeholder-facing explanations. | Explanations misread as causal proof. | Top drivers of low access; uncertainty note; counterfactual scenario. |
| 7. Governance safeguard | Data provenance, participation records, oversight roles, contestability process, privacy requirements. | Document, validate, and oversee the analytical pipeline. | Legitimate and accountable use of analytics. | Technocratic or non-contestable planning. | Public documentation, validation meeting, human-oversight checkpoint. |
| 8. Planning decision support | Intervention options, costs, feasibility, affected groups, trade-offs. | Compare scenarios and prioritize interventions. | Policy options with transparent prioritization logic. | Maps remain descriptive rather than actionable. | Intervention ranking, cost/access ratio, beneficiaries by group. |
| 9. Policy intervention and monitoring | Implementation data, before/after access, service updates, community feedback. | Track whether interventions reduce access gaps over time. | Monitoring dashboard and adaptive policy revision. | Policy effects remain unverified or inequitable. | Change in access gap; intervention completion; resident feedback. |
Source: synthesized from the review evidence base on proximity planning, accessibility metrics, open geospatial data, AI planning, explainability, and governance [1,2,3,4,5,6,7,8,9,10,11,12,13,14,15,16,17,18,21,22,23,36,37,38,39,40,41,42,43,44,45,46,47,48,49].
Table 7.
Future research agenda.
| Future direction | Current limitation | Recommended approach | Planning value | Risk to avoid |
| Equity-sensitive X-minute indicators | Proximity metrics often underrepresent differentiated needs. | Combine distributional, sufficientarian, group-sensitive, and destination-specific indicators. | Identifies underserved places and groups more precisely. | Reducing equity to one composite score. |
| Open-data benchmarking | Open data vary by place, category, and update frequency. | Build standardized categories, metadata, validation, and uncertainty reporting. | Enables reproducible comparison without hiding limitations. | Turning benchmarks into simplistic city rankings. |
| Explainable AI diagnosis | AI studies often emphasize technical performance over planning interpretation. | Use interpretable models to identify plausible drivers of access deficits. | Converts maps into diagnosis and intervention logic. | Treating explanations as causal proof. |
| Perception-aware accessibility | Objective proximity misses safety, comfort, and lived experience. | Combine networks, street-view AI, surveys, and participatory mapping. | Reveals barriers hidden by distance measures. | Assuming perception scores represent all users equally. |
| Peripheral and Global South contexts | Urban-core assumptions dominate 15-minute city research. | Adapt thresholds, modes, data, and service definitions to context. | Makes proximity planning more inclusive and realistic. | Accepting lower access standards for underserved areas. |
| Scenario-based planning support | Many studies map current access but do not test interventions. | Model service, transit, sidewalk, zoning, and public-space scenarios. | Supports evidence-based prioritization and trade-off analysis. | Ignoring cost, politics, land, and community preferences. |
| Governance and accountability | AI tools may be opaque or technocratic. | Build transparency, participation, contestability, and human oversight into workflows. | Protects legitimacy and public trust. | Treating governance as a post-technical add-on. |
Disclaimer/Publisher’s Note: The statements, opinions and data contained in all publications are solely those of the individual author(s) and contributor(s) and not of MDPI and/or the editor(s). MDPI and/or the editor(s) disclaim responsibility for any injury to people or property resulting from any ideas, methods, instructions or products referred to in the content. |
© 2026 by the authors. Licensee MDPI, Basel, Switzerland. This article is an open access article distributed under the terms and conditions of the Creative Commons Attribution (CC BY) license (http://creativecommons.org/licenses/by/4.0/).
Copyright: This open access article is published under a Creative Commons CC BY 4.0 license, which permit the free download, distribution, and reuse, provided that the author and preprint are cited in any reuse.