

Submitted:
23 October 2026
Posted:
26 October 2026
You are already at the latest version
Abstract
Background: Cognitive resources are allocated based on task difficulty, duration and immersion level. The development of virtual reality (VR) technology, based on head-mounted displays (HMDs), has led to increased immersive user experiences, affecting mental load and effort, as measured by Electroencephalography (EEG). However, brain dynamics under different difficulty and immersive levels have not been fully described. Methods: EEG recordings and microstate (MS) analysis were used in classical desktop (DSK) and HMD-based stimulation environments to explore the effects of cognitive demand and immersion level on brain dynamics and their relationship with attention domains. Twenty-seven healthy participants performed a two-level N-back task in both environments, while EEG signals were acquired. Brain dynamics were evaluated through MS-based dynamic parameters and power-based indices were computed to estimate attention and engagement. Results: The increased task difficulty modulates EEG microstate dynamics, regardless of the immersion level. Specifically, the highest mental demand was associated with an increased presence of MS D, related to the task active network, confirming its involvement in cognitive tasks. Conclusions: Although immersion level did not significantly influence MS dynamics, it affected the relationship with attention level, with a stronger correlation observed in the DSK condition and a weaker one in the HMD scenarios.
Keywords:
immersion
; virtual reality
; electroencephalography
; attention
; brain dynamics
1. Introduction
Cognitive processes are complex phenomena comprising diverse mental domains: attention, vigilance, working memory and cognitive workload [1,2]. Mental resources are used to support brain functions towards a specific goal, and their intensity depends on task duration and difficulty, as well as environmental and self-perceptual factors [3,4]. Interest in these last aspects has increased with the development of virtual reality (VR) technologies, which provide users with multisensory and more realistic experiences compared to traditional screen-based devices. Specifically, the use of Head Mounted Displays (HMDs) facilitates VR employment across various applications, such as learning, rehabilitation and entertainment, by increasing the immersion level compared to traditional planar displays [5].
Immersion, in its psychological sense, refers to the subjective feeling of being absorbed in and engaged with a setting that offers uninterrupted stimulation and experiences [6], potentially increasing individual focus and attention, inspiring the realization of adaptive systems to monitor and guide the user’s state [7]. At the technological level, immersion also denotes the objective properties of the system, such as field of view, stereoscopy, and sensorimotor contingencies, that characterize the degree to which an environment (e.g., HMD vs. desktop) can support and facilitate such subjective engagement [8]. To measure and monitor how the brain allocates its resources during mental tasks, a multitude of approaches and metrics based on both physiological data, human performance and self-assessment information have been used. Among these, electroencephalography (EEG) is an appropriate approach to measure cognitive effort, given that it directly reflects brain correlates with high temporal resolution, and it has been combined with VR systems to investigate the effect of immersion and task difficulties on brain states and mental workload (MWL) [3,7].
In the literature, EEG spectral analysis and indices based on EEG power ratios have been proposed to investigate the modulation of mental workload, attention and engagement [9]. Still, these methods often overlook the dynamic behavior of electrical brain activity and cannot explain the complexity of brain network interactions supporting cognitive functions. To fill this gap, EEG microstates (MS) analysis was proposed as a powerful tool to study brain dynamics under resting state and task conditions. MS analysis describes EEG activity with a finite number of topographic maps of scalp potential that remain stable for a short period of time (tens of milliseconds) before transitioning to a different configuration, generating a sequence of MS [10,11,12]. By encapsulating spatial information, the different MS topographies enable the observation of the coordinated neuronal activity over time, and its dynamic modulation at the millisecond time scale. These MS topographies have been mainly grouped into up to 7 meta-maps (A, B, C, D, E, F and G) and their physiological interpretation has been proposed in the literature. Specifically, the topographical map associated with meta-map A shows a left posterior to frontal right configuration and [13] associated this class with the superior temporal lobe and auditory network activation. The configuration associated with class B has a right posterior to left frontal voltage distribution. In literature, class B has been associated with occipital activity, thus potentially attributed to the visual network. Class C has an almost symmetric frontal to parietal configuration [13] and it has been traditionally associated with the activity of the Posterior Cingulate Cortex (PCC) and precuneus. MS C has also been interpreted as reflecting both the default mode network (DMN) and the salience network (SN). However, contradictory results in the literature can be found; indeed, it has been proposed that C only reflects specific components of the DMN that could be partially manifested in other classes. Class D has been associated with frontal activity, thus related to attention, as it reflects the activation of the task active network (TAN), composed of the dorsolateral attention network (DAN), the frontoparietal network (FPN) and the ventral attention network (VAN). Meta-map E [14] has been proposed as a possible split of class C; it is associated with a portion of the DMN and it has occipital to frontal orientation. Finally, F and G, even if less reported in the literature, have been shown to have sources in the Anterior Cingulate Cortex and in the Medial Prefrontal Cortex, respectively. It is also suggested that MS G may represent the activity of the sensorimotor network as strongly related to cerebellar activity.
MS analysis has been used to explore how brain activity and dynamics may be modulated by mental processes, both in resting state conditions and across different cognitive tasks. For example, a task-specific modulation of microstates was observed during fluid reasoning [15], in relation to mental workload across different task types [4], in multitasking experiments [16] and fatigue [17]. The potential of MS analysis has been less explored in combination with VR environments, specifically to study cognitive effort and attention. Indeed, the combination of VR and MS analysis has been used to explore correlates of emotions [18,19], reaction to postural perturbation [20], and only one previous study specifically investigated how immersive experience affects MS sequences [6]. It should be noted that a direct comparison between different levels of system immersion has not yet been explored.
In this context, we leveraged the experiment presented in a previous work [3] exploiting both classical screen-based Desktop (DSK) and HMD stimulation environments combined with EEG recordings, designed to evaluate the effect of different immersion levels and task difficulties (N-back test) on mental workload. The present study expands the previous hypothesis and provides new results by including microstate analysis, to explore how brain dynamics are modulated by cognitive demand (N-back difficulties) as a function of the immersion level (DSK vs HDM). The relationship between MS dynamics and the attention and engagement domain, as estimated by traditional EEG-based indices, was also investigated to gain a better understanding of the complex interaction between brain dynamics and the mental domains of interest.
2. Materials and Methods
2.1. Experimental Procedure
The data analyzed in this study have been previously described in [3] and were made openly accessible at https://doi.org/10.17605/OSF.IO/C7M6Z [21]. Briefly, 27 healthy adults (mean age 31.37 years, SD = 4.32 years) participated in the study, which was approved by the ethics committee of the National Research Council of Italy (N°0013481/2022), after signing the informed consent.The protocol is described in detail in [3] but a brief description is also provided in the following to give the reader a complete view of the current work.
To minimize confounding variables, the study was conducted in a noise-controlled laboratory at fixed times of day. Participants were required to meet specific physiological criteria, including a full night’s sleep and a 4-hour abstinence from caffeine. The experimental design was a randomized crossover design: participants were divided into two groups to counterbalance the order of technology used. The technologies employed in the two sessions were: a screen-based Desktop (DSK) and an Immersive VR (HTC Vive Pro) environment with HDMs. The digital environment, developed in Unity (version 2020.3.29f1), was designed by the STIIMA research group [22]. A one-week interval separated the two different sessions.
The core experiment consisted of a modified N-back test including a 3-minute resting state (R) baseline followed by four 4-minute task blocks of incremental difficulty (protocol phase), with 1-N (T1) and 2-N (T2) back levels. The full protocol originally included both a simple visual N-back and a dual N-back test with combined visual and audio stimuli. In the current study, to reduce possible confounding factors due to multiple sensory stimuli, and simplify the tested hypothesis related to attention modulation during the N-back task, we restricted the analysis to the visual N-back condition.
Brain activity was monitored via EEG signals acquired using a compact 32-channel system (eegoTMsports 32, ANT NeuroVR, Enschede, The Netherlands), with 30 electrodes placed according to the 10/20 system and the reference placed at the CPz position. The sampling frequency was set to 500 Hz. Technical rigor was maintained by keeping electrode impedance below 20 Ohm and ensuring the HMD did not displace sensors.
2.2. EEG Acquisition and Pre-Processing
The pre-processing pipeline suggested in [23] was employed. To prepare the EEG data for analysis, MATLAB and the EEGLAB toolbox were used. First, a 1–45Hz band-pass filter was applied to remove electrical interference and slow signal drifts. Then, bad channels were identified and removed if the signals deviated significantly from the average signal power. Physical artifacts were then addressed using two main methods: Artifact Subspace Reconstruction (ASR) [24,25], and Independent Component Analysis (ICA) to separate brain activity from non-brain signals such as eye blinks or heartbeats. Using the ICLabel tool [26], components associated with ocular, muscular and cardiac sources were identified and removed. Finally, the missing data from the removed electrodes were reconstructed via interpolation, and the data were re-referenced to a common average reference.
2.3. EEG Microstates Analysis
The pipeline for MS analysis was implemented based on standard approaches described in the literature, using the MICROSTATELABEL plugin from EEGLAB [27]. The complete MS analysis pipeline is represented in Figure 1.
For each participant and task, in both recording sessions (DSK and HMD), the central artifact free 60-second segment of each protocol phase (Baseline (R), T1, and T2) was further analyzed to consider stable task conditions and avoid initial and ending transitions. Data quality was checked using the plugin’s dedicated functions, and further corrections were applied if needed. Signals were segmented into 2-second epochs before MS analysis [15] and a further quality check was applied, with fewer than one epoch per set being rejected. Signals were filtered between 2 and 20 Hz as suggested in the literature with a FIR, zero-phase filter implementation [28]. Following these preprocessing steps, the MS procedure was applied. To select the optimal number of templates, k was varied between 4 and 7, and the choice was based on the shared variance with the meta-templates provided in [29]. Specifically, the mean shared variance across MS classes obtained using templates k=4, 5, 6, 7 were 80.2%, 85.2%, 81.8% and 71.9%, respectively. Therefore, the number of MS templates (k) was set to 5. This choice was also supported in the literature, where it was suggested as the most stable and reproducible across recording sessions [14,28,30].
The clustering procedure adopted to identify the 5 MS was the modified k-means and it was applied to the global field potential (GFP) peaks of each participant, for each task and immersion level combination (i.e., (R, T1, and T2) * (DSK and HMD)) to identify the individual MS.
The GFP is defined as in eq (1)
where N is the number of channels, is the electrical potential at the n-th channels at each time t and represents the mean potential across all channels at time t. The GFP maxima were then clustered across participants to obtain the templates for each task; secondly, these were clustered again to obtain the group mean for each immersion level. To reduce the variability due to random initializations, we performed the clustering with multiple restarts (100) and the solution that explains the maximally possible amount of variance was retained as the best one [27]. Finally, the grand mean maps (GMMs) for the whole dataset were obtained. The backfitting procedure (i.e., the association of each time instant to a MS class) was performed using the GMMs obtained on the whole dataset (27 participants * 3 tasks (R, T1, T2) * 2 immersion levels) to ensure comparability of dynamic parameters among tasks and environments [11]. The GMMs were sorted using the EEG-meta-microstates (meta-maps) [29] to associate them with previously published MS templates which have been described in relation to specific brain.
2.3.1. Results Assessment and Dynamic Parameters Computation
After the backfitting, the overall proportion of the variance in the EEG data that is explained by all microstate classes is represented by the Total Explained Variance (TEV, ranging between 0 and 1), a global parameter indicating the goodness of the total fit of the identified MS classes on the data. Moreover, to evaluate the similarity between the identified GMMs and the published meta-maps, the spatial correlation between the topographical representations within each class is computed using the linear Pearson’s correlation coefficient (CC).
Then, dynamic parameters of interest were computed: duration, occurrence, coverage and transition probabilities. Specifically, the Mean duration of class i-th, measured in ms, corresponds to the average duration of all microstates belonging to the microstate of class i-th. The Occurrence of class i-th, measured in Hz, indicates the frequency with which microstates of class i-th are observed. The Coverage parameter refers to the contribution of each MS class, and it is measured as the percentage of total time each microstate class is present. Finally, the dynamic of the MS sequence is described by the Transition probabilities i → j, which measure, in percentage, the number of times that there is a transition from a microstate of class i-th to a microstate of class j-th.
2.4. Power-Based Engagement and Attention Index Estimation
The engagement index (EI) and the attention index (AI), which indicate the general engagement and attention level of a subject, are based on the computation of ratios between the spectral power in the alpha (8-13) Hz, beta (13-22) Hz and theta (4-8) Hz frequency ranges at specific channel locations [31,32].
Specifically, EI and BA were computed as in eq (2) and (3)
Where , and respectively represent the summation of the spectral power in beta, alpha and theta frequency range computed at the indicated channel locations (Cz, Pz, P4 and P3). The spectral powers were extracted by means of Welch’s periodogram with 1-second tapering, from the same 1-minute signal segments analysed in the MS analysis in each task condition (R, T1, T2) and immersion level (DSK and HMD), extracted before the additional filtering step between 2 and 20 Hz performed for the MS analysis.
2.5. Statistical Analysis
To assess differences across experimental conditions, repeated measure analyses of variance (ANOVAs) were separately performed for each microstate parameter. A 2 X 3 design was applied to each MS class (A, B, C, D and E) with within-subjects factors “Immersion” levels (DSK and HMD) and “Tasks” (R, T1, and T2), with random effects for individual participants. The Greenhouse-Geisser correction has been applied if the sphericity assumption was not valid. This statistical approach was applied because parameter distribution was found to be normal by Lilliefors test. When an interaction Immersion level * Task was found, reduced models were separately applied. If only one of the main factors was found significant, post-hoc analysis was performed with Benjamini-Hochberg’s false-discovery rate (FDR) correction. The Cohen’s effect size (es) was also estimated and reported. The same statistical analysis was performed for the two power-based indices AI and EI.
To statistically analyze the transition probabilities, the repeated measures ANOVA test was applied for each immersion level, considering as within factors the ‘Task’ and the ‘Transition’ (i.e., A to B, B to A and so on). The FDR approach was used for the p-values correction of the post-hoc comparisons.
EI and AI indices were also analyzed in terms of linear correlation with dynamic parameters characterizing MS D, since this is shown to reflect the TAN activation. Correlation analysis was carried out separately for each immersion level considering all three tasks simultaneously, thus a repeated-measures correlation was estimated. Statistical analysis was performed in Python (Pingouin library [33]).
3. Results
3.1. MS Maps
Figure 2 displays the five MS maps obtained, specifically the GMMs obtained by averaging the MS maps from all the datasets, the DSK mean maps, obtained by averaging the datasets belonging to the DSK environment and, finally, the HMD mean maps obtained by averaging the datasets belonging to the HMD environment. As a reference, the meta-maps used to sort the MS classes are also represented.
Table I reports TEV values averaged across all recordings and the correlation coefficient between the GMMs and the associated meta-maps. TEV values are close to 70%, while the CC between the GMM topographies and the meta-map templates is above 0.85. Thus, we can assume the reliability of our analysis.

Table 1.
Mean TEV values and spatial CC between extracted MS topographies and sorting maps.
| R | T1 | T2 | |||||
|---|---|---|---|---|---|---|---|
| Mean | ±SD | Mean | ±SD | Mean | ±SD | ||
| TEV | DSK | 0.70 | ±0.04 | 0.69 | ±0.04 | 0.70 | ±0.04 |
| HMD | 0.69 | ±0.04 | 0.69 | ±0.03 | 0.70 | ±0.04 | |
| A | B | C | D | E | |||
| CC (GMM – Meta-maps) | 0.969 | 0.977 | 0.893 | 0.854 | 0.967 | ||
3.2. Duration, Occurrence, and Coverage Analysis
The value distributions of the extracted parameters are displayed in Figure 3.
Figure 3 (a) displays mean duration values for each MS class, comparing immersion levels and tasks. MS C shows higher duration values with respect to the other MS classes in each condition. As for the statistical assessment, only MS D showed a significant main effect of factor ‘Task’ (p-value = 0.004), with an increased duration at T2 with respect to R (corrected p-value = 0.013, es=0.590). The interaction between the two factors ‘Task’ and ‘Immersion level’ was never significant, nor was the main factor ‘Immersion level’.
Figure 3(b) shows the MS data Coverage, comparing levels of immersion and tasks for each class. As for the mean duration, MS C showed the highest Coverage values among the classes and did not present any significant variation across conditions. The ANOVA analysis identified a ‘Task’*’Immersion level’ interaction in class A (p-value = 0.006). Specifically, in the DSK environment, T2 resulted in a lower coverage with respect to R and T1 (p-value=0.015, es=0.272; p-value=0.016, es=0.297), while in the case of HMD differences were found between R and T1 (p-value=0.032, es=0.243) and R and T2 (p-value=0.033, es=0.242). Task effect was significant for class D (p-value = 0.0005) with both T1(p-value = 0.042, es=0.299) and T2 higher than R (p-value = 0.002, es=0.475). Finally, a significant interaction was found for class E (p = 0.033), but no significant differences survived after the FDR correction.
Figure 3(c) shows the values for the mean occurrence parameter across conditions. Also in this case, MS C showed a higher frequency of occurrence than the other MS, but no statistical modulations of this parameter were found. Statistical analysis identified the task effect as significant for class A (p-value = 0.003), with a significant decrease in occurrence in T2 with respect to R (p-value=0.006, es=0.432), and for class B (p-value = 0.023) with non-significant post-hoc comparisons after FDR correction. Task effect was also significant for MS D (p-value=0.005), with Occurrence in T2 higher than in R (p-value = 0.012, es=0.313). The ‘Task’*’Immersion level’ interaction was significant for class E (p-value =0.009), specifically in the DSK environment, the Occurrence in T1 was lower than in R (p-value=0.008, es=0.271), while for HMD, Occurrence decreased in T2 with respect to both R (p-value=0.04, es=0.248) and T1 (p-value=0.04, es=0.218).
3.3. MS Probability of Transitions Analysis
Figure 4 shows the transitions in each task and level of immersion averaged across participants. It is evident that, being prominent across all parameters, Class C is more involved in transitions (from and to C) than all the other classes. To prove this observation, repeated measures ANOVA was applied for each immersion level and neither the ‘Task’*‘Transition’ interaction, nor the ‘Task’ factor was significant, meaning that there is not a significant change in transition due to the protocol phase (R, T1 and T2). The factor ‘Transitions’ was, instead, significant both in the DSK (p-value=0.001) and HMD (p-value<0.001) cases. Specifically, post-hoc analysis showed that most of the transitions from or to MS C were significantly higher than the others for both immersion levels (Supplementary tables S1 and S2 report post-hoc p-values for the DSK and HMD respectively).
3.4. Power-Based Index Analysis
Figure 5 shows the mean and standard deviation of attention and engagement computed using power-based AI and EI indices. For both indices, no significant factor interaction, or main factor effects were observed. However, for the AI index, an increasing trend with task difficulty was observed in the DSK environment, but the trend was not significant (p-value=0.15). This was less pronounced in the HDM case, where the mean attention index decreased in T2. As for the EI index, no particular trend was observed in the DSK environment, whereas it decreases with task difficulty in the case of HDM.
3.4.1. Correlation with Attention and Engagement Indices
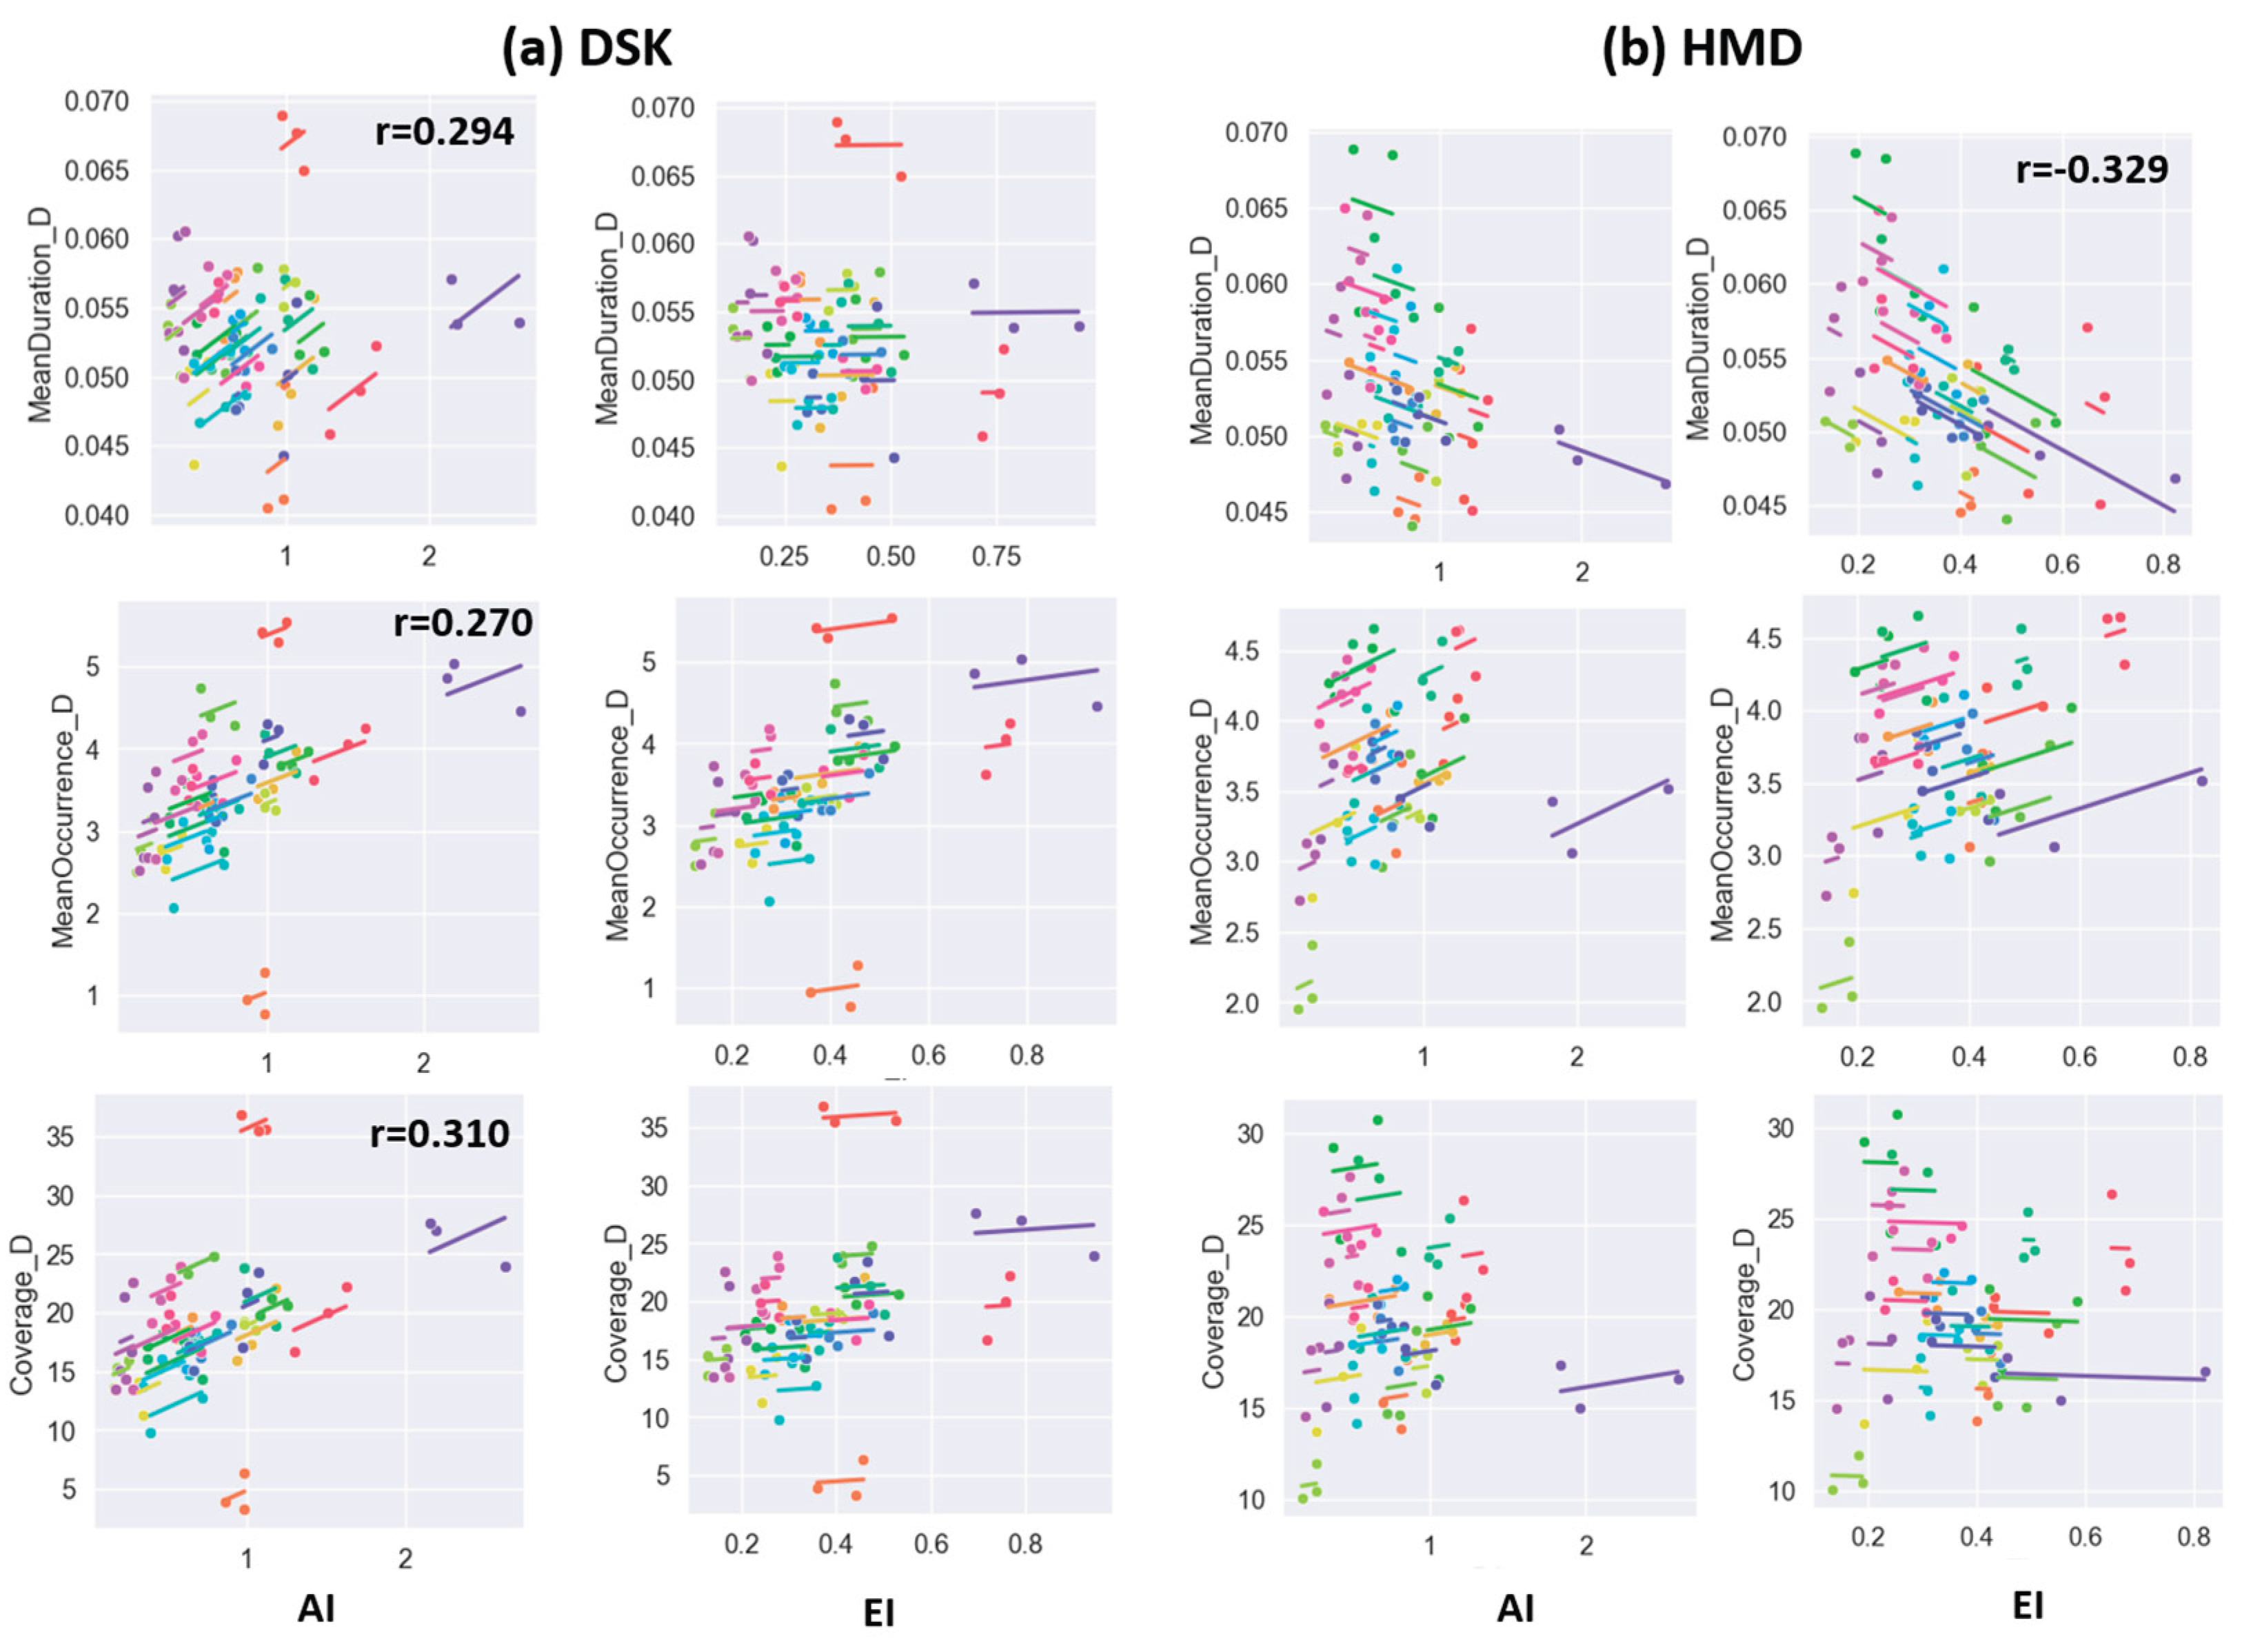
Figure 6 displays the repeated measures correlation between the dynamic parameters (duration, occurrence and coverage) of MS D, and the EI and AI indices for each immersion level. The mean duration of MS D resulted in being positively correlated with the AI index for the DSK environment (r =0.294, p-value=0.029), indicating that an increase in the attention index may be associated with an increase in the duration of the TAN activation (MS D). However, it was also negatively correlated with the EI for the HMD environment (r = -0.329, p-value=0.014). No significant correlation was observed between the Mean Occurrence of MS D with the EI index, while a significant correlation was found between the occurrence of MS D and the AI index for the DSK environment (r=0.27, p-value=0.043). A similar but not significant trend was found in the HMD environment (r=0.245, p-value=0.071). No significant correlations were observed between the Coverage of MS D and the EI index, while a significant correlation was found between the coverage of MS D and the AI index for the DSK environment (r=0.31, p-value=0.019). These results support the hypothesis that MS D is linked to the attention network, as it is positively correlated with the attention index.
4. Discussion
The present study aimed at deepening our understanding of brain dynamics in response to different levels of cognitive load (1-N and 2-N back tasks) and immersion level (DSK and HMD), and their relation to attention and engagement. A previous work by Modellini and colleagues demonstrated that, even if different degrees of immersion did not show significant differences in subjective MWL, HMD reduced the MWL objectively estimated using an EEG-based index, suggesting that it may influence the objective mental load in cognitive tasks [3].
Building on these results, we hypothesized that more complex brain dynamics may be involved in functional processing supporting attention in response to different cognitive efforts and immersion environments; and that this could be investigated using MS analysis [6,34].
Previous studies, exploiting MS analysis in this context, have focused only on the effects of cognitive effort, MWL [16], or immersion level [6], separately. In contrast, the current study focused on investigating if both different N-back levels and immersion modalities affect MS parameters (i.e., duration, coverage and occurrence) and their dynamics (transition probabilities). Our analysis used five microstate maps showing strong similarities with the published meta-maps [29]; this result allowed us to associate our MS with specific brain networks, as suggested by the literature, and to propose an interpretation of our findings accordingly.
Overall, our results suggest that MS dynamic is modulated by the task when the task level is more demanding (T2); this effect occurs at both immersion levels. Specifically, there was a significant increase in all the parameters associated with the MS D, related to the attentive networks, therefore suggesting an increased activation of this network. Even if the immersion level did not significantly differ in terms of MS duration, coverage and occurrence, a different modulation of parameters related to MS A and MS E was observed, for which, indeed, the factors interaction ‘Task’*’Immersion level’ was found significant. Moreover, focusing on MS D, the relationship between dynamic parameters and the attention and engagement indices was found to differ for the two immersion levels, showing stronger correlation in the DSK modality than in the HMD case.
MS C was found to be the dominant class in all conditions (‘Task’*’Immersion level’), with non-significant modulations of its parameters throughout the protocol phases. Being usually associated with the DMN (or ‘task negative network’) a suppression of C activation could have been expected, as reported in [34,35,36,37,38]. However, recent contradictory findings suggested that class C may also reflect sensorial and arousal gating (salience network) in immersive reality, as speculated in [20], and its parameters were found unaltered by screen-based cognitive tasks [4,16,39,40]. In our case, C was stable in both environments under task difficulty, with significantly higher transitions between MS classes (from and to C). These results suggest a possible ‘hub’ role for the MS C in switching between brain states.
Mostly in line with previous knowledge, a consistent significant effect of the task factor was found in relation to MS D. Increases in duration, occurrence and coverage were found in T2, when the task demand is the highest, with respect to resting condition; a significant increase in coverage was detected also at the first level of the task (T1). These results further support the association of MS D, which presents a fronto-central topography, with the TAN and its subnetworks [13]. However, we did not find a significant effect of the “Immersion level” factor, suggesting that the modulation of the dynamic characteristics of MS D does not significantly depend on it.
While MS B, which is assumed to reflect visuo-spatial functions, was found not to be affected by either task or environmental factors, MS A, associated with auditory functions, showed significant modulations in terms of occurrence and coverage. Specifically, the effect of the “Task” factor resulted in a significant decrease in MS A occurrence for both immersion levels, suggesting a suppression of the auditory network activity, which is reasonable given that no audio stimulation was provided. Interestingly, MS A was also characterized by a significant ‘Task * Immersion level’ interaction, showing a reduction of coverage during T2 with respect to R and T1 for the DSK case and in both T1 and T2 with respect to R for the HMD case. This behavior may further suggest the deactivation of the auditory network, during visual stimuli [41], to let the brain better focus on cognitive efforts, specifically in the immersive environment. Finally, a significant interaction was found for MS E in terms of occurrence, which was decreased in T1 with respect to the resting condition for DSK, while a decrease was observed in T2 with respect to both T1 and R for HMD. Taken together, these results may suggest that, although the direct influence of the immersion level on MS dynamics was not significant, a possible effect may be hidden in more complex network dynamic patterns.
Given the previously discussed findings, we further explored the relation of MS D with attention and mental engagement. All the parameters of MS D were found weakly but significantly correlated with the attention index (AI), suggesting that an increase in the attention level was related to an increase in MS D occurrence, coverage and duration, thus with the activation of the TAN. Interestingly, correlations reached significance only in the DSK environment, showing an increasing trend as a function of the task difficulty, while in HMD non-significant weaker correlations were observed. This result is in line with findings from [3], suggesting that the HMD immersion level might reduce the mental workload and may lead to a less consistent modulation of the EEG-based attention index, at least in the current experimental protocol and setting.
Nevertheless, although MS dynamic parameters exhibited minimal environment-dependent modulations, evincing an effect comparable to that induced by immersion level, our study yielded intriguing insights into brain network dynamics that facilitate cognitive processes.
A limitation of the current work is that only one type of cognitive task has been investigated, potentially limiting the explored cognitive domain. Future research may further explore whether distinct cognitive domains are differently modulated by immersion levels.
5. Conclusion
This study successfully combined microstate (MS) analysis and VR technology to bridge the gap between cognitive load and immersion levels. The findings demonstrate that while task difficulty (specifically at higher levels) consistently modulates MS dynamics (particularly MS D, which is linked to attentional networks) the level of immersion (DSK vs. HMD) plays a more nuanced, indirect role. Immersion level did not drastically alter MS parameters directly, it influenced the correlation between MS D and attention indices, resulting in stronger correlations in the DSK environment, whereas the HMD appeared to mitigate mental workload, leading to a less consistent modulation of attention.
Overall, the research highlights that while the brain’s core attentional response to mental workload remains robust across immersion levels, immersion subtly reshapes the complex network interactions and attention levels underlying cognitive performance.
Supplementary Materials
The following supporting information can be downloaded at the website of this paper posted on Preprints.org, Table S1- DSK post-hoc, Table S2- HMD post-hoc,.
Author Contributions
Conceptualization: A.M., M.M., S.C., G.R. Data curation: A.M, M.M., G.R. Formal analysis: S.C., M. C. Investigation: M.M., S.C., M. C., A.M. Methodology: S.C., M.C. Project administration: A.M., G.R., A.M.B. Software: M. C. Resources: A.M., G.R., A.M.B. Supervision: A.M., G.R., A.M.B. Visualization: S.C., M. C. Writing – original draft: All authors. Writing – review & editing: All authors.
Funding
This research received no external funding.
Institutional Review Board Statement
The study was conducted in accordance with the Declaration of Helsinki, and approved by the ethics committee of the National Research Council of Italy (N°0013481/2022)[ 21.02.2022].
Informed Consent Statement
Informed consent was obtained from all subjects involved in the study.
Data Availability Statement
No new data have been generated for the current study. Raw EEG data used in this paper can be found at the following link: https://doi.org/10.17605/OSF.IO/C7M6Z.
Acknowledgments
M.M, G.R and A.M. kindly acknowledge Alessandra Tafaro for her continuous support and assistance.
Conflicts of Interest
The authors declare no conflicts of interest.
References
- Dehais, F.; Lafont, A.; Roy, R.; Fairclough, S. A Neuroergonomics Approach to Mental Workload, Engagement and Human Performance. Front. Neurosci. 2020, 14. [Google Scholar] [CrossRef] [PubMed]
- Matthews, G.; Warm, J.S.; Reinerman, L.E.; Langheim, L.K.; Saxby, D.J. Task Engagement, Attention, and Executive Control; 2010; pp. 205–230. [Google Scholar]
- Mondellini, M.; Pirovano, I.; Colombo, V.; Arlati, S.; Sacco, M.; Rizzo, G.; Mastropietro, A. A Multimodal Approach Exploiting EEG to Investigate the Effects of VR Environment on Mental Workload. Int. J. Hum. Comput. Interact. 2024, 40, 6566–6578. [Google Scholar] [CrossRef]
- Chen, J.; Ke, Y.; Ni, G.; Liu, S.; Ming, D. Evidence for Modulation of EEG Microstates by Mental Workload Levels and Task Types. Hum. Brain Mapp. 2024, 45. [Google Scholar] [CrossRef] [PubMed]
- Arlati, S.; Mondellini, M.; Rizzo, G.; Mastropietro, A. Evaluating Sense of Embodiment in Virtual Reality with EEG: A Scoping Review. Comput. Hum. Behav. Rep. 2025, 20, 100868. [Google Scholar] [CrossRef]
- Ma, H.; Zhao, J.; Hommel, B.; Ma, K. Virtual Reality Experience as Reflected in EEG Microstates. Brain Topogr. 2025, 38. [Google Scholar] [CrossRef] [PubMed]
- Chiossi, F.; Ou, C.; Gerhardt, C.; Putze, F.; Mayer, S. Designing and Evaluating an Adaptive Virtual Reality System Using EEG Frequencies to Balance Internal and External Attention States. Int. J. Hum. Comput. Stud. 2025, 196, 103433. [Google Scholar] [CrossRef]
- Salter, M. A Note on Presence Terminology. Presence-Connect 2003, 3, 1–5. [Google Scholar]
- Marcantoni, I.; Assogna, R.; Del Borrello, G.; Di Stefano, M.; Morano, M.; Romagnoli, S.; Leoni, C.; Bruschi, G.; Sbrollini, A.; Morettini, M.; et al. Ratio Indexes Based on Spectral Electroencephalographic Brainwaves for Assessment of Mental Involvement: A Systematic Review. Sensors 2023, 23, 5968. [Google Scholar] [CrossRef] [PubMed]
- Pascual-Marqui, R.D.; Michel, C.M.; Lehmann, D. Segmentation of Brain Electrical Activity into Microstates: Model Estimation and Validation; 1995; Vol. 42. [Google Scholar]
- Michel, C.M.; Koenig, T. EEG Microstates as a Tool for Studying the Temporal Dynamics of Whole-Brain Neuronal Networks: A Review. Neuroimage 2018, 180, 577–593. [Google Scholar] [CrossRef] [PubMed]
- Koenig, T.; Prichep, L.; Lehmann, D.; Sosa, P.V.; Braeker, E.; Kleinlogel, H.; Isenhart, R.; John, E.R. Millisecond by Millisecond, Year by Year: Normative EEG Microstates and Developmental Stages. Neuroimage 2002, 16, 41–48. [Google Scholar] [CrossRef] [PubMed]
- Custo, A.; Van De Ville, D.; Wells, W.M.; Tomescu, M.I.; Brunet, D.; Michel, C.M. Electroencephalographic Resting-State Networks: Source Localization of Microstates. Brain Connect. 2017, 7, 671–682. [Google Scholar] [CrossRef] [PubMed]
- Zanesco, A.P.; Denkova, E.; Jha, A.P. Associations between Self-Reported Spontaneous Thought and Temporal Sequences of EEG Microstates. Brain Cogn. 2021, 150. [Google Scholar] [CrossRef] [PubMed]
- Zappasodi, F.; Perrucci, M.G.; Saggino, A.; Croce, P.; Mercuri, P.; Romanelli, R.; Colom, R.; Ebisch, S.J.H. EEG Microstates Distinguish between Cognitive Components of Fluid Reasoning. Neuroimage 2019, 189, 560–573. [Google Scholar] [CrossRef] [PubMed]
- Li, W.; Cheng, S.; Dai, J.; Chang, Y. Effects of Mental Workload Manipulation on Electroencephalography Spectrum Oscillation and Microstates in Multitasking Environments. Brain Behav. 2025, 15. [Google Scholar] [CrossRef] [PubMed]
- Zhao, R.; Liu, M.; Zhou, P.; Guan, Y.; Han, L. Mental Fatigue Modulates EEG Microstate Dynamics during Simulated Flight with Varying Task Demands. Behav. Brain Res. 2026, 499, 115946. [Google Scholar] [CrossRef] [PubMed]
- Bai, Y.; Yu, M.; Li, Y. Dynamic Neural Patterns of Human Emotions in Virtual Reality: Insights from EEG Microstate Analysis. Brain Sci. 2024, 14. [Google Scholar] [CrossRef] [PubMed]
- Hua, W.; Li, Y. Electroencephalography Based Microstate Functional Connectivity Analysis in Emotional Cognitive Reappraisal Combined with Happy Music. Brain Sci. 2023, 13, 554. [Google Scholar] [CrossRef] [PubMed]
- Gelormini, C.; Guerrini, L.; Pescaglia, F.; Aubonnet, R.; Jónsson, H., Jr.; Petersen, H.; Di Lorenzo, G.; Gargiulo, P. Assessing Brain Network Dynamics During Postural Control Task Using EEG Microstates. Brain Topogr. 2025, 38, 47. [Google Scholar] [CrossRef] [PubMed]
- Mastropietro, A., M.M., P.I., & R.G. A Multimodal Approach Exploiting EEG to Investigate the Effects of VR Environment on Mental Workload - DATASET. OSF 2023. [CrossRef]
- Colombo, V.; Mondellini, M.; Fumagalli, A.; Aliverti, A.; Sacco, M. A Virtual Reality-Based Endurance Training Program for COPD Patients: Acceptability and User Experience. Disabil. Rehabil. Assist. Technol. 2024, 19, 1590–1599. [Google Scholar] [CrossRef] [PubMed]
- Mastropietro, A.; Pirovano, I.; Marciano, A.; Porcelli, S.; Rizzo, G. Reliability of Mental Workload Index Assessed by EEG with Different Electrode Configurations and Signal Pre-Processing Pipelines. Sensors 2023, 23. [Google Scholar] [CrossRef] [PubMed]
- Kothe, C.; Jung, T.-P. Artifact Removal Techniques with Signal Reconstruction. 2016. [Google Scholar] [CrossRef]
- Chang, C.-Y.; Hsu, S.-H.; Pion-Tonachini, L.; Jung, T.-P. Evaluation of Artifact Subspace Reconstruction for Automatic Artifact Components Removal in Multi-Channel EEG Recordings. IEEE Trans. Biomed. Eng. 2020, 67, 1114–1121. [Google Scholar] [CrossRef] [PubMed]
- Pion-Tonachini, L.; Kreutz-Delgado, K.; Makeig, S. ICLabel: An Automated Electroencephalographic Independent Component Classifier, Dataset, and Website. Neuroimage 2019, 198, 181–197. [Google Scholar] [CrossRef] [PubMed]
- Nagabhushan Kalburgi, S.; Kleinert, T.; Aryan, D.; Nash, K.; Schiller, B.; Koenig, T. MICROSTATELAB: The EEGLAB Toolbox for Resting-State Microstate Analysis. Brain Topogr. 2024, 37, 621–645. [Google Scholar] [CrossRef] [PubMed]
- Kleinert, T.; Koenig, T.; Nash, K.; Wascher, E. On the Reliability of the EEG Microstate Approach. Brain Topogr. 2024, 37, 271–286. [Google Scholar] [CrossRef] [PubMed]
- Koenig, T.; Diezig, S.; Kalburgi, S.N.; Antonova, E.; Artoni, F.; Brechet, L.; Britz, J.; Croce, P.; Custo, A.; Damborská, A.; et al. EEG-Meta-Microstates: Towards a More Objective Use of Resting-State EEG Microstate Findings Across Studies. Brain Topogr. 2024, 37, 218–231. [Google Scholar] [CrossRef] [PubMed]
- Artoni, F.; Michel, C.M. How Does Independent Component Analysis Preprocessing Affect EEG Microstates? Brain Topogr. 2025, 38. [Google Scholar] [CrossRef] [PubMed]
- Coelli, S.; Barbieri, R.; Reni, G.; Zucca, C.; Bianchi, A.M. EEG Indices Correlate with Sustained Attention Performance in Patients Affected by Diffuse Axonal Injury. Med. Biol. Eng. Comput. 2018, 56, 991–1001. [Google Scholar] [CrossRef] [PubMed]
- Bjegojević, B.; Pušica, M.; Gianini, G.; Gligorijević, I.; Cromie, S.; Leva, M.C. Neuroergonomic Attention Assessment in Safety-Critical Tasks: EEG Indices and Subjective Metrics Validation in a Novel Task-Embedded Reaction Time Paradigm. Brain Sci. 2024, 14. [Google Scholar] [CrossRef] [PubMed]
- Vallat, R. Pingouin: Statistics in Python. J. Open Source Softw. 2018, 3, 1026. [Google Scholar] [CrossRef]
- Seitzman, B.A.; Abell, M.; Bartley, S.C.; Erickson, M.A.; Bolbecker, A.R.; Hetrick, W.P. Cognitive Manipulation of Brain Electric Microstates. Neuroimage 2017, 146, 533–543. [Google Scholar] [CrossRef] [PubMed]
- Kim, K.; Duc, N.T.; Choi, M.; Lee, B. EEG Microstate Features According to Performance on a Mental Arithmetic Task. Sci. Rep. 2021, 11, 343. [Google Scholar] [CrossRef] [PubMed]
- Guan, K.; Zhang, Z.; Chai, X.; Tian, Z.; Liu, T.; Niu, H. EEG Based Dynamic Functional Connectivity Analysis in Mental Workload Tasks With Different Types of Information. IEEE Trans. Neural Syst. Rehabil. Eng. 2022, 30, 632–642. [Google Scholar] [CrossRef] [PubMed]
- Barzon, G.; Ambrosini, E.; Vallesi, A.; Suweis, S. EEG Microstate Transition Cost Correlates with Task Demands. PLoS Comput. Biol. 2024, 20, e1012521. [Google Scholar] [CrossRef] [PubMed]
- Milz, P.; Faber, P.L.; Lehmann, D.; Koenig, T.; Kochi, K.; Pascual-Marqui, R.D. The Functional Significance of EEG Microstates—Associations with Modalities of Thinking. Neuroimage 2016, 125, 643–656. [Google Scholar] [CrossRef] [PubMed]
- Li, W.; Cheng, S.; Wang, H.; Chang, Y. EEG Microstate Changes According to Mental Fatigue Induced by Aircraft Piloting Simulation: An Exploratory Study. Behav. Brain Res. 2023, 438, 114203. [Google Scholar] [CrossRef] [PubMed]
- Ma, S.; Yan, X.; Billington, J.; Merat, N.; Markkula, G. Cognitive Load during Driving: EEG Microstate Metrics Are Sensitive to Task Difficulty and Predict Safety Outcomes. Accid. Anal. Prev. 2024, 207, 107769. [Google Scholar] [CrossRef] [PubMed]
- Laurienti, P.J.; Burdette, J.H.; Wallace, M.T.; Yen, Y.-F.; Field, A.S.; Stein, B.E. Deactivation of Sensory-Specific Cortex by Cross-Modal Stimuli. J. Cogn. Neurosci. 2002, 14, 420–429. [Google Scholar] [CrossRef] [PubMed]
Figure 1.
Scheme of the microstate EEG analysis procedure.
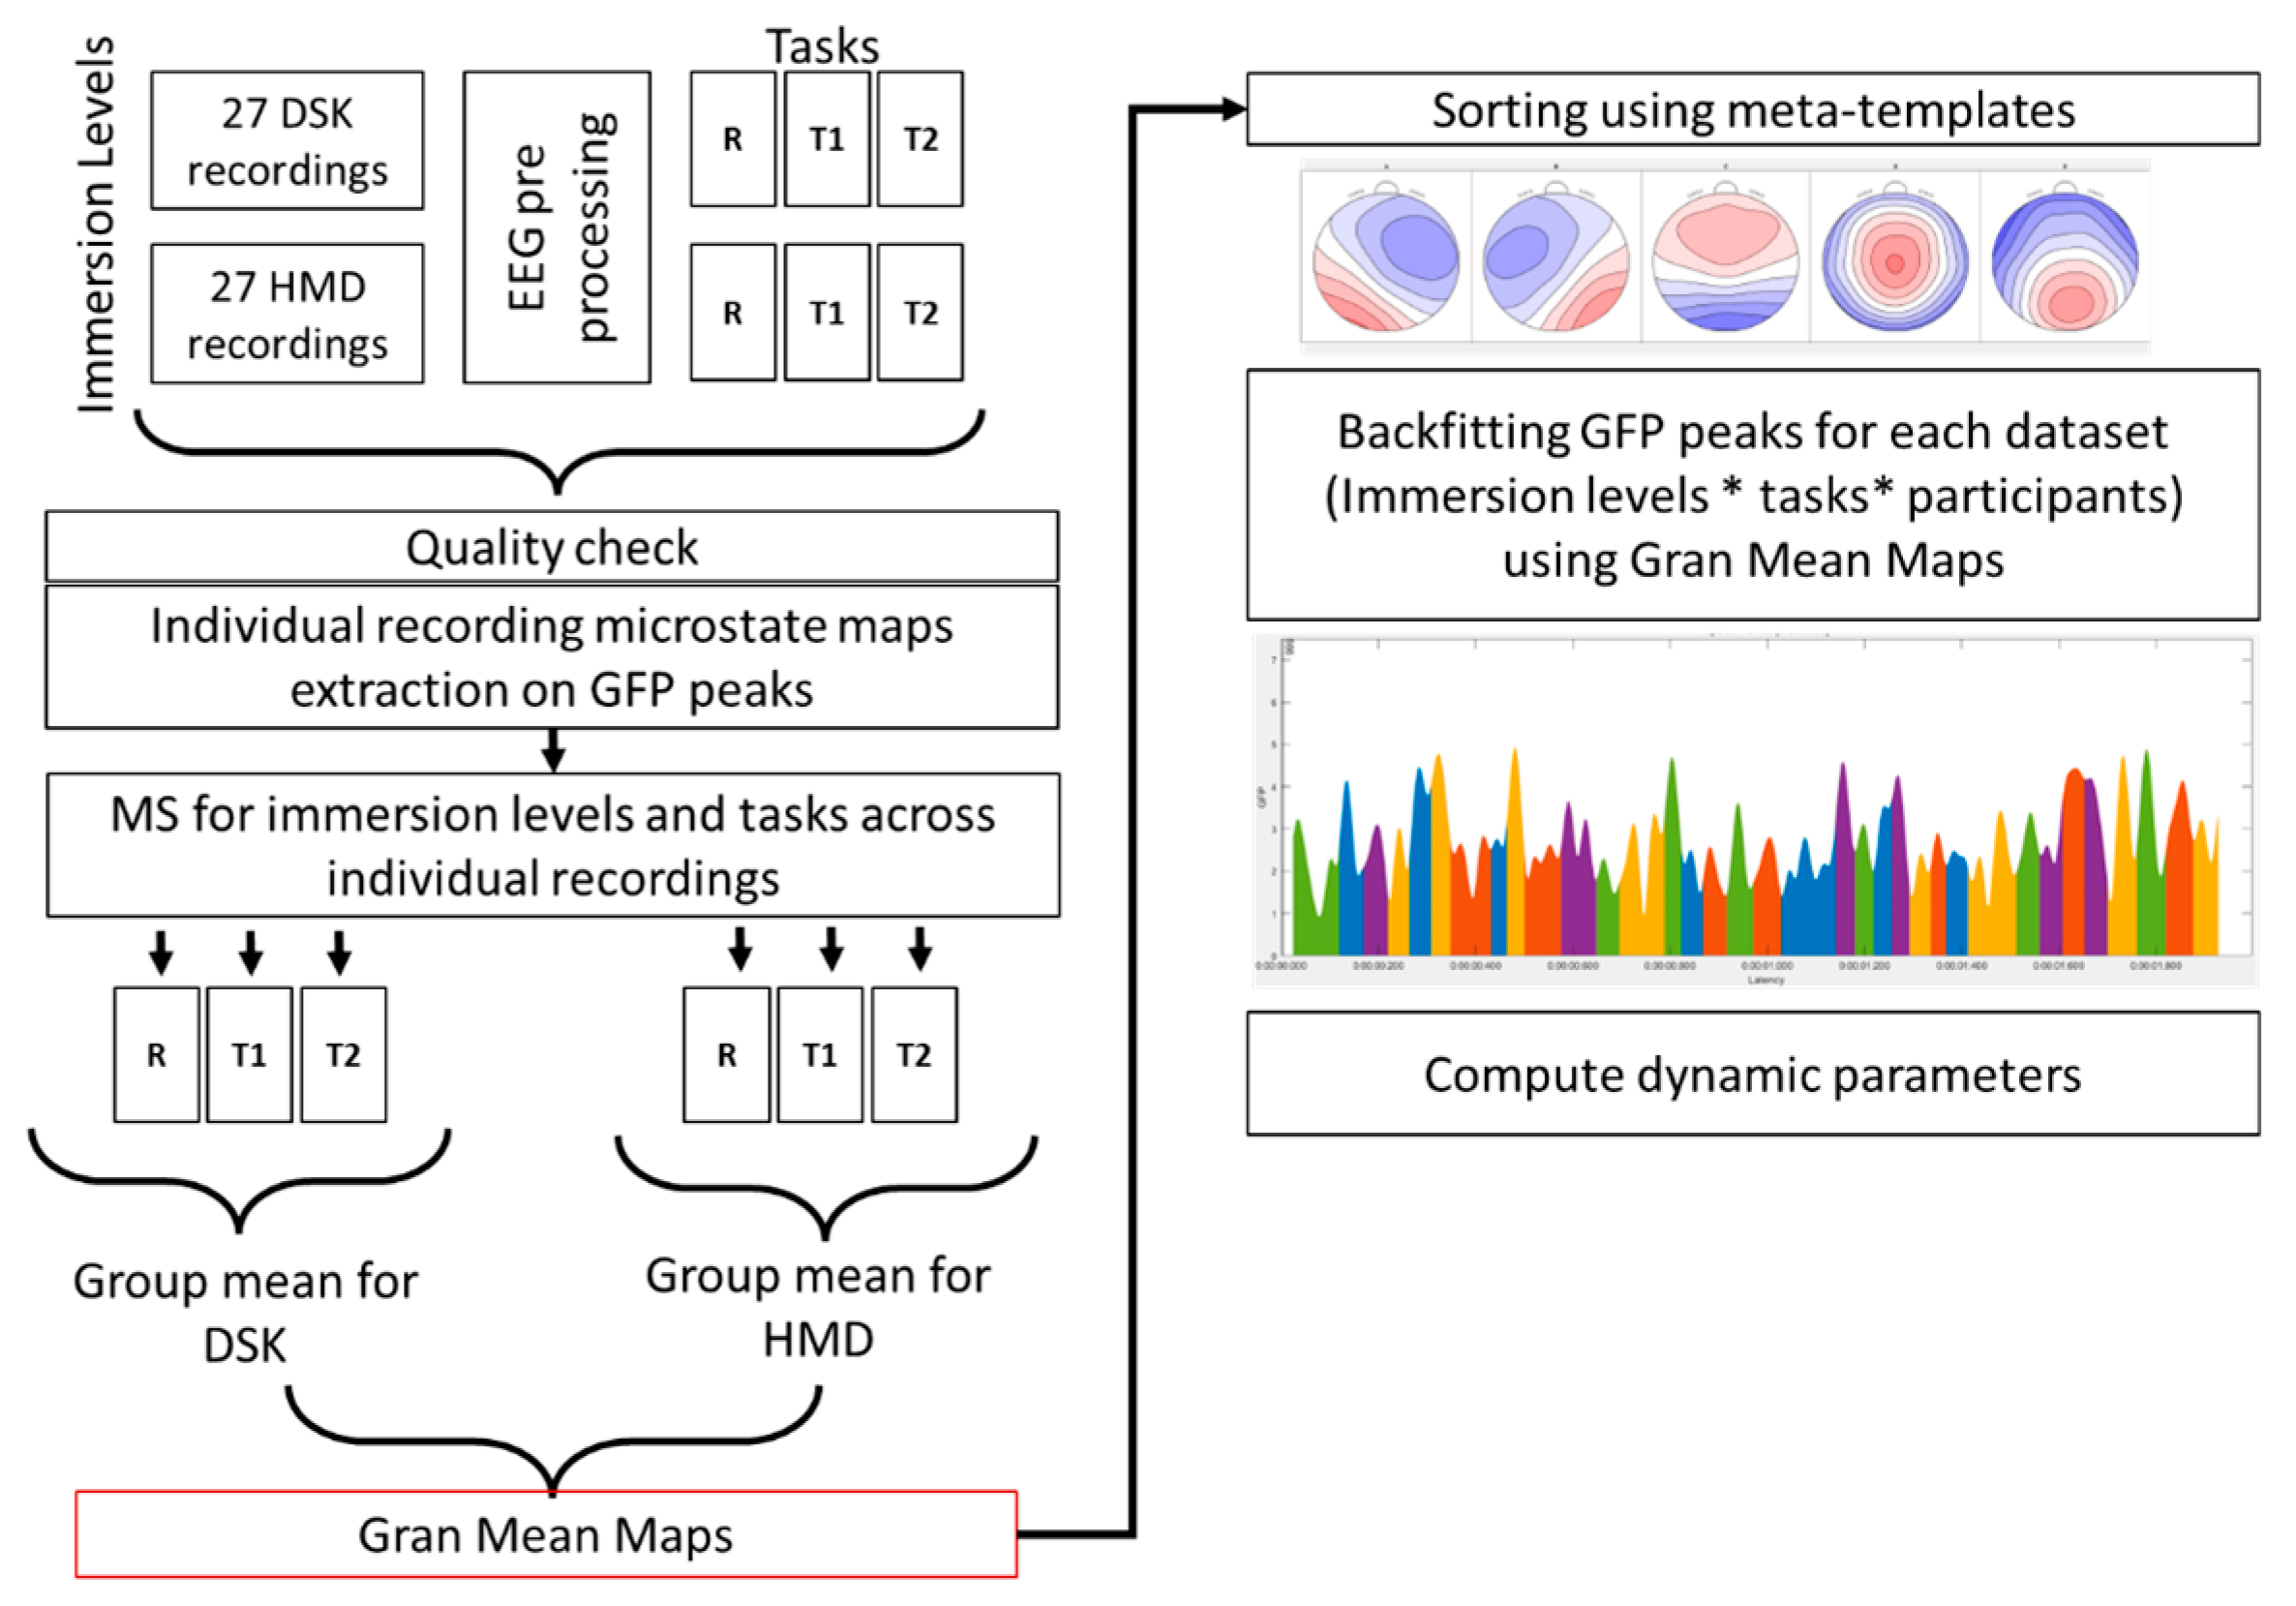
Figure 2.
GMMs, DSK Mean Maps and HMD Mean Maps obtained for each MS class. The bottom row shows the meta-maps from the literature.
Figure 2.
GMMs, DSK Mean Maps and HMD Mean Maps obtained for each MS class. The bottom row shows the meta-maps from the literature.
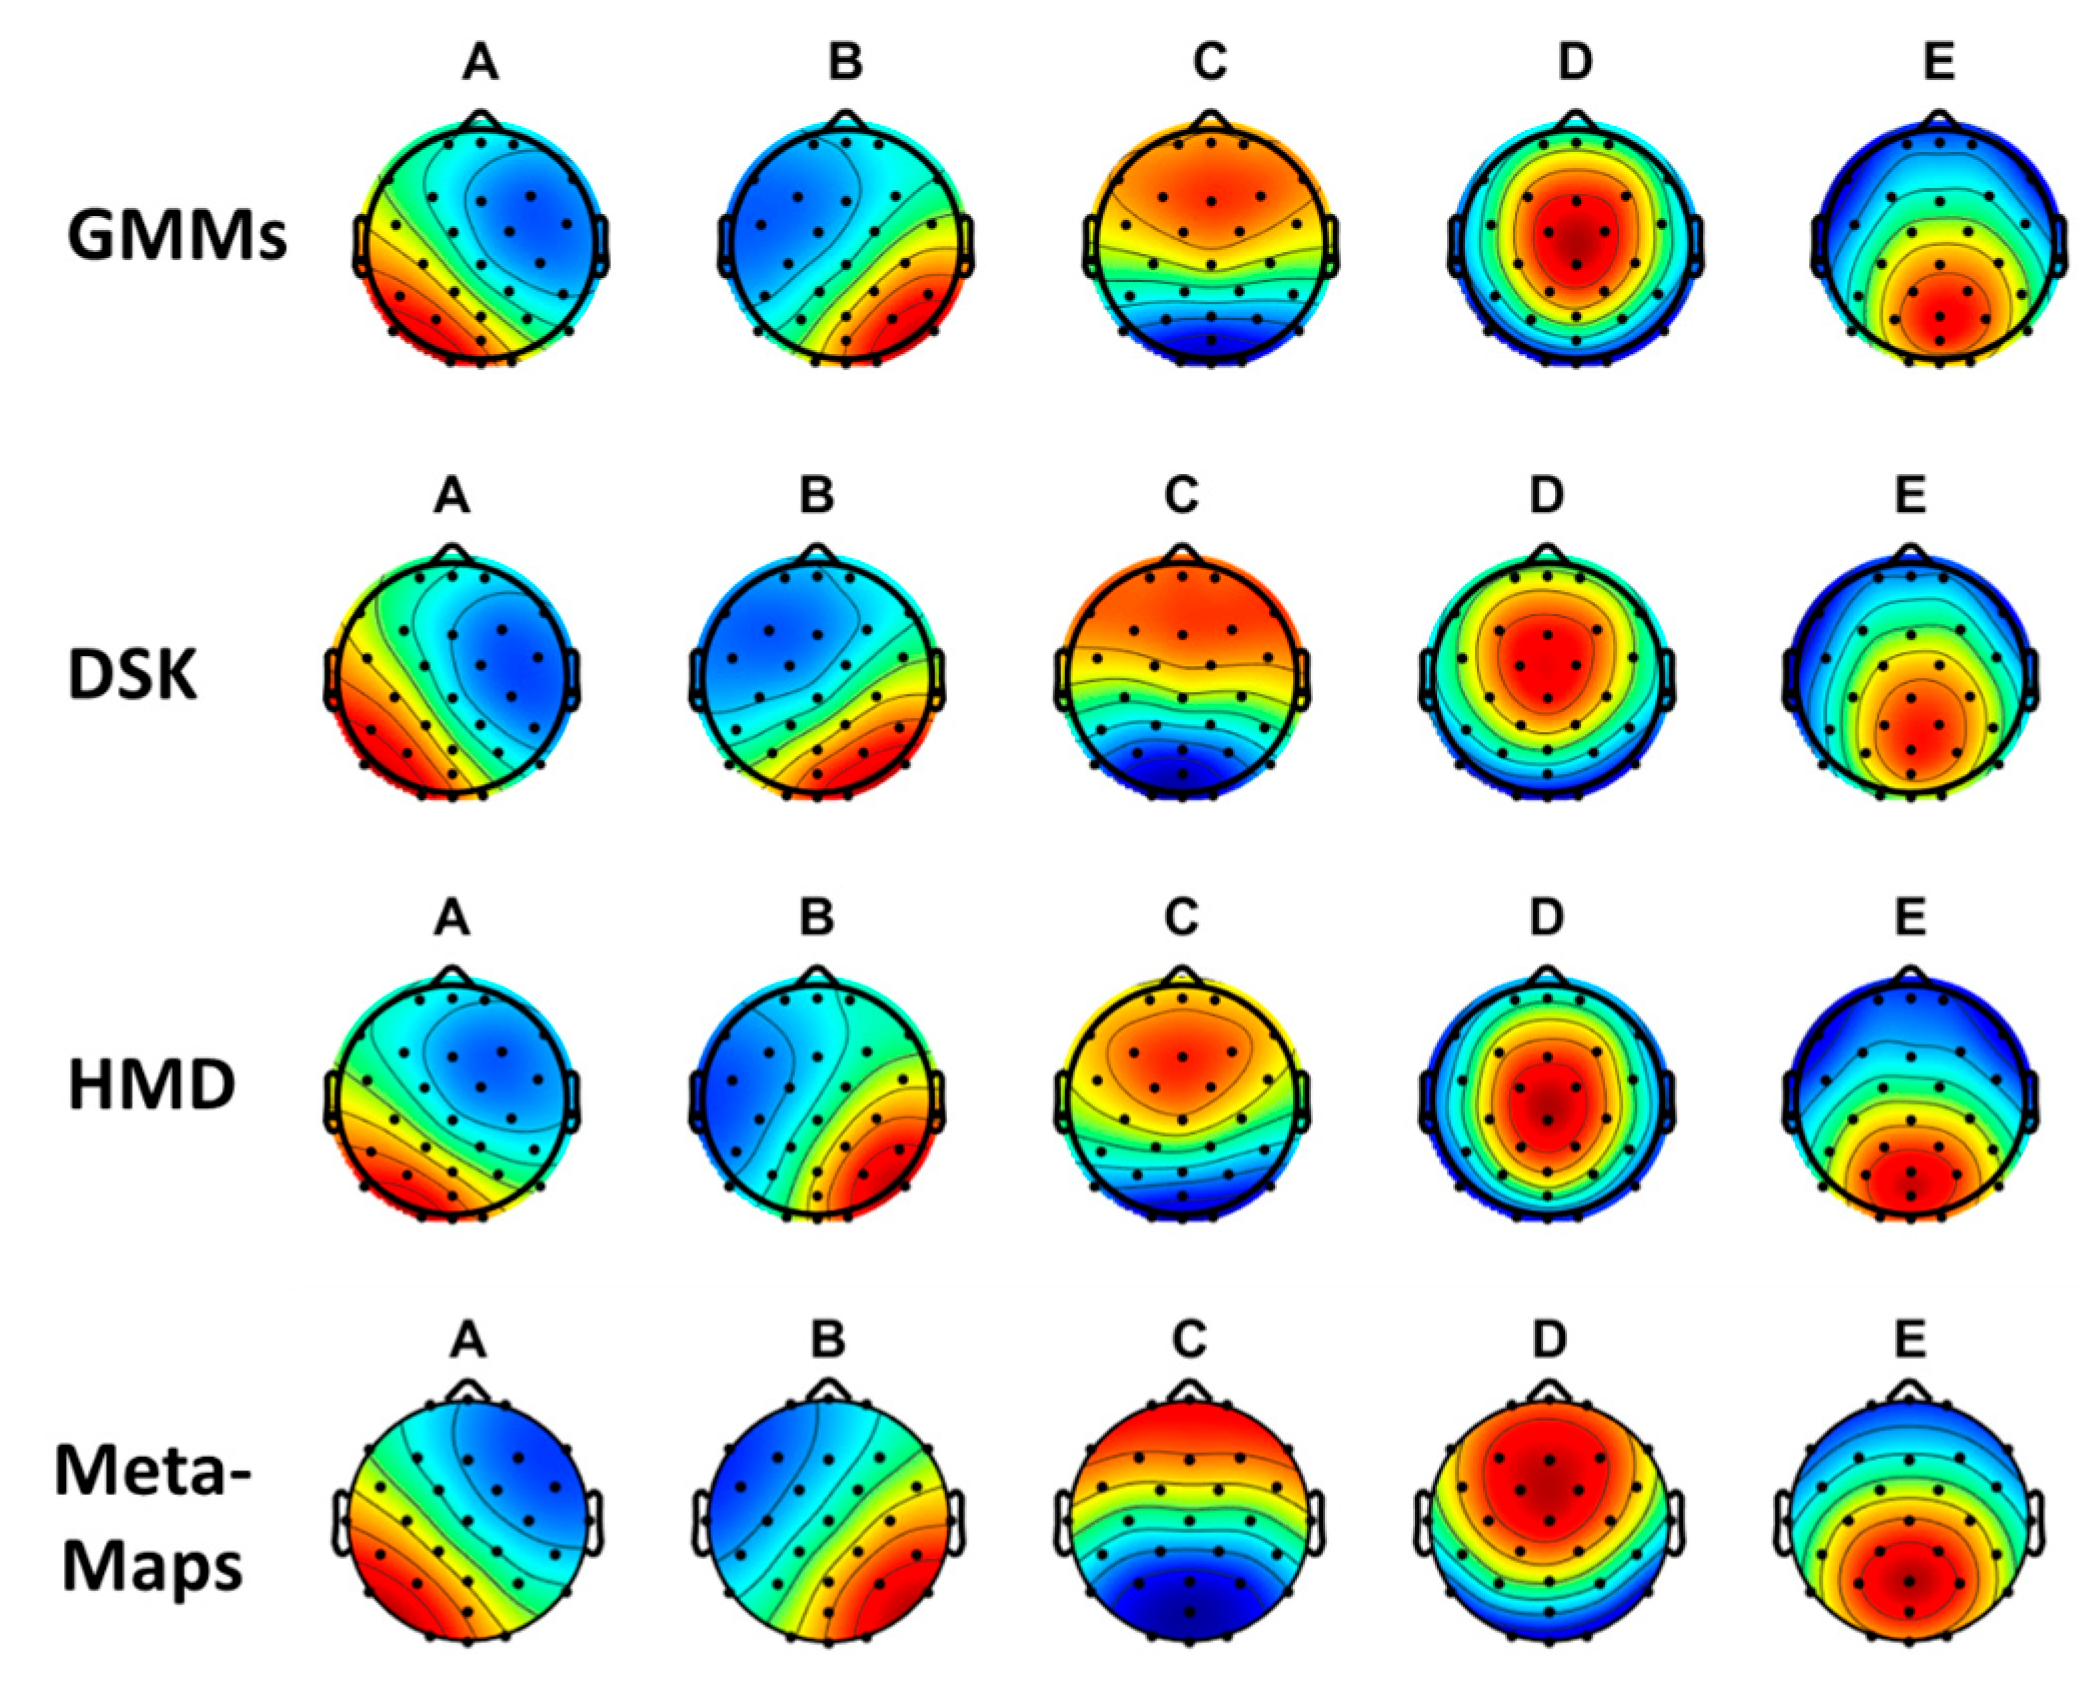
Figure 3.
Mean and distributions of Mean Duration (a), Mean Coverage (b) and Mean Occurrence (c) for each MS class, comparing the immersion levels (DSK vs HMD), and tasks (R, T1, T2). # indicates the presence of a significant ‘Task’ x ‘Immersion level’ interaction, * indicates that only the main factor ‘Task’ was significant. Black solid lines indicate significant differences between pairs of tasks considering the simple effect of the main factor ‘Task’, blue dotted lines indicate significant differences between pairs of tasks when the level of immersion is DSK, and orange dotted lines indicate significant differences between pairs of tasks when the level of immersion is HDM.
Figure 3.
Mean and distributions of Mean Duration (a), Mean Coverage (b) and Mean Occurrence (c) for each MS class, comparing the immersion levels (DSK vs HMD), and tasks (R, T1, T2). # indicates the presence of a significant ‘Task’ x ‘Immersion level’ interaction, * indicates that only the main factor ‘Task’ was significant. Black solid lines indicate significant differences between pairs of tasks considering the simple effect of the main factor ‘Task’, blue dotted lines indicate significant differences between pairs of tasks when the level of immersion is DSK, and orange dotted lines indicate significant differences between pairs of tasks when the level of immersion is HDM.
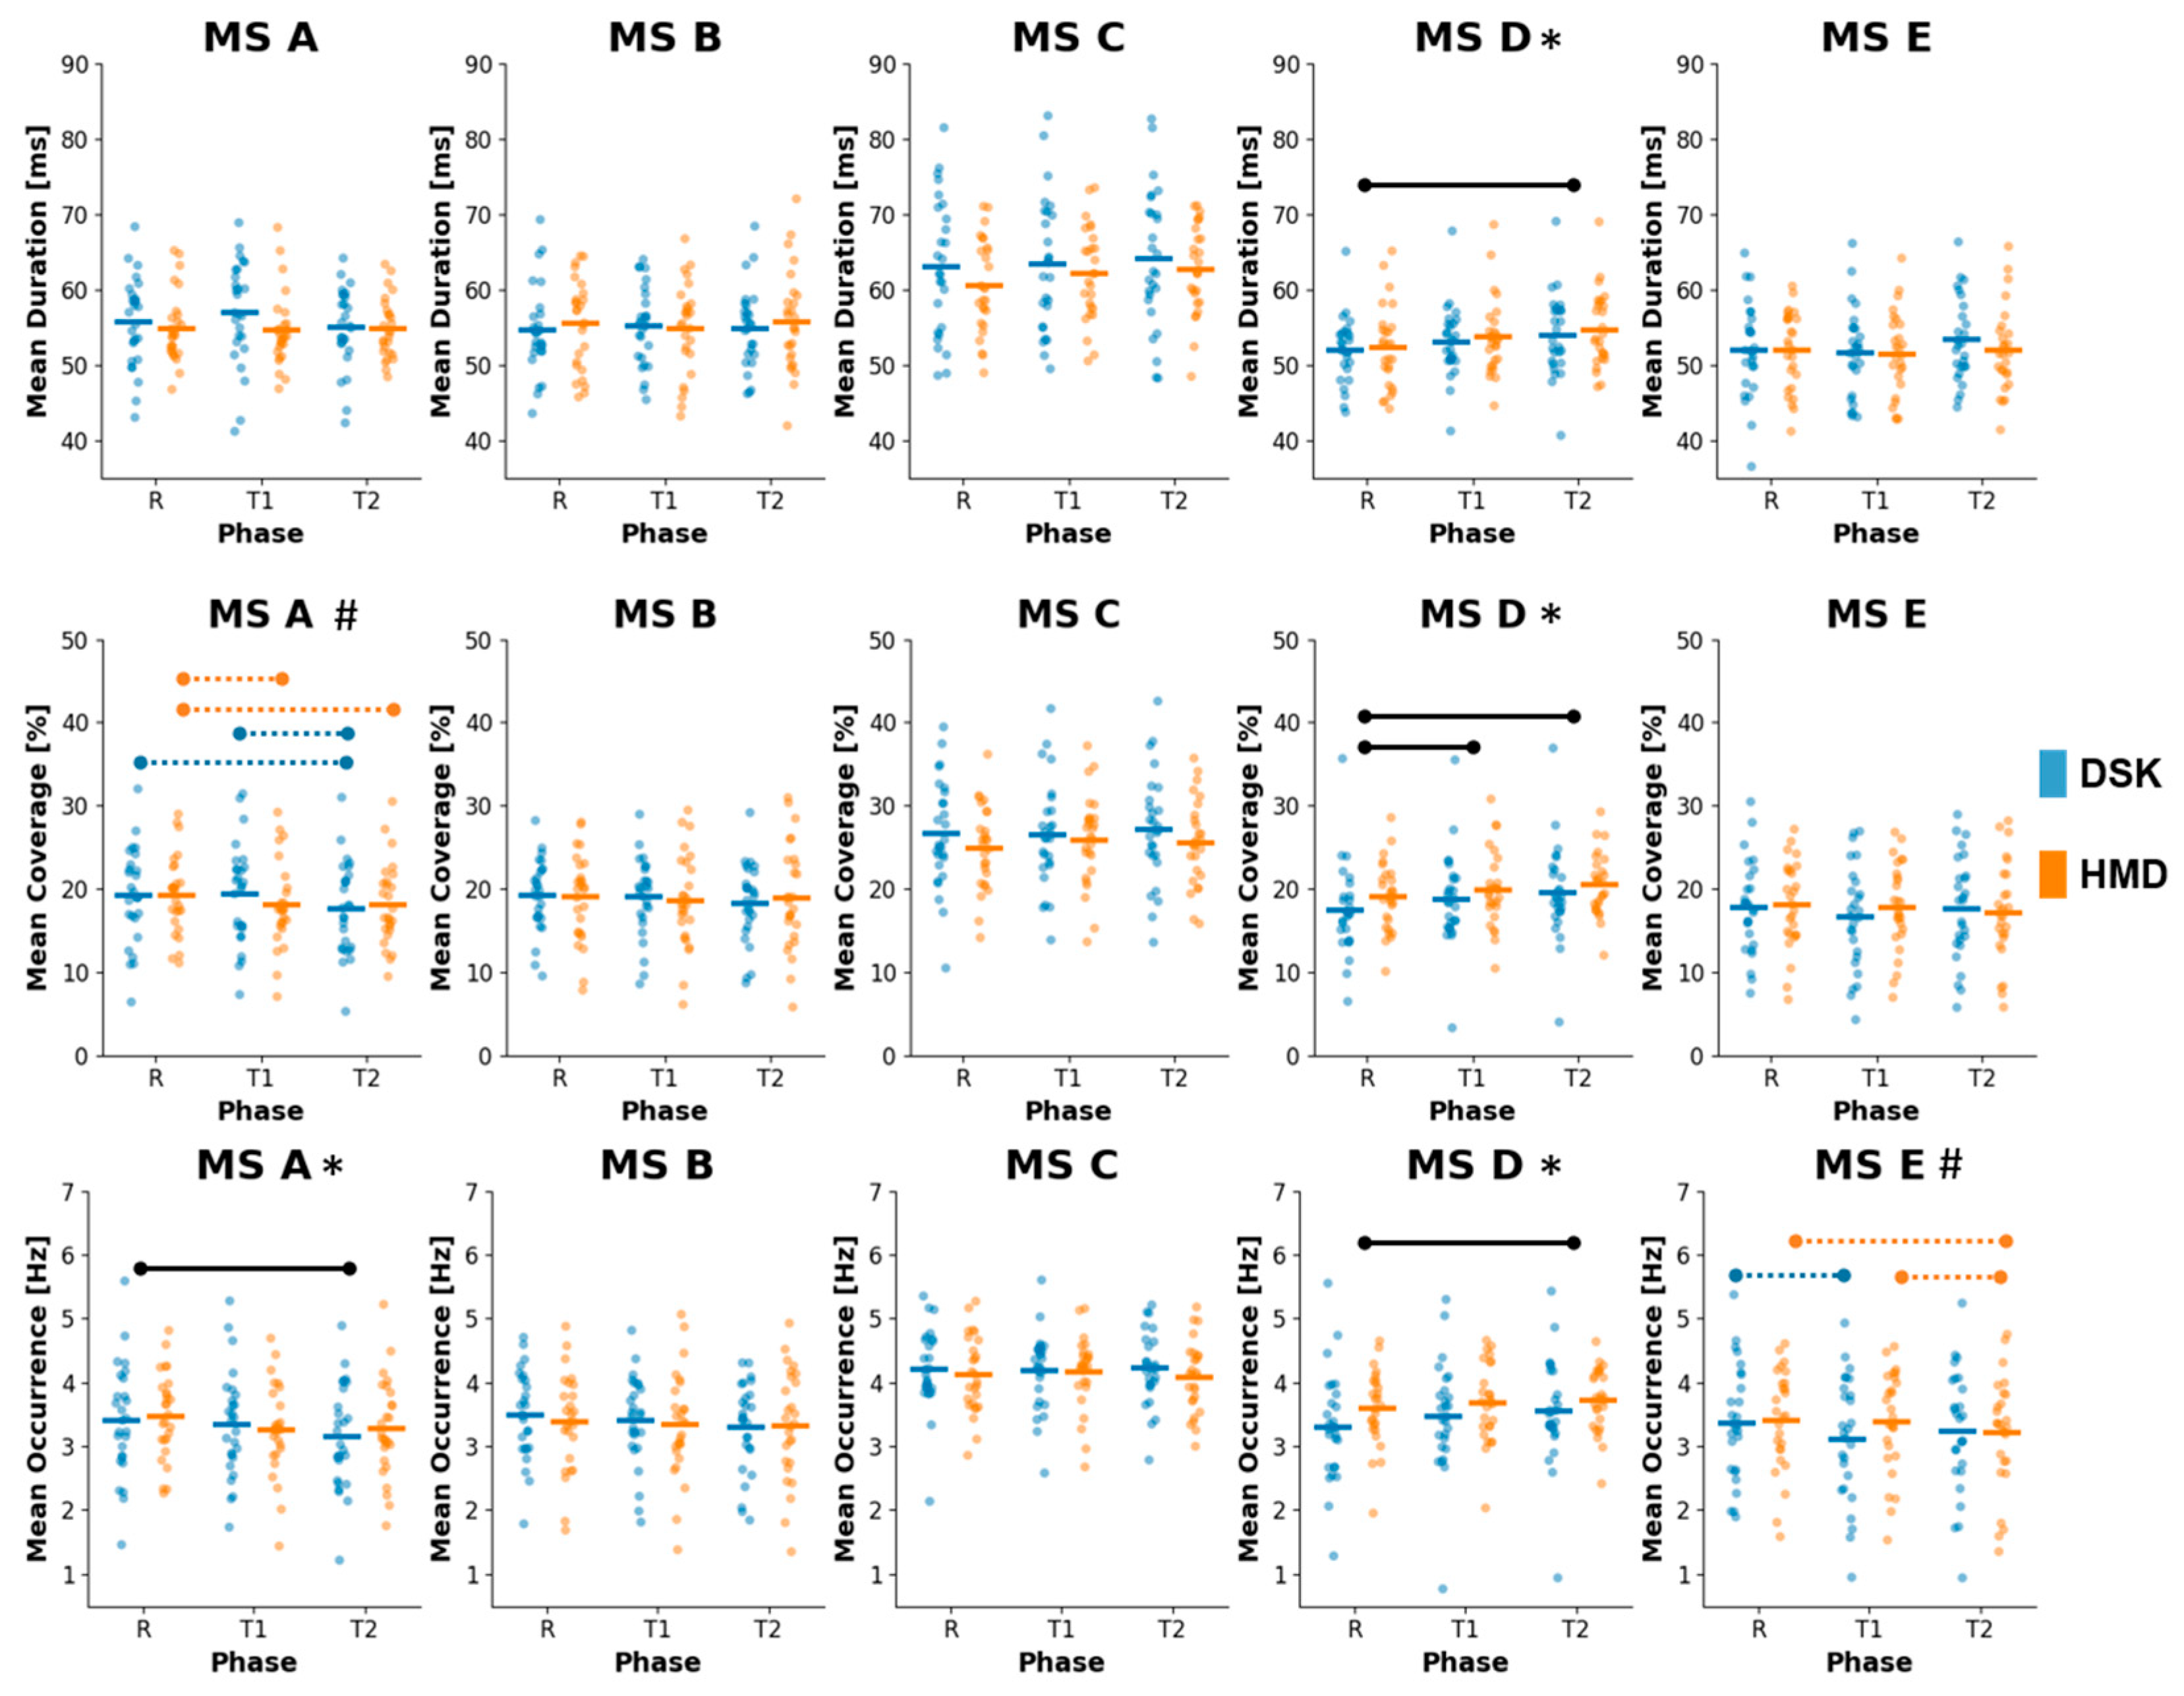
Figure 4.
Heat-maps of the transition probabilities for the two levels of immersion, a) DSK and b) HDM and tasks (R, T1 and T2).
Figure 4.
Heat-maps of the transition probabilities for the two levels of immersion, a) DSK and b) HDM and tasks (R, T1 and T2).
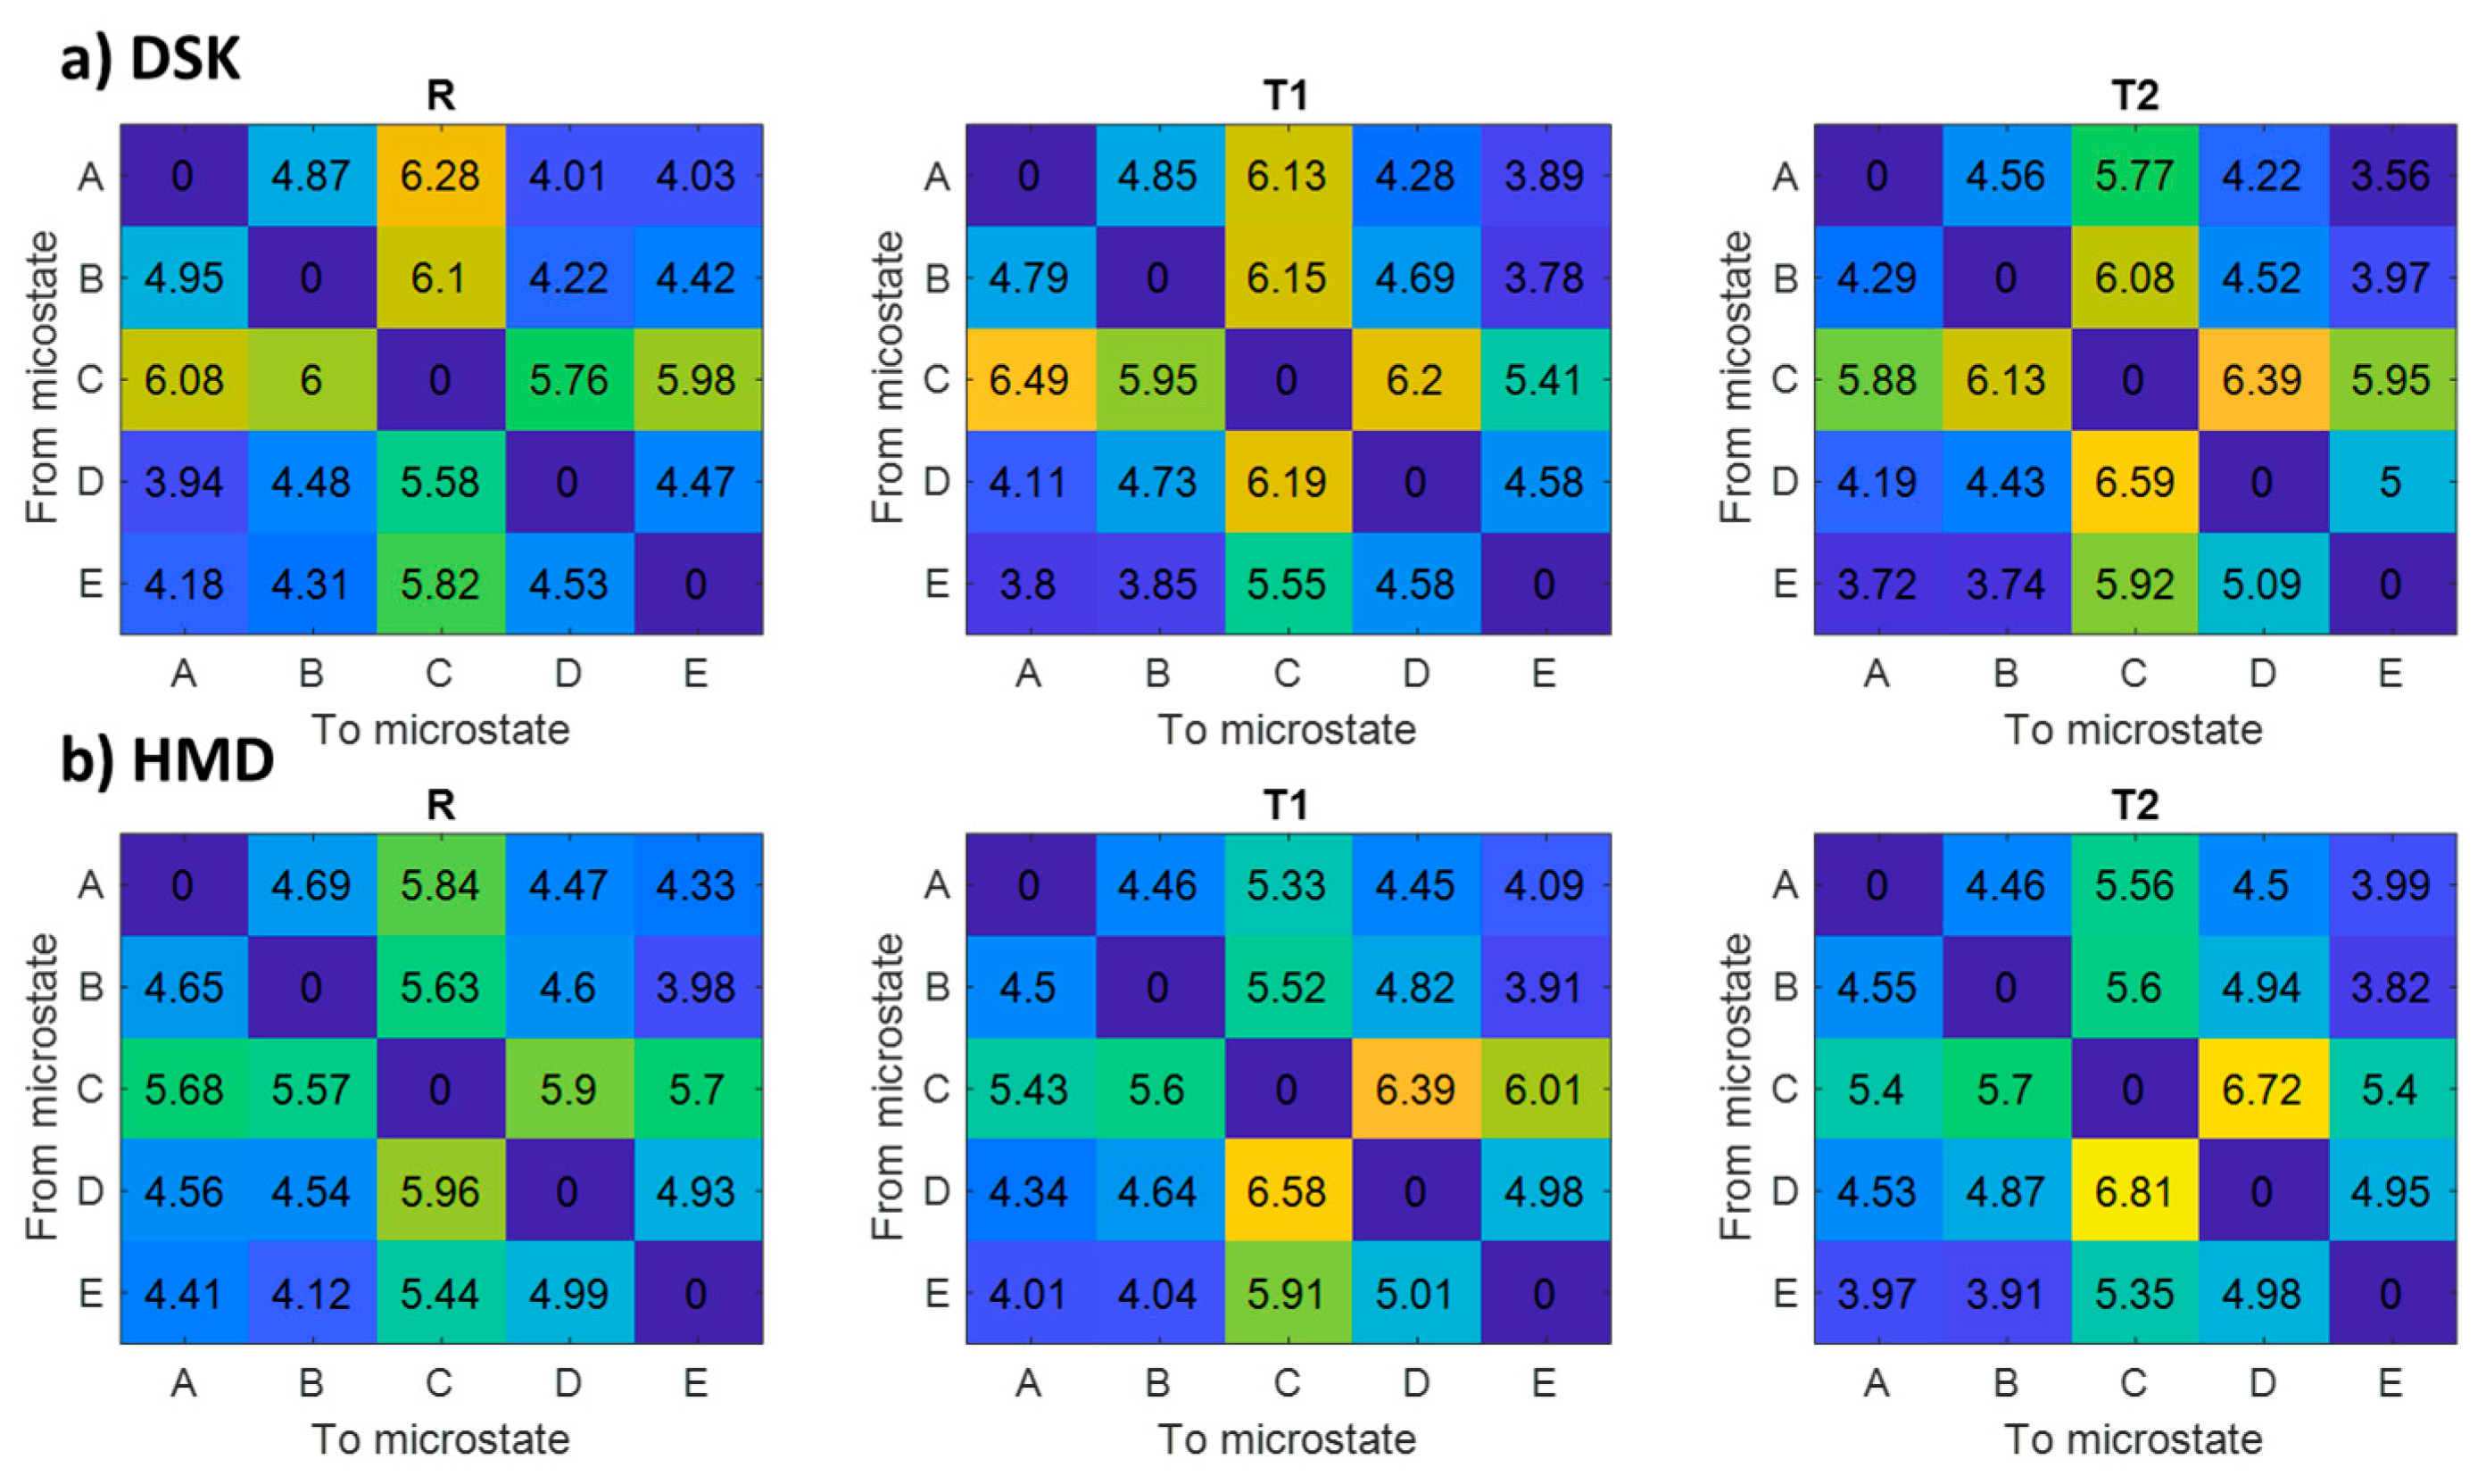
Figure 5.
Mean and standard deviation of Engagement (EI) and attention (AI) indices for the two immersion levels (DSK and HDM) and tasks (R, T1, and T2).
Figure 5.
Mean and standard deviation of Engagement (EI) and attention (AI) indices for the two immersion levels (DSK and HDM) and tasks (R, T1, and T2).
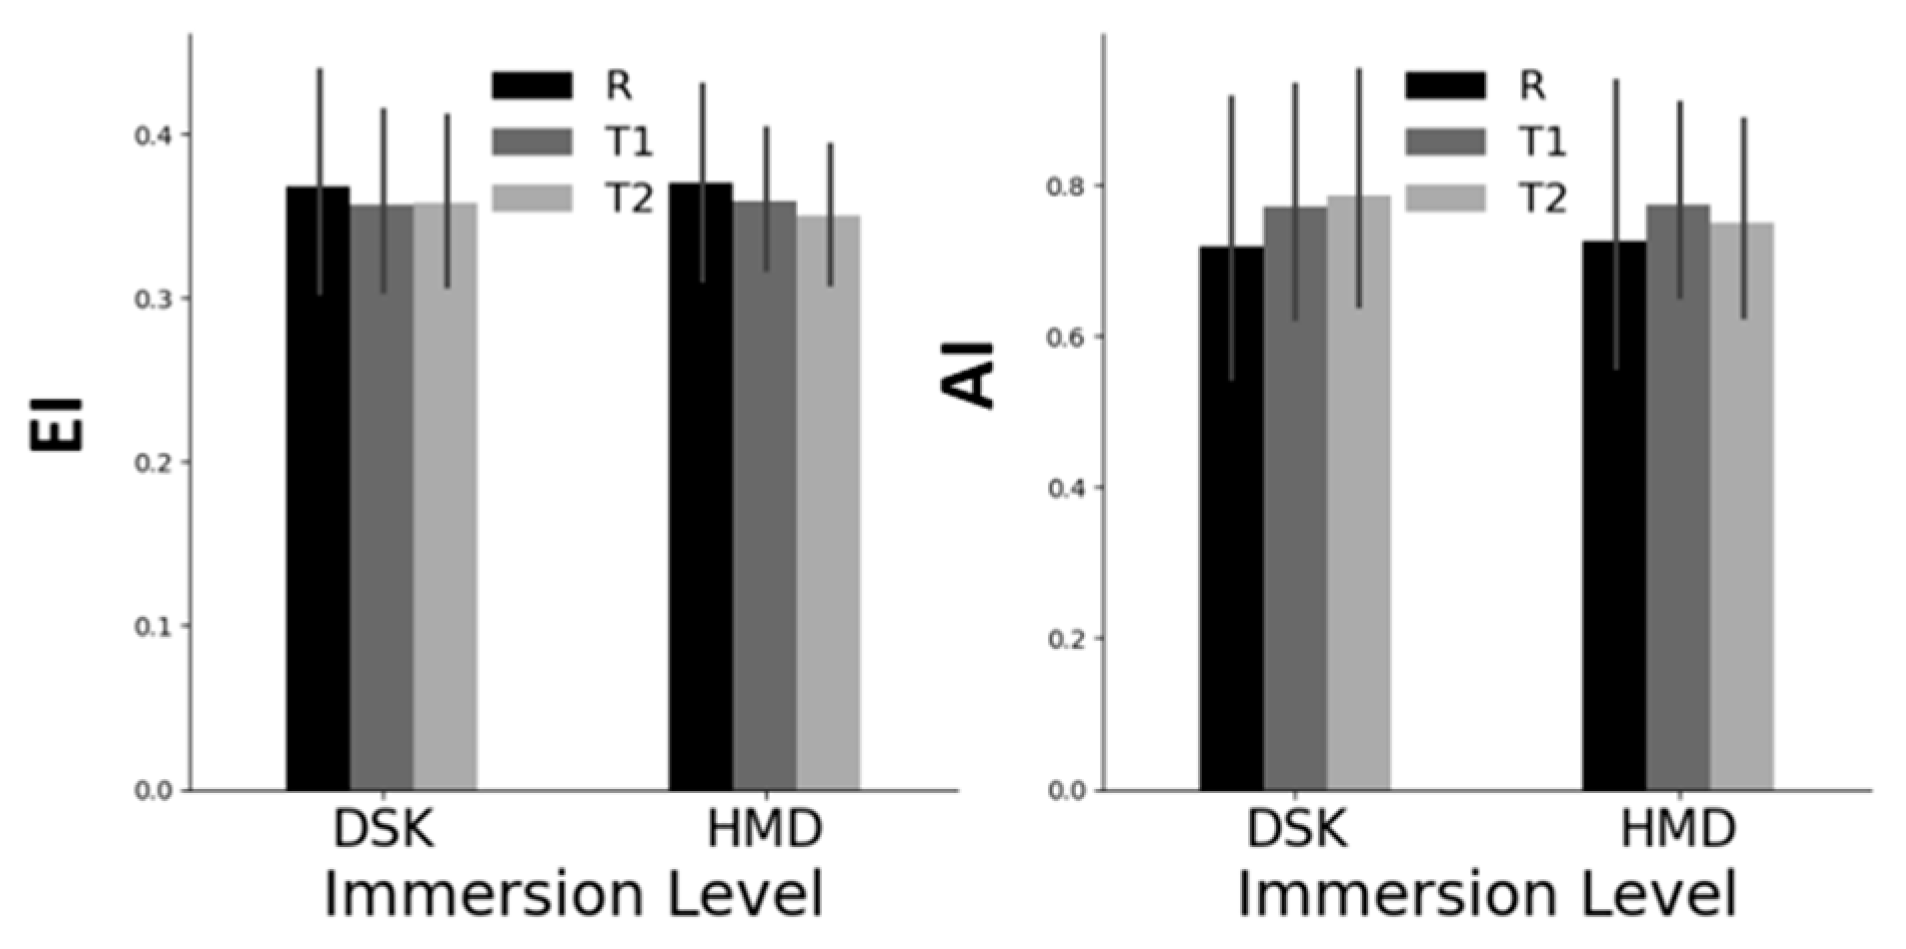
Figure 6.
Repeated measures correlation of dynamic MS parameters with BA index in the DSK environment (a) and HMD (b). Each color and line represents a different participant. Significant correlations are reported in terms of the coefficient correlation r.
Figure 6.
Repeated measures correlation of dynamic MS parameters with BA index in the DSK environment (a) and HMD (b). Each color and line represents a different participant. Significant correlations are reported in terms of the coefficient correlation r.
Disclaimer/Publisher’s Note: The statements, opinions and data contained in all publications are solely those of the individual author(s) and contributor(s) and not of MDPI and/or the editor(s). MDPI and/or the editor(s) disclaim responsibility for any injury to people or property resulting from any ideas, methods, instructions or products referred to in the content. |
© 2026 by the authors. Licensee MDPI, Basel, Switzerland. This article is an open access article distributed under the terms and conditions of the Creative Commons Attribution (CC BY) license (http://creativecommons.org/licenses/by/4.0/).
Copyright: This open access article is published under a Creative Commons CC BY 4.0 license, which permit the free download, distribution, and reuse, provided that the author and preprint are cited in any reuse.