

Submitted:
22 October 2026
Posted:
23 October 2026
You are already at the latest version
Abstract
Short-lived Kubernetes workloads can terminate before investigators acquire evidence, leaving reconstruction dependent on telemetry retained by other components. How consistently that telemetry is retained as workloads scale, and whether count-based retention measurements can be trusted, remain poorly characterized. We analyzed 180 scripted trial attempts on a single-node kind cluster that collected Kubernetes Event objects, Istio control-plane logs, node packet captures, and eBPF/Tetragon process events. At 100 replicas, the volume of orchestration-event records and control-plane log lines fell to about two-thirds and three-quarters of matched no-attack baselines, with lower run-to-run stability than at 4 or 50 replicas. All ten four-collector trials at 100 replicas failed under host memory pressure. A trial-level audit of the released raw data showed that the credential-access and stress actions were not recorded in any run, that the in-pod deletion action was recorded only at the smallest scale, and that most orchestration-event records in some conditions were carry-over from earlier trials. We report those scenarios as inconclusive and quantify how these measurement-pipeline effects change retention estimates. The findings apply to the evaluated single-node configuration.
Keywords:
Kubernetes forensics
; post-termination evidence
; telemetry retention
; forensic readiness
; Kubernetes Events
; eBPF
; measurement validity
; incident reconstruction
1. Introduction
1.1. Motivation and Research Problem
Containers in a Kubernetes cluster are often created and destroyed within seconds. When such a workload is part of an incident, its pod, writable filesystem, and process state may be gone before an investigator begins acquisition, and traditional digital forensics and incident response (DFIR) assumptions of persistent artifacts no longer hold [1,2]. Reconstruction then depends on records kept elsewhere: orchestration events in the API server, logs from the service-mesh control plane, packets observed on the node, and process events recorded by kernel instrumentation. A record must be generated, observed by a collector, written, and retained before it is available after termination, and its availability says nothing by itself about whether it is complete or stable across repetitions of the same incident.
Objective. To quantify the retention and run-to-run stability of four Kubernetes telemetry sources in a controlled single-node cluster, and to determine which properties of the measurement pipeline must be controlled for such quantities to support forensic conclusions. The study addresses four research questions, using the metrics defined in Section 4: completeness C, volume ratio R, retention under Scenario B S, and count stability D.
- RQ1 (Scale; Scenario A). How does the number of workload replicas (4, 50, 100) relate to R and D of Kubernetes Event and Istio control-plane telemetry during a discovery probe?
- RQ2 (Adversarial conditions; Scenarios B–D). Do the captured streams show that the scripted deletion, credential-access, and stress actions executed, and what R, S, D, and C were observed under those conditions?
- RQ3 (Capacity; Scenario B at 100 replicas). Does concurrent four-collector capture complete, and what evidence of failure remains?
- RQ4 (Measurement validity; all scenarios). How do carry-over between trials, capture truncation, cross-source aggregation, and ratio clipping change R, D, and C?
Table 1 maps scenarios to RQs; RQ2 and RQ4 were sharpened during revision after a re-analysis of the released data.
Approach. We instrumented a single-node kind cluster with four collectors and executed 180 trial attempts: 60 baseline trials, 110 completed adversarial trials analyzed quantitatively, and 10 capacity-failure trials analyzed as evidence of a collection limit. Each scenario–scale cell was repeated ten times, and every metric was computed per source, scenario, and scale against a matched baseline. A re-analysis of the released raw streams then checked, for every run, whether the scripted action was recorded and which records belonged to the run, and quantified how the measurement pipeline shaped the reported values.
1.2. Contributions
Prior work has developed acquisition and preservation methods for containers [2,3,4], forensic-ready observability [5], audit-log reconstruction [6], and comparisons of eBPF detection tools [7,8]. What was missing is a repeated-run measurement of how much heterogeneous telemetry is retained under controlled conditions, together with evidence on whether such measurements are valid. This paper contributes:
- 1.
- A methodological measurement framework: per-source volume, stability, and target-set metrics computed over repeated runs against matched baselines, with explicit estimators, confidence intervals, and execution and attribution checks. Prior studies report whether artifacts can be acquired or actions detected, but not how much of a source’s output is retained relative to a matched baseline, nor how stable that quantity is across repetitions.
- 2.
- A multi-layer experimental design: four telemetry layers, three workload scales, and four scripted conditions on one cluster, with 180 trial attempts. Existing comparisons evaluate tools one layer at a time; collecting orchestration, control-plane, network, and kernel telemetry simultaneously under identical conditions allows the layers to be compared directly.
- 3.
- Empirical findings: scale-related loss of orchestration and control-plane telemetry, a collection-capacity failure on a 16-GB host, and quantified effects of four measurement-pipeline hazards. These are empirical outcomes of the evaluated configuration, reported with their uncertainty, rather than claims of general source superiority.
- 4.
- A reproducible artifact: execution and normalization scripts, normalized exhibits, raw streams, and analysis code, released at https://github.com/isah-pentest/forensic-k8s (tag v1.0-electronics), from which every reported value, table, and figure is regenerated by a single command. Retention studies are rarely accompanied by their raw evidence; releasing it allowed the execution and attribution problems reported here to be found.
2. Related Work
- Container and cloud forensics.
Xiang and Chen [3] acquire container instances, volumes, logs, configuration, and image information through the Docker API; Mishra et al. [4] integrate container and host artifacts, file-system evidence, and system-call tracing in CONTAIN4n6; and Gharaibeh et al. [2] use checkpointing to preserve volatile runtime state. Schmid et al. [1] show how cloud-container deployment models restrict the evidence available to investigators, and reviews cover cloud forensic processes [9] and container attacks and defenses [10]. These studies establish what evidence exists, not how much of it is retained across repeated incidents.
- Forensic-ready observability.
Monteiro et al. [5] adapt evidence collection in microservice systems under uncertainty. Franzil et al. [6] reconstruct execution context from API-server audit logs with K8NTEXT, a source distinct from the Event objects measured here. Ninos et al. [11] study forensic applications deployed as Kubernetes microservices.
- eBPF runtime monitoring.
Surveys describe eBPF for monitoring, networking, and security [12,13]. Her et al. [7] compare KubeArmor, Falco, Tetragon, and Tracee by architecture, auditing capability, and performance; Syairozi [8] compare Falco, Tetragon, and Tracee by detection latency, detection rate, false positives, and resource use; and Jin et al. [14] apply eBPF to real-time DFIR on Windows orchestration environments. He et al. [15] show that eBPF can expose cross-container attack surfaces, which bounds claims about the reach of kernel telemetry. These works evaluate detection of executed actions; none measures repeated-run retention of heterogeneous telemetry or the validity of such measurements.
- Positioning.
Prior work therefore covers container-artifact acquisition and preservation [1,2,3,4], forensic-ready observability [5], audit-log reconstruction [6], and kernel-level monitoring [7,8,12,13,14]. This study does not propose a new acquisition or detection mechanism. It measures how much telemetry from four existing layers remains available after workload termination under controlled scale and adversarial conditions, and it reports the checks needed before such measurements can support forensic conclusions. Within the literature reviewed, we did not find an empirical evaluation that combines these four layers with repeated-run retention and stability measures.
3. System Model and Experimental Design
3.1. Implementation Environment and Telemetry Layers
All trials ran on a Windows 11 machine hosting Ubuntu 24.04 under WSL2, configured with 8 vCPUs and 16 GB of RAM and Docker Engine v29.1.3. A single-node cluster was created with kind v0.32.0-alpha from the kindest/node:v1.31.0 image (Kubernetes v1.31.0, kubelet maxPods 300), with Istio v1.29.2 installed through the Istio CLI and Tetragon v1.7.0, an eBPF-based observability and enforcement tool [16], through Helm. Workloads ran in the default namespace with Istio sidecar injection enabled. Four collectors were started at the beginning of each trial and stopped at teardown:
- 1.
- Kubernetes Event telemetry (K8sEvents; OSI layer 7, control plane).stdbuf -oL kubectl get events -A -o json –watch-only, a cluster-wide watch over Event objects describing scheduling, image pulls, container starts, and terminations. These are orchestration Event objects, not API-server audit-policy logs; audit logging was configured on the API server but not collected.
- 2.
- Istio control-plane logs (OSI layer 7, application plane).kubectl logs -n istio-system -l app=istiod –follow –tail=0, the istiod log stream. Envoy sidecar access logs were not collected.
- 3.
- Node packet capture (PCAP; OSI layers 3–4).sudo tcpdump -i any -U -w, without a packet limit. During normalization only the first 100 packets of each capture are read, so every run contributes exactly 100 packet records; standalone R, D, S, and C for PCAP are therefore undefined, and PCAP enters only the fused count. The raw captures are not in the released artifact.
- 4.
- eBPF/Tetragon (below the OSI stack, kernel runtime). The Tetragon export-stdout stream, from which process_exec events are retained.
Event and Istio telemetry were collected in Scenarios 0AB, A, and B; PCAP and Tetragon in Scenarios 0CD, B, C, and D (Table 1).
3.2. Threat Model
The intended adversary operates at container level: it can create pods and run commands in them but has no access to the node. Event and Istio records are therefore within its potential reach (in-band), whereas PCAP and Tetragon read from the node outside the container trust boundary (out-of-band, OOB). Host-level adversaries are out of scope; they could tamper with node collectors, and eBPF itself can be attacked [15].
3.3. Forensic Pipeline
Per-scenario Python scripts (e.g., normalize_0AB_scaled.py) convert each run’s raw streams into an exhibit (run_N_normalized.json) of records with six fields (evidence_id, timestamp, identity, event, protocol, path) and embed the SHA-256 digest of each raw input as a provenance anchor (Figure 1). Event objects are parsed with a brace-balanced JSON-stream parser and labelled from their reason field; istiod lines are retained when they match a keyword filter, whose keywords differ between the Scenario B normalizer and the others; Tetragon process_exec events become PROC_EXEC records. Each record receives a random evidence_id, so identifiers do not link records across sources. Records are sorted by timestamp, but the Scenario B normalizer assigns a single fixed timestamp to all Event and istiod records of a run, so the chronological order of in-band records in Scenario B exhibits carries no information.
3.4. Workload Manifest, Scale Design, and Capacity Condition
Every trial deployed one Deployment manifest (nginx:alpine, no resource requests or limits), varying only spec.replicas: 4, 50, or 100 pods. Replica counts were fixed rather than autoscaled, so workload volume is the only scale variable. In Scenario B at 100 replicas, concurrent four-collector capture exhausted host capacity in all ten trials and no complete exhibit was produced. According to the authors’ execution logs, the Event, Tetragon, and PCAP collectors were terminated with SIGKILL by the Linux out-of-memory killer; the Istio stream produced header-only output, and its termination mechanism was not independently established. These ten trials are excluded from C, R, S, and D and are analyzed as capacity evidence (Section 5.4); their validity implications are discussed in Section 7.2.
3.5. Adversarial Scenarios and Procedure
Each scenario added one scripted action intended to exercise a MITRE ATT&CK technique. The techniques were chosen so that each maps to one research question and each would, if executed, produce evidence in a different combination of layers: discovery activity in orchestration and control-plane records, an in-pod administrative command in kernel records, a credential read in kernel records only, and host resource stress outside orchestration visibility. For each scenario we state the action, its investigative meaning, and the evidence it should leave.
- Baselines 0AB and 0CD: the workload only, with the in-band (0AB) or OOB (0CD) collectors; their mean counts are the ratio denominators.
- Scenario A: T1046, Network Service Discovery [17]. A busybox pod runs nslookup against kubernetes.default and istiod.istio-system inside a loop written for j in {1..20}; because the busybox shell does not perform brace expansion, the loop most likely executes once. Investigative meaning: reconnaissance from a short-lived pod; the probe pod’s lifecycle Events and any control-plane activity it triggers are the expected traces.
- Scenario B: T1610, Deploy Container [18], and T1609, Container Administration Command [19]. A busybox pod is deployed and kubectl exec runs rm -rf /var/log/audit.log inside it. The command acts on the pod’s own filesystem; it cannot reach collector output on the host, the API server’s Event store, or the istiod log stream. Investigative meaning: an intruder deploys a container and runs commands in it; the expected traces are the pod’s lifecycle Events and a kernel record of the command.
- Scenario C: T1552.007, Unsecured Credentials: Container API [20]. A pod from the bitnami/kubectl image is started with arguments /bin/sh -c "TOKEN=$(cat /var/run/secrets/kubernetes.io/serviceaccount/token); kubectl get pods –token=$TOKEN", i.e., a token read followed by an API request. Because the command omits –command, these arguments are passed to the image’s entrypoint (kubectl) rather than to a shell. Investigative meaning: theft and use of a pod’s service-account credential; the expected traces are a kernel record of the file read and of the subsequent client process, and network traffic to the API server.
- Scenario D: T1499.003, Application Exhaustion Flood. A pod from the polinux/stress-ng image runs stress-ng –cpu 2 –vm 1 –vm-bytes 128M –timeout 20s. The technique describes request floods against application features, so the mapping is approximate. Investigative meaning: resource abuse on a shared node; the expected traces are the stress process in kernel records and its effect on co-located collectors.
Procedure. Each trial (i) starts the four collectors, (ii) applies the manifest and waits for readiness, (iii) injects the scenario action, (iv) waits for a scenario- and tier-specific interval of 15–120 s set in the execution scripts, and (v) deletes the workload and stops the collectors; normalization follows. Each scenario–tier cell was run ten times in sequence, and cells were executed in blocks rather than in randomized order: baselines on 14 May 2026, Scenarios A and B (4 and 50 replicas) that evening, Scenario C on 15–16 May, Scenario D on 16 May, and Scenario B at 100 replicas on 17 May.
4. Reconstruction Metrics and Statistical Analysis
4.1. Metric Definitions
For source q, scenario s, and tier , let be the record count in run i and its ratio to the matched baseline mean (Table 2).
Volume ratio (R) is the mean of per-run ratios clipped at one,
the estimator used by the released analysis code. An earlier version of this manuscript wrote it as ; the two coincide when no run exceeds the baseline and otherwise differ by up to 0.078 (Tetragon, Scenario B, 4 replicas). R describes collected volume relative to a matched baseline, not the fraction of generated records that was lost: means that each run’s volume reached or exceeded the baseline mean, and that runs averaged half of it. Because generation is not instrumented, a reduction in R is baseline-relative volume degradation and may arise from fewer records being generated, observed, written, or retained.
Count stability (D) is one minus the coefficient of variation of the unclipped ratios,
means identical counts in every run; D does not establish that the same records recurred. An investigator needs to know whether repeated occurrences of the same incident leave similar evidence volume, or whether apparent gaps are collection noise; D answers the first part of that question for counts only. We keep the name Determinism used in earlier versions as a synonym for this count-based measure.
Retention under Scenario B (S) is R for Scenario B at 50 replicas:
Because the Scenario B action cannot reach any collector (Section 3.5), S describes collector behavior under that condition, not survivability against an isolated tampering effect.
Completeness (C) applies the same ratio to records whose labels belong to a predefined set (Table 3):
The label sets are dominated by records unrelated to the scenario action: in Scenario A, records about the discovery-probe pods form 14.8%, 1.7%, and 1.7% of the K8sEvents set at 4, 50, and 100 replicas, the rest being nginx lifecycle events; for Tetragon the set is every process execution. C therefore measures retention of scenario-period lifecycle and process records rather than attack-specific signal. R and C share the same ratio structure and differ only in scope (R uses all records, C only those in ), so a source can retain substantial volume while losing a specific subset, or the reverse. The labels in Table 3 are normalized labels defined by the six-field schema, not raw event names; each normalization script fixes the mapping from raw records to labels.
Fused counts are the per-run sum of records across collected sources, including the 100 PCAP records; no cross-source deduplication occurs. Fused baselines are the corresponding sums (0AB for Scenario A, 0CD for C and D, 0AB plus 0CD for B).
4.2. Execution Verification and Stream Attribution
Two checks on the raw streams establish whether a cell’s metrics describe the intended behavior. Execution verification searches each run for direct evidence of the action: Event objects whose subject is the run’s probe pod (Scenario A), and Tetragon process_exec events from the scenario pod for rm (B), cat (C), or stress-ng (D). A missing record shows that the action was not captured, not that it did not occur. Stream attribution classes an Event record as carry-over from an earlier trial when its timestamp precedes the run’s latest record by more than 20 minutes. Tetragon timestamps show that runs lasted at most about 4 minutes, and the classified shares are identical for thresholds of 20, 30, and 45 minutes.
4.3. Statistical Analysis
The experimental unit is the run. Runs within a cell were executed consecutively on one cluster, so they share cluster state, and differences between cells are confounded with execution session; we therefore report estimates with uncertainty rather than hypothesis tests. For R we give two-sided 95% t intervals over the ten per-run clipped ratios (, half-width times their SD), truncated to . No prospective power analysis was performed. As a design-sensitivity statement, ten runs per cell give 80% power to detect a standardized difference of between two cells (two-sided ); smaller effects cannot be reliably distinguished from run-to-run variation. Effect sizes are Cohen’s d on per-run counts against the matched baseline (pooled SD). The capacity-failure proportion uses an exact Clopper–Pearson interval. and serve only as heuristic reference points, not as legal, evidentiary, or externally validated standards; their influence is checked by counting runs with for . All values are regenerated by analysis scripts from the released exhibits and raw streams.
5. Evaluation Results
5.1. Execution Verification and Stream Attribution
Table 4 reports the checks of Section 4.2. Probe activity was recorded in all Scenario A runs at 4 and 50 replicas and in 80% (8/10) at 100 replicas. The Scenario B deletion was recorded in 100% (10/10) of runs at 4 replicas and 0% (0/10) at 50 replicas, where the only tamper-pod processes (7/10 runs) are Istio sidecar initialization steps. At 50 replicas the tamper container was recorded as started 16–36 s after the pod’s first Event in six runs and was not recorded as started in four, compared with 1–3 s at 4 replicas; the script waited at most 30 s for readiness and discarded kubectl exec errors, so why the deletion was not recorded cannot be determined from the released data. No token read appeared in any Scenario C run (0/30); the attacker pod appeared only at 50 replicas (9/10 runs), as the image’s kubectl binary receiving the shell command as arguments. No stress-pod process appeared in any Scenario D run (0/30). The Tetragon counts for Scenarios C and D therefore consist of unrelated process executions, chiefly nginx start-up scripts and jq, cp, and iptables utilities.
Carry-over arises because a cluster-wide Event watch also reports Event objects as they expire. In every Scenario B run at 4 replicas the oldest Event record precedes the run by 60.8–61.3 minutes, matching the API server’s default one-hour Event retention (no override is configured); most of those records describe the 50-replica deployment from the Scenario A runs an hour earlier.
5.2. Workload Scaling (Scenario A, RQ1)
Scenario A is the condition in which the action is verified and carry-over is negligible. Baseline volume grows steeply with scale (Table 5). At 4 and 50 replicas both in-band sources retain at least 97% of baseline volume. At 100 replicas, R falls to 0.68 (95% CI 0.54–0.82) for K8sEvents and 0.74 (0.58–0.91) for Istio, with D of 0.713 and 0.609 (Table 6; Figure 2). Against the matched baseline, the per-run count difference corresponds to for K8sEvents, above the design’s detectable effect of 1.32, and for Istio, below it. At 100 replicas, 90% (9/10) of runs of each source reach , 30% (3/10) reach 0.80, and no K8sEvents run reaches 0.90. At 100 replicas, ratios for the individual target-set event types range from 0.65 (K8S_KILLING) to 0.91 (K8S_SUCCESSFULCREATE). Removing carry-over (3.7% of records) changes K8sEvents R from 0.68 to 0.70 and D from 0.713 to 0.729. At 4 replicas the target-set ratio exceeds baseline ( for K8sEvents, 1.25 for Istio). The records an investigator would look for first, the Events whose subject is the run’s own probe pod, declined more steeply than aggregate volume: from 17.8 per run (range 12–22) at 4 replicas and 13.2 (13–14) at 50 replicas to 4.0 (0–16) at 100 replicas, with none in 20% (2/10) of runs. These counts have no baseline counterpart, so no ratio is computed.
5.3. Adversarial Conditions (Scenarios B–D, RQ2)
In Scenario B at 50 replicas, Istio volume fell to (95% CI 0.25–0.37), with no run reaching (0/10) and a count difference of against the baseline (Figure 3). The reduction is also present in the unfiltered raw istiod log lines (ratio 0.32), so it is not produced by the normalizer’s keyword filter. For eBPF, (0.43–0.69), compared with (0.74–1.00) at 4 replicas, where the deletion was recorded in every run; the fused count reaches at 4 replicas and (0.53–0.69) at 50, tracking its in-band components. The K8sEvents values for Scenario B are dominated by carry-over: at 4 replicas, carry-over records raise the mean unclipped ratio to 6.20 and lower D to 0.452; without them the ratio is 1.36 and D is 0.733. At 50 replicas, removing carry-over lowers R from 0.86 to 0.56. For Scenarios C and D, eBPF R ranged from 0.42 to 0.61 and D from 0.713 to 1.000 (Table 6); because the scripted actions were not recorded and K8sEvents and Istio were not collected, these cells provide no evidence on visibility of credential access or stress in any source.
5.4. Capacity Failure at 100 Replicas (RQ3)
All ten capacity trials failed to produce a complete exhibit (10/10; exact 95% CI for the failure probability in this configuration 0.69–1.00). The one-minute load average was during deployment and during expansion on the 8-vCPU host, and mean memory use exceeded 90% of the 16,384-MB capacity in every phase (Table 7). The overhead script raised 872 pressure flags (66–90 per run), one per one-second sample with load above 6 or free memory below 500 MB. Collectors wrote partial output before stopping: 19–461 kB of Event objects, 1.5–5.6 MB of Tetragon events, and 2.8–18.3 MB of packets per run; every Istio file held only a 46-byte header.
5.5. Measurement-Pipeline Effects and Cross-Source Profile (RQ4)
Four pipeline properties change the reported values. (i) Carry-over: as above, it reverses the apparent ordering of Scenario B conditions for K8sEvents. (ii) Constant summands: adding 100 PCAP records to every fused count lowers its coefficient of variation; in Scenario D at 4 replicas, fused D is 0.855 with them and 0.713, equal to eBPF alone, without them, and the mean fused D over the 11 analyzed cells falls from 0.901 to 0.882. (iii) Truncation: PCAP ratios are identically one, so no PCAP metric is informative. (iv) Clipping: averaging clipped per-run ratios lowers R by up to 0.078 relative to clipping the mean. Because is dominated by lifecycle records, mean C is high for K8sEvents (0.906) and Istio (0.929) and lower for eBPF (0.589), largely mirroring R. Across the analyzed cells, mean R is 0.901 for K8sEvents, 0.799 for Istio, 0.577 for eBPF, and 0.711 for the fused count, and mean D is 0.750, 0.817, 0.871, and 0.901, respectively; the minimum D of each in-band source occurs in a carry-over-dominated or capacity-adjacent cell (K8sEvents, Scenario B, 4 replicas; Istio, Scenario A, 100 replicas). No single source has the highest value on every metric.
6. Discussion and Implications
Retention for post-termination investigations. An investigator reconstructing a terminated workload from Event objects or control-plane logs works from a sample whose size depends on cluster load. In this configuration a substantial share of the expected orchestration and control-plane records was missing at the highest scale, and the shortfall varied between otherwise identical runs. The absence of a lifecycle record is therefore weak evidence that the corresponding event did not occur, and becomes weaker as the cluster gets busier; no single lifecycle record type can be assumed to survive when volume falls.
Scale and observability. The scale effect is an association within one host and one session. Baseline volume rose steeply with replica count on fixed resources, and both in-band sources lost volume together, which fits a shared constraint between record generation and the collector’s output file. Candidate mechanisms include aggregation and rate limiting of Events at their source, delivery limits on the watch stream, and collector buffering on a contended host; the design cannot distinguish them. The study’s sensitivity also limits the scale claim: the Event-object effect exceeds what ten runs can reliably detect, but the control-plane effect does not.
Complementarity without assumed fusion benefits. The four sources record different things, and corroboration across them is useful in an investigation. Here, however, the fused count is a sum: its apparent stability advantage is partly arithmetic, and it did not offset the scale-related loss. Whether content-level correlation across sources improves reconstruction is an open question.
Collector behavior under the Scenario B condition.S describes how collectors behaved while a pod ran a deletion command inside its own filesystem, not how evidence survives targeted suppression; the tested threat model never exposed collector output to the action. The control-plane reduction under this condition is a genuine observation whose cause, possibly session differences or log-stream interruption, was not measured. The Event-object instability earlier attributed to deletion timing is explained by carry-over between trials.
Capacity as a forensic-readiness constraint. Collectors deployed without resource reservations failed precisely when evidence was most voluminous. This is a limitation of the collection infrastructure rather than of the telemetry sources, and its onset depends on host size, workload footprint, and collector configuration. Whether resource requests, limits, priority classes, or dedicated collector nodes prevent it was not tested.
Implications for forensic-readiness architecture. Three design considerations follow, each conditional on environments resembling the evaluated one. First, baseline telemetry volume should be characterized at the workload scales an operator actually runs, because retention judged at small scale did not hold at large scale. Second, evidence collection should span more than one trust plane, and in-band streams should be exported off the cluster early, because in-cluster Event records are short-lived and within reach of in-cluster principals. Third, collectors should be provisioned and monitored as production workloads with reserved resources, because collection that competes with the workload for memory fails when it is most needed. Managed Kubernetes services change some of these trade-offs, for example by exporting control-plane logs, and the present results were not validated there.
Strengths and limits. The study’s strength is a simultaneous comparison of Kubernetes Event, Istio, PCAP, and eBPF telemetry over repeated runs with matched baselines, released evidence, and verifiable provenance. Two kinds of limitation must be kept apart. Some weaken the present conclusions themselves: the scenario actions of Scenarios B–D were largely not recorded, carry-over contaminated Event counts in Scenario B, runs were not randomized or interleaved with baselines, ten runs per cell support descriptive estimates rather than high-precision population estimates or formal power, high baseline variance at some tiers (Table 5) widens every ratio’s uncertainty, and the 100-packet PCAP truncation leaves the network layer without a standalone measure. Others bound generalization without weakening what was measured: the single-node kind cluster under WSL2, the single nginx:alpine workload, the container-level threat model, and the absence of managed or production clusters. The first group calls for repeating Scenarios B–D with execution checks, per-run namespaces, interleaved baselines, and full packet analysis; the second for replication on multi-node and managed clusters with heavier workloads.
Practical Implications for Forensic Readiness. For investigators and teams preparing clusters: export Event objects and control-plane logs early, because Events expire after about an hour by default; filter by namespace, object, and creation time, because a cluster-wide watch includes unrelated and expired records; confirm that collectors ran to completion and record host load and memory at collection time; corroborate across sources by content and time rather than counts; and record which collectors were absent, since an absent collector provides no evidence either way.
Relation to prior work. The scale-related loss adds a quantitative dimension to findings that deployment models limit available container evidence [1] and supports load-aware collection policies [5]. It also cautions against substituting Event objects for the audit logs used by Franzil et al. [6]. Evaluations of eBPF tools report detection of actions known to have executed [7,8]; in retention experiments, establishing that the action executed is itself a measurement that must be made.
7. Threats to Validity
7.1. Construct Validity
R and D describe collected record counts relative to a baseline, not evidentiary completeness or the fraction of generated records lost. C is dominated by workload lifecycle records. S is not a survivability measure, because the Scenario B action did not target any collector. Truncation fixes every PCAP count at 100 records, so PCAP R and D equal one by construction and are not reported; analyzing full captures by time window would allow standalone PCAP metrics. Undefined cells (sources not collected, or no label set) are omitted from all averages rather than treated as zero.
7.2. Internal Validity
Cells were executed in non-randomized blocks over four days, so condition effects are confounded with session; baselines for Scenarios C and D were recorded on a different day from those scenarios, and runs within a cell shared cluster state. Carry-over contaminated K8sEvents counts, heavily in Scenario B. The scripted actions of Scenarios C and D were not recorded, and that of Scenario B only at 4 replicas. The ten capacity trials (Section 3.4) truncate the design: no quantitative statement about Scenario B at 100 replicas is possible, so scale effects for the four-collector configuration rest on the 4- and 50-replica tiers only, and the out-of-memory attribution rests on execution logs that are not part of the released artifact. One exhibit exists for that cell from an earlier attempt whose raw files were later overwritten; it is excluded. All metrics depend on per-scenario normalization scripts that use different keyword filters and labels; systematic errors in parsing or labelling would bias every metric without being visible in the outputs. The SHA-256 anchors establish that exhibits derive from the released raw files, not that the transformation is correct. Baseline variance enters every ratio: where a baseline tier is unstable, as for Tetragon at 4 replicas, a cell’s D partly reflects baseline uncertainty that the fixed denominator does not carry.
7.3. External Validity
All results come from one single-node kind cluster under WSL2, one lightweight workload image, and one collector configuration. Multi-node and managed clusters differ in control-plane capacity, Event handling, and logging, and providers publish their own hardening guidance [21,22]. No quantitative result, and in particular not the capacity limit, should be transferred to such environments without replication.
Mapping to multi-node clusters. In multi-node clusters the API server remains a shared component, so scale-related pressure on Event delivery may also arise; its magnitude and onset cannot be inferred from a single node, and control-plane capacity, latency, workload placement, and logging architecture could move the results in either direction. Managed services may export API-server audit logs to external backends; those are different artifacts from the Event objects measured here. A Tetragon DaemonSet places one collector per Linux node, so the class of evidence is available beyond one node, but its retention there was not measured. Because each node carries its own collectors and memory budget, the capacity failure observed here depends on the per-node workload rather than on cluster size.
Workload dependence. Only nginx:alpine, an image with low ambient process and Event volume, was evaluated. Heavier workloads would change the baseline denominators and therefore the scale at which a source falls below any reference level; the direction of that change was not tested.
Adversary scope and scenario atomicity. The threat model covers container-level adversaries only. Each scenario applied one action in isolation, whereas real incidents chain techniques; chained incidents could add corroborating records or introduce interference, and the per-scenario values should not be read as bounds for them.
Observation windows. Post-injection waits of 15–120 s were tuned per scenario and tier for this host. A different host or topology could require different windows, and the sensitivity of the metrics to window length was not tested.
7.4. Conclusion Validity
With ten non-independent runs per cell, intervals are wide at 100 replicas and reflect within-session variability only; effects smaller than are not reliably detectable. Baseline CVs of up to 0.44 (Tetragon, 4 replicas) add uncertainty not included in the fixed-denominator intervals. The reference levels are heuristic: Istio in Scenario B at 50 replicas falls below every tested level (0/10 runs at ), K8sEvents in Scenario A at 100 replicas declines gradually (9/10 runs at 0.60, 0/10 at 0.90), and fused values in Scenarios C and D at 4 replicas pass 0.70 in 10/10 runs but 0.80 in at most 1/10. Conclusions that depend on the 0.80 level, such as classifying those fused cells as below reference, would therefore change at 0.70, whereas the Istio reduction under Scenario B and the eBPF levels in Scenarios C and D at 50 and 100 replicas are below every tested level. The of K8sEvents in Scenario B at 4 replicas is an observed value driven by carry-over, not a lower bound on stability. Ten runs permit estimates of means and dispersion with the stated precision; they do not support high-precision population estimates.
7.5. Artifact and Reproducibility Scope
The repository (https://github.com/isah-pentest/forensic-k8s, tag v1.0-electronics, commit deeeadb) contains the raw Kubernetes Event, Istio, and Tetragon streams of every trial, the 171 normalized exhibits, the execution and normalization scripts as run, and the analysis code. A single command, ./reproduce.sh, which runs from any location after ./install.sh has installed the pinned Python dependencies, first verifies all 1,018 data, script, and configuration files of the released repository against a SHA-256 manifest and runs the original scripts unmodified; it then (i) regenerates the metric tables with the original pipeline and requires them to be byte-identical to the released versions; (ii) recomputes every quantity independently and compares all 306 numbers printed in this article’s tables and text with the recomputed values at the printed precision; (iii) re-verifies the SHA-256 anchors, all of which match their raw Event, Istio, and Tetragon files for the 170 analyzed exhibits; (iv) re-runs the six normalizers on the raw streams, regenerating all 170 analyzed exhibits record for record apart from random record identifiers and packet records; and (v) regenerates Figure 2 and Figure 3. It stops with an error at the first mismatch; the complete check passed, with identical values, under Python 3.11, 3.12, 3.13, and 3.14. The repository does not contain raw packet captures, execution console logs, or per-second resource logs, so packet records and the capacity-condition summaries cannot be regenerated from it. Experimental reproduction additionally requires a comparable host; the execution scripts are in artifact/data/Scenario_*/analysis_scripts.
8. Conclusion
In a single-node Kubernetes cluster, orchestration-event and control-plane telemetry became both scarcer and less consistent as workload scale grew, and four-collector capture failed outright at the largest scale on a 16-GB host. For forensic readiness, this means that the evidence most needed after a busy incident is the evidence most likely to be partial, and that collector capacity must be provisioned and verified rather than assumed. The adversarial scenarios did not, as executed, exercise the intended actions, so this study does not establish how any source behaves under credential access, resource stress, or targeted log suppression. Retention experiments should verify execution in every run, isolate each trial’s records, keep full captures, and report sources separately; repeating the adversarial scenarios with these controls, on multi-node and managed clusters, is the next step.
Author Contributions
Conceptualization, I.M. and N.S.; methodology, I.M., Q.L. and N.S.; software, I.M.; validation, I.M. and Q.L.; formal analysis, I.M.; investigation, I.M.; data curation, I.M.; writing—original draft preparation, I.M.; writing—review and editing, I.M., Q.L. and N.S.; visualization, I.M.; supervision, Q.L. and N.S.; project administration, N.S. All authors have read and agreed to the published version of the manuscript.
Funding
This research did not receive any specific grant from funding agencies in the public, commercial, or not-for-profit sectors.
Institutional Review Board Statement
Not applicable.
Informed Consent Statement
Not applicable.
Data Availability Statement
The raw Kubernetes Event, Istio, and Tetragon streams, normalized exhibits, execution and normalization scripts, and the analysis code that regenerates every reported value, table, and figure are openly available at https://github.com/isah-pentest/forensic-k8s under a CC BY 4.0 license (tag v1.0-electronics, commit deeeadb98cd1bf27d8d414a19372c8deeb6b9c91). Raw packet captures, execution console logs, and per-second resource-monitor logs are not included.
Acknowledgments: Ethical, legal, and dual-use statement.
All experiments were executed on an isolated laboratory cluster owned and operated by the authors. No human participants, personal data, or third-party systems were involved; the service-account token in Scenario C belonged to the laboratory cluster, and the released scripts and credentials were sanitized to target only local laboratory resources.
Conflicts of Interest
N.S. serves as a Guest Editor of the Special Issue to which this article is submitted. The authors declare no other conflicts of interest.
References
- Schmid, K.; Bayreuther, K.; Freiling, F. Limits to the Forensic Analysis of Container Applications in Cloud Environments. Digit. Threat. Res. Pract. 2025, 6, 26. [Google Scholar] [CrossRef]
- Gharaibeh, T.; Seiden, S.; Abouelsaoud, M.; Bou-Harb, E.; Baggili, I. Don’t, stop, drop, pause: Forensics of container checkpoints (conpoint). In Proceedings of the 19th International Conference on Availability, Reliability and Security, 2024; pp. 1–11. [Google Scholar]
- Xiang, J.; Chen, L. A method of docker container forensics based on api. In Proceedings of the 2nd International Conference on Cryptography, Security and Privacy, 2018; pp. 159–164. [Google Scholar] [CrossRef]
- Mishra, A.K.; Pilli, E.S.; Govil, M.C. CONTAIN4n6: a systematic evaluation of container artifacts. J. Cloud Comput. 2022, 11, 28. [Google Scholar] [CrossRef]
- Monteiro, D.; Yu, Y.; Zisman, A.; Nuseibeh, B. Adaptive observability for forensic-ready microservice systems. IEEE Trans. Serv. Comput. 2023, 16, 3196–3209. [Google Scholar] [CrossRef]
- Franzil, M.; Armani, V.; Knob, L.A.D.; Siracusa, D. Sharpening Kubernetes audit logs with context awareness. Comput. Netw. 2026, 276, 111890. [Google Scholar] [CrossRef]
- Her, J.; Kim, J.; Kim, J.; Lee, S. An in-depth analysis of ebpf-based system security tools in cloud-native environments. IEEE Access 2025, 13, 155588–155604. [Google Scholar] [CrossRef]
- Syairozi, A.A.; Arizal. Comparative Analysis of eBPF-Based Runtime Security Monitoring Tools in Monitoring and Threat Detection on Kubernetes. In Proceedings of the 1st International Conference on Research and Innovations in Information and Engineering Technology (RITECH 2025), SCITEPRESS – Science and Technology Publications. 2025; pp. 136–141. [Google Scholar] [CrossRef]
- Malik, A.W.; Bhatti, D.S.; Park, T.J.; Ishtiaq, H.U.; Ryou, J.C.; Kim, K.I. Cloud Digital Forensics: Beyond Tools, Techniques, and Challenges. Sensors 2024, 24, 433. [Google Scholar] [CrossRef] [PubMed]
- Jarkas, O.; Ko, R.; Dong, N.; Mahmud, R. A container security survey: Exploits, attacks, and defenses. ACM Comput. Surv. 2025, 57, 1–36. [Google Scholar] [CrossRef]
- Ninos, F.; Karalas, K.; Dechouniotis, D.; Polemis, M. On Microservice-Based Architecture for Digital Forensics Applications: A Competition Policy Perspective. Future Internet 2025, 17, 137. [Google Scholar] [CrossRef]
- Sharaf, H.; Ahmad, I.; Dimitriou, T. Extended Berkeley Packet Filter: An Application Perspective. IEEE Access 2022, 10, 126370–126393. [Google Scholar] [CrossRef]
- Soldani, D.; Nahi, P.; Bour, H.; Jafarizadeh, S.; Soliman, M.; Di Giovanna, L.; Monaco, F.; Ognibene, G.; Risso, F. eBPF: A New Approach to Cloud-Native Observability, Networking and Security for Current (5G) and Future Mobile Networks (6G and Beyond). IEEE Access 2023, 11, 57174–57202. [Google Scholar] [CrossRef]
- Jin, P.; Kim, N.; Jeong, D. Enhancing DFIR in Orchestration Environments: Real-Time Forensic Framework with eBPF for Windows. Forensic Sci. Int. Digit. Investig. 2025, 53, 301923. [Google Scholar] [CrossRef]
- He, Y.; Guo, R.; Xing, Y.; Che, X.; Sun, K.; Liu, Z.; Xu, K.; Li, Q. Cross Container Attacks: The Bewildered eBPF on Clouds. In Proceedings of the 32nd USENIX Security Symposium (USENIX Security 23), Anaheim, CA, Aug 2023; pp. 5971–5988. [Google Scholar]
- Isovalent. Cilium Tetragon: eBPF-Based Security Observability and Runtime Enforcement. CNCF Open Source Project, v1.0 General Availability. 2023. Available online: https://tetragon.io/ (accessed on April 2026).
- MITRE Corporation. Network Service Discovery (T1046). MITRE ATT&CK® Enterprise Matrix, Containers Platform. 2021. Available online: https://attack.mitre.org/techniques/T1046/ (accessed on 19 April 2026).
- MITRE Corporation. Deploy Container (T1610). MITRE ATT&CK® Enterprise Matrix, Containers Platform. 2021. Available online: https://attack.mitre.org/techniques/T1610/ (accessed on 19 April 2026).
- MITRE Corporation. Container Administration Command (T1609). MITRE ATT&CK® Enterprise Matrix, Containers Platform. 2021. Available online: https://attack.mitre.org/techniques/T1609/ (accessed on April 2026).
- MITRE Corporation. Unsecured Credentials: Container API (T1552.007). MITRE ATT&CK® Enterprise Matrix, Containers Platform. 2021. Available online: https://attack.mitre.org/techniques/T1552/007/ (accessed on 19 April 2026).
- Google Cloud. Harden your cluster’s security. 2024. Available online: https://cloud.google.com/kubernetes-engine/docs/how-to/hardening-your-cluster (accessed on May 2026).
- Amazon Web Services. Amazon EKS Best Practices Guide: Security. 2024. Available online: https://aws.github.io/aws-eks-best-practices/security/docs/ (accessed on May 2026).
Figure 1.
Telemetry collection and processing pipeline. In-band collectors read cluster state an in-cluster principal could modify; out-of-band collectors read from the node. Each run’s records form one exhibit and are counted per source.
Figure 1.
Telemetry collection and processing pipeline. In-band collectors read cluster state an in-cluster principal could modify; out-of-band collectors read from the node. Each run’s records form one exhibit and are counted per source.
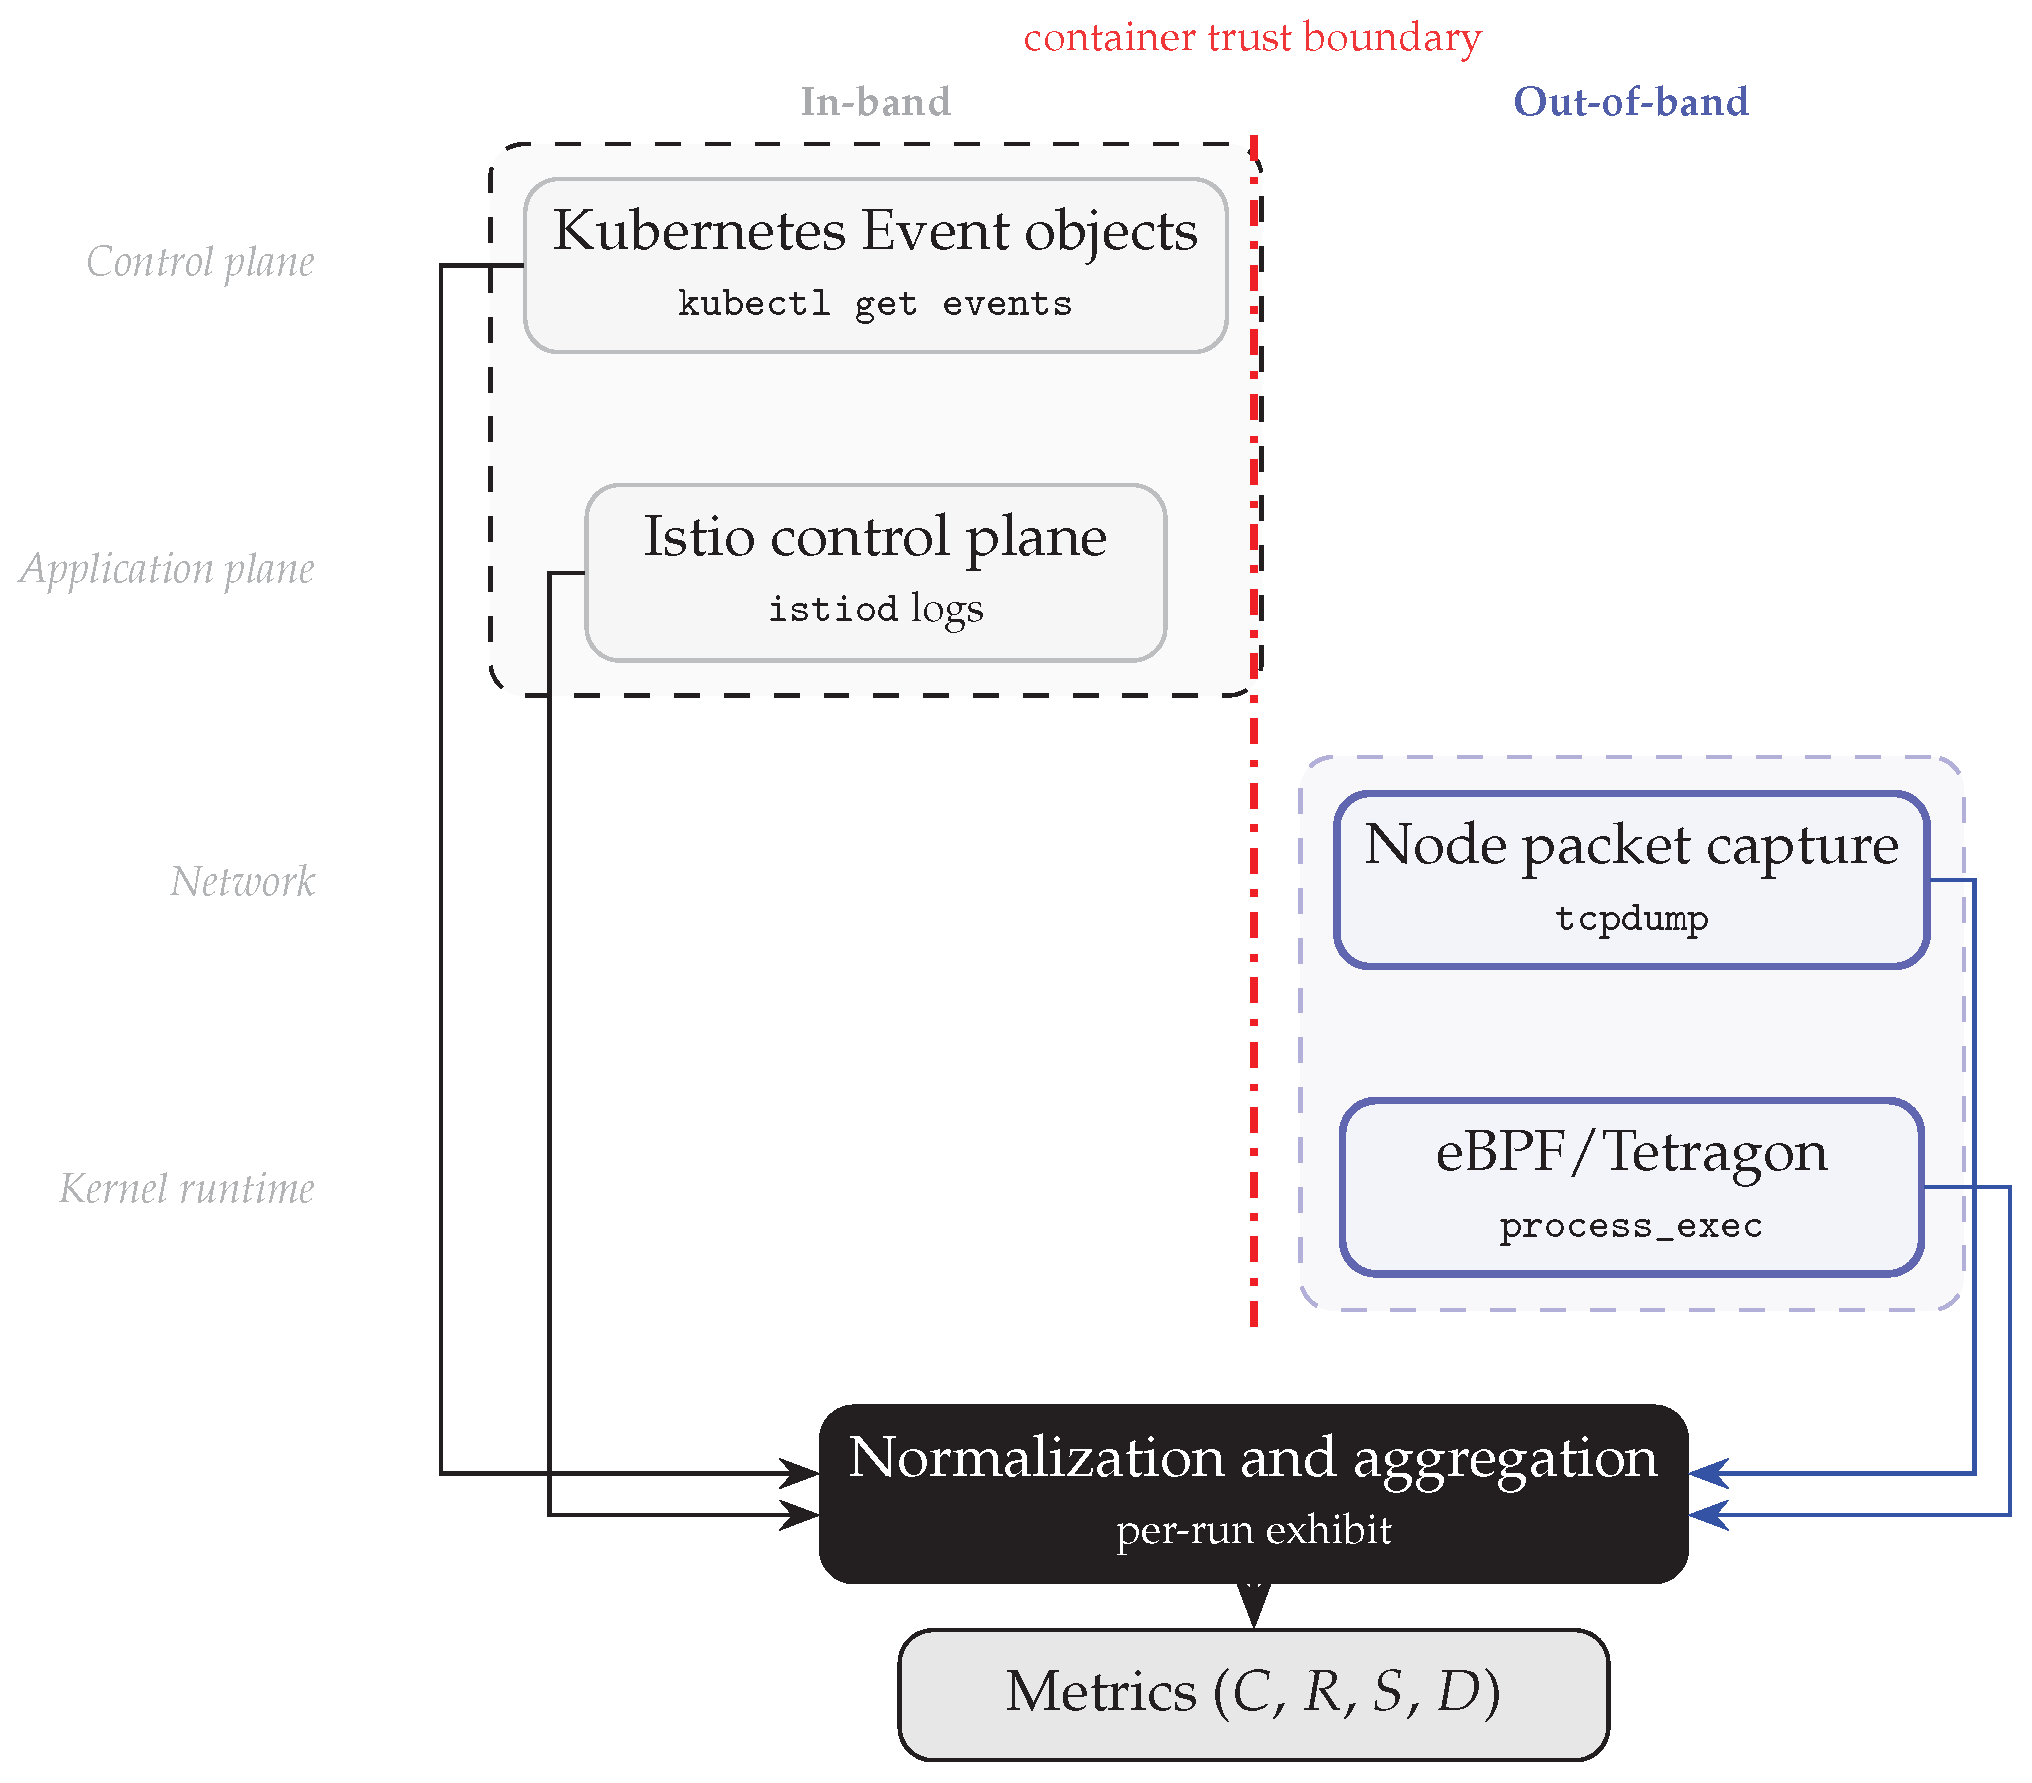
Figure 2.
Volume ratio R versus workload scale in Scenario A for K8sEvents, Istio, and their sum (Fused). Shaded bands: SD of the unclipped per-run ratios across runs, clipped to ; intervals in Table 6.
Figure 2.
Volume ratio R versus workload scale in Scenario A for K8sEvents, Istio, and their sum (Fused). Shaded bands: SD of the unclipped per-run ratios across runs, clipped to ; intervals in Table 6.
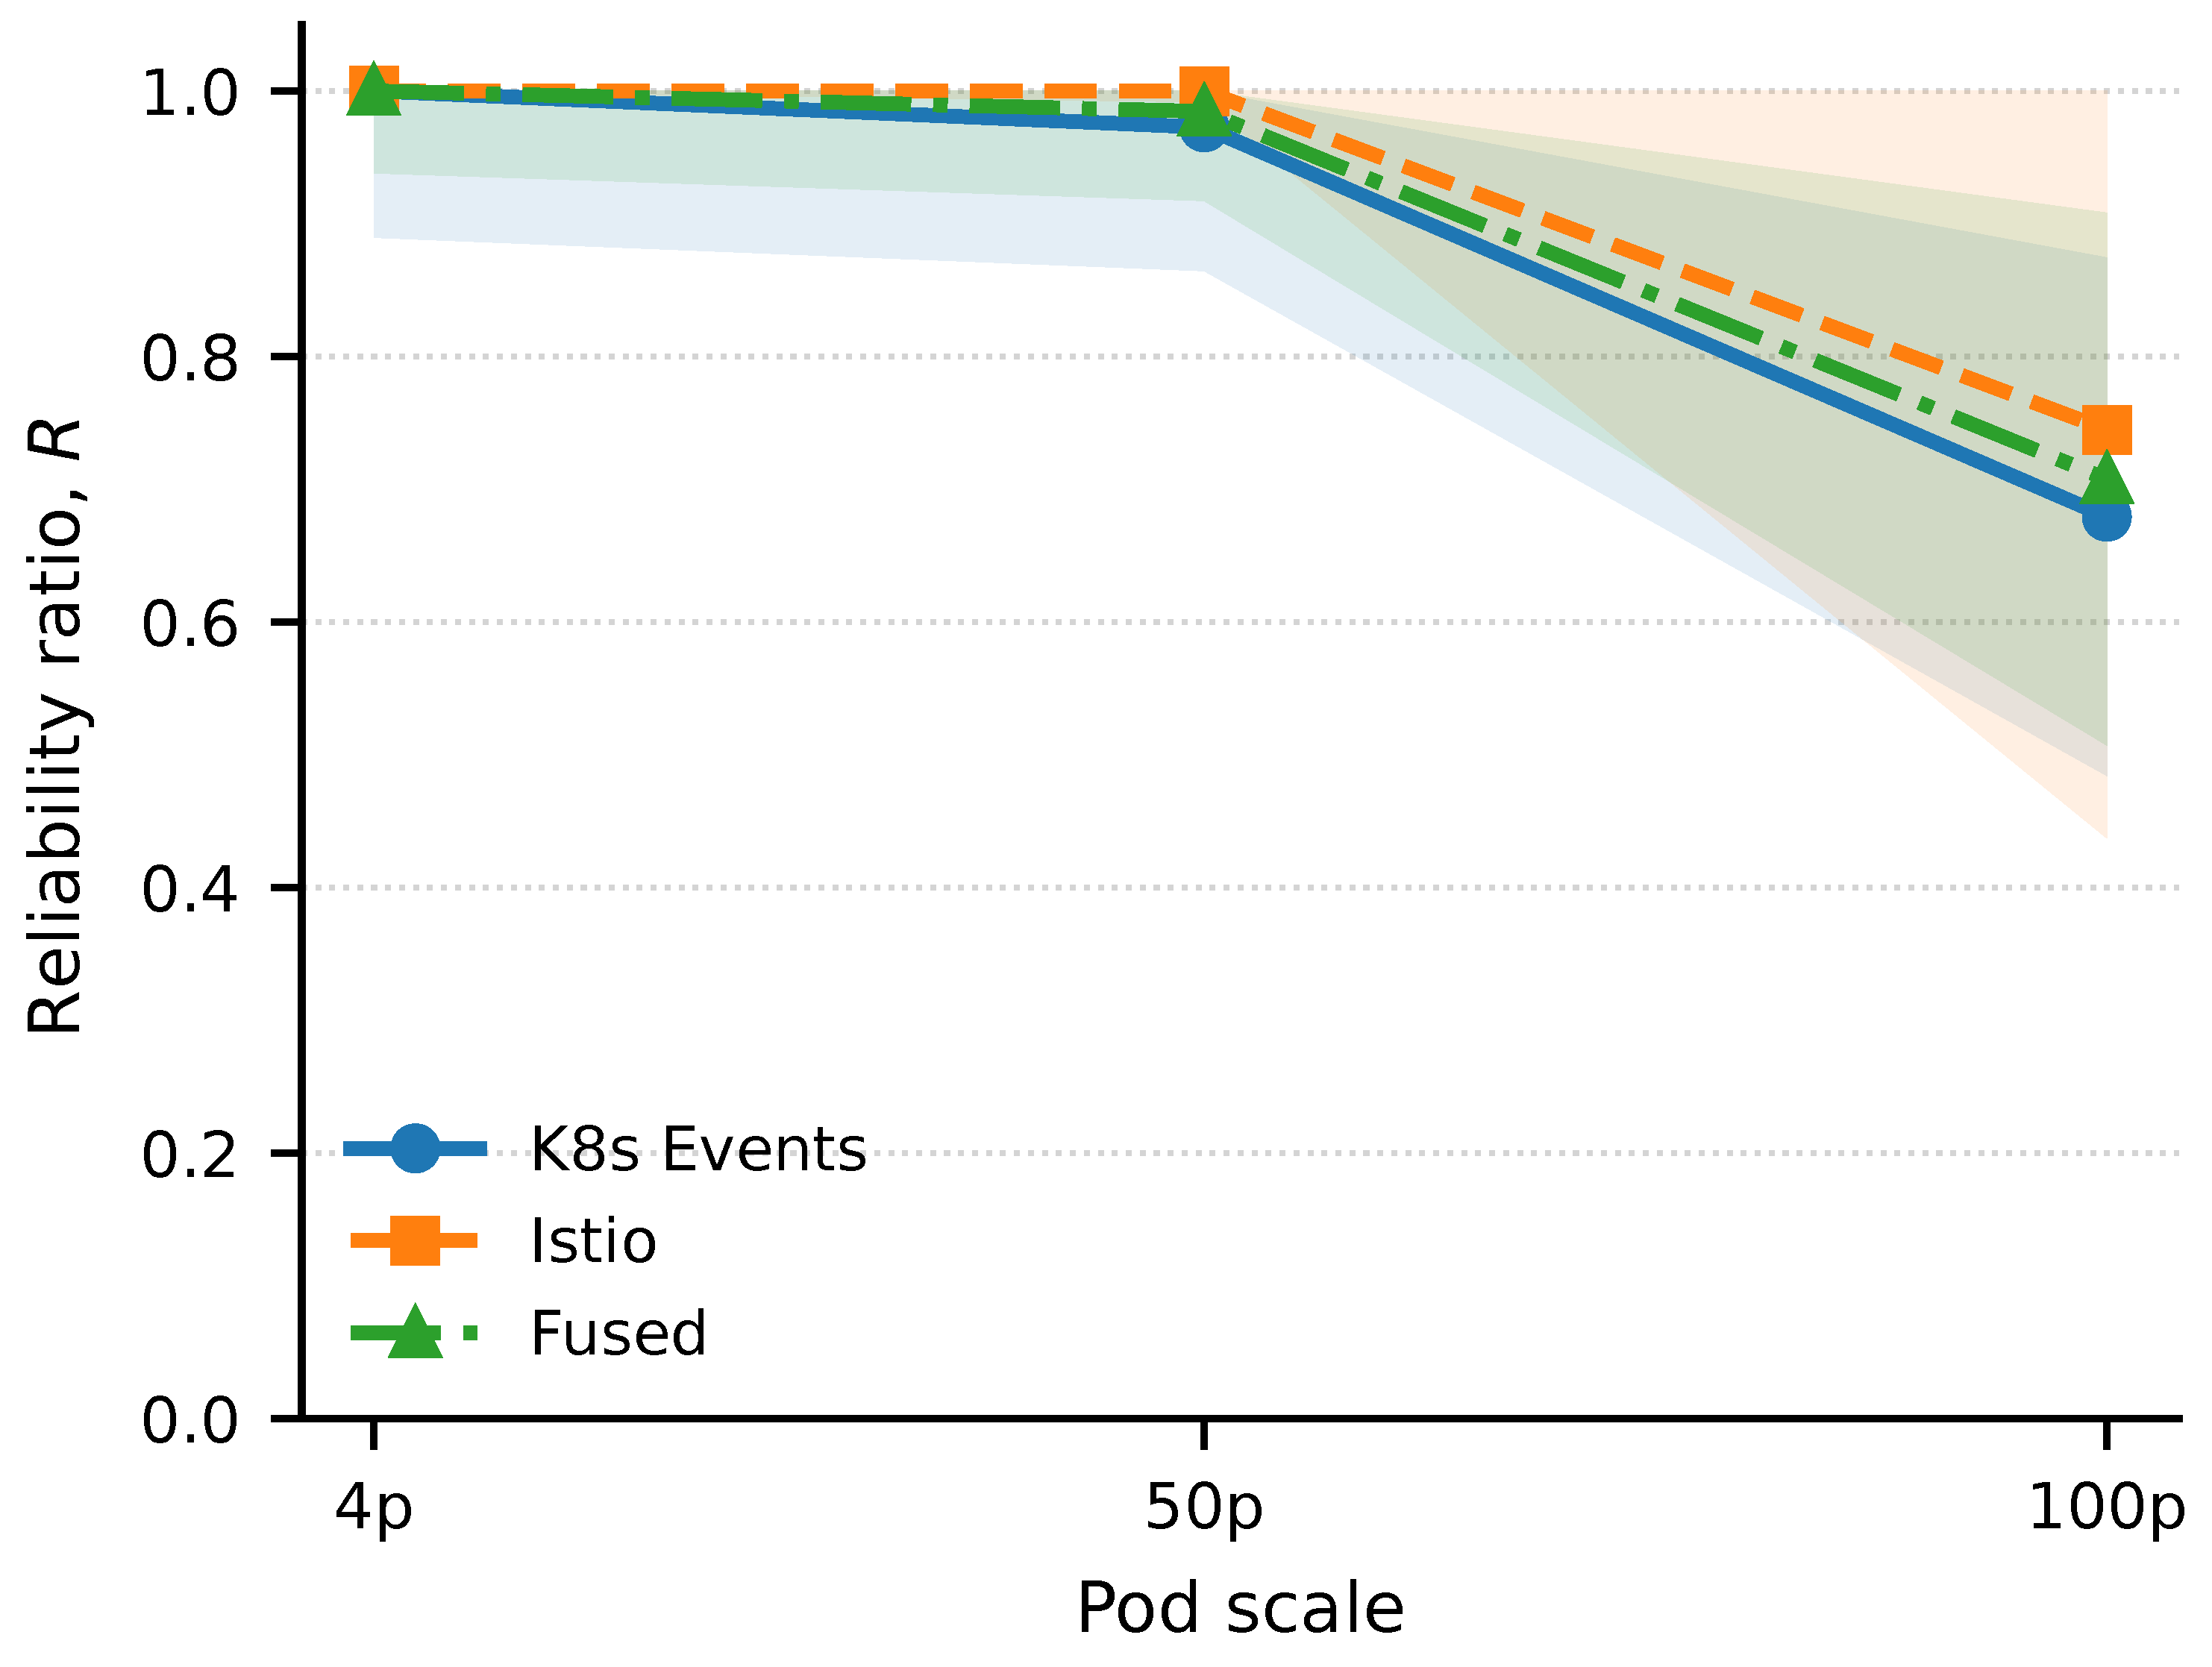
Figure 3.
Volume ratio R in Scenario B at 4 and 50 replicas ( runs each; error bars SD clipped to ). The 50-replica values define S. The deletion was recorded in 10/10 runs at 4 replicas and 0/10 at 50; K8sEvents values are dominated by carry-over.
Figure 3.
Volume ratio R in Scenario B at 4 and 50 replicas ( runs each; error bars SD clipped to ). The 50-replica values define S. The deletion was recorded in 10/10 runs at 4 replicas and 0/10 at 50; K8sEvents values are dominated by carry-over.
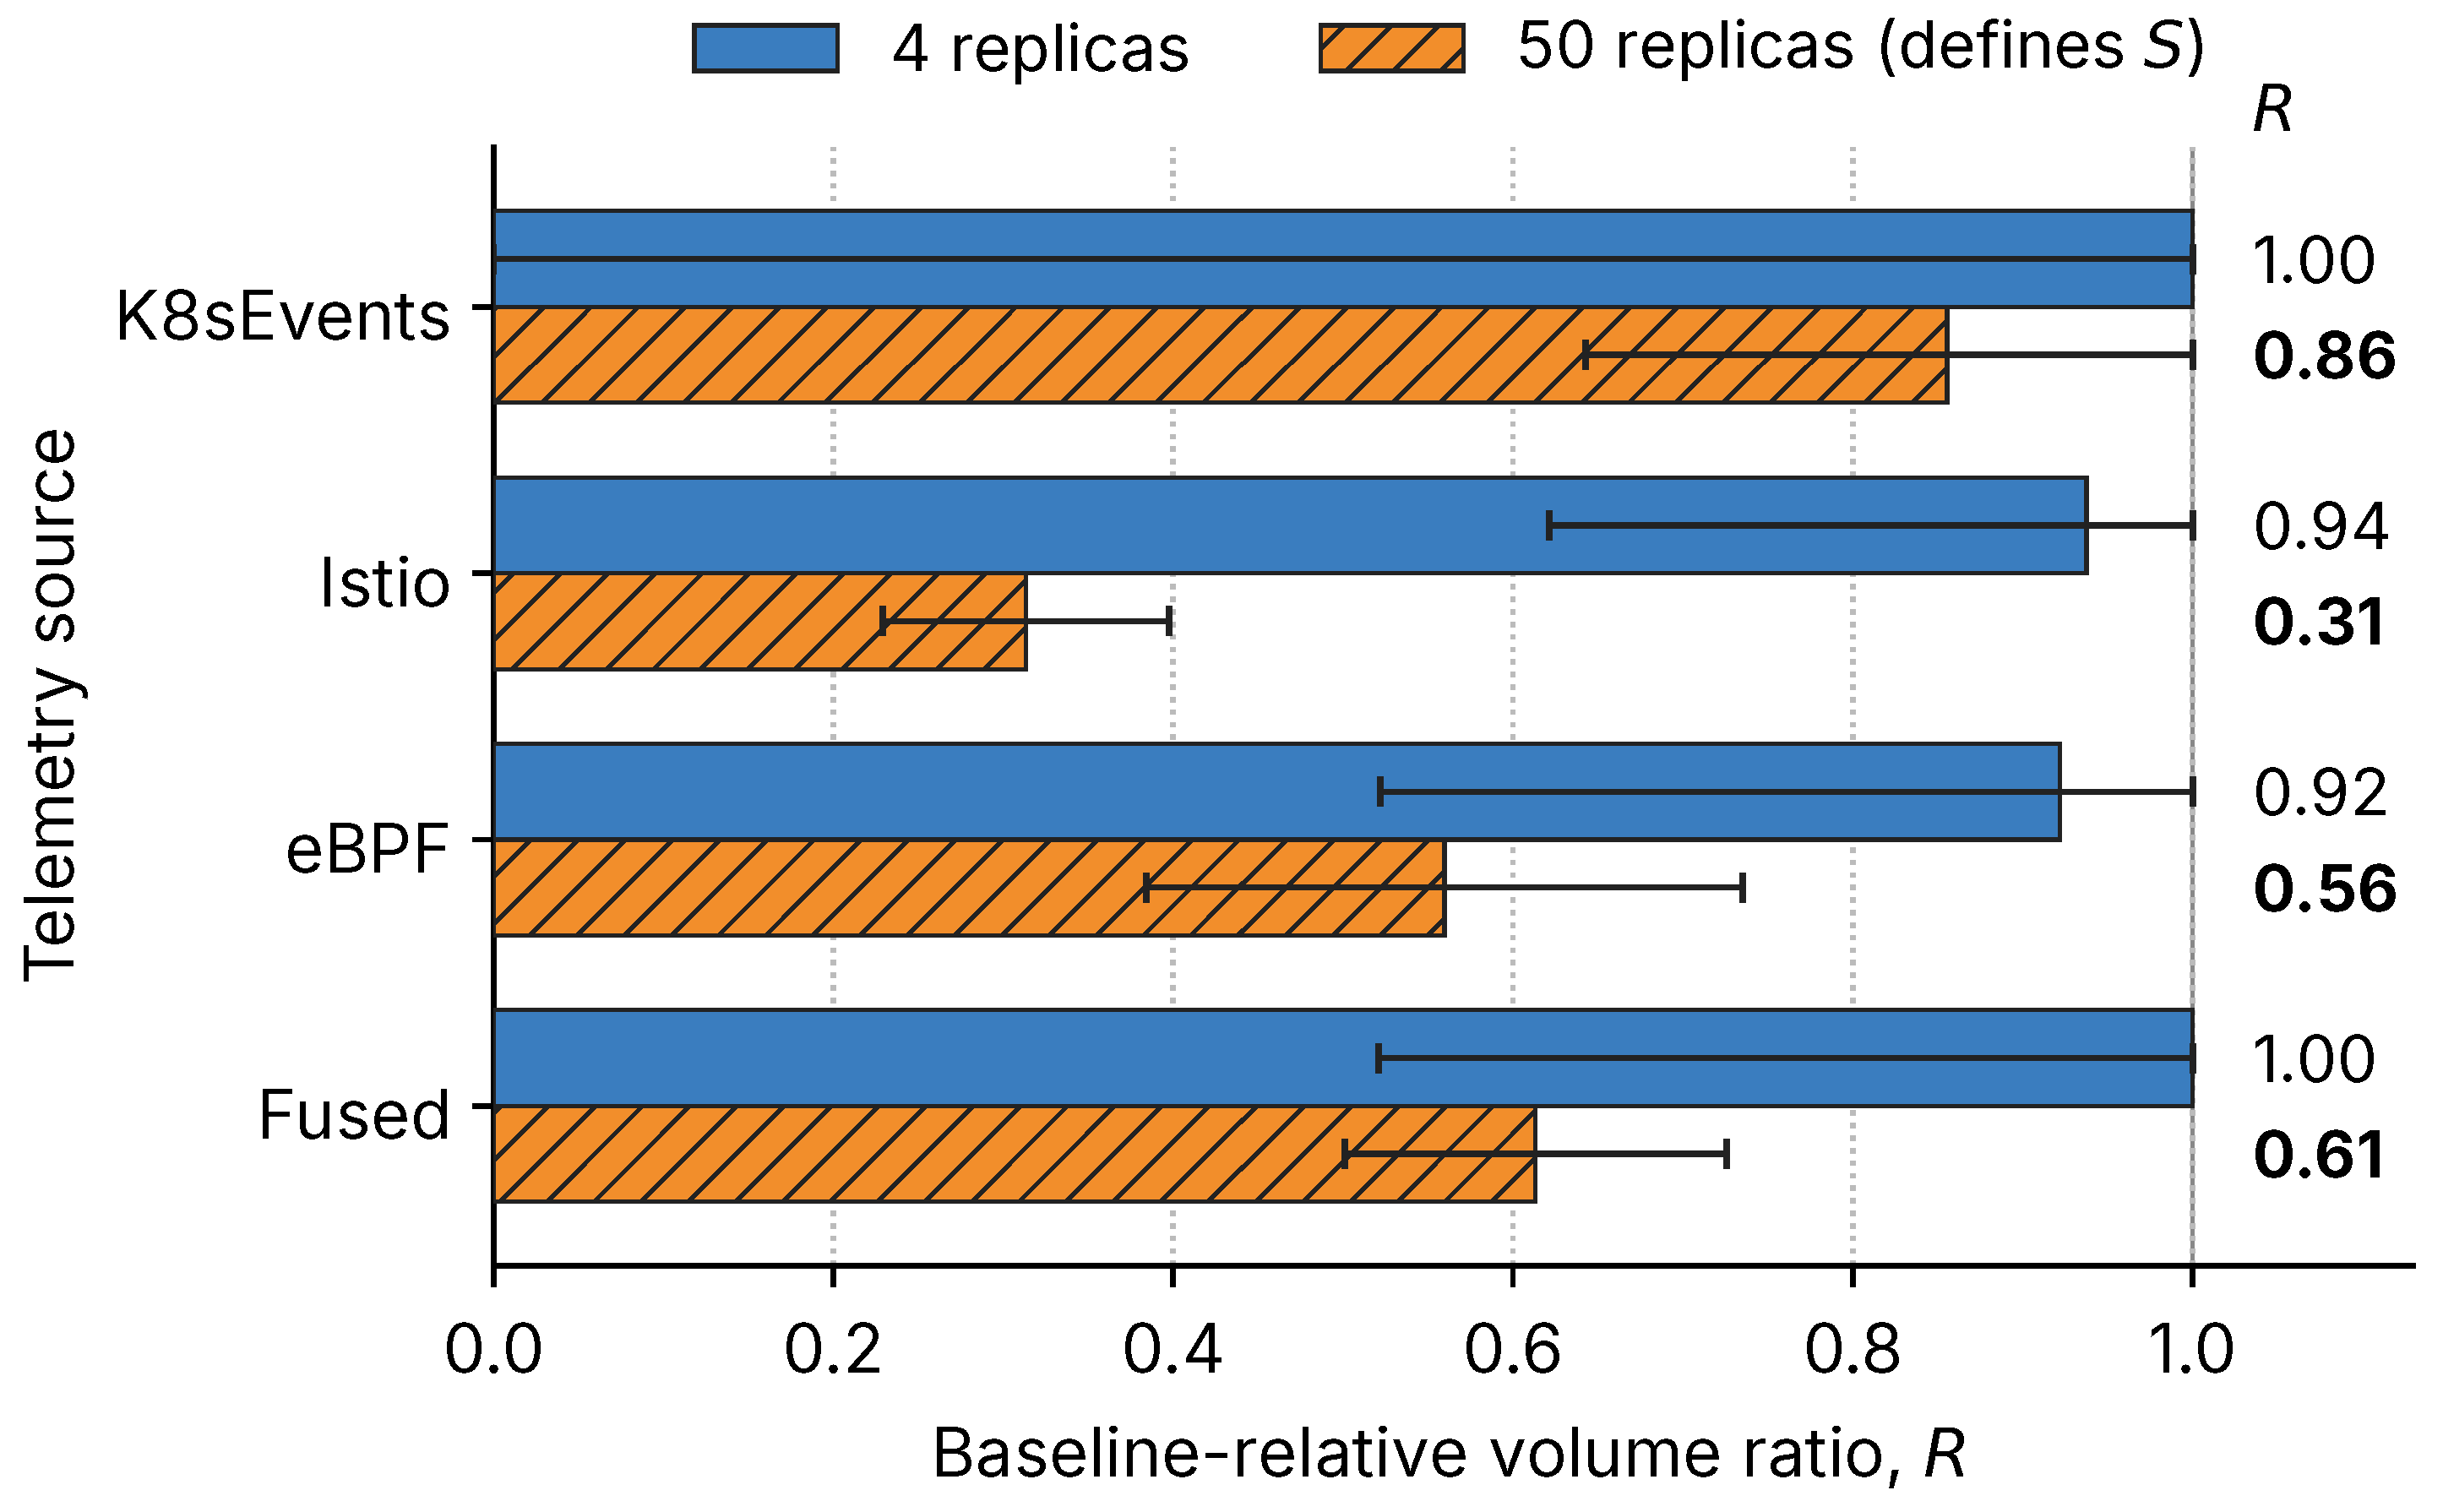

Table 1.
Experimental matrix ( trial attempts; 10 runs per cell; nginx:alpine with spec.replicas).
| Scenario | Action | ATT&CK technique | Collected | Scale (pods) | Runs/tier | RQ |
|---|---|---|---|---|---|---|
| Scenario_0AB | None (baseline) | — | K8sEvents, Istio | 4, 50, 100 | 10 | — |
| Scenario_0CD | None (baseline) | — | PCAP, eBPF | 4, 50, 100 | 10 | — |
| Scenario_A | Discovery probe | T1046 | K8sEvents, Istio | 4, 50, 100 | 10 | RQ1, RQ4 |
| Scenario_B | In-pod deletion | T1610 + T1609 | All four | 4, 50 | 10 | RQ2, RQ4 |
| Scenario_B | In-pod deletion | T1610 + T1609 | All four | 100 | 10† | RQ3 |
| Scenario_C | Token read and use | T1552.007 | PCAP, eBPF | 4, 50, 100 | 10 | RQ2 |
| Scenario_D | stress-ng pod | T1499.003 (approx.) | PCAP, eBPF | 4, 50, 100 | 10 | RQ2 |
† Excluded due to host capacity exhaustion (see Section 3.4 and Section 7.2).
Table 2.
Notation.
| Symbol | Definition |
|---|---|
| q | Source: K8sEvents, Istio, eBPF, or Fused (sum of sources) |
| s, | Scenario in ; tier in pods |
| n | Runs per cell () |
| Mean baseline record count for source q at tier | |
| , | Record count in run i; its ratio to |
| , | Mean and sample SD of the unclipped |
| Label set used for C (Table 3) |
Table 3.
Normalized labels, their raw source, and the label sets used for C.
| Label | Raw source | In for | Interpretation |
|---|---|---|---|
| K8S_PULLED, K8S_CREATED, K8S_STARTED, K8S_SCHEDULED, K8S_SUCCESSFULCREATE, K8S_SCALINGREPLICASET | Event object reason (normalizers for 0AB and A) | K8sEvents, Scenario A | Lifecycle steps of all workloads, not only the probe |
| K8S_KILLING | Event object, reason Killing | K8sEvents, Scenario A | Container termination |
| AUDIT_API_ACTION, AUDIT_API_BINDING | Event object (Scenario B normalizer), split on presence of an action field | K8sEvents, Scenario B | Event objects, not API requests; no baseline counterpart, so C undefined |
| MESH_SIGNAL | istiod log line passing a keyword filter | Istio, Scenario A | Control-plane log activity; Scenario B has no set (C undefined) |
| PROC_EXEC | Tetragon process_exec | eBPF, Scenarios B, C, D | Any process execution, mostly container start-up |
| TAMPER_FILE_DEL | process_exec whose binary path contains “rm” | eBPF, Scenario B | Observed only as /bin/rm at 4 replicas |
Excluded Event reasons: Unhealthy, Failed, Pulling, BackOff, FailedScheduling, FailedKillPod, FailedMount, LeaderElection, RegisteredNode. PCAP records are excluded from C.
Table 4.
Execution verification (runs with direct evidence of the scripted action, of 10) and share of K8sEvents records that are carry-over from earlier trials.
Table 4.
Execution verification (runs with direct evidence of the scripted action, of 10) and share of K8sEvents records that are carry-over from earlier trials.
| Evidence sought | 4p | 50p | 100p |
|---|---|---|---|
| A: Events for the run’s probe pod | 10 | 10 | 8 |
| B: rm in tamper pod | 10 | 0 | — |
| B: any tamper-pod process | 10 | 7 | — |
| C: cat of the token | 0 | 0 | 0 |
| C: any attacker-pod process | 0 | 9 | 0 |
| D: any stress-pod process | 0 | 0 | 0 |
| Carry-over share, K8sEvents, A | 0% | 0% | 3.7% |
| Carry-over share, K8sEvents, B | 78.1% | 37.5% | — |
| Carry-over share, K8sEvents, 0AB | 0% | 0% | 6.5% |
“—”: excluded due to host capacity exhaustion (Section 3.4).
Table 5.
Baseline record counts per run (; mean ± population SD), the denominators of all ratios.
| Source | 4p | 50p | 100p |
|---|---|---|---|
| K8sEvents | |||
| Istio | |||
| PCAP | |||
| eBPF/Tetragon | |||
| Fused (0AB) | |||
| Fused (0CD) |
Table 6.
R (± SD of unclipped ratios; 95% CI) and D per source, scenario, and scale ( runs per cell). Bold: or (heuristic references only).
Table 6.
R (± SD of unclipped ratios; 95% CI) and D per source, scenario, and scale ( runs per cell). Bold: or (heuristic references only).
| K8sEvents | Istio | eBPF | Fused | ||||||
|---|---|---|---|---|---|---|---|---|---|
| Scen. | Scale | R | D | R | D | R | D | R | D |
| A | 4p | 1.00±0.11 [1.00, 1.00] |
0.927 | 1.00±0.00 [1.00, 1.00] |
1.000 | — | — | 1.00±0.06 [1.00, 1.00] |
0.956 |
| A | 50p | 0.97±0.11 [0.94, 1.00] |
0.895 | 1.00±0.01 [1.00, 1.00] |
0.992 | — | — | 0.98±0.07 [0.96, 1.00] |
0.934 |
| A | 100p |
0.68±0.20 [0.54, 0.82] |
0.713 |
0.74±0.31 [0.58, 0.91] |
0.609 | — | — |
0.71±0.20 [0.56, 0.85] |
0.717 |
| B | 4p | 1.00±3.40 [1.00, 1.00] |
0.452 | 0.94±0.32 [0.80, 1.00] |
0.752 | 0.92±0.40 [0.74, 1.00] |
0.705 | 1.00±0.48 [1.00, 1.00] |
0.754 |
| B | 50p | 0.86±0.21 [0.74, 0.97] |
0.764 |
0.31±0.08 [0.25, 0.37] |
0.731 |
0.56±0.18 [0.43, 0.69] |
0.686 |
0.61±0.11 [0.53, 0.69] |
0.817 |
| B | 100p | —† | —† | —† | —† | —† | —† | —† | —† |
| C | 4p | — | — | — | — |
0.57±0.00 [0.57, 0.57] |
1.000 |
0.73±0.00 [0.73, 0.73] |
1.000 |
| C | 50p | — | — | — | — |
0.42±0.05 [0.39, 0.46] |
0.879 |
0.44±0.05 [0.41, 0.48] |
0.889 |
| C | 100p | — | — | — | — |
0.55±0.00 [0.55, 0.55] |
0.993 |
0.56±0.00 [0.56, 0.56] |
0.994 |
| D | 4p | — | — | — | — |
0.61±0.18 [0.52, 0.71] |
0.713 |
0.76±0.11 [0.70, 0.82] |
0.855 |
| D | 50p | — | — | — | — |
0.43±0.00 [0.43, 0.43] |
0.999 |
0.45±0.00 [0.45, 0.45] |
0.999 |
| D | 100p | — | — | — | — |
0.55±0.00 [0.55, 0.55] |
0.994 |
0.56±0.00 [0.56, 0.56] |
0.994 |
R per Equation (1); “±” is the SD of the unclipped ratios; intervals are t intervals over per-run clipped ratios, truncated to . D per Equation (2). “—”: source not collected or no standalone metric (PCAP). † Excluded due to host capacity exhaustion (Section 3.4 and Section 7.2). Scenario B K8sEvents values are dominated by carry-over (Table 4); the scripted actions of Scenarios C and D were not recorded, so their values describe ambient process activity.
Table 7.
Host resources during four-collector capture (Scenario B, 100 replicas; ; mean ± SD). Reference: 8 vCPUs; 16,384 MB.
Table 7.
Host resources during four-collector capture (Scenario B, 100 replicas; ; mean ± SD). Reference: 8 vCPUs; 16,384 MB.
| Phase | Load | Mem. MB | Mem. % |
|---|---|---|---|
| Deploy (0–15 s) | 90.5 | ||
| Expansion (15–60 s) | 91.3 | ||
| Steady/capacity (60–90 s) | 91.5 | ||
| Full window | 91.3 |
Disclaimer/Publisher’s Note: The statements, opinions and data contained in all publications are solely those of the individual author(s) and contributor(s) and not of MDPI and/or the editor(s). MDPI and/or the editor(s) disclaim responsibility for any injury to people or property resulting from any ideas, methods, instructions or products referred to in the content. |
© 2026 by the authors. Licensee MDPI, Basel, Switzerland. This article is an open access article distributed under the terms and conditions of the Creative Commons Attribution (CC BY) license (http://creativecommons.org/licenses/by/4.0/).
Copyright: This open access article is published under a Creative Commons CC BY 4.0 license, which permit the free download, distribution, and reuse, provided that the author and preprint are cited in any reuse.