

Submitted:
21 October 2026
Posted:
22 October 2026
You are already at the latest version
Abstract
Background and Objectives: Kidney dysfunction has been associated with arterial stiffening, but the relationship may depend on shared cardiometabolic and haemody-namic factors. This study examined the association between estimated glomerular fil-tration rate (eGFR) and local carotid arterial stiffness in adults with a high prevalence of diabetes and hypertension. Materials and Methods: This single-centre cross-sectional study included 135 adults. Local carotid pulse wave velocity derived from the beta stiffness index (PWVβ) was the primary outcome. Secondary outcomes were the beta stiffness index, pressure–strain elastic modulus, arterial compliance, and augmentation index. Multivariable linear regression evaluated associations with eGFR, age, sex, dia-betes, and hypertension. Separate models replaced hypertension status with peripheral or central aortic systolic blood pressure. Results: Mean age was 57.4 ± 7.4 years, and mean eGFR was 83.3 ± 20.0 mL/min/1.73 m². PWVβ differed across the four diabetes–hypertension groups (p < 0.001). In the primary model, based on 117 participants, higher PWVβ was associated with age, diabetes, and hypertension. There was no evidence of an independent association between eGFR and PWVβ (B = −0.003 per mL/min/1.73 m²; 95% confidence interval, −0.014 to 0.009; p = 0.676). eGFR was also not associated with the secondary outcomes. Peripheral and central aortic systolic blood pressure were positively associated with PWVβ in separate adjusted models. Conclusion: In this cardiometabolic risk population, eGFR was not independently associated with local carotid arterial stiffness. Age, diabetes, and blood pressure were associated with higher PWVβ. The findings concern contemporaneous associations and should not be extrapolated to ad-vanced chronic kidney disease or interpreted as excluding a longitudinal relationship between kidney function and vascular stiffness.
Keywords:
arterial stiffness
; estimated glomerular filtration rate
; carotid artery
; pulse wave velocity
; diabetes mellitus
; hypertension
; cardiometabolic risk
1. Introduction
Kidney dysfunction and cardiovascular disease share several risk factors, yet their relationship is not fully explained by diabetes, hypertension, or ageing alone. Chronic kidney disease (CKD) is defined by abnormalities of kidney structure or function that persist for at least three months, with classification incorporating both glomerular filtration rate and markers of kidney damage [1]. Estimated glomerular filtration rate (eGFR) provides a practical measure of filtration, but a single creatinine-based estimate neither establishes chronicity nor captures all forms of kidney injury. The 2021 Chronic Kidney Disease Epidemiology Collaboration (CKD-EPI) equation estimates filtration from serum creatinine, age, and sex without a race coefficient [2]. Understanding how this estimate relates to vascular properties is relevant to the assessment of patients in whom kidney and cardiometabolic risk factors coexist.
Arterial stiffness is a potential link between kidney dysfunction and cardiovascular injury. Reduced arterial elasticity increases pulsatile load and modifies the interaction between blood pressure, arterial diameter, and blood flow. Regional stiffness is commonly assessed by carotid–femoral pulse wave velocity, whereas local ultrasound measurements combine arterial diameter changes with pressure information to characterise the mechanics of a specific arterial segment [3]. Local carotid measurements include the beta stiffness index (BSI), pressure–strain elastic modulus (Ep), arterial compliance (AC), and local pulse wave velocity derived from BSI (PWVβ). These measures are related but are not interchangeable with regional pulse wave velocity. Their clinical relevance is supported by prospective associations between local carotid elastic properties and cardiovascular events and mortality [4].
Previous studies support an association between kidney impairment and vascular stiffening, although the findings depend on the population and measurement method. Briet et al. reported greater aortic stiffness and vascular remodelling in mild-to-moderate CKD, while differences in local carotid properties were less consistent [5]. Makita et al. found higher carotid BSI in participants with CKD defined by reduced eGFR and/or proteinuria after adjustment for conventional cardiovascular risk factors [6]. In the Rotterdam Study, arterial stiffness measures were associated with subsequent kidney-function decline and incident CKD [7]. Diabetes and blood pressure also contribute substantially to vascular variation: studies in diabetes have linked aortic stiffness to age, pressure, albuminuria, and kidney function, and have identified vascular effects of diabetes and renal failure [8,9].
Longitudinal evidence from ELSA-Brasil and the Vitamin D Assessment cohort further associates arterial stiffness with future CKD [10,11]. These studies address prognosis, however, and do not establish how strongly eGFR and local carotid stiffness should correlate at a single visit in patients with substantial cardiometabolic comorbidity. In such patients, shared determinants may account for an apparent kidney–vascular association, and a creatinine-based filtration estimate may provide different information from local arterial measurements. We therefore examined the association between eGFR and local carotid PWVβ in adults with a high prevalence of diabetes and hypertension, with adjustment for age, sex, and clinical or measured haemodynamic factors. Secondary analyses examined other carotid vascular indices and differences among groups defined by diabetes and hypertension. We hypothesised that lower eGFR would be associated with higher PWVβ after adjustment for these factors.
2. Materials and Methods
2.1. Study Design and Participants
This single-centre, observational, cross-sectional study was conducted at the Clinic of Internal Diseases, St. Marina University Hospital, Varna, Bulgaria, from October 2018, after ethics approval on 25 October 2018, to September 2019. Adults undergoing clinical and vascular assessment were eligible when demographic and clinical information and technically valid local carotid stiffness measurements on both sides were available. Exclusion criteria were uncontrolled arterial hypertension, atrial fibrillation, treatment with vitamin K antagonists, chronic dialysis, use of vitamin K2 and/or vitamin D supplements, systemic glucocorticoid therapy, and active malignancy. Participants with available diabetes and hypertension information were assigned to four mutually exclusive groups: neither condition, diabetes alone, hypertension alone, or both conditions. The primary objective was to assess the adjusted association between eGFR and PWVβ; comparisons between clinical groups and analyses of BSI, Ep, AC, and augmentation index (AI) were secondary.
The study was approved by the Institutional Ethics Committee of the Medical University of Varna (approval no. 78, 25 October 2018) and was conducted in accordance with the Declaration of Helsinki. Written informed consent was obtained from all participants.
2.2. Clinical Assessment and Blood Pressure Measurements
Age, sex, diabetes status, diabetes duration, hypertension, and clinically documented diabetic nephropathy were recorded using a standardised questionnaire. Body mass index (BMI) was calculated as weight in kilograms divided by height in metres squared. Waist circumference was measured midway between the iliac crest and the lowest rib with the participant standing. Peripheral systolic blood pressure (SBP), diastolic blood pressure (DBP), and heart rate were measured three times at one-minute intervals, and mean values were calculated. Central aortic systolic pressure was estimated non-invasively using an A-Pulse CASP-AL device (HealthSTATS International). A radial artery sensor recorded the pulse waveform, from which the device derived central aortic systolic pressure. Peripheral and central pressure were treated as separate haemodynamic exposures in the statistical analyses.
2.3. Laboratory Assessment and Kidney Function
Fasting venous blood samples were obtained, and serum creatinine was measured using the Jaffé method. For the present analysis, eGFR was recalculated from the recorded serum creatinine, age, and sex using the 2021 CKD-EPI creatinine equation [2], expressed in mL/min/1.73 m2, and analysed as a continuous variable. Only one eGFR value per participant was available for this cross-sectional analysis. Accordingly, a single reduced eGFR value was not used to diagnose CKD, which requires persistent abnormalities of kidney structure or function [1]. Clinically documented diabetic nephropathy was described separately and was not treated as equivalent to a CKD classification based on the study measurements.
2.4. Local Carotid Vascular Assessment
Local carotid vascular properties were assessed bilaterally by one trained examiner using an Aloka Hitachi ProSound α7 ultrasound system with a high-frequency linear transducer. Participants were supine, with the neck extended and rotated approximately 30° away from the examined side. The common carotid artery was imaged longitudinally approximately 2 cm proximal to the bifurcation, with the insonation plane adjusted to visualise both arterial walls clearly. Electrocardiography-gated echo-tracking recorded changes in arterial diameter over six consecutive cardiac cycles. Measured systolic and diastolic pressures were entered into the vascular analysis software, which generated BSI, Ep, AC, AI, and PWVβ. Higher BSI, Ep, and PWVβ and lower AC were interpreted as indicating less compliant local arterial behaviour. AI was considered separately because it also reflects wave reflection and haemodynamic influences. All included participants had valid measurements on both sides. The arithmetic mean of the right- and left-sided values was used to obtain participant-level values, and paired side comparisons were reported as a descriptive assessment.
2.5. Statistical Analysis
The primary outcome was participant-level local carotid PWVβ; BSI, Ep, AC, and AI were secondary outcomes. Continuous variables are reported as mean ± standard deviation (SD), and categorical variables as counts and percentages with available-case denominators. Right- and left-sided measurements were compared using paired-samples t-tests or Wilcoxon signed-rank tests, as appropriate. Clinical groups were compared using Welch’s one-way analysis of variance, followed by Games–Howell comparisons when the overall test was significant. Categorical comparisons used the chi-square test or Fisher’s exact test, as appropriate. Spearman correlations were used to examine relationships among vascular indices and, in participants with diabetes and available duration data, associations with diabetes duration.
The primary multivariable linear regression model included eGFR, age, sex, diabetes, and hypertension. Corresponding models were fitted for each secondary vascular outcome. Female sex, absence of diabetes, and absence of hypertension were the reference categories. Two additional PWVβ models replaced hypertension status with peripheral SBP or central aortic SBP while retaining eGFR, age, sex, and diabetes. Peripheral and central pressures were not entered simultaneously. Results are reported as unstandardised regression coefficients (B), 95% confidence intervals (CIs), and p-values; pressure coefficients are expressed per 10-mmHg increase. The adjusted peripheral SBP–PWVβ relationship was plotted by diabetes status using a model with main effects only, without a pressure-by-diabetes interaction. Consequently, the model estimates a common pressure slope for the two diabetes groups.
Residual plots and residual distributions were examined to assess model assumptions, and multicollinearity was evaluated using variance inflation factors and tolerance values. Missing values were not imputed; each regression used participants with complete data for the variables in that model. Model sample sizes and R2 values are reported separately. All tests were two-sided, with p < 0.05 considered statistically significant. Secondary outcomes and additional models were interpreted as supportive analyses rather than independent confirmation of the primary hypothesis. Analyses were performed using jamovi, version 2.6.44, and adjusted predictions were generated with the GAMLj module.
3. Results
3.1. Participant Characteristics
The study included 135 participants. Mean age was 57.4 ± 7.4 years among 132 participants with age data, and 68 of 132 participants with recorded sex were women (51.5%). Diabetes was present in 102 of 135 participants (75.6%), hypertension in 101 of 130 with available information (77.7%), and documented diabetic nephropathy in 5 of 100 participants with diabetes and available nephropathy information (5.0%). Mean eGFR was 83.3 ± 20.0 mL/min/1.73 m2 among 121 participants. Of the 130 participants who could be classified by diabetes and hypertension, 13 had neither condition, 16 had diabetes alone, 17 had hypertension alone, and 84 had both. Sex distribution was similar across the four groups (p = 0.958). Age, eGFR, and central aortic SBP did not differ significantly, whereas BMI, waist circumference, and peripheral SBP did (Table 1).
Participants with both diabetes and hypertension had a higher BMI than those with neither condition (mean difference, 5.79 kg/m2; p = 0.039) or diabetes alone (4.63 kg/m2; p = 0.034), and a greater waist circumference than those with neither condition (16.99 cm; p = 0.019). Peripheral SBP was higher in the hypertension-only group (mean difference, 12.74 mmHg; p = 0.030) and the combined group (10.10 mmHg; p = 0.037) than in participants with neither condition. These differences describe the clinical context of the vascular comparisons and indicate that the diagnostic groups also differed in anthropometric and haemodynamic characteristics.
3.2. Local Carotid Vascular Indices by Clinical Group
Paired comparisons did not identify systematic right–left differences for BSI, Ep, AC, AI, or PWVβ (all p ≥ 0.319). In participant-level analyses, BSI, Ep, and PWVβ differed across the four clinical groups: Welch’s F(3, 31.8) = 9.90, F(3, 33.0) = 13.16, and F(3, 29.8) = 12.50, respectively (all p < 0.001). AC and AI did not differ significantly (p = 0.108 and p = 0.211). Mean PWVβ was 5.98 ± 0.70 in participants with neither condition, 6.82 ± 1.34 in those with diabetes alone, 6.67 ± 1.03 in those with hypertension alone, and 7.50 ± 1.22 in those with both conditions. Complete estimates are presented in Table 2, and the PWVβ distributions are shown in Figure 1.
Games–Howell comparisons showed higher PWVβ in the combined diabetes–hypertension group than in participants with neither condition (mean difference, 1.524; p < 0.001) or hypertension alone (0.828; p = 0.033). The difference from the diabetes-only group was not statistically significant (p = 0.290). BSI and Ep showed similar pairwise patterns. The nonsignificant comparison between the combined and diabetes-only groups does not establish equivalent vascular properties, particularly given the small diabetes-only subgroup.
3.3. Adjusted Associations with Local Carotid Stiffness
The primary PWVβ model included 117 participants and explained 22.2% of the outcome variance. eGFR was not independently associated with PWVβ (B = −0.003 per mL/min/1.73 m2; 95% CI, −0.014 to 0.009; p = 0.676). Higher PWVβ was associated with age (B = 0.035 per year; 95% CI, 0.001 to 0.068; p = 0.043), diabetes (B = 0.897; 95% CI, 0.348 to 1.447; p = 0.002), and hypertension (B = 0.631; 95% CI, 0.075 to 1.187; p = 0.026), whereas sex was not associated with the outcome (p = 0.793). In the peripheral SBP model, each 10-mmHg higher pressure was associated with 0.413 higher PWVβ (95% CI, 0.285 to 0.542; p < 0.001). Age and diabetes remained associated with PWVβ, but eGFR and sex did not. This model included 117 participants and had an R2 of 0.404. The central aortic SBP model included 98 participants and had an R2 of 0.299; the corresponding pressure coefficient was 0.333 per 10 mmHg (95% CI, 0.162 to 0.503; p < 0.001), with age and diabetes again associated with higher PWVβ. All three models are shown in Table 3.
The adjusted peripheral SBP–PWVβ relationship by diabetes status is illustrated in Figure 2. The parallel fitted lines reflect the specified main-effects model and do not constitute a test of whether diabetes modifies the pressure association. The peripheral and central pressure models were fitted to different samples, so their R2 values were not used to rank the two pressure measures. Across models for secondary outcomes, eGFR was not independently associated with BSI, Ep, AC, or AI. Diabetes was associated with higher BSI and Ep and lower AC and AI; age with higher BSI, Ep, and AI; hypertension with higher Ep; and male sex with higher AC and lower AI. Full secondary-model estimates are provided in Table S1. Variance inflation factors ranged from 1.05 to 1.36.
3.4. Diabetes Duration and Correlations Among Vascular Indices
Among 96 participants with available diabetes duration, duration was not significantly correlated with BSI (Spearman’s ρ = 0.159; p = 0.123), Ep (ρ = 0.193; p = 0.060), AC (ρ = −0.068; p = 0.512), AI (ρ = 0.008; p = 0.941), or PWVβ (ρ = 0.177; p = 0.084). BSI, Ep, and PWVβ were strongly positively correlated (ρ = 0.927–0.986; all p < 0.001), and AC was inversely correlated with these measures (ρ = −0.734 to −0.740; all p < 0.001). AI was not significantly correlated with the other indices. The full correlation matrix, including available sample sizes, is provided in Table S2.
4. Discussion
The principal finding was the absence of evidence for an independent cross-sectional association between eGFR and local carotid PWVβ in a population with a high prevalence of diabetes and hypertension and a mean eGFR of approximately 83 mL/min/1.73 m2. The eGFR estimate was close to zero in the primary model and remained nonsignificant when hypertension status was replaced by peripheral or central aortic SBP. Secondary analyses also showed no adjusted association between eGFR and BSI, Ep, AC, or AI. By contrast, age, diabetes, and pressure-related variables were associated with higher PWVβ. These findings describe associations conditional on the measured covariates; they do not demonstrate that kidney function is biologically unrelated to arterial stiffness or that the observed cardiometabolic associations are causal.
The findings must be considered alongside the different kidney and vascular phenotypes examined in previous work. Studies in established CKD have reported higher aortic or carotid stiffness, but have not shown uniform changes across all local arterial properties [5,6]. Makita et al. used a CKD definition incorporating reduced eGFR and/or proteinuria, whereas the present study examined a single continuous filtration estimate without albuminuria-based classification [6]. In type 2 diabetes without overt renal impairment, Smith et al. found that aortic stiffness was related to filtration and albuminuria, with age and blood pressure strongly influencing the observed relationships [8]. Thus, an eGFR association may depend on the range of kidney function, inclusion of kidney-damage markers, arterial segment, and adjustment strategy. A modest sample centred on relatively preserved filtration may not resolve associations that emerge across a broader spectrum of kidney disease.
The distinction between cross-sectional association and longitudinal prognosis is equally important. The Rotterdam Study linked arterial stiffness to subsequent kidney-function decline [7], and both ELSA-Brasil and the Vitamin D Assessment cohort reported associations between higher stiffness and incident CKD [10,11]. Contrary to a null cross-sectional association, these results concern whether baseline vascular properties precede later kidney outcomes. Differences in timing, outcome ascertainment, and stiffness methods mean that the two types of evidence need not conflict. The present study cannot test whether local carotid stiffness predicts future filtration loss, nor whether declining kidney function accelerates vascular change. Repeated kidney and vascular measurements would be required to address those questions.
Diabetes showed a consistent association with less favourable local mechanical properties: higher PWVβ, BSI, and Ep and lower AC. This pattern is compatible with previous evidence of vascular effects of diabetes and renal failure [9], but it should not be interpreted as establishing a mechanism in this cohort. The highest mean PWVβ occurred in participants with both diabetes and hypertension, while the small diabetes-only and hypertension-only groups limited the precision of comparisons between individual diagnostic categories. The absence of significant correlations with diabetes duration also does not exclude an influence of cumulative glycaemic exposure. Recorded duration may not capture the onset of metabolic disease, and the models did not incorporate long-term glycaemic control or treatment history. The lower adjusted AI in participants with diabetes requires separate interpretation because AI is influenced by wave reflection and haemodynamics as well as local arterial properties.
The pressure associations require particular caution because blood pressure was both an explanatory variable and an input to the device-derived stiffness calculations. Pressure-dependent arterial mechanics and shared calculation inputs may therefore contribute to the association between SBP and PWVβ; its statistical strength should not be treated as independent mechanistic evidence. The pressure models estimate associations after accounting for age, sex, eGFR, and diabetes, but do not establish that lowering pressure would produce the observed cross-sectional difference in stiffness. In addition, replacing hypertension status with pressure changes the question addressed by the model. A binary diagnosis reflects a history of disease, whereas measured pressure reflects conditions at assessment. The central-pressure model used fewer participants, precluding a direct ranking of peripheral and central pressure from their R2 values.
The close correlations among BSI, Ep, PWVβ, and AC are consistent with their shared pressure–diameter information. They therefore provide related descriptions of arterial behaviour rather than independent replications of a vascular finding. AI behaved differently, reinforcing the need to distinguish wave-reflection measures from measures of local wall elasticity [3]. Likewise, locally calculated PWVβ should not be equated with directly measured carotid–femoral pulse wave velocity. Clinically, the results suggest that eGFR and local carotid measurements describe different aspects of the kidney–vascular phenotype in this sample. They do not establish added prognostic value for carotid assessment, justify screening recommendations, or support replacing established kidney-function and kidney-damage measurements with vascular indices.
Strengths include bilateral carotid assessment, examination of several related vascular indices, and explicit separation of models based on hypertension status from those using measured pressure. Nevertheless, the single-centre cross-sectional design limits generalisability and prevents conclusions about temporal direction. The sample was dominated by participants with both diabetes and hypertension, and the smaller comparison groups produced imprecise contrasts. Kidney assessment relied on one creatinine-based eGFR value, without measured GFR, cystatin C, or albuminuria in the analysis. This prevented confirmation of chronicity and identification of kidney damage among participants with preserved filtration. Because age and sex also enter the eGFR equation, the adjusted eGFR coefficient represents its association conditional on those variables rather than the overall unadjusted relationship between filtration estimates and vascular ageing.
Missing observations reduced the sample from 135 enrolled participants to 117 in the primary regression and 98 in the central-pressure model. Complete-case analysis may introduce selection bias when missingness is related to the variables of interest. Residual confounding also remains possible because the models did not include adiposity despite differences in BMI and waist circumference between clinical groups, or smoking, lipids, glycated haemoglobin, heart rate, cardiovascular history, and relevant medication exposures. Several related outcomes and additional models were examined, so secondary findings should be interpreted cautiously. The reported low variance inflation factors do not eliminate residual confounding, measurement error, or misspecification of the exposure–outcome relationship. Finally, a single examiner performed the ultrasound assessments, but repeatability estimates were not available for this analysis; nonsignificant side comparisons do not establish measurement reproducibility. Larger longitudinal studies with repeated renal assessments, albuminuria, detailed treatment information, and reproducible vascular measurements are needed to determine whether local carotid indices offer prognostic information beyond established risk factors.
5. Conclusions
In adults with a high prevalence of cardiometabolic risk factors, eGFR was not independently associated with local carotid PWVβ or the other evaluated vascular indices. Age, diabetes, hypertension, and measured systolic pressure were associated with higher PWVβ in the respective adjusted models. These findings support cautious interpretation of contemporaneous kidney–vascular associations and do not exclude a relationship across a broader range of kidney function or over time. Prospective studies incorporating repeated filtration estimates and markers of kidney damage are needed before local carotid stiffness can be assigned a role in kidney-risk prediction.
Supplementary Materials
The following supporting information can be downloaded at the website of this paper posted on Preprints.org, Table S1: Multivariable linear regression models for secondary local carotid vascular indices; Table S2: Spearman correlations among diabetes duration and local carotid vascular indices.
Author Contributions
Conceptualization, E.M. and R.S.; methodology, E.M. and R.S.; validation, M.B.-P.; formal analysis, E.M. and R.S.; investigation, E.M. and M.D.; data curation, E.M. and R.S.; writing—original draft preparation, M.B.-P.; writing—review and editing, E.M., M.B.-P., R.S. and M.D.; visualization, R.S.; supervision, M.B.-P.; project administration, M.B.-P. and M.D. All authors have read and agreed to the published version of the manuscript.
Funding
This research received no external funding.
Institutional Review Board Statement
The study was conducted in accordance with the Declaration of Helsinki and approved by the Institutional Ethics Committee of the Medical University of Varna (approval no. 78, 25 October 2018).
Informed Consent Statement
Written informed consent was obtained from all participants involved in the study.
Data Availability Statement
The data supporting the findings of this study are available from the corresponding author upon reasonable request.
Conflicts of Interest
The authors declare no conflicts of interest.
Abbreviations
The following abbreviations are used in this manuscript:
| AC | Arterial compliance |
| AI | Augmentation index |
| BMI | Body mass index |
| BSI | Beta stiffness index |
| CI | Confidence interval |
| CKD | Chronic kidney disease |
| CKD-EPI | Chronic Kidney Disease Epidemiology Collaboration |
| DBP | Diastolic blood pressure |
| eGFR | Estimated glomerular filtration rate |
| Ep | Pressure–strain elastic modulus |
| GFR | Glomerular filtration rate |
| PWVβ | Local pulse wave velocity derived from the beta stiffness index |
| SBP | Systolic blood pressure |
| SD | Standard deviation |
References
- Kidney Disease: Improving Global Outcomes CKD Work Group. KDIGO 2024 Clinical Practice Guideline for the Evaluation and Management of Chronic Kidney DiseaseKidney Disease: Improving Global Outcomes CKD Work Group. KDIGO 2024 Clinical Practice Guideline for the Evaluation and Management of Chronic Kidney Disease. Kidney Int. 2024;105(4 Suppl):S117-S314. [CrossRef]
- Inker LA, Eneanya ND, Coresh J, Tighiouart H, Wang D, Sang Y, et al. New creatinine- and cystatin C-based equations to estimate GFR without race. N Engl J Med. 2021;385(19):1737-1749. [CrossRef]
- Townsend RR, Wilkinson IB, Schiffrin EL, Avolio AP, Chirinos JA, Cockcroft JR, et al. Recommendations for improving and standardizing vascular research on arterial stiffness: a scientific statement from the American Heart Association. Hypertension. 2015;66(3):698-722. [CrossRef]
- van Sloten TT, Schram MT, van den Hurk K, Dekker JM, Nijpels G, Henry RMA, et al. Local stiffness of the carotid and femoral artery is associated with incident cardiovascular events and all-cause mortality: the Hoorn Study. J Am Coll Cardiol. 2014;63(17):1739-1747. [CrossRef]
- Briet M, Bozec E, Laurent S, Fassot C, London GM, Jacquot C, et al. Arterial stiffness and enlargement in mild-to-moderate chronic kidney disease. Kidney Int. 2006;69(2):350-357. [CrossRef]
- Makita S, Abiko A, Naganuma Y, Nagai M, Nakamura M. Chronic kidney disease is associated with increased carotid artery stiffness without morphological changes in participants of health check-up programs. Atherosclerosis. 2010;213(1):306-310. [CrossRef]
- Sedaghat S, Mattace-Raso FUS, Hoorn EJ, Uitterlinden AG, Hofman A, Ikram MA, et al. Arterial stiffness and decline in kidney function. Clin J Am Soc Nephrol. 2015;10(12):2190-2197. [CrossRef]
- Smith A, Karalliedde J, De Angelis L, Goldsmith D, Viberti G. Aortic pulse wave velocity and albuminuria in patients with type 2 diabetes. J Am Soc Nephrol. 2005;16(4):1069-1075. [CrossRef]
- Aoun S, Blacher J, Safar ME, Mourad JJ. Diabetes mellitus and renal failure: effects on large artery stiffness. J Hum Hypertens. 2001;15(10):693-700. [CrossRef]
- Cândido J, Camelo LDV, Brant L, Cunha RS, Mill JG, Barreto SM. Higher arterial stiffness predicts chronic kidney disease in adults: the ELSA-Brasil cohort study. Arq Bras Cardiol. 2023;120(12):e20230409. [CrossRef]
- Beros A, Sluyter J, Hughes A, Hametner B, Wassertheurer S, Scragg R. Arterial stiffness and incident chronic kidney disease: a large population-based cohort study. J Nephrol. 2024;37(5):1241-1250. [CrossRef]
Figure 1.
Distribution of local carotid pulse wave velocity derived from the beta stiffness index (PWVβ) across the four clinical groups. Boxes indicate the interquartile range, horizontal lines indicate medians, and whiskers extend to observations within 1.5 interquartile ranges of the box limits. Points represent individual participants.
Figure 1.
Distribution of local carotid pulse wave velocity derived from the beta stiffness index (PWVβ) across the four clinical groups. Boxes indicate the interquartile range, horizontal lines indicate medians, and whiskers extend to observations within 1.5 interquartile ranges of the box limits. Points represent individual participants.
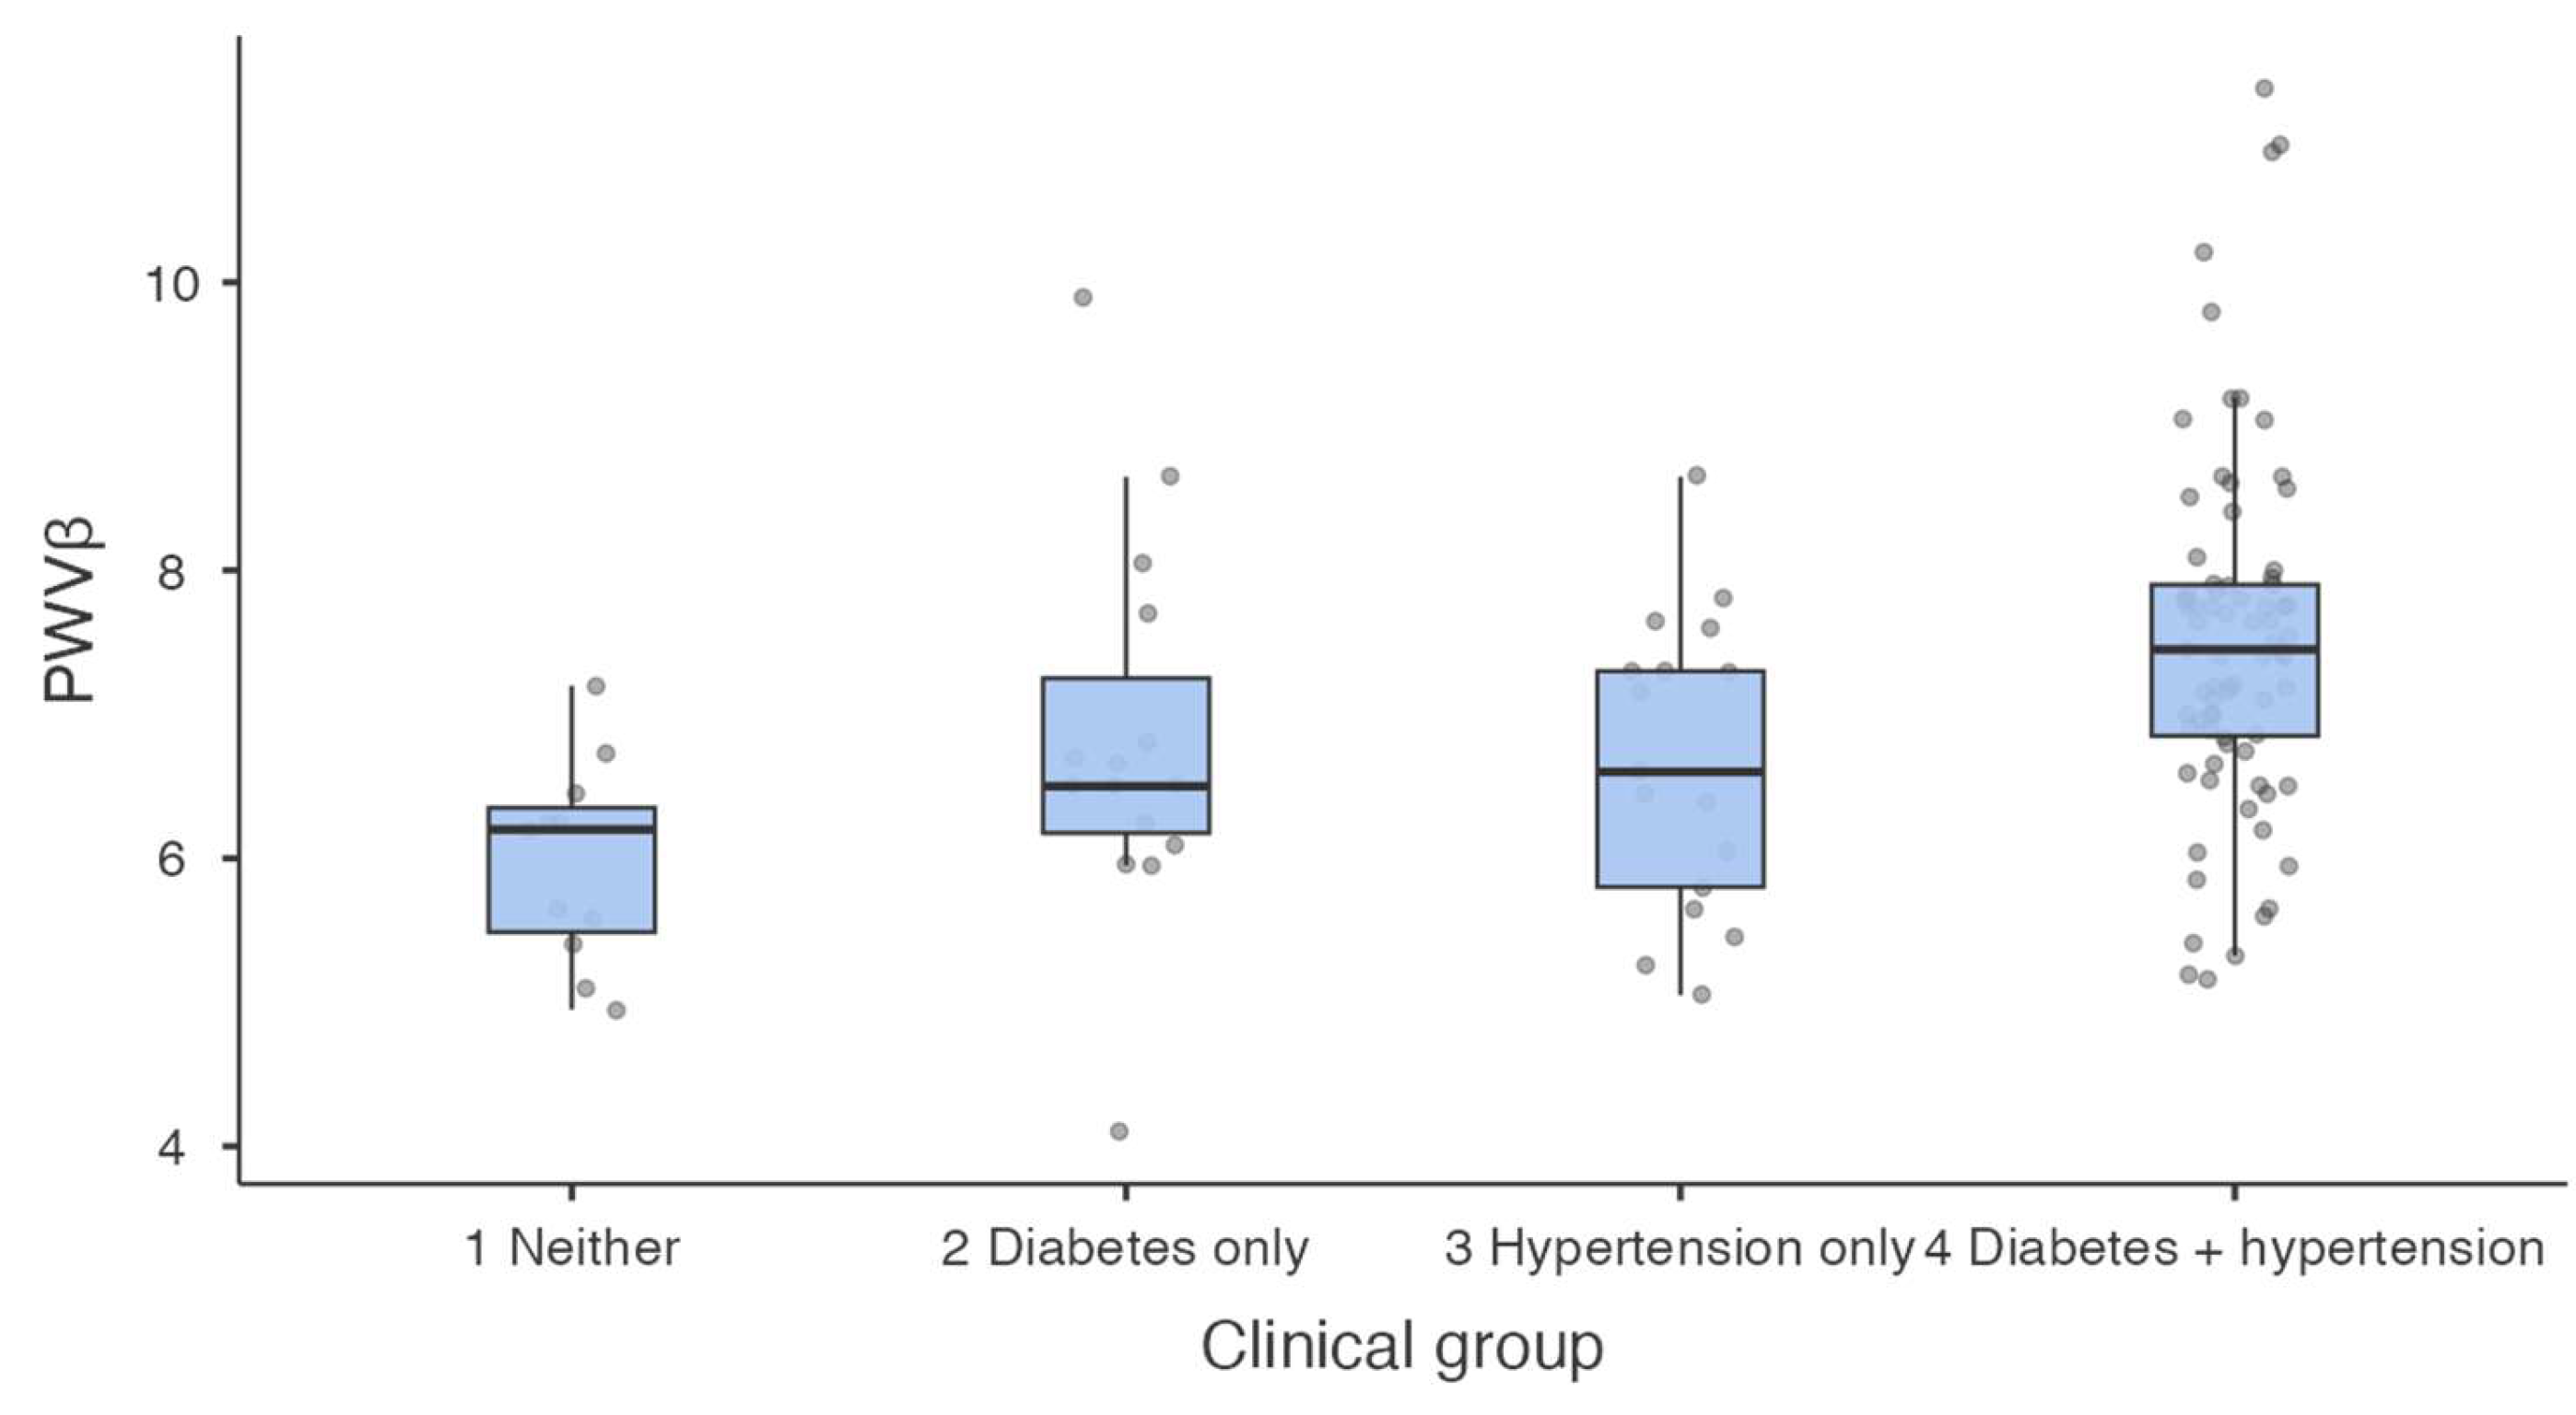
Figure 2.
Adjusted relationship between peripheral systolic blood pressure (SBP) and local carotid pulse wave velocity derived from the beta stiffness index (PWVβ), according to diabetes status. Lines show fitted values adjusted for age, estimated glomerular filtration rate, and sex; shaded bands indicate 95% confidence intervals, and points show observed values. The model included main effects for SBP and diabetes, without an interaction term; the parallel slopes therefore follow from the model specification.
Figure 2.
Adjusted relationship between peripheral systolic blood pressure (SBP) and local carotid pulse wave velocity derived from the beta stiffness index (PWVβ), according to diabetes status. Lines show fitted values adjusted for age, estimated glomerular filtration rate, and sex; shaded bands indicate 95% confidence intervals, and points show observed values. The model included main effects for SBP and diabetes, without an interaction term; the parallel slopes therefore follow from the model specification.
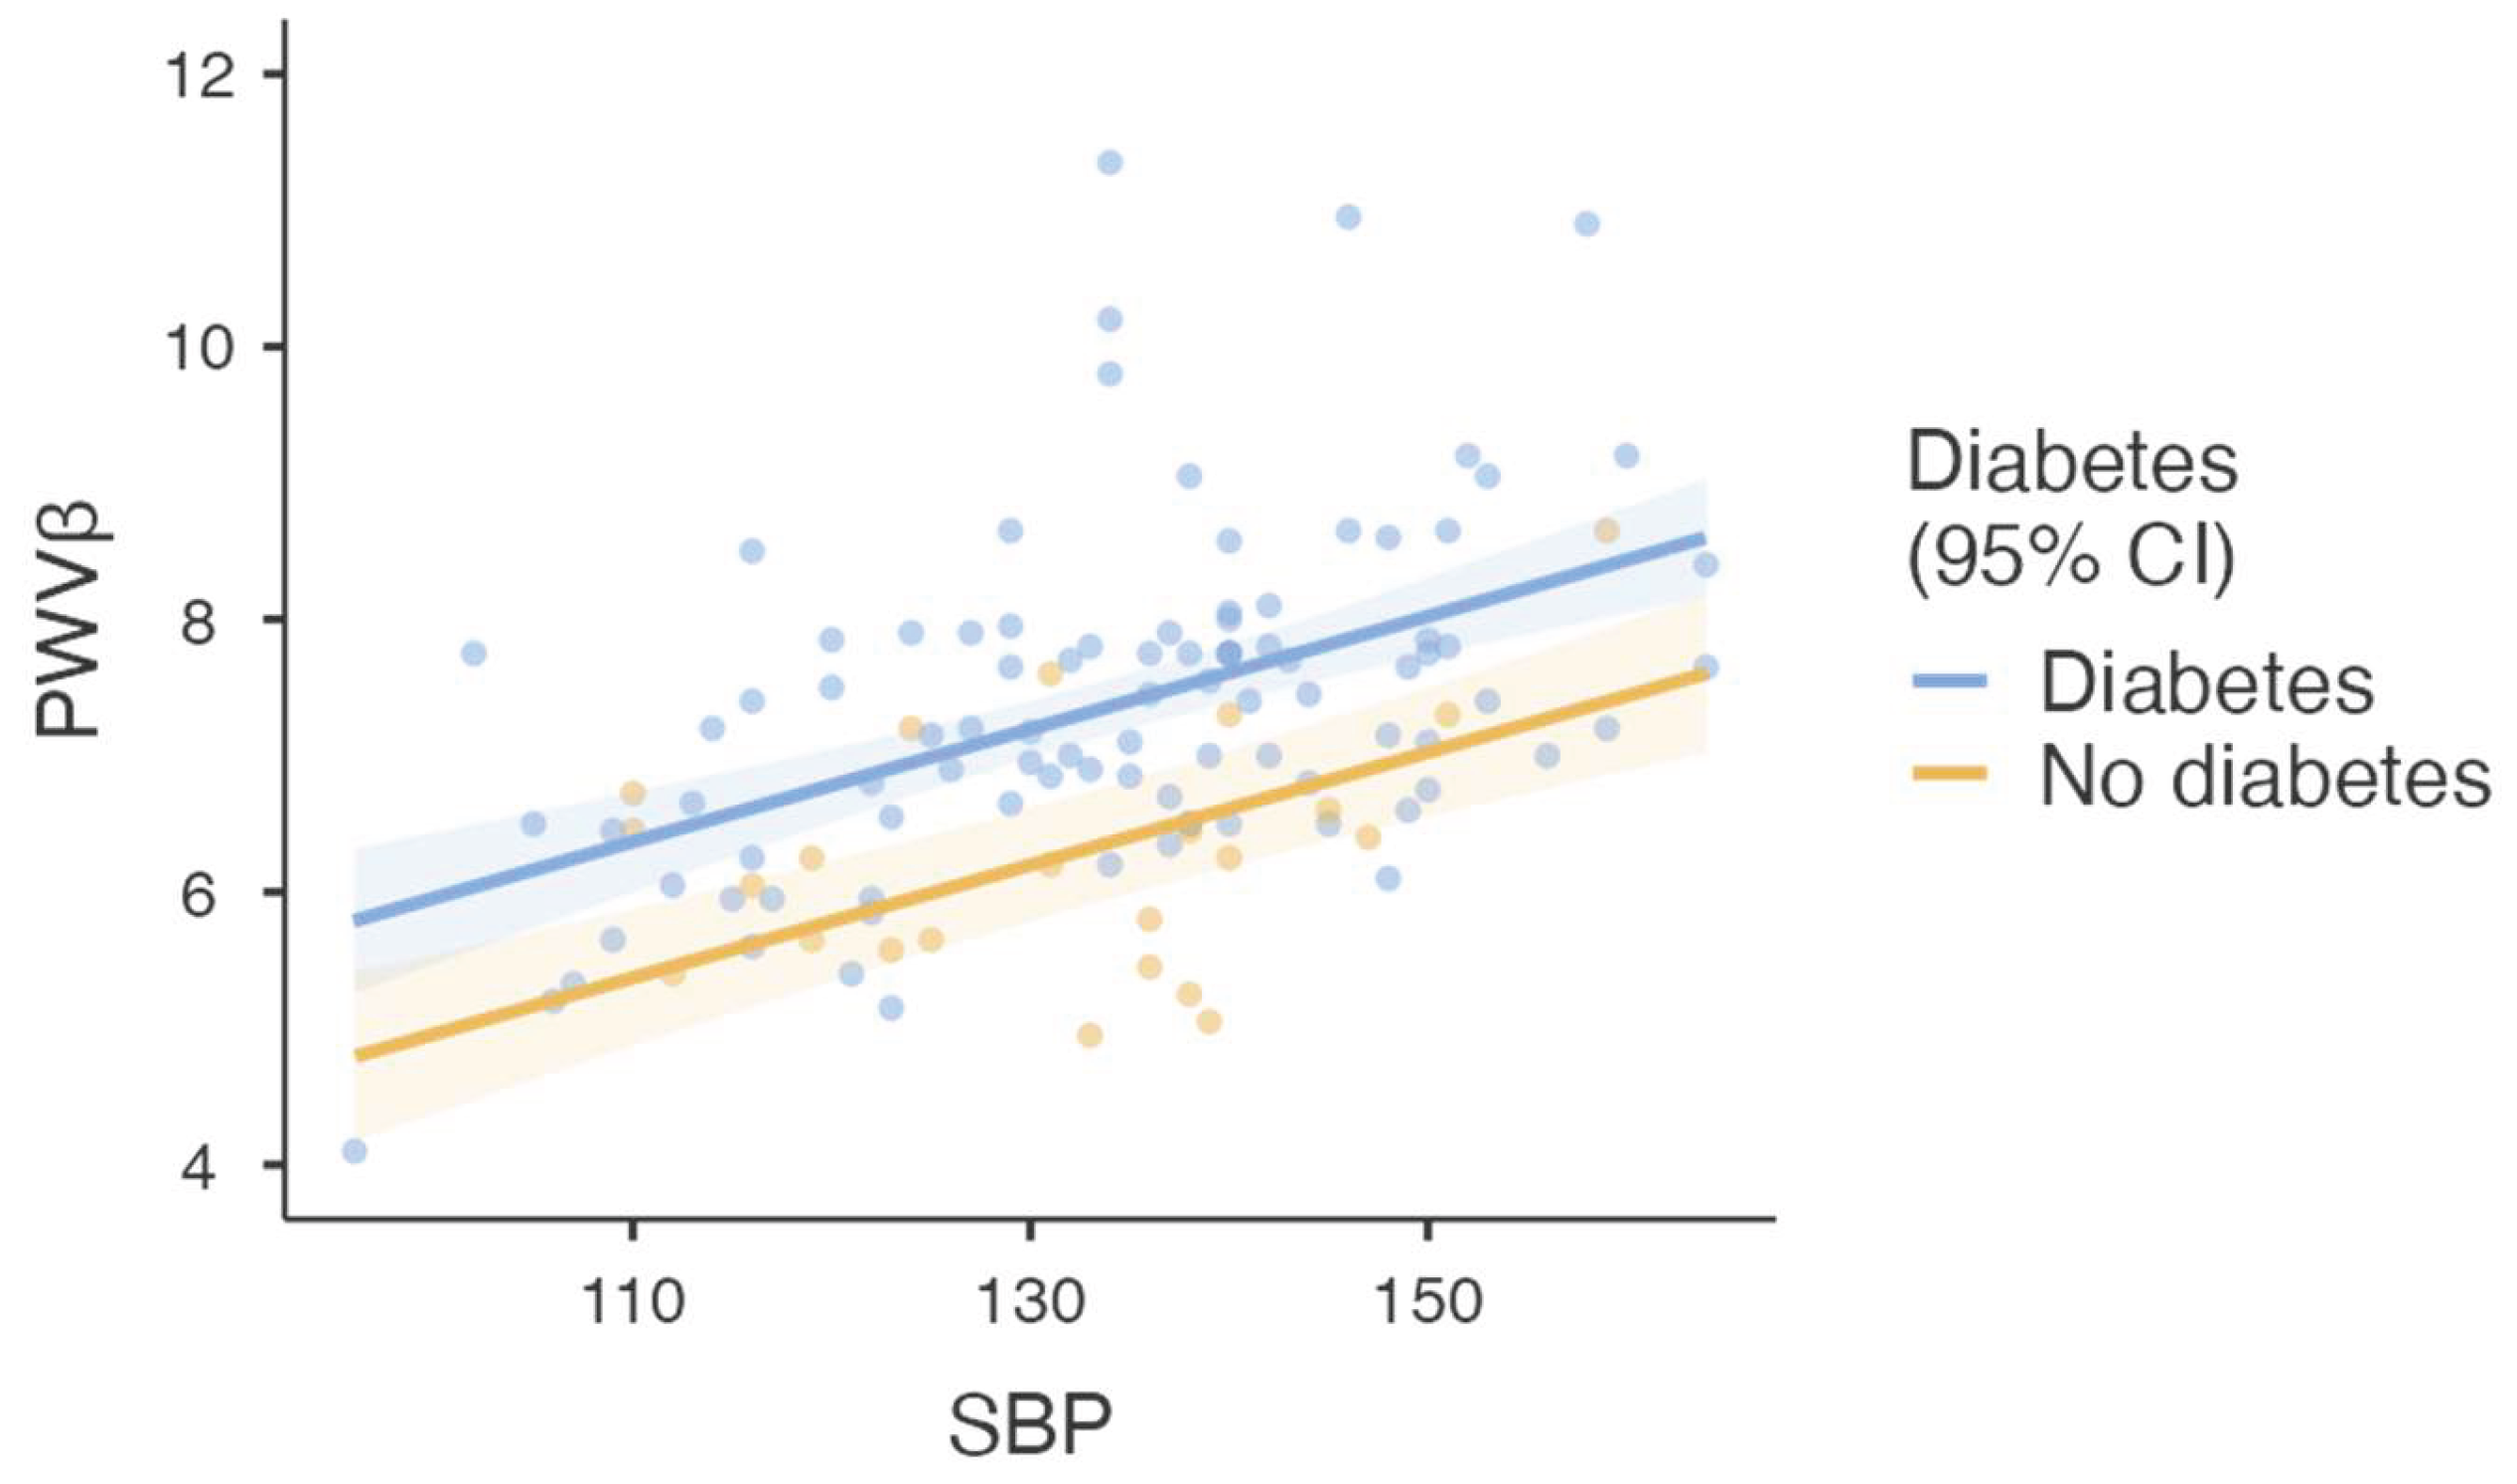

Table 1.
Demographic and clinical characteristics of the study population.
| Characteristic | Overall cohort | Neither condition | Diabetes only | Hypertension only | Both conditions | p-value |
|---|---|---|---|---|---|---|
| Participants, n (%) | 135 (100) | 13 (10.0) | 16 (12.3) | 17 (13.1) | 84 (64.6) | — |
| Female sex, n/N (%) | 68/132 (51.5) | 7/13 (53.8) | 9/16 (56.3) | 8/17 (47.1) | 43/84 (51.2) | 0.958 |
| Age, years | 57.4 ± 7.4 (n=132) | 56.0 ± 7.3 | 53.6 ± 9.3 | 57.4 ± 6.9 | 58.5 ± 6.9 | 0.220 |
| Body mass index, kg/m2 | 32.1 ± 6.5 (n=129) | 27.7 ± 5.8 | 28.8 ± 5.6 | 31.0 ± 6.0 | 33.5 ± 6.5 | 0.006 |
| Waist circumference, cm | 107.0 ± 15.5 (n=129) | 93.3 ± 15.2 | 100.4 ± 16.9 | 105.8 ± 15.3 | 110.3 ± 14.1 | 0.007 |
| eGFR, mL/min/1.73 m2 | 83.3 ± 20.0 (n=121) | 88.5 ± 19.2 | 76.3 ± 27.3 | 82.7 ± 10.1 | 84.0 ± 19.8 | 0.632 |
| Peripheral SBP, mmHg | 133.7 ± 14.2 (n=129) | 124.9 ± 9.8 | 128.8 ± 15.9 | 137.6 ± 12.7 | 135.0 ± 14.3 | 0.017 |
| Central aortic SBP, mmHg | 126.3 ± 13.4 (n=110) | 120.9 ± 10.3 | 120.5 ± 14.7 | 128.8 ± 13.3 | 127.3 ± 13.5 | 0.197 |
Values are mean ± SD or n/N (%), as indicated. Clinical-group percentages use the 130 classified participants as the denominator; five participants lacked hypertension information. Overall variable-specific sample sizes are shown where available. Continuous comparisons used Welch’s one-way analysis of variance and sex distribution was compared using the chi-square test. Significant overall continuous comparisons were followed by Games–Howell tests. eGFR, estimated glomerular filtration rate; SBP, systolic blood pressure; SD, standard deviation.
Table 2.
Local carotid vascular indices according to diabetes and hypertension status.
| Parameter | Neither condition | Diabetes only | Hypertension only | Both conditions | p-value |
|---|---|---|---|---|---|
| BSI | 6.87 ± 1.96 (n=11) | 8.89 ± 3.07 (n=15) | 8.16 ± 2.31 (n=17) | 10.7 ± 3.79 (n=81) | <0.001 |
| Ep | 93.9 ± 24.0 (n=11) | 125 ± 47.9 (n=15) | 121 ± 37.6 (n=17) | 155 ± 56.4 (n=81) | <0.001 |
| AC | 1.05 ± 0.420 (n=11) | 0.809 ± 0.236 (n=15) | 0.963 ± 0.507 (n=16) | 0.757 ± 0.298 (n=81) | 0.108 |
| AI | 18.0 ± 10.1 (n=11) | 12.3 ± 10.4 (n=15) | 18.2 ± 10.7 (n=17) | 13.3 ± 9.44 (n=81) | 0.211 |
| PWVβ | 5.98 ± 0.70 (n=11) | 6.82 ± 1.34 (n=15) | 6.67 ± 1.03 (n=17) | 7.50 ± 1.22 (n=81) | <0.001 |
Values are mean ± SD, with available sample sizes in parentheses. p-values are from Welch’s one-way analysis of variance. Games–Howell comparisons identified higher BSI, Ep, and PWVβ in the combined group than in the groups with neither condition or hypertension alone. BSI, beta stiffness index; Ep, pressure–strain elastic modulus; AC, arterial compliance; AI, augmentation index; PWVβ, local pulse wave velocity derived from BSI.
Table 3.
Multivariable linear regression models for local carotid PWVβ.
| Model and predictor | B | 95% CI | p-value |
|---|---|---|---|
| Model 1: clinical factors (N=117; R2=0.222) | |||
| Age, per year | 0.035 | 0.001 to 0.068 | 0.043 |
| eGFR, per mL/min/1.73 m2 | -0.003 | -0.014 to 0.009 | 0.676 |
| Male vs female sex | -0.057 | -0.484 to 0.371 | 0.793 |
| Diabetes vs no diabetes | 0.897 | 0.348 to 1.447 | 0.002 |
| Hypertension vs no hypertension | 0.631 | 0.075 to 1.187 | 0.026 |
| Model 2: peripheral SBP (N=117; R2=0.404) | |||
| Age, per year | 0.047 | 0.019 to 0.076 | 0.001 |
| eGFR, per mL/min/1.73 m2 | 0.002 | -0.008 to 0.012 | 0.725 |
| Male vs female sex | -0.224 | -0.602 to 0.155 | 0.244 |
| Diabetes vs no diabetes | 0.993 | 0.531 to 1.456 | <0.001 |
| Peripheral SBP, per 10 mmHg | 0.413 | 0.285 to 0.542 | <0.001 |
| Model 3: central aortic SBP (N=98; R2=0.299) | |||
| Age, per year | 0.041 | 0.004 to 0.079 | 0.031 |
| eGFR, per mL/min/1.73 m2 | 0.004 | -0.009 to 0.018 | 0.520 |
| Male vs female sex | -0.269 | -0.754 to 0.216 | 0.273 |
| Diabetes vs no diabetes | 1.097 | 0.537 to 1.657 | <0.001 |
| Central aortic SBP, per 10 mmHg | 0.333 | 0.162 to 0.503 | <0.001 |
B denotes the unstandardised regression coefficient; CI, confidence interval; eGFR, estimated glomerular filtration rate; SBP, systolic blood pressure; PWVβ, local pulse wave velocity derived from the beta stiffness index. Model 1 included age, eGFR, sex, diabetes, and hypertension. Models 2 and 3 replaced hypertension with peripheral or central aortic SBP. Reference categories were female sex, no diabetes, and no hypertension. Pressure coefficients are expressed per 10 mmHg. N denotes the complete-case model sample.
Disclaimer/Publisher’s Note: The statements, opinions and data contained in all publications are solely those of the individual author(s) and contributor(s) and not of MDPI and/or the editor(s). MDPI and/or the editor(s) disclaim responsibility for any injury to people or property resulting from any ideas, methods, instructions or products referred to in the content. |
© 2026 by the authors. Licensee MDPI, Basel, Switzerland. This article is an open access article distributed under the terms and conditions of the Creative Commons Attribution (CC BY) license.
Copyright: This open access article is published under a Creative Commons CC BY 4.0 license, which permit the free download, distribution, and reuse, provided that the author and preprint are cited in any reuse.