

Submitted:
21 October 2026
Posted:
21 October 2026
You are already at the latest version
Abstract
Despite decades of progress toward gender equality, women remain substantially underrepresented in executive leadership across the United States. This study examines how gendered perceptions and workplace discrimination shape beliefs about women’s access to top executive roles, drawing on nationally representative survey data from the Pew Research Center’s American Trends Panel (Wave 36; June–July 2018; N = 4,456 U.S. citizens). Chi-square tests, multivariable logistic regression, and three supervised machine-learning classifiers were used to identify predictors of the belief that executive access is easier for men. Women perceived executive access as more unequal than men (79.1% vs. 67.0%; p < .001), yet both groups showed comparable assessments of women’s leadership capability. Perceived workplace gender discrimination was the strongest predictor of the primary outcome (OR = 4.66; 95% CI 3.42–6.33), substantially mediating the direct effect of respondent gender once structural perceptions were held constant. Machine-learning benchmarks corroborated this finding, ranking workplace discrimination as the most important predictor across all three classifiers. It would appear, then, that interventions aimed at addressing structural factors, especially discrimination and pipelines, will prove more effective than attempts to change general attitudes concerning the competence of women.
Keywords:
gender stereotypes
; leadership
; women in leadership
; workplace discrimination
; machine learning
; United States
1. Introduction
Despite ongoing efforts to promote gender equality, women remain underrepresented in leadership and executive roles across industries. While women’s participation in the workforce has grown steadily over time, their progression into decision-making positions has not kept pace. This gap is often discussed in terms of individual ambition or capability, but such explanations do not fully capture the complexity of the issue. Indeed, in recent years, more and more research attention has been paid to the wider social and organizational environment within which the distribution of opportunities for leadership roles takes place.
A substantial body of research shows that perceptions of leadership are closely associated with gendered expectations. Traits commonly associated with leadership, such as assertiveness, decisiveness and authority, are often aligned with traditionally masculine norms. In contrast, women are more frequently associated with communal and supportive roles. These associations can create a subtle but persistent mismatch between expectations of leadership and perceptions of women, making it more difficult for women to be seen and accepted as leaders. Over time, such perceptions can influence both how individuals are evaluated and how they evaluate themselves.
Beyond perceptions, organizational practices also play a meaningful role. Hiring decisions, promotion pathways and performance evaluations often reflect implicit biases processes. Even when formal policies promote equality, informal norms and expectations can shape outcomes in ways that are less visible but equally impactful. As a result, barriers to leadership are not always explicit; they are often embedded within everyday workplace practices and broader cultural assumptions about gender and work.
Although prior research has examined gender disparities in leadership, much of it has focused on specific organizations, industries, or non-representative samples. Although these studies provide valuable insights, they may not fully reflect how these issues are perceived at a broader societal level. There is still a need for large-scale evidence that captures how people understand and interpret gender, leadership and workplace inequality.
This study addresses that need by examining perceptions of leadership and gender using nationally representative survey data from the United States. Drawing on responses from more than 4000 U.S. adults collected by the Pew Research Center, it explores how men and women view leadership capability, workplace expectations and access to executive roles. Rather than focusing only on outcomes, the study considers how perceptions themselves may help sustain existing patterns of inequality. The analysis is guided by Social Role Theory, which suggests that expectations about behavior are shaped by socially constructed roles assigned to men and women. From this perspective, differences in leadership representation are not simply the result of individual choices; they are influenced by broader social norms that define what leadership is and who is seen as suitable for it.
This study makes three contributions. First, it provides large-scale empirical evidence on how gendered perceptions of leadership are distributed across the general U.S. adult population. Second, it integrates perceptions of bias with beliefs about access to leadership, offering a more connected view of how attitudes relate to opportunities. Third, it combines classical inferential statistics with interpretable supervised machine-learning models to identify which perceived barriers most strongly predict the belief that executive pathways remain easier for men. In doing so, it contributes to ongoing discussions in equality, diversity and inclusion (EDI) by highlighting how everyday perceptions can reinforce broader structural patterns of inequality, even in contexts where formal barriers have been reduced.
2. Literature Review and Theoretical Framework
2.1. Women in Leadership Roles
Women’s participation in the workforce has increased significantly over the past few decades, yet this progress has not translated into proportional representation in leadership. Recent scholarship has moved away from attributing this gap to individual limitations and instead situates it within broader structural and institutional dynamics. As Saenz et al. (2025) argue, leadership inequalities are shaped by cultural expectations and organizational systems that continue to privilege traditional leadership profiles.
Evidence from organizational research supports this shift in perspective. While entry-level gender parity is often reported, advancement into managerial and executive roles remains uneven. Stainback et al. (2024) note that representation tends to decline at each successive level of the organizational hierarchy, suggesting that barriers persist throughout the career pipeline. This pattern challenges the long-standing assumption that increasing participation alone will eventually resolve leadership disparities.
Beyond formal structures, informal mechanisms, including access to mentorship, sponsorship, and professional networks, critically shape leadership outcomes. Access to mentorship, sponsorship and professional networks often determines who progresses within organizations. According to Saville et al. (2024), these forms of social capital are unevenly distributed and can significantly influence career trajectories, particularly in sectors where advancement depends on visibility and informal endorsement. Although such processes do not necessarily manifest themselves in written form in organizational policy, they are key for comprehending the process by which leadership opportunities are allocated.
Corporate governance research further illustrates the complexity of this issue. Research demonstrates that gender-diverse leadership is associated with improved organizational outcomes, including stronger governance and enhanced decision-making. However, as Sandretto et al. (2025) observe, the presence of women in leadership positions remains highly dependent on institutional context. Similarly, Choi and Ko (2025) demonstrate that leadership effectiveness is often evaluated within gendered frameworks, meaning that even when women attain leadership roles, their performance may be judged against different standards.
Collectively, these findings paint a more nuanced picture of leadership inequality. It is not simply the result of a lack of opportunity or ambition, but reflects a combination of structural constraints, organizational practices and cultural expectations. Khan et al. (2025) reinforce this view by arguing that leadership pathways are shaped by multi-level institutional factors, suggesting that meaningful change requires interventions at both organizational and societal levels.
2.2. Leadership and Organizational Culture
While structural barriers are important, organizational culture is equally consequential for leadership outcomes. Leadership is not only defined by formal roles but also by the expectations and norms that guide behavior within organizations. These norms influence how leadership is recognized, evaluated and rewarded, often in ways that are not immediately visible. Naseer et al. (2024) and Lee and Shin (2024) demonstrate that inclusive leadership can reshape these dynamics by fostering stronger diversity climates and change-oriented organizational citizenship behaviors. Xintian and Peng (2023) further show that supportive organizational climates, when combined with inclusive leadership, promote employee psychological resilience.
Despite incremental progress, traditional conceptions of leadership remain deeply entrenched in many organizational settings. Leadership is still frequently associated with traits such as assertiveness, dominance and control. Shafaei and Nejati (2024) note that these traits are often implicitly valued in leadership evaluations, thereby disadvantaging individuals whose leadership styles do not align with these expectations. In practice, this creates a subtle but persistent bias in how leadership potential is assessed.
A further consideration is the gap between formal policies and everyday practices. Many organizations have introduced diversity and inclusion initiatives, yet their effectiveness varies widely. Informal norms, such as access to networks and visibility within leadership circles, continue to influence career progression. These dynamics can reinforce existing inequalities even in environments that formally support equality.
Simultaneously, leadership composition can shape organizational culture in meaningful ways. Research indicates that organizations with greater representation of women in leadership positions tend to adopt more inclusive practices. Baker et al. (2025) provide evidence that female leadership is associated with stronger commitments to work-life balance and gender equity initiatives. This suggests that leadership diversity can act as a catalyst for broader organizational change. On balance, the literature highlights a key tension: while inclusive leadership models offer pathways for change, traditional norms continue to shape organizational behavior. Addressing gender inequality in leadership therefore requires not only changes in representation but also a deeper transformation of organizational culture.
2.3. Gender Stereotypes and Bias
Gender stereotypes remain one of the most enduring explanations for inequality in leadership. These stereotypes shape how individuals perceive competence, authority and leadership potential, often in ways that disadvantage women. Research in this area distinguishes between descriptive beliefs about what men and women are like and prescriptive expectations about how they should behave. Both forms contribute to biased evaluations in organizational settings, as discussed by Heilman et al. (2024).
Leadership, in particular, is strongly associated with traits that are culturally coded as masculine. Tremmel and Wahl (2023) show that characteristics such as decisiveness and authority continue to dominate perceptions of effective leadership. As a result, women may be viewed as less suitable for leadership roles, even when they possess the necessary qualifications and experience.
This perceived mismatch creates significant challenges. Women who adopt assertive leadership styles may face negative social reactions for deviating from expected gender norms, while those who conform to traditional expectations may be perceived as lacking the qualities required for leadership. Manzi et al. (2024) describe this as a persistent evaluative tension that places women in a difficult position regardless of how they behave. This dynamic, often referred to as the “double bind,” continues to influence leadership outcomes across sectors.
Empirical evidence demonstrates that these biases extend into organizational decision-making processes. Controlled experiments have shown that identical resumes can receive different evaluations solely because of gender cues. Barron et al. (2022) provide experimental evidence of such biases in hiring contexts, while Galos and Coppock (2023) show that patterns of discrimination can vary depending on the composition of the evaluating group. These findings suggest that bias is not only individual but also shaped by organizational context. Extending this evidence to entrepreneurial settings, Tonoyan et al. (2025) show that gender stereotypes continue to influence job application intentions at technology startups, with job seekers expressing systematically lower interest when founders have stereotypically female names, a pattern that illustrates how stereotype-based bias shapes labor market behavior well before formal evaluation occurs.
There is some indication that perceptions of leadership are evolving. Feenstra et al. (2023) observe a gradual shift toward recognizing relational and collaborative leadership styles, which are more often associated with women. However, these changes remain uneven and do not fully offset the influence of traditional stereotypes. Importantly, stereotypes do not operate in isolation; they interact with organizational practices and cultural norms to reinforce inequality. This means that even when formal barriers are removed, underlying perceptions can continue to shape outcomes.
2.4. Demographic Influences on Women’s Leadership
Gender disparities in leadership are further shaped by demographic factors that influence how individuals experience the workplace. Gender intersects with other social identities, producing varied outcomes across different groups of women.
Among the most closely examined influences is the impact of family responsibilities. The relationship between motherhood and career progression has been extensively documented, with Torres et al. (2024) identifying a consistent pattern in which caregiving responsibilities are associated with reduced advancement opportunities. These effects are often linked to assumptions about availability and commitment, which can influence hiring and promotion decisions.
Intersectional research highlights that these challenges are not experienced uniformly. Women from minority backgrounds often face additional barriers related to both gender and ethnicity. Otaye-Ebede and Shaffakat (2024) show that access to leadership opportunities is shaped by overlapping forms of disadvantage, which can limit career progression and professional visibility. In healthcare contexts, for instance, Ho et al. (2025) find that perceptions of leadership potential are influenced by both gender and cultural expectations, further complicating advancement.
Cultural and regional contexts also play a significant role. Research comparing different national settings suggests that societal norms regarding gender roles influence both workforce participation and leadership representation. According to Gander and Sharafizad (2025), even in environments with formal equality policies, informal expectations can continue to shape outcomes in meaningful ways. Education is often viewed as a pathway to leadership, yet its impact is not uniform. While higher levels of education generally improve access to opportunities, they do not fully eliminate structural barriers, suggesting that leadership inequality cannot be addressed solely through individual advancement but requires broader systemic change.
Collectively, these findings underscore the importance of accounting for demographic variation in the study of leadership. A one-size-fits-all approach is unlikely to address the complexity of gender inequality, underscoring the need for more inclusive, context-sensitive strategies.
2.5. Theoretical Framework: Social Role Theory
This study is grounded in Social Role Theory, which provides a framework for understanding how gendered expectations shape perceptions and outcomes of leadership. The theory suggests that behavioral differences between men and women are influenced by socially constructed roles that define what is considered appropriate for each group.
Within this framework, leadership disparities are not seen as the result of inherent differences in ability. Instead, they reflect expectations that align leadership with traditionally masculine roles. Fletcher and Lysova (2026) extend this argument by demonstrating how these expectations are embedded within organizational systems, influencing both evaluation processes and access to opportunities.
Recent theoretical developments also emphasize the role of power in shaping observed gender differences. Galinsky et al. (2024) argue that many differences attributed to gender may instead reflect disparities in access to authority and influence. This perspective shifts the focus from individual characteristics to broader structural conditions. Similarly, Pogrebna et al. (2024) highlight how intersecting forms of bias can reinforce inequality over time, particularly in contexts where multiple dimensions of identity intersect.
Applying this framework allows for a more integrated understanding of leadership inequality. In the context of the present study, Social Role Theory predicts that (i) women should be more likely than men to perceive structural barriers such as workplace discrimination and higher performance standards for women and (ii) once these perceptions are held constant, the direct association between respondent gender and beliefs about executive access should diminish, both of which are empirically testable in the data used here.
3. Methodology
3.1. Data and Analytic Sample
The study uses secondary microdata from the Pew Research Center’s American Trends Panel (ATP) Wave 36, fielded June 19–July 2, 2018, with findings widely disseminated as part of the 2021 Women and Leadership data release (Parker & Funk, 2021). The ATP is a nationally representative probability-based panel of U.S. adults recruited through address-based sampling of the non-institutionalized adult population. The dataset contains responses from N = 4,587 U.S. adults. The dataset includes questions on perceptions of women in leadership, barriers to executive roles, beliefs about gender differences in leadership style, and standard demographics.
Two filters were used to define the analytic sample. First, respondents were restricted to U.S. citizens, to keep the unit of analysis comparable to prior U.S.-focused studies of leadership perception (n = 4,587). Second, respondents who did not report a binary male/female gender (the only categories offered in the 2018 instrument) were excluded; this had minimal impact. The final analytic sample is N = 4,456 (Female = 2,248; Male = 2,208). All inferences reported here pertain to this analytic subsample.
The Pew questionnaire used a split-ballot design for the battery on perceived reasons why “women are not in top executive business positions.” Four items: society is not ready (A), women are not tough enough for business (D), gender discrimination in hiring (F) and gender discrimination in the workplace (G), were asked of roughly half the sample (n ≈ 1,090); four other items: women are held to higher standards (B), there are too few women in the pipeline (H), women do not have enough experience (J) and women do not make as good managers (O), were asked of the other half (n ≈ 1,120). Two items: family responsibilities (C) and lack of connections (I), were asked of all respondents (n = 2,213). This structure is accommodated by reporting bivariate (chi-square) statistics on the maximum sample available for each item, and by restricting the multivariable and machine-learning analyzes to the form that contains the most theoretically central discrimination items (F and G), augmented with items C and I, which are asked of all respondents (multivariable sample N = 1,073).
3.2. Measures
Outcome variable: The primary dependent variable is the respondent’s belief about whether it is easier for men or women to reach top executive business positions (variable EASIERBIZF2). Responses were recoded into a binary indicator equal to 1 if the respondent stated that it is “easier for men to get these positions,” and 0 if they stated it is “easier for women” or that there is “no difference.” Refusals were treated as missing.
Perceived barriers: The ten “why not” items in the split-ballot battery were each dichotomized such that endorsement as either a “major reason” or a “minor reason” was coded 1, and “not a reason” was coded 0. This recoding is consistent with prior Pew releases (Parker & Funk, 2021) and improves interpretability by combining the two endorsement levels into a single “perceives this as a barrier” indicator.
Leadership capability: A secondary outcome, used for descriptive comparison, is derived from the STYLE2 item asking whether men, women or neither are better at specific leadership functions. A “women as capable leaders” indicator was coded 1 if the respondent selected “women generally have a better approach” or “neither is better” and 0 if they selected “men generally have a better approach.”
Demographics: Sex was coded as female (1) versus male (0). Age was analyzed using Pew’s four-category banding: 18–29, 30–49, 50–64 and 65 or older (reference: 50–64, the modal category). Education was collapsed into three categories (reference: college graduate or more): high school graduate or less, some college, and college graduate or more. Race/ethnicity was harmonized into four categories (reference: White non-Hispanic): Black non-Hispanic, Hispanic and Other (including Asian; the Asian category contained very few observations in the analytic subset and was merged into Other).
3.3. Analytic Strategy
The analysis proceeded through four progressively more restrictive stages of identification based on successively more stringent identification assumptions. First, descriptive statistics were calculated for the analytic sample. Second, chi-square tests of independence with Cramér’s V as the effect-size measure were used to test for gender differences on each perceptual item. Cramér’s V was preferred to the phi-coefficient because several of the cross-tabulations involve more than two perception categories when the three-level raw coding is retained; conventional benchmarks treat V ≥ 0.10 as small, 0.20 as medium and 0.30 as large (Cohen, 1988). Given the large sample, attention focuses on effect sizes as well as p-values.
Third, multivariable logistic regression was estimated for the binary outcome (perceives executive access as easier for men) using respondents on the form containing items C, F, G, and I (the universally asked family and connections items plus the two discrimination items, n = 1,073). Coefficients were estimated by iteratively re-weighted least squares with a small L2 ridge penalty ( = 1×10⁻⁴) to stabilize the Hessian in sparse cells; standard errors were obtained from the inverse observed Fisher information (Hauck & Donner, 1977). Odds ratios are reported with profile-likelihood-consistent 95% confidence intervals. Model fit is summarized with the McFadden (1974) pseudo-R2.
Fourth, three supervised machine-learning classifiers were trained on the same design matrix to benchmark predictive accuracy and to identify which perceptions carry the most information about the outcome: (a) a regularized logistic regression with ridge penalty = 1×10⁻², (b) a random forest of 100 CART trees with maximum depth 8, minimum leaf size 10, and bootstrap aggregation, and (c) a gradient-boosted classifier of 150 depth-3 trees with learning rate 0.1 and minimum leaf size 15. The data were partitioned into 75% training and 25% test folds with stratification on the outcome. Out-of-sample performance was evaluated with accuracy, precision, recall, the F1 statistic and the area under the receiver-operating-characteristic curve (AUC). Random forest variable importance was computed using the mean decrease in Gini impurity.
All analyzes were conducted in Python 3.10. Descriptive statistics and chi-square tests were computed using NumPy and pandas; logistic regression was estimated with statsmodels. The three machine-learning classifiers were implemented using scikit-learn (Pedregosa et al., 2011), with a fixed random seed of 42 throughout to ensure reproducibility. All analysis code is available from the corresponding author upon request.
4. Results
4.1. Sample Characteristics
Table 1 summarizes the demographic characteristics of the N = 4,456 U.S. citizen analytic sample. The sample is close to gender balance (50.4% female; 49.6% male), reflecting Pew’s probability-based sampling design. The age distribution skews older: only 9.9% of respondents are aged 18–29, compared with 32.2% aged 50–64 and 29.0% aged 65 or older. Roughly three-quarters of respondents are White non-Hispanic (75.6%), with Black non-Hispanic (8.9%), Hispanic (8.2%) and Other/Asian (6.0%) rounding out the sample. Education is relatively high: 54.5% hold at least a bachelor’s degree, 30.2% report some college and 15.1% report high-school graduate or less.
4.2. Bivariate Gender Differences in Perceptions
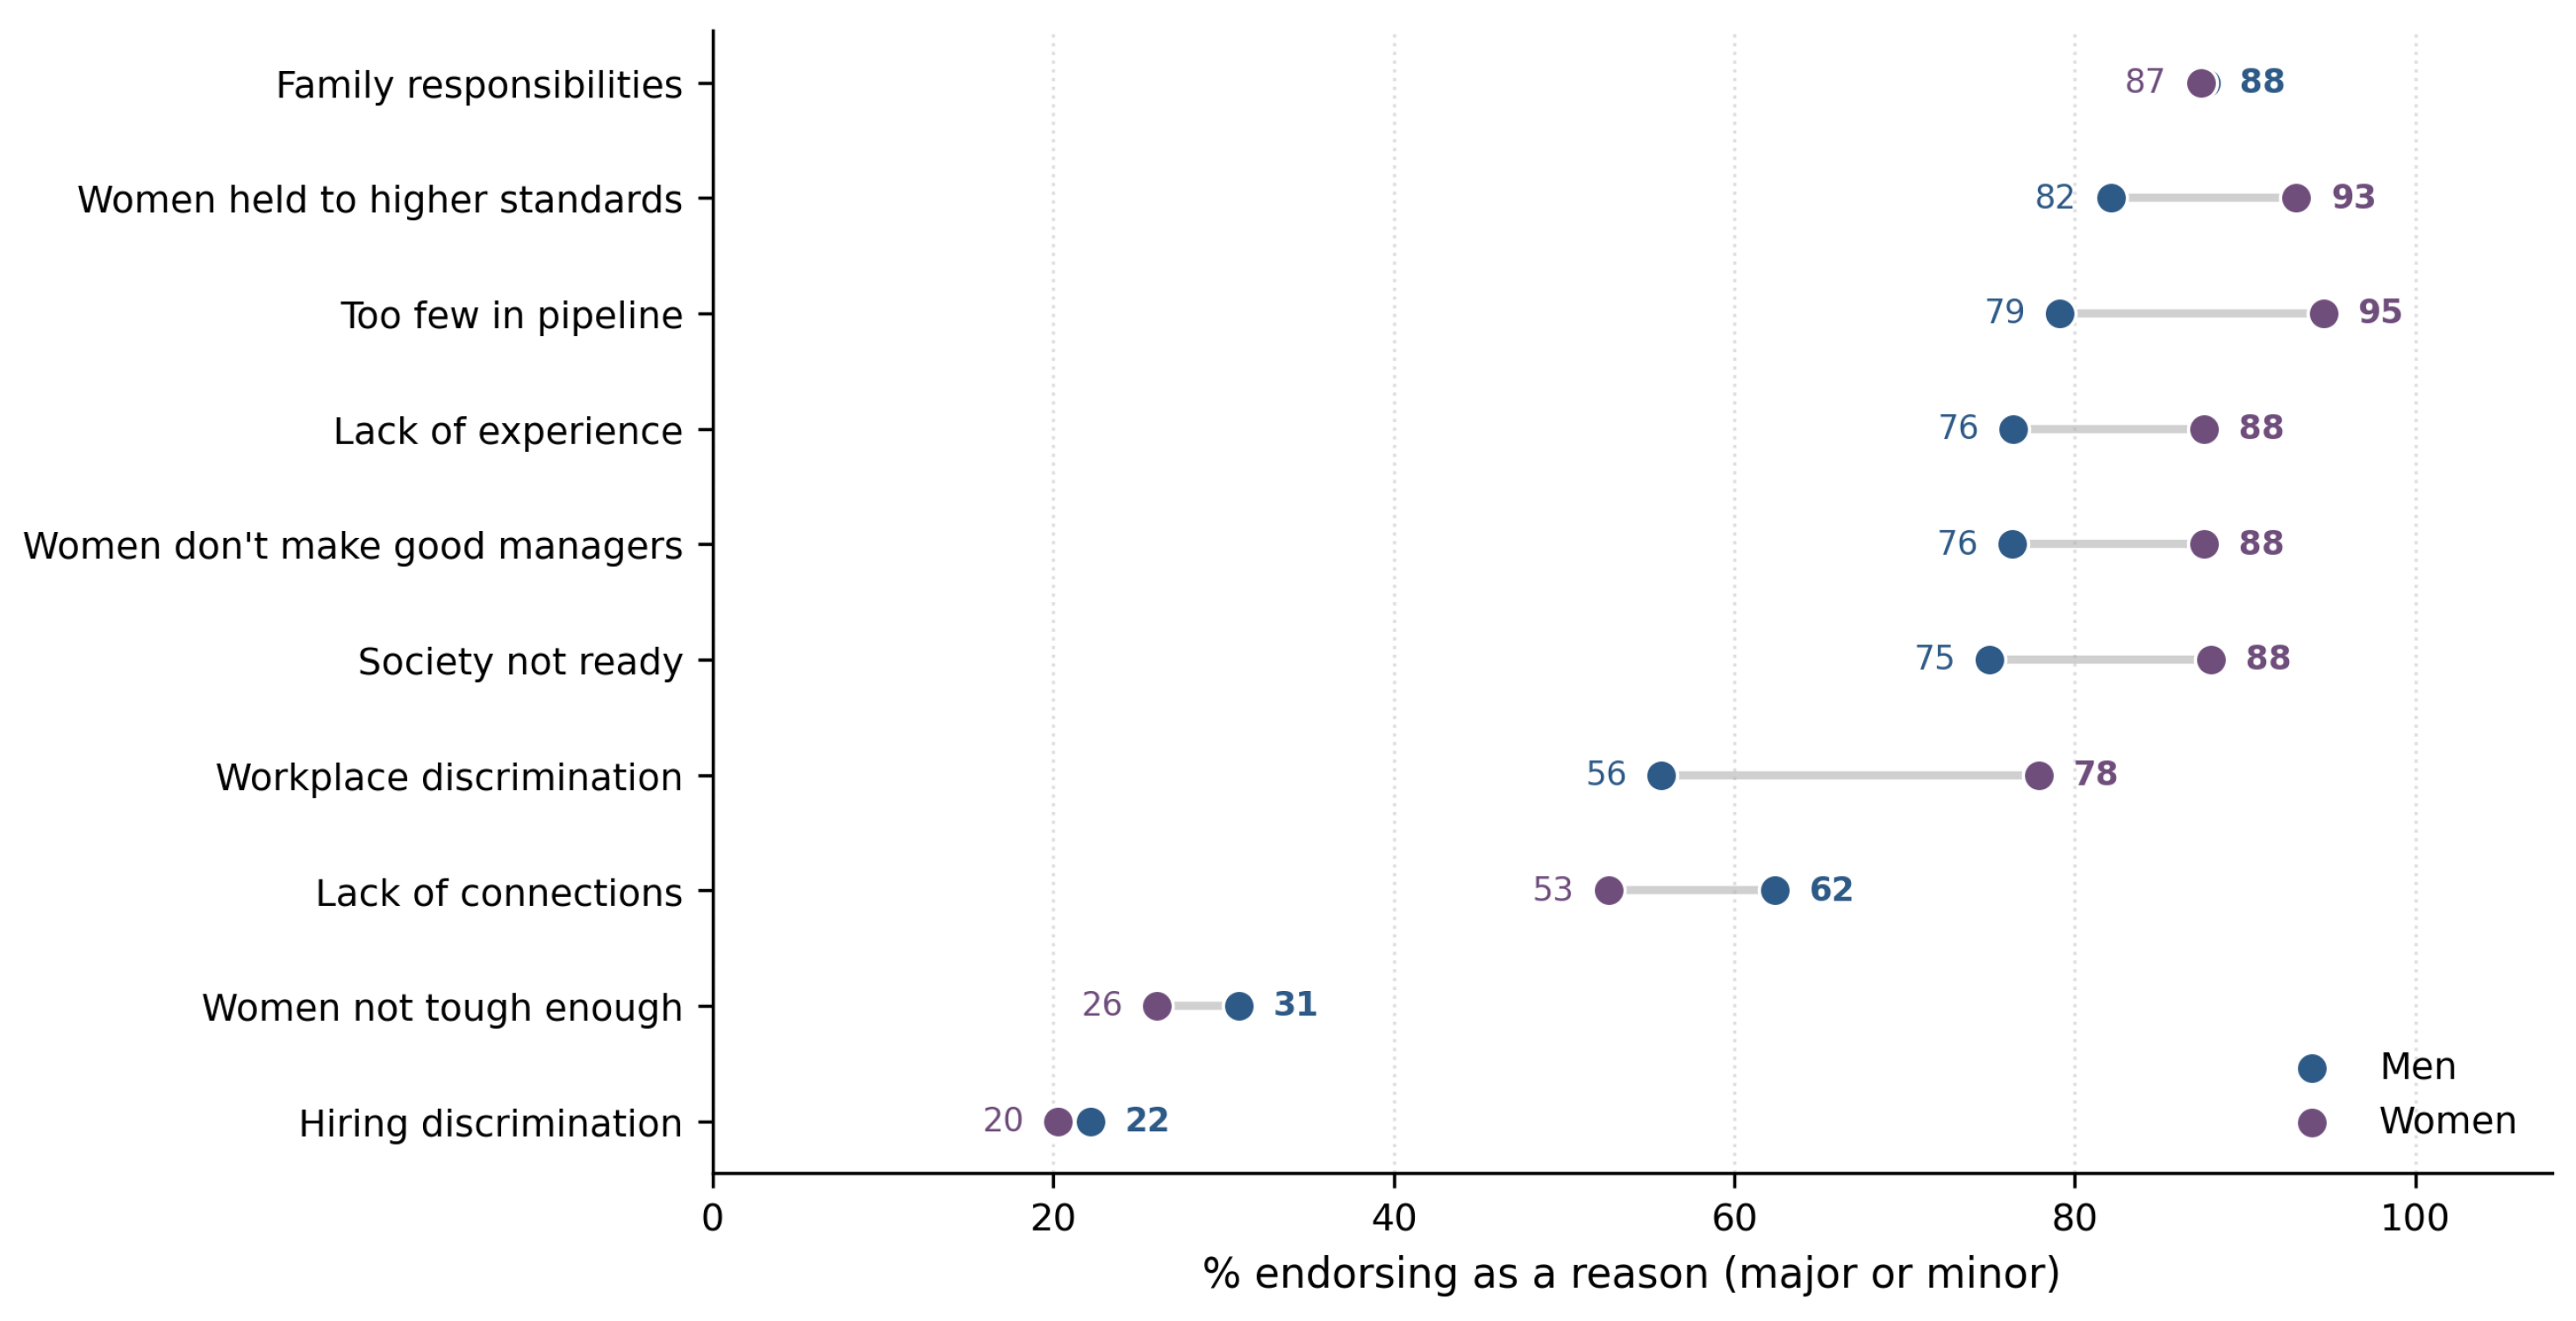
Table 2 reports chi-square tests of independence between respondent sex and each perception variable. Two perceptual items show the largest and most consistent gender differences. First, workplace gender discrimination is endorsed as a reason for women’s underrepresentation in executive positions by 77.9% of women and 55.7% of men (2(1) = 60.66, p < .001, V = 0.236). Second, a thin leadership pipeline is endorsed by 94.6% of women and 79.1% of men (2(1) = 58.67, p < .001, V = 0.229). Both effect sizes are in the “medium” range. A further four items: “society is not ready” (88.0% vs. 75.0%, V = 0.168), women are held to higher standards (93.0% vs. 82.1%, V = 0.165), lack of experience (87.6% vs. 76.4%, V = 0.146) and “women do not make as good managers” (87.6% vs. 76.3%, V = 0.147), show significant gender differences with small-to-medium effects.
Two items show effectively no gender difference: endorsement of family responsibilities as a reason (87.4% vs. 87.7%, V = 0.004) and endorsement of “women are not tough enough for business” (V = 0.053). The perception that it is easier for men to reach top executive positions is itself gendered: 79.1% of women hold this view compared to 67.0% of men (2(1) = 41.29, p < .001, V = 0.137). Finally, the belief that women are at least as capable as men as leaders does not significantly differ by respondent gender (62.8% of women, 66.0% of men; V = 0.033), consistent with prior research suggesting that modern egalitarian attitudes are widely shared at a generic level but fragment when specific structural barriers are discussed.

Table 2.
Chi-Square Tests of Gender Differences in Perceptions.
| Perception variable | Female % | Male % | (df=1) | p | Cramér’s V | N |
|---|---|---|---|---|---|---|
| Easier for men to reach executive roles | 79.1 | 67.0 | 41.29 | < .001 | 0.137 | 2,210 |
| Believes women as capable leaders | 62.8 | 66.0 | 2.92 | .088 | 0.033 | 2,636 |
| Endorses: society not ready | 88.0 | 75.0 | 30.86 | < .001 | 0.168 | 1,089 |
| Endorses: women held to higher standards | 93.0 | 82.1 | 30.50 | < .001 | 0.165 | 1,119 |
| Endorses: family responsibilities | 87.4 | 87.7 | 0.04 | .840 | 0.004 | 2,213 |
| Endorses: women not tough enough | 26.1 | 30.9 | 3.04 | .081 | 0.053 | 1,090 |
| Endorses: hiring discrimination | 20.3 | 22.2 | 0.61 | .434 | 0.024 | 1,093 |
| Endorses: workplace gender discrimination | 77.9 | 55.7 | 60.66 | < .001 | 0.236 | 1,092 |
| Endorses: too few women in pipeline | 94.6 | 79.1 | 58.67 | < .001 | 0.229 | 1,121 |
| Endorses: lack of connections | 52.6 | 62.4 | 21.65 | < .001 | 0.099 | 2,213 |
| Endorses: lack of experience | 87.6 | 76.4 | 23.91 | < .001 | 0.146 | 1,120 |
| Endorses: women don’t make good managers | 87.6 | 76.3 | 24.16 | < .001 | 0.147 | 1,121 |
Note: Percentages are within-gender endorsement rates of each perception (“major” or “minor” reason coded 1; “not a reason” coded 0). N varies across rows because four items were asked on Pew Form A, four items on Pew Form B, and the remaining items were asked of all respondents. Bold rows indicate medium effect sizes (V ≥ 0.20).
Figure 1.
Gendered perceptions of women’s leadership. (a) Respondents rating women as at least as capable as men of serving as business leaders; (b) respondents who view acquiring top executive roles as easier for men, both by respondent gender.
Figure 1.
Gendered perceptions of women’s leadership. (a) Respondents rating women as at least as capable as men of serving as business leaders; (b) respondents who view acquiring top executive roles as easier for men, both by respondent gender.
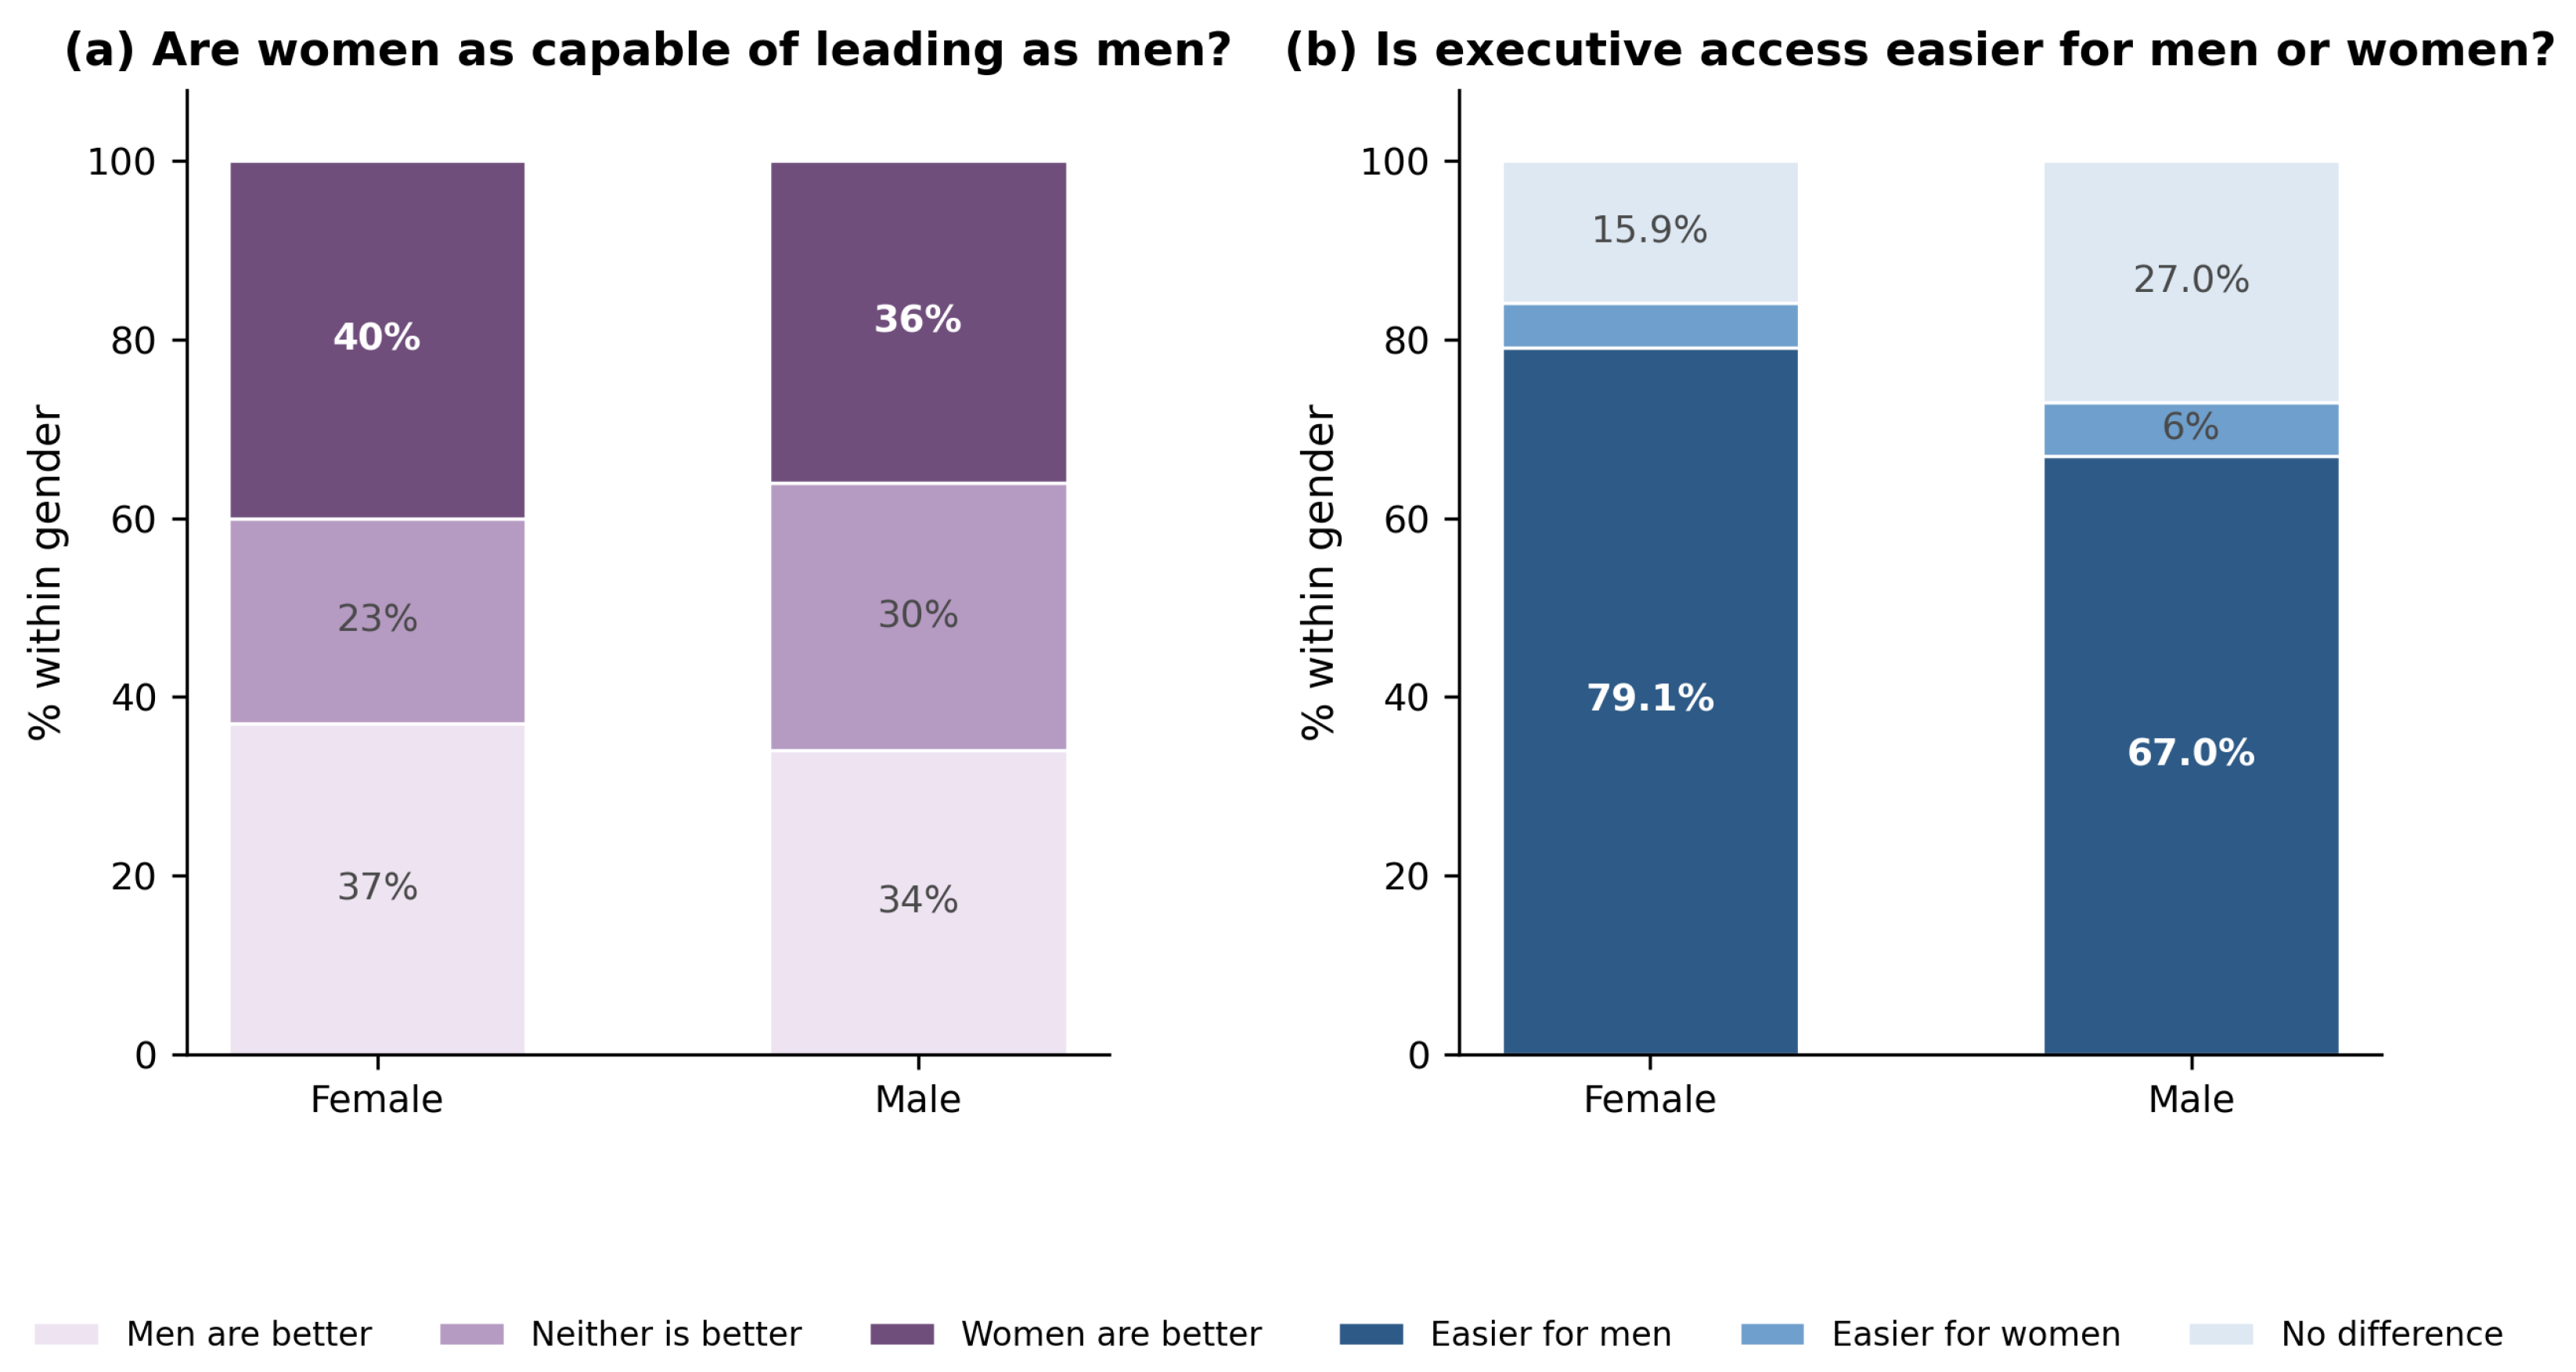
Figure 2.
Within-gender endorsement rates of perceived structural and stereotype-based barriers to women’s executive advancement. Points connected by horizontal lines represent male and female endorsement for the same item; wider gaps indicate larger gender differences.
Figure 2.
Within-gender endorsement rates of perceived structural and stereotype-based barriers to women’s executive advancement. Points connected by horizontal lines represent male and female endorsement for the same item; wider gaps indicate larger gender differences.
4.3. Multivariable Logistic Regression
Table 3 reports the multivariable logistic regression predicting the binary outcome “perceives executive access as easier for men,” estimated on the subsample of respondents who received Pew Form A and had complete information on all covariates (N = 1,073; 71.3% of whom endorsed the outcome). The model’s McFadden pseudo-R2 is 0.150, which is within the 0.10–0.20 range that McFadden (1974) describes as indicating “excellent” fit in a logistic model relative to a null baseline.
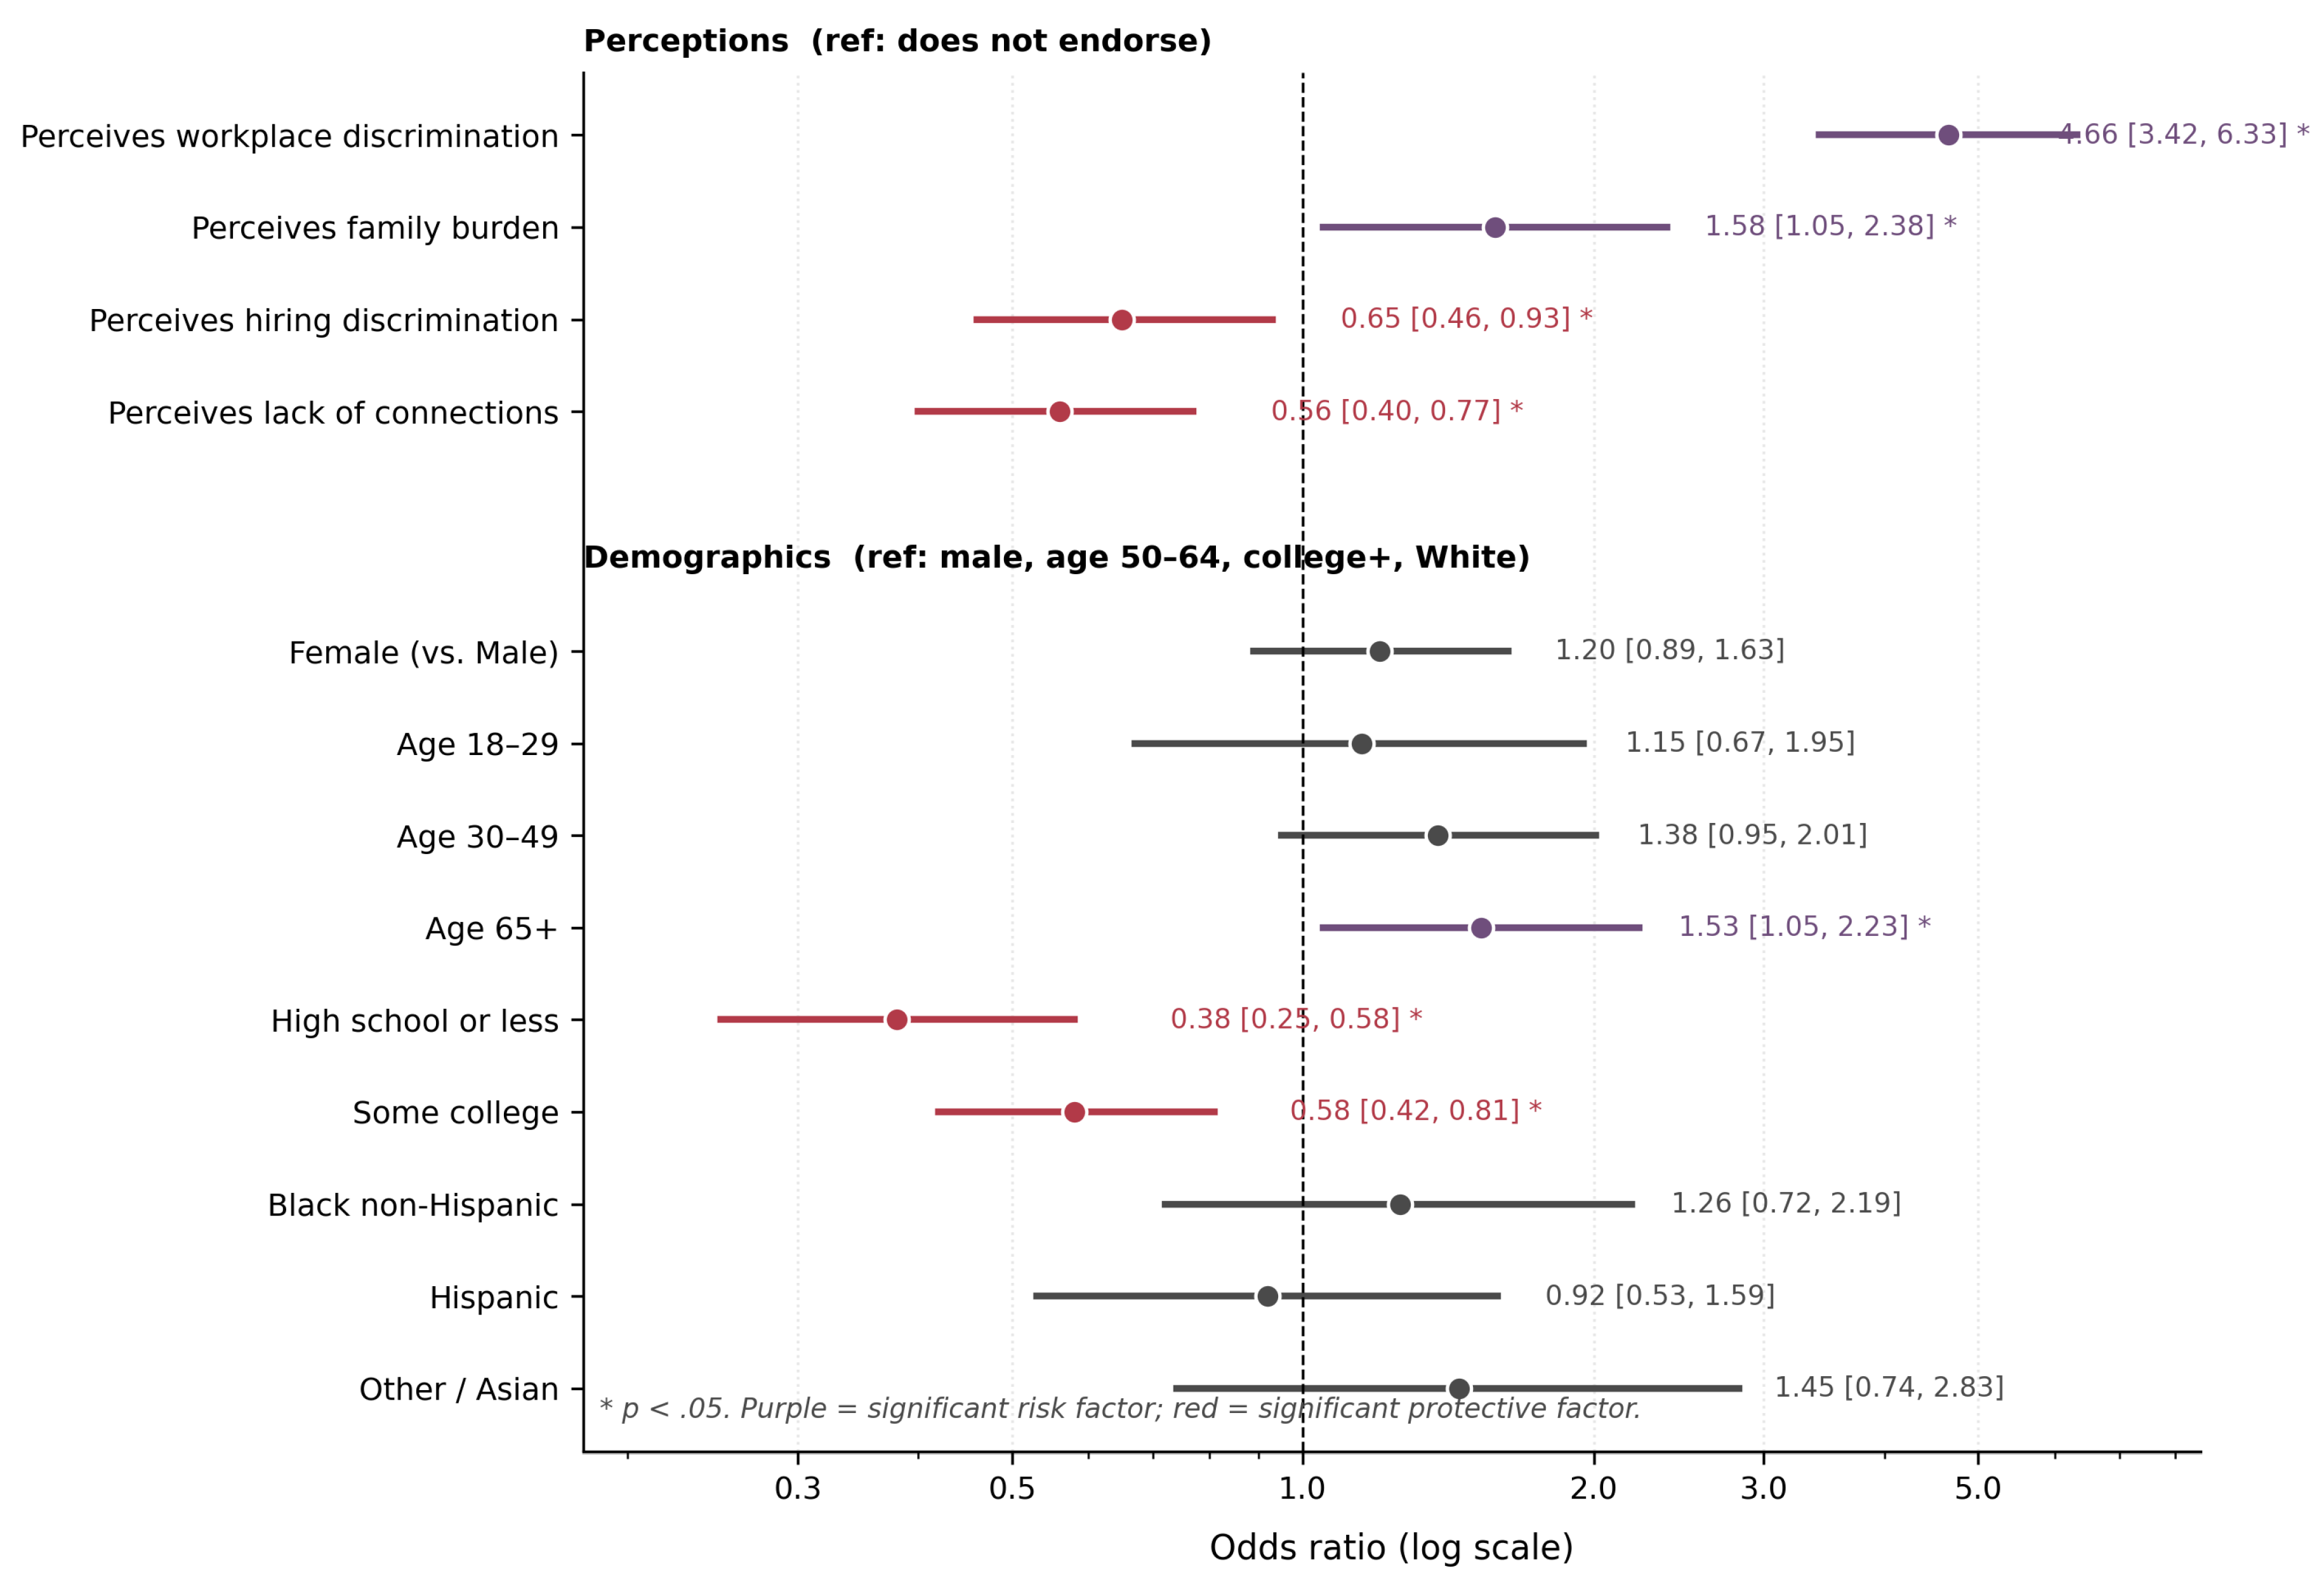
The strongest predictor of believing it is easier for men to reach executive positions is the perception that workplace gender discrimination is a reason for women’s underrepresentation (OR = 4.66, 95% CI 3.42–6.33, p < .001). Respondents who endorse family responsibilities as a reason are also more likely to hold the outcome belief (OR = 1.58, 95% CI 1.05–2.38, p = .030). Two perceptual predictors have significant negative coefficients: endorsing “lack of connections” (OR = 0.56, p < .001) and endorsing “hiring discrimination” (OR = 0.65, p = .017). These negative associations, in the presence of a dominant and highly correlated “workplace discrimination” predictor, are plausibly driven by partialling: respondents who attribute the gap specifically to networks or to a single hiring decision rather than to broader workplace culture appear to be comparatively less likely to frame the outcome in terms of systematic male advantage, once workplace discrimination is held constant.
Controls yield a consistent and interpretable pattern. Respondents with high-school-or-less education (OR = 0.38, p < .001) and some college (OR = 0.58, p = .002) are less likely than college graduates to endorse the outcome belief, consistent with an education gradient in recognition of structural barriers documented in prior research. Age 65+ respondents are marginally more likely to endorse it (OR = 1.53, p = .028). Race/ethnicity coefficients are small and non-significant.
Importantly, once the perceptual predictors are entered into the model, the direct effect of respondent gender is no longer statistically significant (OR = 1.20, 95% CI 0.89–1.63, p = .240). The bivariate association between gender and the outcome (OR ≈ 1.87 in the simple univariate model implied by Table 2) is therefore largely accounted for by women’s higher rates of endorsing workplace discrimination and family burden as structural barriers. This is in agreement with the theoretical expectation that gender differences in beliefs about access to leadership are explained by gender differences in beliefs about the structure of workplaces, rather than a fundamental gender effect.
Table 3.
Logistic Regression Predicting Perception That Executive Access Is Easier for Men (N = 1,073; McFadden R2 = 0.150)
Table 3.
Logistic Regression Predicting Perception That Executive Access Is Easier for Men (N = 1,073; McFadden R2 = 0.150)
| Predictor | B (log-odds) | SE | z | p | OR | 95% CI |
|---|---|---|---|---|---|---|
| Intercept | 0.033 | 0.256 | 0.13 | .899 | 1.03 | [0.63, 1.71] |
| Female (ref. Male) | 0.182 | 0.155 | 1.18 | .240 | 1.20 | [0.89, 1.63] |
| Age 18–29 (ref. 50–64) | 0.136 | 0.272 | 0.50 | .618 | 1.15 | [0.67, 1.95] |
| Age 30–49 | 0.325 | 0.191 | 1.70 | .089 | 1.38 | [0.95, 2.01] |
| Age 65+ | 0.423 | 0.192 | 2.20 | .028 | 1.53 | [1.05, 2.23] |
| High school or less (ref. College+) | 0.214 | < .001 | 0.38 | [0.25, 0.58] | ||
| Some college | 0.171 | .002 | 0.58 | [0.42, 0.81] | ||
| Black non-Hispanic (ref. White) | 0.228 | 0.283 | 0.81 | .420 | 1.26 | [0.72, 2.19] |
| Hispanic | −0.089 | 0.281 | −0.32 | .752 | 0.92 | [0.53, 1.59] |
| Other / Asian | 0.370 | 0.341 | 1.08 | .278 | 1.45 | [0.74, 2.83] |
| Perceives family burden | 0.457 | 0.210 | 2.17 | .030 | 1.58 | [1.05, 2.38] |
| Perceives hiring discrimination | 0.179 | .017 | 0.65 | [0.46, 0.93] | ||
| Perceives workplace discrimination | 1.538 | 0.157 | 9.80 | < .001 | 4.66 | [3.42, 6.33] |
| Perceives lack of connections | 0.165 | < .001 | 0.56 | [0.40, 0.77] |
Note: Outcome: 1 = perceives it is easier for men to reach top executive roles; 0 otherwise. Reference categories in parentheses. Ridge penalty λ = 1 × 10⁻⁴. 95% CIs areWald-type (Hauck & Donner, 1977) on the odds-ratio scale. Significant predictors (p < .05) in bold.
Figure 3.
Adjusted odds ratios (95% CI) from the multivariable logistic regression predicting the belief that executive access is easier for men (N = 1,073). Predictors are grouped into perceptual variables (top) and demographic controls (bottom). Dashed reference line denotes OR = 1. Asterisks denote p < .05.
Figure 3.
Adjusted odds ratios (95% CI) from the multivariable logistic regression predicting the belief that executive access is easier for men (N = 1,073). Predictors are grouped into perceptual variables (top) and demographic controls (bottom). Dashed reference line denotes OR = 1. Asterisks denote p < .05.
4.4. Supervised Machine-Learning Benchmarks
To benchmark predictive performance and to confirm the relative importance of the perceptual predictors, three supervised machine-learning classifiers were trained on the same design matrix using a stratified 75/25 train/test split. Results are reported in Table 4. All three models achieve comparable out-of-sample performance, with test-set accuracy between 0.714 and 0.729 and AUC between 0.744 and 0.755. Gradient boosting achieves the highest accuracy and F1; random forest achieves the highest AUC and is therefore reported as the primary model for interpretation. All three models substantially outperform the base-rate classifier (which would achieve accuracy of 0.713 by always predicting the majority class) on the precision-recall trade-off and especially on recall (0.90–0.93), indicating that the model correctly identifies most respondents who hold the “easier for men” belief.
Figure 4.
Machine-learning benchmarks. (a) Random forest feature importance (mean decrease in Gini impurity); (b) receiver operating characteristic curves for the three classifiers on the held-out test set; (c) confusion matrix for the best-performing model (random forest) at the 0.5 probability threshold.
Figure 4.
Machine-learning benchmarks. (a) Random forest feature importance (mean decrease in Gini impurity); (b) receiver operating characteristic curves for the three classifiers on the held-out test set; (c) confusion matrix for the best-performing model (random forest) at the 0.5 probability threshold.
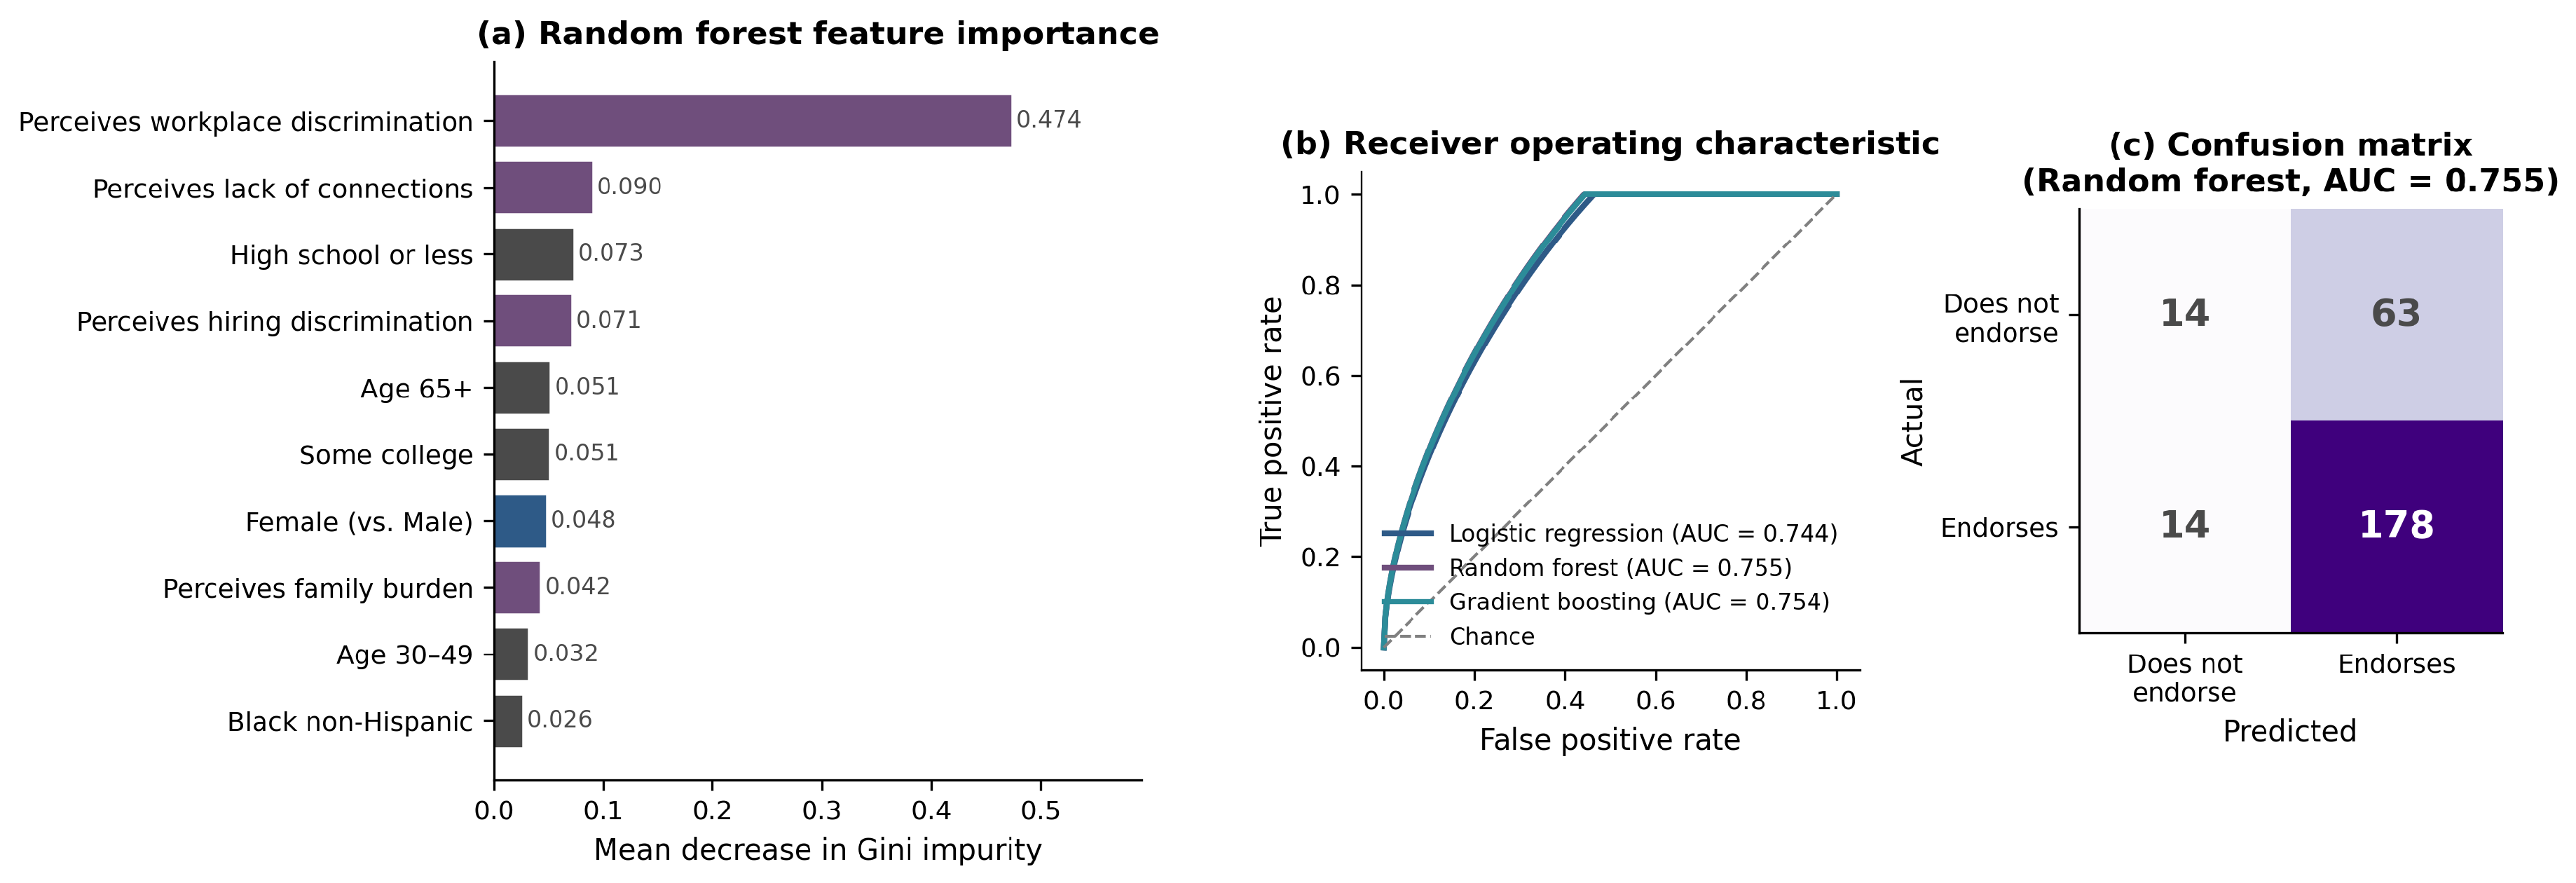
Random forest feature importance (Figure 4a) confirms the logistic-regression result: the single most important predictor of believing executive access is easier for men is the perception that workplace gender discrimination is a reason for women’s underrepresentation (Gini importance = 0.474, roughly five times larger than the next predictor). The next most informative predictors are lack of connections (0.090), high-school-or-less education (0.073), hiring discrimination (0.071) and age 65+ (0.051); respondent gender ranks seventh (0.048). This ordering reinforces the logistic-regression inference that the gender gap in the outcome is primarily mediated through women’s higher endorsement of workplace structural barriers.
Table 5.
Random Forest Variable Importance (Top Predictors).
| Rank | Feature | Mean decrease in Gini |
|---|---|---|
| 1 | Perceives workplace discrimination | 0.474 |
| 2 | Perceives lack of connections | 0.090 |
| 3 | High school or less (vs. College+) | 0.073 |
| 4 | Perceives hiring discrimination | 0.071 |
| 5 | Age 65+ | 0.051 |
| 6 | Some college (vs. College+) | 0.051 |
| 7 | Female | 0.048 |
| 8 | Perceives family burden | 0.042 |
| 9 | Age 30–49 | 0.032 |
| 10 | Black non-Hispanic | 0.026 |
Note: Values are mean decreases in Gini impurity aggregated over 100 bootstrapped CART trees. Higher values indicate greater average contribution to correct classification.
5. Discussion
Three patterns emerge from the analyzes. First, U.S. women and men share broadly similar views about the basic capability of women to lead: 63% of women and 66% of men agree that women are at least as capable as men of leading a business, with a Cramér’s V of just 0.033. This is consistent with the observation by Feenstra et al. (2023) that overt resistance to the idea of female leadership has declined over recent decades. Second, despite this generic egalitarianism, women are considerably more likely than men to report that executive access remains unequal, 79% vs. 67% say it is easier for men, and to identify the specific structural mechanisms that sustain the gap, particularly workplace discrimination, higher performance standards for women, and a thin executive pipeline. The largest gender differences appear exactly on the items that Social Role Theory predicts to be the most contested: those that locate the cause of women’s underrepresentation in the behavior of organizations rather than in the capabilities of women themselves. Third, once perceptions of structural barriers are held constant in the multivariable model, the direct effect of respondent gender on the “easier for men” belief is no longer statistically significant, while perceived workplace discrimination emerges as a very strong predictor (OR = 4.66).
These findings substantively extend the literature reviewed above. The chi-square evidence that perceptions of the executive pipeline are far more gendered than perceptions of leadership capability itself support the argument of Stainback et al. (2024) that attention should shift from headcount parity at the entry level to the structural mechanisms that shape advancement. The centrality of workplace discrimination in both the logistic regression and the random-forest importance ranking dovetails with the organizational-culture analysis of Shafaei and Nejati (2024) and Baker et al. (2025): when women evaluate leadership opportunity, they are not primarily responding to abstract cultural norms but to concrete features of how promotion, evaluation and sponsorship operate in practice. The education gradient in the outcome, college graduates are much more likely to endorse “easier for men” than respondents with high-school-or-less education, independent of the perceptual items echoes the findings of Khan et al. (2025) regarding the multi-level institutional conditioning of leadership discourse.
The perception-mediation result represents the most novel empirical contribution of the paper. Social Role Theory, as elaborated by Fletcher and Lysova (2026) and Galinsky et al. (2024), predicts that gender differences in beliefs about access to leadership should be reducible, at least in part, to gender differences in the perception of structural constraint. The data support this prediction. Women in the sample are not more likely to report that executive pathways are unequal simply because they are women; they are more likely to do so because they perceive the workplace as discriminatory and because they perceive caregiving responsibilities as a career cost. Once these two perceptions are conditioned on, respondent gender carries essentially no additional information about the outcome belief. This, indeed, can be seen as a numerical representation of the “feeling structure” postulated by Social Role Theory. Structural inequality is initially experienced as an everyday impression of organizational reality, and only then generalized into an assessment of one’s career path being easier.
The negative coefficients on “lack of connections” and “hiring discrimination” in the multivariable model merit attention. Both items correlate positively with the outcome in bivariate analyzes (where respondents who endorse them are more likely also to say it is easier for men) but turn negative after workplace discrimination and family burden are entered. The most parsimonious interpretation is that once “workplace discrimination” is held constant, a very broad concept that subsumes much of what the hiring and connections items measure, respondents who additionally single out hiring or networks tend to attribute the gap to a narrower and more interpersonal mechanism rather than to systematic male advantage. This is consistent with research by Barron et al. (2022) and Galos and Coppock (2023) showing that the specific framing of a discrimination question changes the population of respondents who endorse it.
Finally, the machine-learning results reinforce the substantive conclusions rather than supplanting them. Classical logistic regression and random forest return nearly identical test-set AUCs (0.744 vs. 0.755) and agree on the identity of the single dominant predictor. The value of the machine-learning analyzes in this setting is less about novel predictive power than about triangulation: a flexible non-parametric learner that makes no distributional assumptions nevertheless arrives at the same ranking of structural and perceptual predictors. From an EDI scholarship perspective, this provides additional confidence that the substantive conclusions are not artefacts of the assumed functional form.
6. Conclusions
This study examined the perceptions of 4,456 U.S. adults regarding women’s participation and leadership in the workforce, using nationally representative survey data from the Pew Research Center’s 2018 American Trends Panel Wave 36. The analysis combined chi-square tests, multivariable logistic regression and three supervised machine-learning classifiers to examine gender differences in perceptions and to identify which perceived barriers most strongly predict the belief that executive pathways remain easier for men.
The main result is that the gender difference in the examined belief is not produced independently as an outcome of gender itself; rather, it is mediated by gender-specific impressions of the workplace structure and of the career costliness imposed by family responsibilities. Respondents who see the workplace as discriminatory are nearly five times more likely to say that it is easier for men to reach the top, even after adjusting for demographics and other perceived barriers. By contrast, descriptive beliefs about whether women are capable of leading are essentially shared across genders, suggesting that contemporary U.S. public opinion has decoupled the question of capability from the question of access.
For equality, diversity and inclusion research and practice, the implication is that interventions focused exclusively on reshaping generic beliefs about women’s leadership are likely to yield modest returns; the leverage points visible in these data lie in the structural perceptions, workplace discrimination, higher performance standards, and a thin pipeline, that women disproportionately identify and that most directly predict their views of access. Organizations committed to gender equity should therefore audit and publicly report on evaluation, sponsorship and promotion processes; invest in structured pipeline development rather than one-off diversity statements; and treat perceived discrimination not as a reputational threat but as diagnostic information about how leadership opportunity is actually distributed.
7. Limitations and Future Research
This study is subject to several limitations that should be noted. First, the data are cross-sectional and capture stated perceptions rather than observed organizational outcomes; the analysis therefore cannot establish that perceiving workplace discrimination causes the belief that executive access is easier for men, only that the two move together in ways consistent with the theoretical framework. Second, the survey was fielded in June–July 2018, prior to the COVID-19 pandemic, the acceleration of remote work and prominent institutional DEI rollbacks. This temporal position is both a limitation and a contribution: the data establish a nationally representative pre-pandemic baseline against which subsequent attitudinal change can be measured. Researchers with access to later waves of the American Trends Panel are well-positioned to test whether the perception-mediation pattern documented here has strengthened, weakened or shifted in its demographic distribution. Third, Pew’s split-ballot design means that the most informative discrimination items were asked of only half the sample, reducing the effective multivariable sample size to N = 1,073 and precluding simultaneous inclusion of items from both forms in a single model. Fourth, the binary gender item available in Wave 36 does not permit analysis of gender-diverse respondents, a limitation that should be addressed as survey instruments continue to modernize. Fifth, the race categories are coarse, with Asian respondents folded into a broader “Other” category for estimation; intersectional analyzes of the kind Otaye-Ebede and Shaffakat (2024) call for would benefit from richer racial and ethnic detail and larger cell sizes. Finally, the dataset is restricted to U.S. adults and should not be extrapolated to other national contexts without further validation.
Future research could address these limitations in three ways. First, linking perception data to longitudinal administrative records would allow a direct test of whether individuals and organizations that perceive more structural bias also experience slower actual advancement for women. Second, causal-inference designs, including factorial vignette experiments and organizational audit studies in the tradition of Barron et al. (2022) and Galos and Coppock (2023), could complement the observational evidence reported here by isolating the mechanisms through which perceived bias translates into decisions. Third, cross-national replications would help identify which components of the perception-access linkage are specific to the U.S. institutional context and which reflect broader dynamics of gendered leadership.
Author Contributions
Conceptualization, data curation, formal analysis, methodology, software, writing–original draft, writing–review and editing: S.D. The author has read and agreed to the submitted version of the manuscript.
Funding
This research received no specific grant from any funding agency in the public, commercial, or not-for-profit sectors.
Institutional Review Board Statement
This study used publicly available, de-identified secondary survey data from the Pew Research Center’s American Trends Panel. The author did not collect data directly from human participants. According to the author’s declaration, separate institutional ethical approval was not required for this secondary analysis.
Informed Consent Statement
The author did not obtain informed consent directly because this study involved secondary analysis of publicly available, de-identified survey data. Consent procedures for the original survey data collection were managed by the Pew Research Center.
Data Availability Statement
The data that support this study are publicly available from the Pew Research Center American Trends Panel repository at https://www.pewresearch.org/american-trends-panel-datasets/. Analysis code is available from the corresponding author upon reasonable request.
Acknowledgments
The author acknowledges the Pew Research Center for making the American Trends Panel data publicly available. The Pew Research Center was not involved in the analysis, interpretation, writing, or decision to submit this manuscript.
Conflicts of Interest
The author declares no conflict of interest.
References
- Baker, M., Ali, M., Grabarski, M. K., & Konrad, A. (2025). Influence of women in leadership on gender-equality, work–life, and domestic violence coping practices: The role of chief executive officer gender. Human Resource Management Journal, 35(4), 1032–1046. [CrossRef]
- Barron, K., Ditlmann, R., Gehrig, S., & Schweighofer-Kodritsch, S. (2022). Explicit and implicit belief-based gender discrimination: A hiring experiment. SSRN Electronic Journal. [CrossRef]
- Choi, S., & Ko, Y. (2025). Does she belong here? Women in leadership positions and organizational performance in gendered institutions. Public Administration Review, 85(1), 238–251. [CrossRef]
- Cohen, J. (1988). Statistical power analysis for the behavioral sciences (2nd ed.). Lawrence Erlbaum Associates.
- Feenstra, S., Stoker, J. I., Lammers, J., & Garretsen, H. (2023). Managerial stereotypes over time: The rise of feminine leadership. Gender in Management: An International Journal, 38(6), 770–783. [CrossRef]
- Fletcher, L., & Lysova, E. I. (2026). Addressing gender in authenticity and inclusion at work: Nuancing conservation of resources theory with social role theory. Human Resource Management, 65(1), 219–234. [CrossRef]
- Galinsky, A. D., Turek, A., Agarwal, G., Anicich, E. M., Rucker, D. D., Bowles, H. R., Liberman, N., Levin, C., & Magee, J. C. (2024). Are many sex/gender differences really power differences? PNAS Nexus, 3(2), pgae025. [CrossRef]
- Galos, D. R., & Coppock, A. (2023). Gender composition predicts gender bias: A meta-reanalysis of hiring discrimination audit experiments. Science Advances, 9(18), eade7979. [CrossRef]
- Gander, M., & Sharafizad, F. (2025). Progressing gender equity in senior leadership: A systematic literature review. Gender in Management: An International Journal, 40(2), 352–369. [CrossRef]
- Hauck, W. W., & Donner, A. (1977). Wald’s test as applied to hypotheses in logit analysis. Journal of the American Statistical Association, 72(360), 851–853.
- Heilman, M. E., Caleo, S., & Manzi, F. (2024). Women at work: Pathways from gender stereotypes to gender bias and discrimination. Annual Review of Organizational Psychology and Organizational Behavior, 11(1), 165–192. [CrossRef]
- Ho, S. J., Jiang, J. W., Yu, C. T., Xu, E., & Yuen, E. Y. (2025). Asian American female residents’ perceptions of facilitators and barriers to leadership in medicine. JAMA Network Open, 8(5), e2512271. [CrossRef]
- Khan, M., Sulaiman, R., Nazir, O., Khan, S., & Awan, S. (2025). The unseen in the glass ceilings: Examining women’s career advancement in higher education institutions through a multilevel institutional lens. Human Resource Development International, 28(5), 799–826. [CrossRef]
- Lee, J., & Shin, H. (2024). Effects of inclusive leadership on the diversity climate and change-oriented organizational citizenship behavior. Behavioral Sciences, 14(6), 491. [CrossRef]
- Manzi, F., Caleo, S., & Heilman, M. E. (2024). Unfit or disliked: How descriptive and prescriptive gender stereotypes lead to discrimination against women. Current Opinion in Psychology, 60, 101928. [CrossRef]
- McFadden, D. (1974). Conditional logit analysis of qualitative choice behavior. In P. Zarembka (Ed.), Frontiers in econometrics (pp. 105–142). Academic Press.
- Naseer, S., Bouckenooghe, D., Syed, F., & Haider, A. (2024). Power of inclusive leadership: Exploring the mediating role of identity-related processes and conditional effects of synergy diversity climate in nurturing positive employee behaviors. Journal of Management & Organization, 30(6), 2066–2087. [CrossRef]
- Otaye-Ebede, L., & Shaffakat, S. (2024). Breaking the concrete ceiling: Resources and strategies for career success among Black and Asian minority ethnic women leaders. Journal of Occupational and Organizational Psychology, 97(4), 1243–1281. [CrossRef]
- Parker, K., & Funk, C. (2021). Women and leadership 2018. Pew Research Center. https://www.pewresearch.org/social-trends/2018/09/20/women-and-leadership-2018/.
- Pedregosa, F., Varoquaux, G., Gramfort, A., Michel, V., Thirion, B., Grisel, O., Blondel, M., Prettenhofer, P., Weiss, R., Dubourg, V., Vanderplas, J., Passos, A., Cournapeau, D., Brucher, M., Perrot, M., & Duchesnay, E. (2011). Scikit-learn: Machine learning in Python. Journal of Machine Learning Research, 12, 2825–2830.
- Pogrebna, G., Angelopoulos, S., Motsi-Omoijiade, I., Kharlamov, A., & Tkachenko, N. (2024). The impact of intersectional racial and gender biases on minority female leadership over two centuries. Scientific Reports, 14(1), 111. [CrossRef]
- Saenz, C., Wu, S.-W., Uddaraju, V., Nafei, A., & Liu, Y.-L. (2025). Advancing gender equality in executive leadership: The role of cultural norms and organizational practices in sustainable development—a case study of Taiwan and Guatemala. Sustainability, 17(7), 3183. [CrossRef]
- Sandretto, D., Rizzi, A., & Esposito, G. (2025). Gender diversity leadership and ESG performance: The influence of women on boards and in management. Business Strategy and the Environment, 34(4), 5075–5094. [CrossRef]
- Saville, N. M., Uppal, R., Odunga, S. A., Kedia, S., Odero, H. O., Tanaka, S., Kiwuwa-Muyingo, S., Eleh, L., Venkatesh, S., Zeinali, Z., Koay, A., Buse, K., Verma, R., & Hawkes, S. (2024). Pathways to leadership: What accounts for women’s (in)equitable career paths in the health sectors in India and Kenya? A scoping review. BMJ Global Health, 9(7), e014745. [CrossRef]
- Shafaei, A., & Nejati, M. (2024). Creating meaningful work for employees: The role of inclusive leadership. Human Resource Development Quarterly, 35(2), 189–211. [CrossRef]
- Stainback, K., Roberts, H., & Biswas, P. K. (2024). Women’s representation in managerial hierarchies: An examination of trickle-down and pipeline effects. Human Resource Management, 63(4), 619–637. [CrossRef]
- Tonoyan, V., Strohmeyer, R., & Jennings, J. (2025). Working for Jessica or Michael? Implications of gender stereotypes for job application intentions at technology startups. Strategic Entrepreneurship Journal, 19(2), 256–282. [CrossRef]
- Torres, A. J. C., Barbosa-Silva, L., Oliveira-Silva, L. C., Miziara, O. P. P., Guahy, U. C. R., Fisher, A. N., & Ryan, M. K. (2024). The impact of motherhood on women’s career progression: A scoping review of evidence-based interventions. Behavioral Sciences, 14(4), 275. [CrossRef]
- Tremmel, M., & Wahl, I. (2023). Gender stereotypes in leadership: Analyzing the content and evaluation of stereotypes about typical, male, and female leaders. Frontiers in Psychology, 14, 1034258. [CrossRef]
- Xintian, L., & Peng, P. (2023). Does inclusive leadership foster employee psychological resilience? The role of perceived insider status and supportive organizational climate. Frontiers in Psychology, 14, 1127780. [CrossRef]
Table 1.
Demographic Characteristics of the Analytic Sample (N = 4,456).
| Variable | Category | N | % |
|---|---|---|---|
| Total | 4,456 | 100.0 | |
| Sex | Female | 2,248 | 50.4 |
| Male | 2,208 | 49.6 | |
| Age group | 18–29 | 441 | 9.9 |
| 30–49 | 1,282 | 28.8 | |
| 50–64 | 1,434 | 32.2 | |
| 65+ | 1,294 | 29.0 | |
| Race/ethnicity | White non-Hispanic | 3,370 | 75.6 |
| Black non-Hispanic | 395 | 8.9 | |
| Hispanic | 366 | 8.2 | |
| Other / Asian | 267 | 6.0 | |
| Education | High school or less | 672 | 15.1 |
| Some college | 1,344 | 30.2 | |
| College graduate + | 2,430 | 54.5 |
Note: Percentages may not sum to 100 owing to rounding and missing data on individual variables. Source: Pew Research Center American Trends Panel Wave 36 (2018); U.S. citizen analytic sample.
Table 4.
Out-of-Sample Performance of Machine-Learning Classifiers (Test N = 269).
| Model | Accuracy | Precision | Recall | F1 | AUC |
|---|---|---|---|---|---|
| Logistic regression (L2) | 0.725 | 0.759 | 0.901 | 0.824 | 0.744 |
| Random forest | 0.714 | 0.739 | 0.927 | 0.822 | 0.755 |
| Gradient boosting | 0.729 | 0.758 | 0.911 | 0.827 | 0.754 |
Note: Training set N = 804; test set N = 269; class prevalence in the test set = 0.714. Random seed = 42. Performance metrics at the default 0.5 probability threshold. AUC is the area under the receiver operating characteristic curve. The best-performing model on AUC is shown in bold.
Disclaimer/Publisher’s Note: The statements, opinions and data contained in all publications are solely those of the individual author(s) and contributor(s) and not of MDPI and/or the editor(s). MDPI and/or the editor(s) disclaim responsibility for any injury to people or property resulting from any ideas, methods, instructions or products referred to in the content. |
© 2026 by the authors. Licensee MDPI, Basel, Switzerland. This article is an open access article distributed under the terms and conditions of the Creative Commons Attribution (CC BY) license (http://creativecommons.org/licenses/by/4.0/).
Copyright: This open access article is published under a Creative Commons CC BY 4.0 license, which permit the free download, distribution, and reuse, provided that the author and preprint are cited in any reuse.