

Submitted:
20 October 2026
Posted:
21 October 2026
You are already at the latest version
Abstract
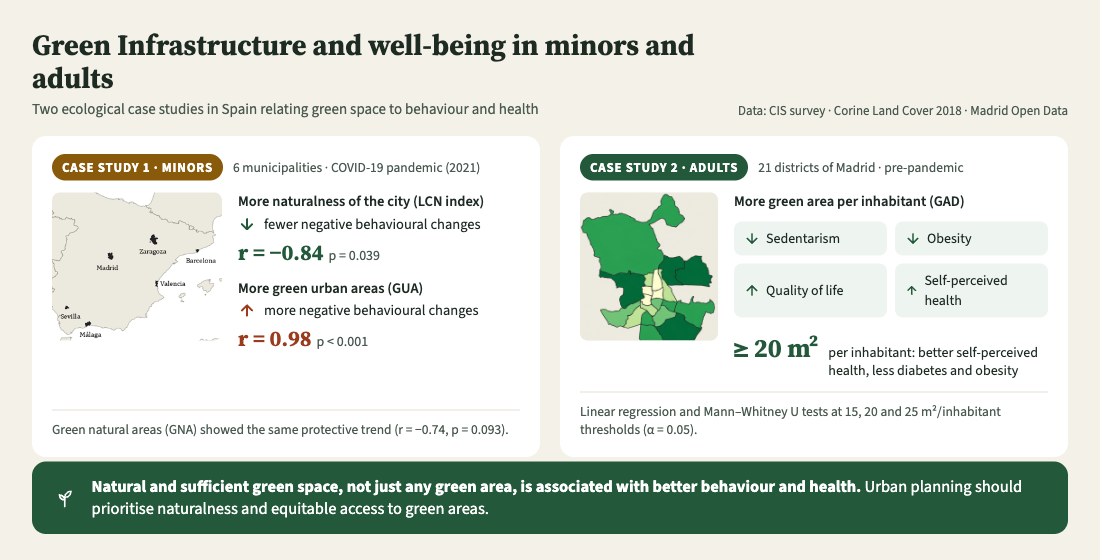
The beneficial relationship between Green Infrastructure and human wellbeing has been largely supported in literature. This work evaluates this beneficial relationship in two population groups (adults and minors). Health data for both groups was retrieved from reports and questionnaires, whereas data related to Green Infrastructure was obtained from the Corine Land Cover project. The naturalness of the cities was associated with fewer negative behavioural changes in minors: the rate of negative changes was inversely correlated with the Land Cover Naturalness index (r = -0.84, p = 0.039) and, although not significantly, with Green Natural Area (r = -0.74, p = 0.093), whereas it was positively correlated with Green Urban Area (r = 0.98, p < 0.001). In adults, the greater Green Area Density, the more optimistic inhabitants are about their health status perception (p-value = 0.031). In conclusion, natural spaces, as opposed to artificial green urban areas, may be associated with fewer negative behaviors in minors. Besides, a higher density of green areas per inhabitant was associated with better quality of life and self-perception of health and with lower sedentarism and obesity in adults.
Keywords:
Green Infrastructure
; mental health
; quality of life
; naturalness
; adults
; minors
1. Introduction
Green Infrastructure (GI) is a network of natural and seminatural areas providing a variety of Ecosystem Services (ES) that crystallize in provisioning, regulating, supporting and cultural benefits [1]. Cultural services, especially in the form of mental and emotional gains, are becoming of great interest due to the increasingly high demands on the brain entailed by current lifestyle, which is characterized by information overload, rushing or multitasking [2].
The beneficial relationship between GI and human wellbeing has been largely documented in the literature, especially during the last years due to the rising stress levels entailed by the COVID-19 pandemic [3]. However, there are multiple facets involved in this relationship, starting by user age (adults or minors) and followed by other variables such as GI type (seminatural or natural), scale of analysis (district or municipality) and evaluation period (before or after the COVID-19 pandemic).
The impacts of accessibility to GI on minors have been addressed from different points of view. Some studies reported benefits in terms of intelligence [4], cognitive functions such as attention [5], visual-motor abilities [6] and memory [7], physical activity [8] or health-related outcomes such as obesity, body fat percent, blood pressure, triglycerides or hospital admission [9,10]. Other investigations have emphasized the association between higher proportions of green spaces and fewer emotional problems [11,12], prosocial behavior [13] and externalizing disorders, especially aggression [14,15].
A recent review by McKinney and VerBerkmoes [16] found several studies devoted to evaluating the naturalness of GI. Most of them concluded that natural areas are more beneficial than built urban habitats [17] and pocket parks [18]. For instance, a study by Liu et al. [19] suggested that self-rated naturalness contributed positively to restoration and health in Chinese university students. In a similar vein, Krapez et al. [20] found that park visitors rated suburban parks as less natural than peri urban parks, as well as a positive relationship between perceived naturalness and benefits. Hoyle et al. [21] invited 1,411 users to walk through woodland, shrub and herbaceous planting at 31 sites in England, who perceived naturalness as biodiverse, attractive and restorative through a self-guided questionnaire.
These investigations coincided in valuing the degree of naturalness of GI from the ratings provided by the participants in their studies. Consequently, a research gap persists when it comes to evaluating the benefits of GI using metrics of naturalness not influenced by the perceptions of participants. Furthermore, this approach can be implemented to delve into the benefits of GI for minors, since previous studies did not include the degree of naturalness as an evaluation criterion. In this work, both aspects were examined through a case study concerning the association of closeness to seminatural and natural GI with behavioral changes in minors from 6 Spanish municipalities due to the COVID-19 pandemic.
However, the scope of this case study was limited because of the omission of some of the facets involved in the analysis of GI. It only accounted for children and adolescents, whereas its application was narrowed to a single spatial scale and the COVID-19 period. Adulthood interactions with nature-based recreation has been argued to be triggered by childhood experiences in nature [22,23,24]. Other studies [25] took the opposite perspective and pointed out to nature connectedness among adults as the strongest predictor of children’s nature connectedness. One way or another, these works provide evidence of the interest in studying both demographic groups.
The guide prepared by Barker et al. [26] emphasized the differences in the environmental benefits provided by different GI types when established at micro, meso and macro scales. Demuzere et al. [27] highlighted the importance of accounting for the links among different scales, because some ES provided by GI can be relevant for all scales and some others are more sensitive to spatial considerations. Other authors also stressed the relevance of considering the adequate spatial scale for each ES to result in better strategies for GI planning [28,29].
The COVID-19 pandemic has prompted an increase in the number of investigations devoted to assess the mental and behavioral condition of citizens due to mobility restrictions [30]. As a result, the value attributed to GI as spaces for recreation and restoration has grown due to lockdowns [31,32,33]. Since GI planning has recently become an intensely addressed subject of study due to its potential for climate change and urban development adaptation [34], its assessment under pre-pandemic conditions has been slightly diluted.
For these reasons, a complementary case study was proposed to address the remaining aspects involved in the mental-health benefits provided by GI. In this case, the target were adults living in Madrid’s districts before the COVID-19 pandemic. Overall, the joint analysis of both case studies sought to shed light on the complex relationship between GI and mental and behavioral wellbeing by analyzing it from multiple angles as described above.
2. Materials and Methods
Since the objective of this work was to evaluate the relationship between GI and certain health conditions in minors and adults, the methodology was based on two separate case studies. This differentiation makes sense since the procedure for collecting references to evaluate mental health in minors is different than in adults. In the case of children, the evaluation is carried out by observing adults (father or mother); in the case of adults, it is they who provide information about their health status.
In this context, different data sources were used to assess each case separately because studies including both groups (adults and minors) were not available in the same study or area report. Table 1 summarises the main datasets and the calculated variables used to analyse each case study, arranged according to three domains: territory, health, and GI.
2.1. Case Studies
Minors’ mental health status during the COVID-19 pandemic was assessed based on their parents’ reports. This information was obtained using the Spanish Sociological Research Centre (CIS in Spanish) “Questionnaire about the Mental Health of Spanish citizens during the COVID-19 pandemic” [35], which evaluated mental health conditions during the first year of the COVID-19 pandemic in 3,083 subjects.
The questions of interest asked whether parents reported changes in their minors’ behaviour, as long as they did not report that it was a positive change. The response to these questions was 0 or 1, where 0 meant that the participant noticed no change in his/her child’s behaviour, and vice versa for 1. Of the 3,083 respondents, 843 were parents with minor children and therefore answered this question. Although the CIS questionnaire was carried out widely throughout the Spanish territory, only data from 6 cities were considered in this work, since they had a representative number of samples of the variables of interest for this study.
Data characterizing GI areas were extracted from the most recent version of the Corine Land Cover (CLC) map [36] by considering a series of land cover classes related to GI. Besides, these data were also used to calculate the degree of naturalness of each municipality using the Land Cover Naturalness (LCN) index [37]. Naturalness exists on a gradient from completely natural to completely artificial or human-dominated [37]. Therefore, the LCN index is an indicator that measures the degree to which land use or cover is close to completely natural use.
On the other hand, data assessing the health status and self-perception of quality of life in adults were obtained from the annual sociodemographic study reports available at the Madrid Open Data public website (https://datos.madrid.es/portal/site/egob) as a panel of indicators for districts and neighbourhoods from 2016 to 2021. The information about GI was also taken from these reports. These datasets provide information about socioeconomic status, health, demographic, educational, quality of life, housing conditions, environment, municipal facilities, citizen participation and budget variables of the districts of Madrid. Nevertheless, only information related to health, quality of life and the environment was used in this work.
2.2. Data Processing
The variables summarised in Table 1 were processed according to the steps presented in Figure 1 for each case study.
The first step in the analysis of the minors’ case study was selecting the municipalities that had sufficient responses (n>10) to be part of the analysis. Six cities (Madrid, Barcelona, Valencia, Sevilla, Zaragoza, Málaga) were considered based on this requirement for subsequent analyses. The main question in this case was whether parents experienced changes in their minors’ behaviour during the pandemic. The behavioural changes of interest for this analysis were the negative ones. Therefore, responses to this main question involving positive changes were discarded. This filtering was carried out using the information provided by the specific questions about the changes presented in the questionnaire. From these responses, the rate of notifications of negative behavioural change in children (RATE_NEGATIVE_CHANGES) was calculated for each municipality. It was one of the objective variables of the analysis and was used to assess the mental health status of children.
The area covered by GI was computed using the breakdown defined in the CLC project and considering only the classes related to green urban areas (class 1.4.1) and natural areas (classes 3.1.1 – 3.3.5). From these data, the total area covered by each class was calculated for each municipality. Then, in each municipality, the variable representing Green Urban Areas (GUA) was directly associated with the total area of class 1.4.1, while the Green Natural Areas (GNA) were obtained as the sum of the areas of classes 3.1.1 to 3.3.5. Note that not all natural classes are present in all municipalities.
Aside from this discrete distinction between GUA and GNA, a more continuous concept of naturalness was considered through the Land Cover Naturalness (LCN) index [37], which assigns a score to different land cover types depending on the degree of landscape transformation. The LCN for each municipality was obtained using Equation (1).
where is the total area of the municipality; is the area of land cover type ; represents the degree of naturalness of land cover type ; and is the total number of land cover types considered. The values were set as shown in Table 2. These proposed values were defined to represent the contribution of each land cover type to naturalness. The larger the value of , the more natural.
Data processing for the adults’ case study was simpler because the variables to characterize their health condition and the extent of GI across the districts were available directly from open data repositories, which provided this information disaggregated by districts. Hence, data processing focused on the temporal consistency of the records. This was checked because not all variables are updated annually and there are values that remain the same compared to the previous year. Fortunately, the temporal reference was indicated and the data were prepared to have temporal correspondence between the variables. As a result, complete datasets were obtained for the reference years 2014, 2017, and 2019 (as indicated in the 2016–2021 reports), resulting in a final sample of 63 observations (21 districts × 3 years). For this reason, consecutive years could not be taken into account.
The variables of interest were as follows: sedentary lifestyle (SEDENTARISM), tobacco use (TOBACCO), medication use (MEDICATION), self-perception of good health (SP_GOODHEALTH), quality of life (QOL), presence of a chronic disease (CHRONIC), arterial hypertension (HYPERTENSION), diabetes (DIABETES), obesity (OBESITY), and probability of mental disease (p_MENTAL)
Self-perception of good health was measured as the percentage of cases reporting good and very good health. Quality of life of each sample was estimated using the COOP/WONCA [38]. Higher values indicate a worse quality of life. The probability of mental disease was determined using the results of the General Health Questionnaire -12 (GHQ-12) [39], which was completed by the participants. The remaining variables represent the percentage of people reporting some of the health conditions considered.
The Green Area Density per inhabitant () was calculated for each district as indicated in Equation (2).
From this calculated variable, three different categorical transformations of were performed (, , ), according to the three thresholds shown in Equation (3).
The software R 4.1.0 was used for the data processing process described above. In particular, the sp, sf, and raster libraries were used for the spatial analysis.
2.3. Statistical Analysis
This analysis was conducted using R version 4.1.0 to assess the relationship between GI and mental health across both case studies, following the methodological procedure described below. In each case, the initial step involved quantifying the degree of association between variables related to GI and those linked to health conditions. Pearson’s correlation coefficient was employed for this purpose [40]. Subsequently, the statistical significance of the linear correlations was evaluated using the p-value, which denotes the probability of obtaining a correlation at least as extreme as the one observed if the null hypothesis (H0) were true [41]. The obtained p-values were compared against a significance threshold (α) of 0.05 [42]. Within this analytical framework, H0 posited the absence of a statistically significant correlation between GI-related variables and health condition variables, whereas the alternative hypothesis (H1) suggested the presence of such a relationship. Accordingly, H1 was accepted in instances where the p-value was below 0.05, indicating statistically significant associations.
Additionally, in case study 2 (adults), the relevance of the different values of GAD on health conditions was assessed using inferential statistics, which were applied considering the three categorical transformations of GAD according to different thresholds (15 m2/pop., 20 m2/pop., and 25 m2/pop.). The use of inferential statistics consisted of the application of different tests to compare both groups or classes. Given the non-normality of the data, the Mann-Whitney U test [43] was computed to carry out compare each health variable between the two groups defined by each threshold. A p-value below 0.05 was an indicative of the presence of statistically significant differences between health conditions in the two groups considered (GAD < threshold and GAD ≥ threshold).
3. Results
3.1. Case Study 1: Minors
The distribution of the two GI-related land cover types of interest across the 6 evaluated municipalities is shown in Figure 2. The areas corresponding to GUA and GNA were determined from the spatial arrangement of these GI land covers.
The variable RATE_NEGATIVE_CHANGES was modelled with respect to the total area of GUA and GNA using a linear regression model. The effect of the degree of naturalness in the municipality (measured by the LCN index) on RATE_NEGATIVE_CHANGES was also modelled by linear regression. The Pearson’s correlation coefficient (r) and statistical significance (p-value) for the assessed relationships are shown in Figure 3.
The GUA area was strongly correlated with negative changes in minors’ behaviour (r = 0.98, R² = 0.953, p < 0.001). This direct relationship suggests that the larger the area allocated to GUA (including artificial areas), the more the children’s behaviour changed. This finding might represent the effect that restricted access to these types of spaces during the lockdown had on children. Knowing about the existence of GI and not being able to access it could have had a negative effect on the children’s behavioural aspects.
The naturalness of the cities and the existence of GNA within the cities were also associated with the minors’ behavioural change. However, it was an inverse relationship (r = -0.74, R² = 0.547, p = 0.093 and r = -0.84, R² = 0.697, p = 0.039 for GNA and LCN, respectively). The inverse relationship with LCN was statistically significant at α = 0.05, whereas that with GNA was only significant at α = 0.10, which may be related to the small number of municipalities analysed (n = 6). Therefore, the naturalness of cities could contribute to reducing negative behavioural changes in minors and have positive effects on children’s health.
3.2. Case Study 2: Adults
The distribution of GAD across all districts of Madrid is depicted in Figure 4. The variables considered to assess the health conditions in adult status were modelled in terms of GAD using linear regression analysis. The Pearson’s correlation coefficient (r) and statistical significance (p-value) for the assessed relationships are shown in Figure 5.
Of the variables evaluated, SEDENTARISM, QOL, and OBESITY showed a statistically significant relationship with GAD (p-values of 0.047, 0.029, and 0.006, respectively). The direction of these relationships is inverse, that is, the more GI area per inhabitant, the lower the likelihood of a sedentary lifestyle, the lower the likelihood of suffering from obesity and the better the quality of life related to health.
Regarding self-perception of good health, the relationship with the density of green areas per inhabitant was also significant (p-value = 0.031), but in this case in a direct sense. According to the regression line, the more GAD, the more optimistic inhabitants are about their perception of their health status.
The Pearson’s correlation coefficient of these four variables with GAD (r = -0.25, -0.34, 0.27 and -0.34 for SEDENTARISM, QOL, SP_GOODHEALTH and OBESITY, respectively; n = 63) showed low correlations. This was expected because of the high dispersion of the data and the reduced sample size. The R2 of the linear regression models was also low (R² between 0.063 and 0.117). This indicates that GAD explains only a small fraction of the variability of these health indicators, which are also influenced by many other factors. Nevertheless, the p-values indicate that the relationship between the variables was statistically significant.
Analysis of the relationships between GAD and the remaining variables did not reveal statistically significant results. However, an inverse trend was observed both in the relationships between diabetes and GAD (the larger the GI area, the lower the proportion of diabetics) and between the probability of suffering a mental disease and GAD (the larger the GI area, the lower the probability of suffering a mental disease).
The categorical transformations of the GAD variable considering the three thresholds proposed (Equation (3)) were used to evaluate whether there were significant differences between the set of samples corresponding to a GAD below the given threshold and the set corresponding to a GAD above or equal to the considered threshold. Table 3 summarizes the p-values resulting from the Mann-Whitney U test applied to SEDENTARISM, SP_GOODHEALTH, QOL, DIABETES, OBESITY, and p_MENTAL, grouped by GAD class15, GAD class20 and GAD class25.
The results of the test revealed that, from a threshold of 20 m² of GI per inhabitant, the self-perception of good health (p = 0.021), the proportion of diabetics (p = 0.030) and obesity (p = 0.033) differed significantly (α = 0.05) between districts with GAD ≥ 20 m² and those with GAD < 20 m², and these differences remained significant for the 25 m² threshold (p = 0.039, 0.040 and 0.026, respectively). Quality of life only differed significantly for the 25 m² threshold (p = 0.033), whereas for the 20 m² threshold the difference was only significant at α = 0.10 (p = 0.066). The proportion of diabetics also differed significantly for the 15 m² threshold (p = 0.043). As shown in Figure 6, the differences between groups are associated with better status of the health variables evaluated when GAD ≥ 20 m². This trend was also found for sedentarism, but only at a level of significance (α) of 10% (p = 0.074 and p = 0.054 for the 20 m² and 25 m² thresholds, respectively). No significant differences were found for p_MENTAL for any of the thresholds.
4. Discussion
The objective of the present research was twofold: (1) to evaluate behavioral changes in minors concerning the association of closeness to seminatural and natural Green Infrastructure (GI) during the COVID-19 pandemic, and (2) to assess pre-pandemic health behaviors in adults in relation to GI. Our analysis covered distinct developmental groups (minors and adults) under different conditions (pandemic and pre-pandemic periods), revealing important insights into the relationship between GI and health outcomes
Regarding minors, our results allow to distinguish between Green Urban Areas (GUA) and Green Natural Areas (GNA). In this way, GUA have been associated with more negative behavioral changes in minors reported by their parents. Likewise, Flouri, Midouhas, and Joshi [44] found that children with less green space in their neighborhoods exhibited more emotional problems compared to children in greener neighborhoods. The difficulties in accessing GUA compared to the naturalness of cities or natural areas, and the lack of presence of underage peers and friends in GUA due to the pandemic, may also affect the results. As pointed out by Yin, Kasraian and van Wesemael [45] in a recent review, urban minors are more likely to spend time with screens indoors. The authors concluded that the presence of peers and friends is very important in promoting contact with GUA. Another interpretation comes from Loebach and Gilliland [46], who consider that minors sometimes perceive that GUA have poor aesthetics or conditions, making them less motivating for use than natural areas. Consequently, minors surrounded by GUA appear to be more likely to develop negative behaviors than their counterparts with access to GNA. Our results showed that closeness to GNA was associated with fewer negative behavioral changes in minors, although this association was only significant at α = 0.10 (p = 0.093), whereas the association with the overall degree of naturalness of the municipality (LCN) was significant (p = 0.039). This supports other studies that have reported significant associations between GI and health, mental health, or quality of life in minors by their parents [47,48]. In these circumstances, our research highlights the importance of maximizing natural areas accessible to minors. Their presence might act as a protective factor against mental disorders or other pathologies characterized by negative behavior in minors, although this should be confirmed by studies based on individual-level data.
In the case of adults, our results showed that Green Area Density per inhabitant (GAD) was associated with sedentary lifestyle, quality of life, and obesity. Specifically, the higher the GAD, the lower the prevalence of sedentarism and obesity and the better the health-related quality of life. Similarly, Nieuwenhuijsen [49] concluded that there are many health benefits that lead to improved physical health. Additionally, Shen et al. [50] showed that most studies found that environmental metrics were inversely related to Body Mass Index (BMI), overweight, and obesity. Browning and Rigolon [51] also found a link between greenness and lower obesity and better mental health in a study of 496 cities. Our study goes further by also showing better values of the following variables when GAD exceeded certain thresholds: self-perceived health, diabetes and obesity (from 20 m²/inhabitant) and quality of life (from 25 m²/inhabitant). Although the health benefits of GI are well known, research in this field should consider its density as our results showed significant differences in this sense.
Despite the evidence found in both case studies, the underlying mechanisms behind the health benefits of GI have yet to be determined. Some authors have suggested that GI can enhance relational aspects such as social interactions or reduce stress [52,53]. Others have focused on material aspects of GI such as closeness, abundance, or quality [54]. A recent review comparing both research perspectives over the past 20 years found relational as well as material evidence for the health effects of GI [55]. As Barton and Grant [56] have suggested, health is multifactorial: health outcomes are influenced not only by the presence of naturalness, but also by the individual’s social personal context.
Although equity was not directly analyzed in this study, our results are consistent with recent studies analyzing environmental justice in the distribution of GI [57,58], including the creation of indices to measure it [59,60]. Besides equity, the provision of GI should also consider its degree of naturalness due to the higher values of natural greenery in terms of ecosystem services [61,62]. Ultimately, the convergence of our results with these trends indicates the direction policymakers should take when planning public spaces and how GI should be integrated into such plans.
5. Conclusions
This study provides further evidence of the association between GI and health and behavioral outcomes: on the one hand, we analyzed a sample of minors and examined how the degree of naturalness of their surrounding green areas was associated with negative behavioral changes in them during the COVID-19 pandemic. In this sense, natural spaces, as opposed to artificial green urban areas, were associated with fewer negative behaviors. On the other and, a second case study on the effects of GI on adult health was evaluated. In this regard, we found that the density of green areas per inhabitant is inversely related to the presence of sedentary lifestyles and obesity, while being associated with better quality of life and self-perception of health. Overall, these results add new value to previous research that reported the behavioral and health benefits of GI.
The separate consideration of minors and adults, coupled with the viewpoints of naturalness and density of green spaces per capita, provides a broad perspective on important aspects for appropriate planning of GI to foster its behavioral and health benefits. Therefore, these results may be of particular interest to public administrations, which should consider naturalness and equal accessibility when planning the deployment of GI in their territories to ensure spatial and environmental justice for all citizens.
Despite its contributions, the present research suffers from some limitations. The data used for the first case study did not indicate the age of minors, thereby encompassing a large population from 1 to 18 years old. A more detailed analysis according to developmental stages could lead to different results. In addition, the results may also be influenced by gender, a parameter that was also not specified in the dataset used. Assessing the relationship between GI and behavioral change in minors may also benefit from an analysis of their use, including e.g., socialization, sports, etc. Future studies should pay attention to these gaps to continue generating knowledge about the role of natural GI. Regarding the adult-oriented case study, the sample size was small because we used data from a previous investigation that was not aimed at evaluating GI. Although our research represents an initial approach leading to relevant results, more exhaustive studies with larger samples would be required to consolidate the evidence found here.
Several methodological limitations should also be acknowledged. First, both case studies follow an ecological design, so the associations found at the municipality and district levels cannot be directly extrapolated to individuals and do not allow causal inferences. Second, the minors’ case study was based on only six municipalities, which limits statistical power and stability of the correlation estimates. In addition, GUA and GNA were expressed as total areas, so part of these associations may reflect differences in city size rather than in green space provision; in this respect, the LCN index, which is normalized by the municipal area, provides a more robust indicator. Third, in the adults’ case study, the observations correspond to the same 21 districts measured in different years and are therefore not fully independent, which may have led to underestimated p-values; future analyses should use repeated-measures or mixed-effects models. Fourth, potential confounders such as income, educational level or the age structure of the districts, which are known to be associated with both green space provision and health outcomes, were not controlled for. Finally, a relatively large number of statistical tests was performed without correction for multiple comparisons, so results with p-values close to 0.05 should be interpreted with caution. For all these reasons, the findings of this study should be regarded as exploratory.
Author Contributions
Conceptualization, V.M., D.J.-E. and L.O.G.; methodology, V.M. and D.J.-E.; formal analysis, V.M. and D.J.-E.; investigation, V.M., D.J.-E. and L.O.G.; data curation, V.M. and D.J.-E.; writing—original draft preparation, V.M., D.J.-E. and L.O.G.; writing—review and editing, V.M., D.J.-E. and L.O.G.; visualization, V.M. All authors have read and agreed to the published version of the manuscript.
Funding
This research received no external funding.
Institutional Review Board Statement
Ethical review and approval were waived for this study because it was based exclusively on anonymised secondary data from public sources.
Informed Consent Statement
Not applicable.
Data Availability Statement
The datasets generated and/or analyzed during the current study are not publicly available but are available from the corresponding author on reasonable request. Access to the data has been granted by the original data provider for the purposes of this research.
Conflicts of Interest
The authors declare no conflicts of interest.
Abbreviations
The following abbreviations are used in this manuscript:
| CIS | Centro de Investigaciones Sociológicas (Spanish Sociological Research Centre) |
| CLC | Corine Land Cover |
| ES | Ecosystem Services |
| GAD | Green Area Density per inhabitant |
| GHQ-12 | General Health Questionnaire-12 |
| GI | Green Infrastructure |
| GNA | Green Natural Areas |
| GUA | Green Urban Areas |
| LCN | Land Cover Naturalness |
| QOL | Quality of life |
References
- Paletto, A.; Favargiotti, S. Ecosystem Services: The Key to Human Well-Being. Forests 2021, 12, 480. [Google Scholar] [CrossRef]
- Kaufeldt, M. How the Stress Mess Impacts Learning. In Neuro-Systemic Applications in Learning; Thomas, K.A., Kureethara, J.V., Bhattacharyya, S., Eds.; Springer International Publishing: Cham, Switzerland, 2021; pp. 387–402. [Google Scholar] [CrossRef]
- Heckert, M.; Bristowe, A. Parks and the Pandemic: A Scoping Review of Research on Green Infrastructure Use and Health Outcomes during COVID-19. Int. J. Environ. Res. Public Health 2021, 18, 13096. [Google Scholar] [CrossRef] [PubMed]
- Almeida, D.Q.; Barros, H.; Ribeiro, A.I. Residential and school green and blue spaces and intelligence in children: The Generation XXI birth cohort. Sci. Total Environ. 2022, 813, 151859. [Google Scholar] [CrossRef] [PubMed]
- Bijnens, E.M.; Vos, S.; Verheyen, V.V.; Bruckers, L.; Covaci, A.; De Henauw, S.; Den Hond, E.; Loots, I.; Nelen, V.; Plusquin, M.; Schoeters, G.; Nawrot, T.S. Higher surrounding green space is associated with better attention in Flemish adolescents. Environ. Int. 2022, 159, 107016. [Google Scholar] [CrossRef] [PubMed]
- Jimenez, M.P.; Shoaff, J.; Kioumourtzoglou, M.-A.; Korrick, S.; Rifas-Shiman, S.L.; Hivert, M.-F.; Oken, E.; James, P. Early-Life Exposure to Green Space and Mid-Childhood Cognition in the Project Viva Cohort, Massachusetts. Am. J. Epidemiol. 2022, 191, 115–125. [Google Scholar] [CrossRef] [PubMed]
- Dockx, Y.; Bijnens, E.M.; Luyten, L.; Peusens, M.; Provost, E.; Rasking, L.; Sleurs, H.; Hogervorst, J.; Plusquin, M.; Casas, L.; Nawrot, T.S. Early life exposure to residential green space impacts cognitive functioning in children aged 4 to 6 years. Environ. Int. 2022, 161, 107094. [Google Scholar] [CrossRef] [PubMed]
- Akpınar, A. Investigating the barriers preventing adolescents from physical activities in urban green spaces. Urban For. Urban Green. 2020, 53, 126724. [Google Scholar] [CrossRef]
- Jia, P.; Cao, X.; Yang, H.; Dai, S.; He, P.; Huang, G.; Wu, T.; Wang, Y. Green space access in the neighbourhood and childhood obesity. Obes. Rev. 2021, 22, e13100. [Google Scholar] [CrossRef] [PubMed]
- Putra, I.G.N.E.; Astell-Burt, T.; Feng, X. Perceived green space quality, child biomarkers and health-related outcomes: A longitudinal study. Environ. Pollut. 2022, 303, 119075. [Google Scholar] [CrossRef] [PubMed]
- Liao, J.; Yang, S.; Xia, W.; Peng, A.; Zhao, J.; Li, Y.; Zhang, Y.; Qian, Z.; Vaughn, M.G.; Schootman, M.; Zhang, B.; Xu, S. Associations of exposure to green space with problem behaviours in preschool-aged children. Int. J. Epidemiol. 2020, 49, 944–953. [Google Scholar] [CrossRef] [PubMed]
- Poulain, T.; Sobek, C.; Ludwig, J.; Igel, U.; Grande, G.; Ott, V.; Kiess, W.; Körner, A.; Vogel, M. Associations of Green Spaces and Streets in the Living Environment with Outdoor Activity, Media Use, Overweight/Obesity and Emotional Wellbeing in Children and Adolescents. Int. J. Environ. Res. Public Health 2020, 17, 6321. [Google Scholar] [CrossRef] [PubMed]
- Putra, I.G.N.E.; Astell-Burt, T.; Cliff, D.P.; Vella, S.A.; Feng, X. Association between green space quality and prosocial behaviour: A 10-year multilevel longitudinal analysis of Australian children. Environ. Res. 2021, 196, 110334. [Google Scholar] [CrossRef] [PubMed]
- Bijnens, E.M.; Derom, C.; Thiery, E.; Weyers, S.; Nawrot, T.S. Residential green space and child intelligence and behavior across urban, suburban, and rural areas in Belgium: A longitudinal birth cohort study of twins. PLoS Med. 2020, 17, e1003213. [Google Scholar] [CrossRef] [PubMed]
- Lee, M.; Kim, S.; Ha, M. Community greenness and neurobehavioral health in children and adolescents. Sci. Total Environ. 2019, 672, 381–388. [Google Scholar] [CrossRef] [PubMed]
- McKinney, M.L.; VerBerkmoes, A. Beneficial Health Outcomes of Natural Green Infrastructure in Cities. Curr. Landsc. Ecol. Rep. 2020, 5, 35–44. [Google Scholar] [CrossRef]
- White, M.P.; Pahl, S.; Ashbullby, K.; Herbert, S.; Depledge, M.H. Feelings of restoration from recent nature visits. J. Environ. Psychol. 2013, 35, 40–51. [Google Scholar] [CrossRef]
- McAllister, E.; Bhullar, N.; Schutte, N.S. Into the Woods or a Stroll in the Park: How Virtual Contact with Nature Impacts Positive and Negative Affect. Int. J. Environ. Res. Public Health 2017, 14, 786. [Google Scholar] [CrossRef] [PubMed]
- Liu, Q.; Zhang, Y.; Lin, Y.; You, D.; Zhang, W.; Huang, Q.; Konijnendijk van den Bosch, C.C.; Lan, S. The relationship between self-rated naturalness of university green space and students’ restoration and health. Urban For. Urban Green. 2018, 34, 259–268. [Google Scholar] [CrossRef]
- Krapez, A.; Hughes, M.; Newsome, D. Perceptions of ‘naturalness’ by urban park visitors: Insights from Perth, Western Australia. Int. J. Geoheritage Park. 2021, 9, 450–462. [Google Scholar] [CrossRef]
- Hoyle, H.; Jorgensen, A.; Hitchmough, J.D. What determines how we see nature? Perceptions of naturalness in designed urban green spaces. People Nat. 2019, 1, 167–180. [Google Scholar] [CrossRef]
- Hosaka, T.; Numata, S.; Sugimoto, K. Research Note: Relationship between childhood nature play and adulthood participation in nature-based recreation among urban residents in Tokyo area. Landsc. Urban Plan. 2018, 180, 1–4. [Google Scholar] [CrossRef]
- Rosa, C.D.; Profice, C.C.; Collado, S. Nature Experiences and Adults’ Self-Reported Pro-environmental Behaviors: The Role of Connectedness to Nature and Childhood Nature Experiences. Front. Psychol. 2018, 9, 1055. [Google Scholar] [CrossRef] [PubMed]
- Thompson, C.W.; Aspinall, P.; Montarzino, A. The Childhood Factor: Adult Visits to Green Places and the Significance of Childhood Experience. Environ. Behav. 2008, 40, 111–143. [Google Scholar] [CrossRef]
- Passmore, H.-A.; Martin, L.; Richardson, M.; White, M.; Hunt, A.; Pahl, S. Parental/Guardians’ Connection to Nature Better Predicts Children’s Nature Connectedness than Visits or Area-Level Characteristics. Ecopsychology 2021, 13, 103–113. [Google Scholar] [CrossRef]
- Barker, A.; Clay, G.; Rothwell, J.; Gilchrist, A.; Tantanasi, I.; Morrison, R.; Payne, S. Understanding Green Infrastructure at Different Scales: A Signposting Guide; The University of Manchester and The University of Sheffield: Manchester and Sheffield, UK, 2019. [Google Scholar] [CrossRef]
- Demuzere, M.; Orru, K.; Heidrich, O.; Olazabal, E.; Geneletti, D.; Orru, H.; Bhave, A.G.; Mittal, N.; Feliu, E.; Faehnle, M. Mitigating and adapting to climate change: Multi-functional and multi-scale assessment of green urban infrastructure. J. Environ. Manag. 2014, 146, 107–115. [Google Scholar] [CrossRef] [PubMed]
- Kim, J. Exploring green infrastructure benefits at house and neighborhood scale: Case study of Illinois, USA. Landsc. Ecol. Eng. 2018, 14, 165–174. [Google Scholar] [CrossRef]
- Pochee, H.; Johnston, I. Understanding design scales for a range of potential green infrastructure benefits in a London Garden City. Build. Serv. Eng. Res. Technol. 2017, 38, 728–756. [Google Scholar] [CrossRef]
- Cheung, D.; Ip, E.C. COVID-19 Lockdowns: A Public Mental Health Ethics Perspective. Asian Bioeth. Rev. 2020, 12, 503–510. [Google Scholar] [CrossRef] [PubMed]
- da Schio, N.; Phillips, A.; Fransen, K.; Wolff, M.; Haase, D.; Krajter Ostoić, S.; Živojinović, I.; Vuletić, D.; Derks, J.; Davies, C.; Lafortezza, R.; Roitsch, D.; Winkel, G.; De Vreese, R. The impact of the COVID-19 pandemic on the use of and attitudes towards urban forests and green spaces: Exploring the instigators of change in Belgium. Urban For. Urban Green. 2021, 65, 127305. [Google Scholar] [CrossRef] [PubMed]
- Dushkova, D.; Ignatieva, M.; Hughes, M.; Konstantinova, A.; Vasenev, V.; Dovletyarova, E. Human dimensions of urban blue and green infrastructure during a pandemic. Case study of Moscow (Russia) and Perth (Australia). Sustainability 2021, 13, 4148. [Google Scholar] [CrossRef]
- Jato-Espino, D.; Moscardó, V.; Vallina Rodríguez, A.; Lázaro, E. Spatial statistical analysis of the relationship between self-reported mental health during the COVID-19 lockdown and closeness to green infrastructure. Urban For. Urban Green. 2022, 68, 127457. [Google Scholar] [CrossRef] [PubMed]
- Shade, C.; Kremer, P.; Rockwell, J.S.; Henderson, K.G. The effects of urban development and current green infrastructure policy on future climate change resilience. Ecol. Soc. 2020, 25, 37. [Google Scholar] [CrossRef]
- Centro de Investigaciones Sociológicas (CIS). Encuesta sobre la Salud Mental de los/as Españoles/as Durante la Pandemia de la COVID-19 (Estudio n.º 3312); CIS: Madrid, Spain, 2021; Available online: https://www.cis.es.
- Copernicus Land Monitoring Service. CORINE Land Cover 2018 (CLC2018). European Environment Agency. Available online: https://land.copernicus.eu/en/products/corine-land-cover.
- Shaad, K.; Alt, H. An open source toolbox for integrating freshwater social-ecological indicators in basin management. J. Open Res. Softw. 2020, 8, 9. [Google Scholar] [CrossRef]
- Lizán Tudela, L.; Reig Ferrer, A. Adaptación transcultural de una medida de la calidad de vida relacionada con la salud: La versión española de las viñetas COOP/WONCA. Aten. Primaria 1999, 24, 75–82. [Google Scholar] [PubMed]
- Goldberg, D.; Williams, P. A User’s Guide to the General Health Questionnaire; NFER-Nelson: Windsor, UK, 1988. [Google Scholar]
- Schober, P.; Boer, C.; Schwarte, L.A. Correlation coefficients: Appropriate use and interpretation. Anesth. Analg. 2018, 126, 1763–1768. [Google Scholar] [CrossRef] [PubMed]
- Nickerson, R.S. Null hypothesis significance testing: A review of an old and continuing controversy. Psychol. Methods 2000, 5, 241–301. [Google Scholar] [CrossRef] [PubMed]
- Fisher, R.A. Statistical methods for research workers. In Breakthroughs in Statistics: Methodology and Distribution; Kotz, S., Johnson, N.L., Eds.; Springer: New York, NY, USA, 1992; pp. 66–70. [Google Scholar] [CrossRef]
- Mann, H.B.; Whitney, D.R. On a test of whether one of two random variables is stochastically larger than the other. Ann. Math. Stat. 1947, 18, 50–60. [Google Scholar] [CrossRef]
- Flouri, E.; Midouhas, E.; Joshi, H. The role of urban neighbourhood green space in children’s emotional and behavioural resilience. J. Environ. Psychol. 2014, 40, 179–186. [Google Scholar] [CrossRef]
- Yin, S.; Kasraian, D.; van Wesemael, P. Children and urban green infrastructure in the digital age: A systematic literature review. Int. J. Environ. Res. Public Health 2022, 19, 5906. [Google Scholar] [CrossRef] [PubMed]
- Loebach, J.E.; Gilliland, J.A. Child-led tours to uncover children’s perceptions and use of neighborhood environments. Child. Youth Environ. 2010, 20, 52–90. [Google Scholar] [CrossRef]
- Sanders, T.; Feng, X.; Fahey, P.P.; Lonsdale, C.; Astell-Burt, T. The influence of neighbourhood green space on children’s physical activity and screen time: Findings from the longitudinal study of Australian children. Int. J. Behav. Nutr. Phys. Act. 2015, 12, 126. [Google Scholar] [CrossRef] [PubMed]
- Tillmann, S.; Clark, A.F.; Gilliland, J.A. Children and nature: Linking accessibility of natural environments and children’s health-related quality of life. Int. J. Environ. Res. Public Health 2018, 15, 1072. [Google Scholar] [CrossRef] [PubMed]
- Nieuwenhuijsen, M.J. Green infrastructure and health. Annu. Rev. Public Health 2021, 42, 317–328. [Google Scholar] [CrossRef] [PubMed]
- Shen, J.; Li, M.; Wang, Q.; Liu, R.; Ji, M.; An, R. The influence of green space on obesity in China: A systematic review. Obes. Facts 2022, 15, 463–472. [Google Scholar] [CrossRef] [PubMed]
- Browning, M.H.E.M.; Rigolon, A. Do income, race and ethnicity, and sprawl influence the greenspace-human health link in city-level analyses? Findings from 496 cities in the United States. Int. J. Environ. Res. Public Health 2018, 15, 1541. [Google Scholar] [CrossRef] [PubMed]
- Markevych, I.; Schoierer, J.; Hartig, T.; Chudnovsky, A.; Hystad, P.; Dzhambov, A.M.; de Vries, S.; Triguero-Mas, M.; Brauer, M.; Nieuwenhuijsen, M.J.; Lupp, G.; Richardson, E.A.; Astell-Burt, T.; Dimitrova, D.; Feng, X.; Sadeh, M.; Standl, M.; Heinrich, J.; Fuertes, E. Exploring pathways linking greenspace to health: Theoretical and methodological guidance. Environ. Res. 2017, 158, 301–317. [Google Scholar] [CrossRef] [PubMed]
- Nieuwenhuijsen, M.J.; Khreis, H.; Triguero-Mas, M.; Gascon, M.; Dadvand, P. Fifty shades of green: Pathway to healthy urban living. Epidemiology 2017, 28, 63–71. [Google Scholar] [CrossRef] [PubMed]
- Mäki-Opas, T.E.; Borodulin, K.; Valkeinen, H.; Stenholm, S.; Kunst, A.E.; Abel, T.; Härkänen, T.; Kopperoinen, L.; Itkonen, P.; Prättälä, R.; Karvonen, S.; Koskinen, S. The contribution of travel-related urban zones, cycling and pedestrian networks and green space to commuting physical activity among adults: A cross-sectional population-based study using geographical information systems. BMC Public Health 2016, 16, 760. [Google Scholar] [CrossRef] [PubMed]
- Zhang, Y.; Zhang, Y.; van Dijk, T.; Yang, Y. Green place rather than green space as a health determinant: A 20-year scoping review. Environ. Res. 2022, 214, 113812. [Google Scholar] [CrossRef] [PubMed]
- Barton, H.; Grant, M. A health map for the local human habitat. J. R. Soc. Promot. Health 2006, 126, 252–253. [Google Scholar] [CrossRef] [PubMed]
- Ferguson, M.; Roberts, H.E.; McEachan, R.R.C.; Dallimer, M. Contrasting distributions of urban green infrastructure across social and ethno-racial groups. Landsc. Urban Plan. 2018, 175, 136–148. [Google Scholar] [CrossRef]
- Wang, J.; Xu, C.; Pauleit, S.; Kindler, A.; Banzhaf, E. Spatial patterns of urban green infrastructure for equity: A novel exploration. J. Clean. Prod. 2019, 238, 117858. [Google Scholar] [CrossRef]
- Heckert, M.; Rosan, C.D. Developing a green infrastructure equity index to promote equity planning. Urban For. Urban Green. 2016, 19, 263–270. [Google Scholar] [CrossRef]
- Zhu, Z.; Ren, J.; Liu, X. Green infrastructure provision for environmental justice: Application of the equity index in Guangzhou, China. Urban For. Urban Green. 2019, 46, 126443. [Google Scholar] [CrossRef]
- Chenoweth, J.; Anderson, A.R.; Kumar, P.; Hunt, W.F.; Chimbwandira, S.J.; Moore, T.L.C. The interrelationship of green infrastructure and natural capital. Land Use Policy 2018, 75, 137–144. [Google Scholar] [CrossRef]
- Ode Sang, Å.; Knez, I.; Gunnarsson, B.; Hedblom, M. The effects of naturalness, gender, and age on how urban green space is perceived and used. Urban For. Urban Green. 2016, 18, 268–276. [Google Scholar] [CrossRef]
Figure 1.
Flowchart of the data processing steps followed in each case study: (a) case study 1 (minors); (b) case study 2 (adults).
Figure 1.
Flowchart of the data processing steps followed in each case study: (a) case study 1 (minors); (b) case study 2 (adults).
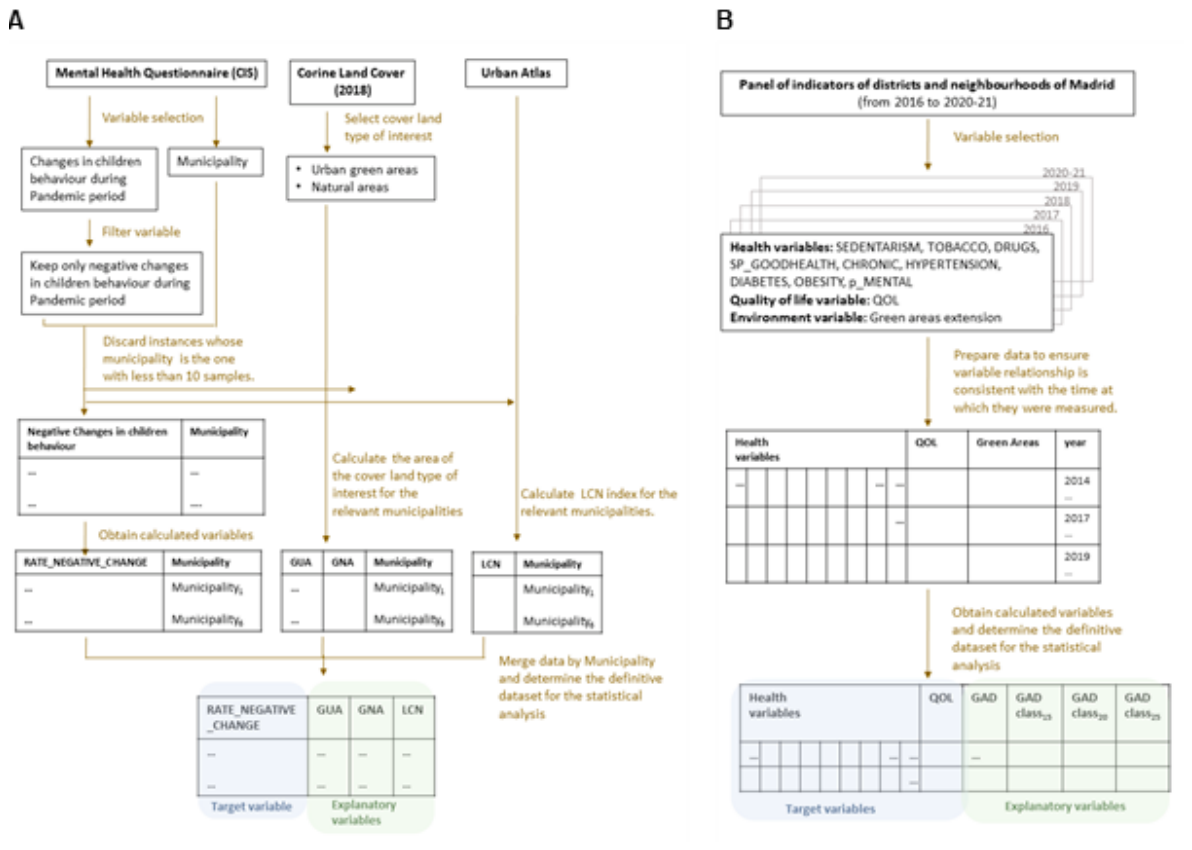
Figure 2.
Spatial distribution of Green Urban Areas (GUA, CLC class 1.4.1) and Green Natural Areas (GNA, CLC classes 3.1.1–3.3.5) in the six municipalities analysed.
Figure 2.
Spatial distribution of Green Urban Areas (GUA, CLC class 1.4.1) and Green Natural Areas (GNA, CLC classes 3.1.1–3.3.5) in the six municipalities analysed.
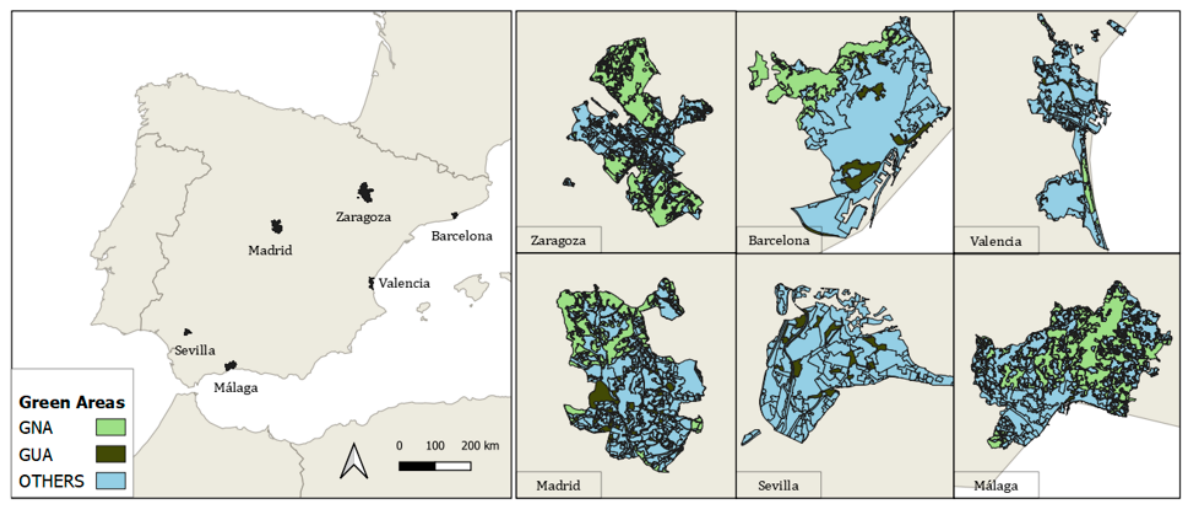
Figure 3.
Linear regression of RATE_NEGATIVE_CHANGES against GUA, GNA and the Land Cover Naturalness (LCN) index in the six municipalities analysed (coefficient of determination, R², and p-value shown for each model).
Figure 3.
Linear regression of RATE_NEGATIVE_CHANGES against GUA, GNA and the Land Cover Naturalness (LCN) index in the six municipalities analysed (coefficient of determination, R², and p-value shown for each model).
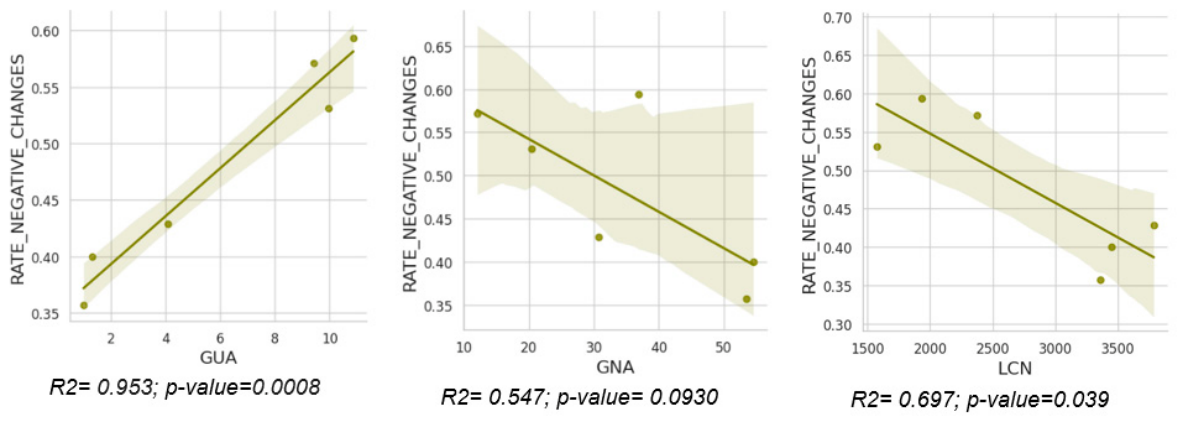
Figure 4.
Green Area Density per inhabitant (GAD) in the 21 districts of Madrid.
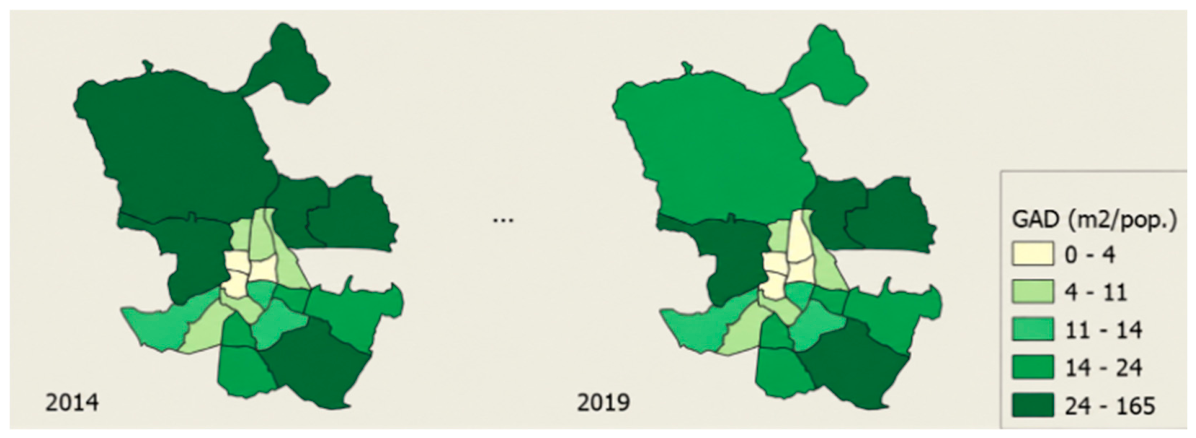
Figure 5.
Linear regression of the adult health variables against Green Area Density per inhabitant (GAD) in the districts of Madrid (coefficient of determination, R², and p-value shown for each model).
Figure 5.
Linear regression of the adult health variables against Green Area Density per inhabitant (GAD) in the districts of Madrid (coefficient of determination, R², and p-value shown for each model).
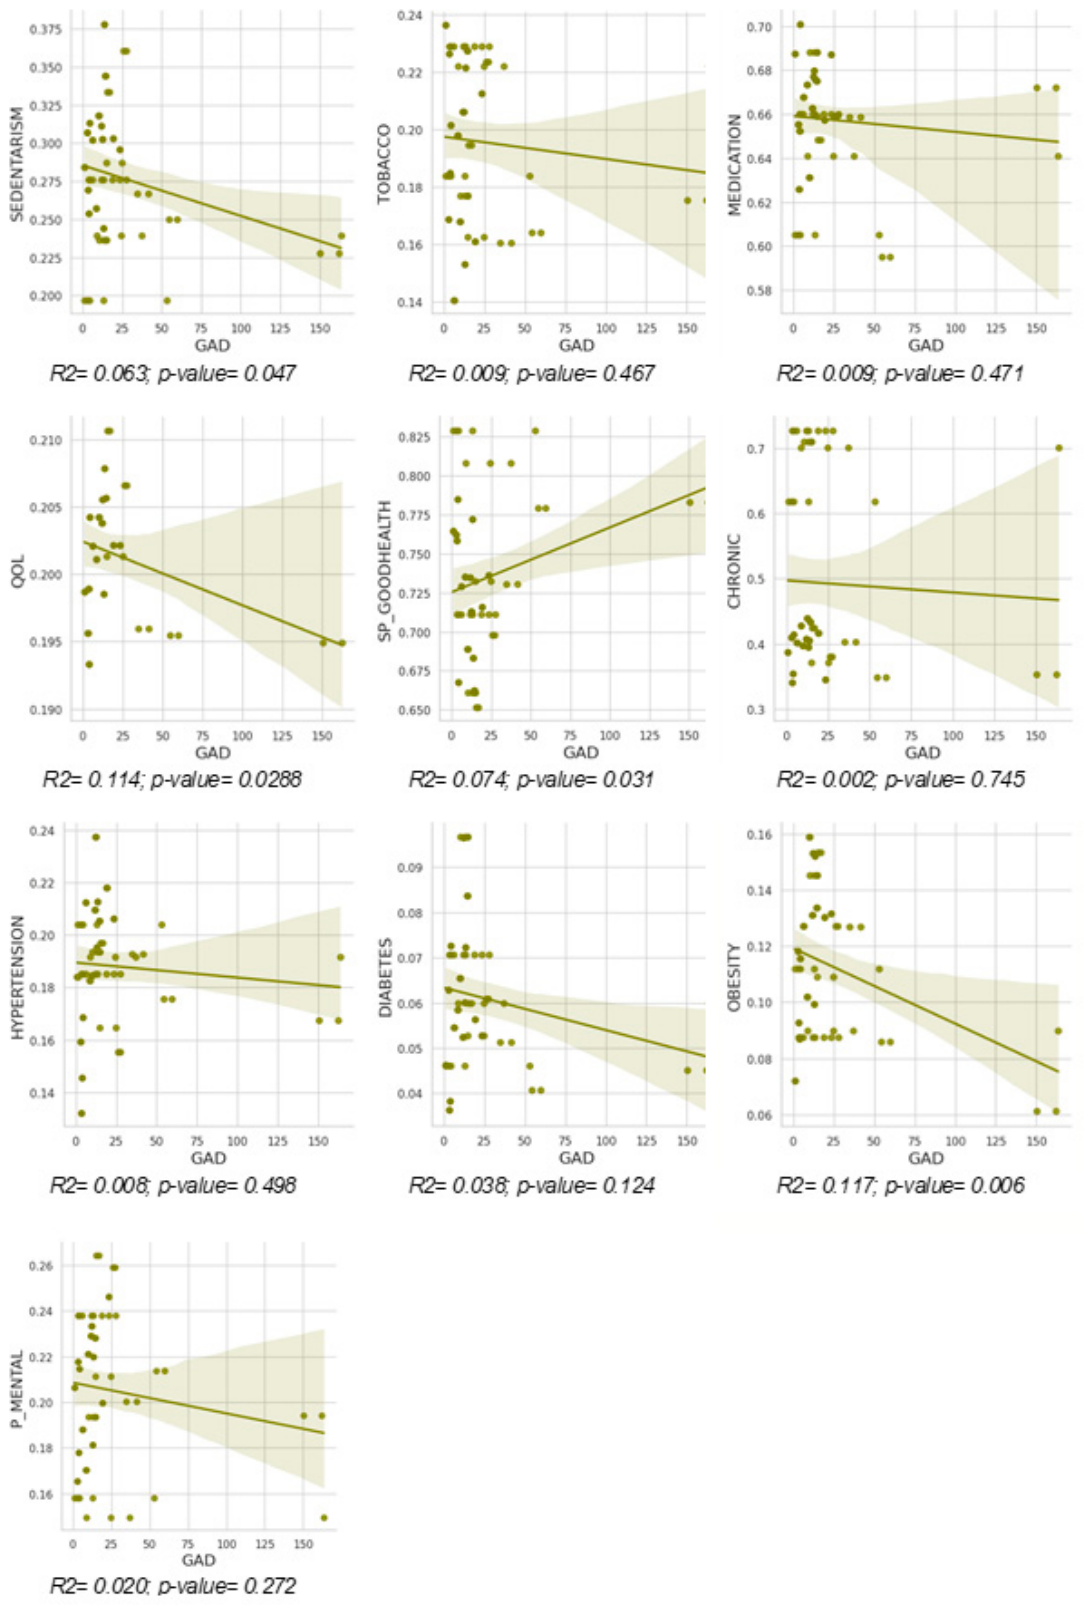
Figure 6.
Distribution of the health variables grouped by GAD class20 (0 = GAD < 20 m²/inhabitant; 1 = GAD ≥ 20 m²/inhabitant).
Figure 6.
Distribution of the health variables grouped by GAD class20 (0 = GAD < 20 m²/inhabitant; 1 = GAD ≥ 20 m²/inhabitant).
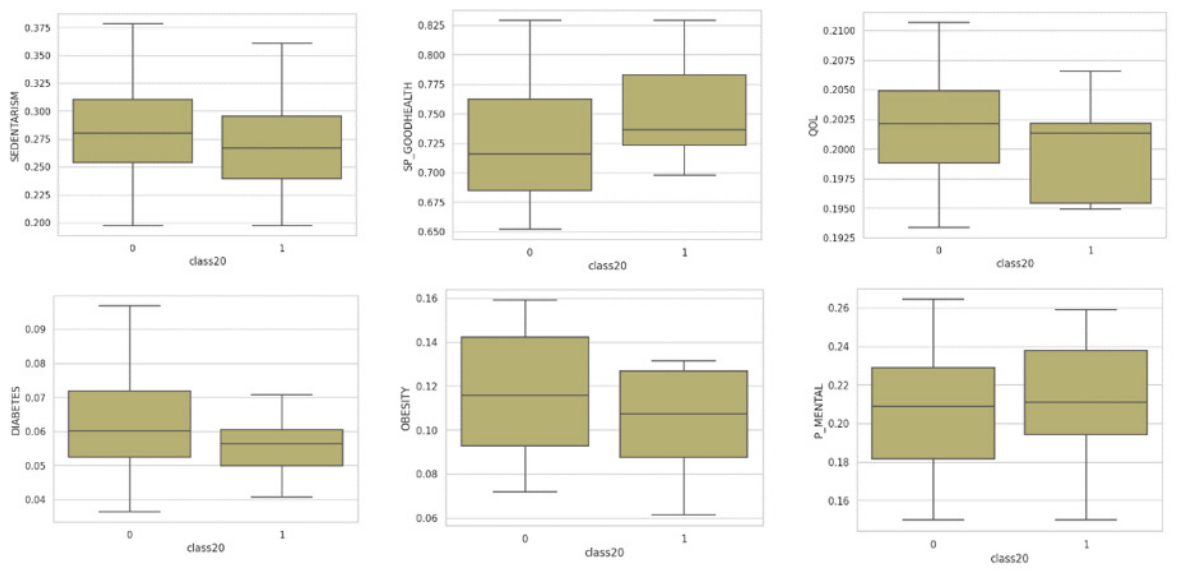

Table 1.
Summary of datasets and the calculated variables used to analyse each case study.
| Domain | Data | Minors Analysis | Adults Analysis |
|---|---|---|---|
| Territory | Administrative division |
|
|
| Mental Health evaluation questionnaire (*) | Data sources |
|
|
| Data collection period |
|
|
|
| Measured Variables |
|
|
|
| Calculated variables |
|
|
|
| Green Infrastructure (GI) evaluation | Data sources |
|
|
| Measured Variables |
|
|
|
| Calculated/ processed variables |
|
|
Table 2.
Degree of Land Cover Naturalness (LCN) for each land cover type in the Corine Land Cover (CLC) maps.
Table 2.
Degree of Land Cover Naturalness (LCN) for each land cover type in the Corine Land Cover (CLC) maps.
| Land cover type (Corine Land Cover) | Land cover type (Corine Land Cover) | ||
|---|---|---|---|
| 1.1.1: Continuous urban fabric | 0 | 2.1.0: Arable land (annual crops) | 50 |
| 1.1.2: Discontinuous urban fabric | 10 | 2.2.0: Permanent crops | 50 |
| 1.2.1: Industrial or commercial units | 0 | 2.3.0: Pastures | 50 |
| 1.2.2: Road and rail networks and associated land | 0 | 2.4.0: Heterogeneous agricultural areas | 60 |
| 1.2.3: Port areas | 0 | 3.1.0: Forests | 100 |
| 1.2.4: Airports | 0 | 3.2.0: Shrub and/or herbaceous vegetation associations | 30 |
| 1.3.1: Mineral extraction sites | 0 | 3.3.0: Open spaces with little or no vegetation | 40 |
| 1.3.2: Dump sites | 0 | 4.1.0: Inland wetlands | 100 |
| 1.3.3: Construction sites | 0 | 4.2.0: Coastal wetlands | 100 |
| 1.4.1: Green urban areas | 10 | 5.1.0: Inland waters | 100 |
| 1.4.2: Sports and leisure facilities | 10 | 5.2.0: Marine waters | 100 |
Table 3.
P-values of the Mann-Whitney U test for health variables grouped according to different Green Area Density (GAD) thresholds.
Table 3.
P-values of the Mann-Whitney U test for health variables grouped according to different Green Area Density (GAD) thresholds.
| GAD class15 | GAD class20 | GAD class25 | |
|---|---|---|---|
| SEDENTARISM | 0.393 | 0.074 (**) | 0.054 (**) |
| SP_GOODHEALTH | 0.227 | 0.021 (*) | 0.039 (*) |
| QOL | 0.400 | 0.066 (**) | 0.033 (*) |
| DIABETES | 0.043 (*) | 0.030 (*) | 0.040 (*) |
| OBESITY | 0.196 | 0.033 (*) | 0.026 (*) |
| p_MENTAL | 0.107 | 0.398 | 0.320 |
(*) Level of significance (α): 0.05; (**) level of significance (α): 0.10.
Disclaimer/Publisher’s Note: The statements, opinions and data contained in all publications are solely those of the individual author(s) and contributor(s) and not of MDPI and/or the editor(s). MDPI and/or the editor(s) disclaim responsibility for any injury to people or property resulting from any ideas, methods, instructions or products referred to in the content. |
© 2026 by the authors. Licensee MDPI, Basel, Switzerland. This article is an open access article distributed under the terms and conditions of the Creative Commons Attribution (CC BY) license.
Copyright: This open access article is published under a Creative Commons CC BY 4.0 license, which permit the free download, distribution, and reuse, provided that the author and preprint are cited in any reuse.