

Submitted:
20 October 2026
Posted:
21 October 2026
You are already at the latest version
Abstract
Zepbound (tirzepatide) is among the most effective obesity medicines for weight reduction, in both clinical trial and real-world settings. Product marketing largely centers on weight-loss magnitude, which may reinforce the expectation that larger reductions are always better. Using de-identified EHRs, we compared 1,039 Zepbound initiators (1.7%) whose first-year weight loss reached ≥30% (“excessive weight loss”) with 20,668 Zepbound initiators (34.7%) who lost 5%-15% (“moderate weight loss”). After 1:4 propensity score matching (837 versus 3,348 patients), large language model (LLM)-curation extracted 24 adverse events that physician notes explicitly attributed to weight loss. The rate of any weight loss-attributable adverse event was significantly higher with excessive weight loss, at 39.4 versus 14.4 per 100 patient-years, representing 294 (35.1%) versus 479 (14.3%) patients (rate ratio [RR]: 2.78, 95% confidence interval [CI] 2.40-3.21; P<0.001). Falls, weakness, syncope, alopecia, low blood pressure, gastro-intestinal symptoms, and muscle loss were significantly enriched in the excessive weight loss cohort after false-discovery-rate correction (all q<0.001). Hospitalization was documented in 215 patients (25.7%) with excessive weight loss versus 527 patients (15.7%) with moderate weight loss (RR: 1.63, 1.42-1.87), Intensive care admission in 44 patients (5.3%) versus 77 patients (2.3%) (RR: 2.29, 1.59-3.28) (both q<0.001), and newly recorded heart-failure diagnosis in 11 patients (1.3%) versus 16 patients (0.5%) (RR: 2.75, 1.28-5.91; q=0.028). Laboratory tests and vital measurements recorded within 30 days of the lowest achieved body weight corroborated these findings, including significant enrichments in systolic (<90 mmHg) or diastolic (<60 mmHg) hypotension (RR: 3.19, 95% CI 2.51-4.05), anemia (RR: 1.86, 1.45-2.40), hyponatremia (RR: 2.74, 1.63-4.60), hypokalemia (RR: 2.34, 1.58-3.46), hypocalcemia (RR: 3.25, 1.87-5.68), hypoalbuminemia (RR: 2.93, 1.83-4.70), and hypoproteinemia (RR: 3.89, 2.32-6.52) in excessive weight loss patients (all q<0.001). While residual confounding and documentation differences may contribute to some real-world associations, the significantly greater burden of adverse events, hospitalization rates, laboratory test anomalies, and vital-sign abnormalities among Zepbound patients with excessive weight loss warrants further investigation. These findings support moving towards individualized weight-loss goals, motivate the need for prospective studies into the risk-benefit profile of Zepbound, and call for closer scrutiny of pharmaceutical marketing to clarify that the greatest weight reduction may not translate into better health outcomes.
Keywords:
Zepbound
; weight loss
; excessive weight loss
Introduction
Obesity affects 40.3% of United States adults, and severe obesity 9.4% [1]. Incretin-based therapy has led to step changes in pharmacotherapy-based weight loss, and each new agent has been defined first by how much weight loss occurs. Semaglutide 2.4 mg produced a mean reduction of 14.9% over 68 weeks [2]. Tirzepatide, a dual GIP and GLP-1 receptor agonist, produced 20.9% at its highest dose over 72 weeks in SURMOUNT-1 [3], sustained the reduction with continued treatment [4], and exceeded semaglutide in a head-to-head trial, 20.2% versus 13.7% [5]. But in that trial more than a third of participants receiving 15 mg lost 25% or more of their body weight [3], a magnitude that until recently was achieved only with bariatric surgery. These changes are consistent with the reported effectiveness of these agents for weight loss, including in real-world evidence studies [6]. The United States Food and Drug Administration (FDA) approved tirzepatide for chronic weight management as Zepbound on November 8, 2023, and later for obstructive sleep apnea in adults with obesity [7].
Weight loss magnitude has also been the defining message driving patient awareness. While the clinical need highlights extensive demand, the commercial landscape for tirzepatide presents interesting nuances that have impacts on safety in routine care settings. Zepbound is sold directly to consumers through its own pharmacy platform [8], and sponsored search advertising for GLP-1 receptor agonists is extensive [9], with high-engagement social media content promoting these drugs rarely conveying risk [10] while online sellers readily prescribe them [11]. The resulting expectation in the general population is that more weight loss is better.
Extensive weight loss carries recognized pathophysiological costs. About a quarter of the weight lost with tirzepatide is lean mass [12], and whether this loss of muscle is clinically relevant remains open [13]. Intentional as well as unintentional weight loss accelerates bone loss and raises the risk of hip fractures in older women [14], and intensive lifestyle-induced weight loss increased frailty fractures [15,16]. Rapid weight loss promotes gallstone formation [17], and GLP-1 receptor agonists at weight-loss doses increase gallbladder and biliary disease [18]. A joint advisory of professional societies has called for nutritional monitoring to prevent deficiency during GLP-1 therapy [19], and pharmacovigilance reports have linked semaglutide and tirzepatide to alopecia [20,21]. Finally, in community-dwelling elder care settings, loss of more than 10% of body weight was associated with a two- to fourfold higher risk of death [22].
These harms are rarely examined as a function of how much weight a patient actually loses. Trials report adverse events by randomized dose rather than by achieved weight loss, and in routine care the harms that follow from weight loss are recorded not as structured diagnoses but in the clinical narrative, when a clinician writes that a patient has become dizzy, weak, or malnourished since losing weight. Large language models make it tractable to enrich this narrative: auditable LLM curation of clinical notes has been validated for GLP-1 receptor agonist initiation, persistence, and compounded use [23], and de-identified records spanning multiple health systems permit such curation at scale under expert-determination privacy controls [24].
We hypothesized that new users of tirzepatide, with Zepbound prescriptions, whose weight loss in the first year reached 30% or more would experience more adverse events than users who lost a clinically meaningful but moderate 5% to less than 15%. In a large federated EHR network, we matched patients with excessive and moderate weight loss on age, sex, baseline BMI, the number of Zepbound prescriptions, and the time to maximum weight loss, so that the comparison isolates the magnitude of weight loss from the intensity and duration of treatment. We then compared their characteristics before and during treatment, hospitalization, intensive care, and new diagnoses during the weight loss, and the rate of 24 adverse events that clinicians attributed to the weight loss over all available follow-up.
Methods
Study Design and Data Source
Study Population
The index date was the first tirzepatide prescription on or after the approval of Zepbound for chronic weight management (November 8, 2023). New tirzepatide users were patients whose first tirzepatide prescription was the Zepbound brand, either documented in the record or inferred from the product description; patients whose first tirzepatide prescription was Mounjaro, a compounded product, or a product whose brand could not be determined were excluded, as were patients with any prescription of another GLP-1 receptor agonist (semaglutide, liraglutide, dulaglutide, exenatide, or orforglipron) in the 365 days before the index date. Patients were required to be at least 18 years old in the index year, the age for which Zepbound is approved. Patients with a diagnosis code for a bariatric procedure or its complications (International Classification of Diseases, Tenth Revision [ICD-10] Z98.84, K95.0, K95.8, and Z46.51, and their Ninth Revision [ICD-9] equivalents) at any time before the index date or during the first year of treatment were excluded, so that weight loss could be attributed to the drug.
Weight Measurements and Weight-Loss Groups
Body weight was taken as the median of each day’s recorded values. The baseline weight was the weight nearest the index date within the 180 days before it. The maximum weight loss was the percentage reduction from baseline to the lowest daily weight recorded from day 1 to day 365 after the index date, ending the day before any switch to another GLP-1 receptor agonist, to Mounjaro, or to compounded tirzepatide, and the day of that lowest weight defined the weight-loss interval. Patients whose maximum weight loss was 30% or more formed the excessive weight-loss group, and patients whose maximum weight loss was 5% to less than 15% formed the moderate weight-loss group. Patients with intermediate weight loss (15% to less than 30%) or with less than 5% were not studied, so that the two groups were separated by a wide margin and the comparator group had clinically meaningful weight loss.
Matching
Patients with excessive weight loss were matched 1:4 to patients with moderate weight loss by propensity score. The score was estimated by logistic regression on age, sex, baseline body mass index (median-imputed, with an indicator for a missing value), the number of distinct days with a Zepbound prescription from the index date to the day of maximum weight loss, and the number of days to maximum weight loss. The last two covariates align the two groups on the intensity and the duration of treatment, so that the comparison isolates the depth of weight loss. Patients with excessive weight loss were taken in random order, and each was matched to the four nearest unmatched patients with moderate weight loss on the logit of the propensity score within a caliper of 0.2 standard deviations of the logit, without replacement [27]; a patient for whom four controls were not available within the caliper was not matched. Covariate balance was assessed by the standardized mean difference (SMD), with an absolute value above 0.1 indicating residual imbalance [28].
Baseline Characteristics and Diagnoses
Baseline BMI and hemoglobin A1c were the values nearest the index date within the 365 days before it. Diagnoses were defined from ICD-10 and ICD-9 codes: malignancy and metastatic solid tumor according to the Quan adaptation of the Charlson comorbidity definitions, with metastatic codes counted only as metastatic cancer; chronic obstructive pulmonary disease; chronic kidney disease, excluding end-stage renal disease; end-stage renal disease, including dialysis dependence; cirrhosis; heart failure; and type 2 diabetes. A diagnosis in the year before treatment required a code dated within the 365 days before the index date. A new diagnosis during the weight-loss interval required a code dated from day 1 to the day of maximum weight loss and no code for that diagnosis at any time on or before the index date.
Adverse Events Attributed to Weight Loss
Every clinical note written from day 1 after the index date onward was screened for mentions of weight loss, and excerpts surrounding those mentions were provided to an open-weight large language model (gpt-oss-20b, temperature 0.7) with a fixed prompt (see Supplementary Methods). The model listed every adverse event, symptom, or condition that the note attributed to the patient’s weight loss, explicitly or by clear implication from the context, together with a verbatim quotation of at most 30 words. The prompt excluded benefits of weight loss, direct side effects of the medication that the note did not link to the weight loss (for example nausea, vomiting, constipation, diarrhea, or injection-site reactions), weight loss that was itself caused by an illness, anything concerning a person other than the patient, and harms discussed only as a possible risk; mentions phrased as a risk, a possibility, or a concern were also removed by a fixed lexical rule after extraction. Each extracted adverse effect was assigned by the model to a clinical category and then, by fixed keyword rules, to one of 24 adverse events grouped into eight body systems (Supplementary Table S1). The endpoint was the first documentation of each adverse event after the index date, and the composite endpoint was the first documentation of any of the 24 adverse events. The auditable LLM-curation methodology has been described and validated previously [23], and the extraction in this study was validated by physician adjudication. To relate each adverse effect to the weight loss at the time it was documented, the percentage weight loss from baseline was taken from the daily weight nearest to the date of first documentation, within 30 days on either side, and its distribution was summarized by percentiles estimated from counts in 2.5% intervals of weight loss.
Physician Validation of the Language-Model Extraction
Physicians reviewed 618 records of the language-model extraction. Positive records were notes that provided a patient’s first documentation of one of the 11 adverse events significantly more frequent with excessive weight loss, sampled at random in equal numbers from the excessive and moderate groups (up to 20 per adverse event in each group; 418 records). Negative records were notes screened for adverse events attributed to weight loss in which the model identified none, sampled at random in equal numbers from both groups (200 records). For each record, the reviewer read the source clinical documentation together with the model’s adverse-effect classification, weight-loss attribution, and supporting quotation, judged the extraction correct, incorrect, or indeterminate, and recorded a correction for each discordant record. Accuracy was calculated among adjudicable records (those judged correct or incorrect), overall and by adverse-effect category, with Wilson 95% CIs. In an exploratory analysis of whether a record documented a qualifying adverse effect at all, clinician reference labels were reconstructed from the adjudications, and sensitivity, specificity, positive and negative predictive values, and the F1 score were calculated, with Wilson 95% CIs.
Hospitalization and Intensive Care
Clinical notes containing terms for hospital admission, intensive care, or death were screened by the same model with a separate prompt, which recorded whether the note documented that the patient had been hospitalized as an inpatient or under observation (an emergency-department visit without admission did not count) or had been in an intensive or critical care unit or mechanically ventilated, together with the timing, date, and reason ( see Supplementary Methods). Stays documented as ongoing at the time of the note or as recent were counted. A stay was dated by the stated admission date when that date fell within the year before the note, and by the note date otherwise. Hospitalization and intensive care unit (ICU) stays were counted when they were dated from day 1 to the day of maximum weight loss.
Follow-Up
Follow-up for the adverse events began on day 1 after the index date and ended at the patient’s last clinical note, or earlier on the day before the first prescription of another GLP-1 receptor agonist, Mounjaro, or compounded tirzepatide at any time, or the first bariatric diagnosis code after the index date. Patient-time at risk for each adverse event ran from day 1 to its first documentation or to the end of follow-up.
Laboratory Values and Vital Signs
Systolic and diastolic blood pressure (BP), heart rate, and laboratory values were taken from the structured record for the matched patients. The laboratory panel comprised creatinine, blood urea nitrogen (BUN), hemoglobin, hematocrit, sodium, potassium, magnesium, calcium, phosphate, albumin, prealbumin, total protein, ferritin, iron, thyroid-stimulating hormone (TSH), and 25-hydroxyvitamin D, chosen to measure the physiological changes implied by the adverse events most often attributed to weight loss: volume depletion and low blood pressure, anemia, electrolyte loss, and undernutrition. Values were restricted to physiologically plausible ranges and to the units in which each test is conventionally reported. Multiple values on the same day were reduced to their median, and the BUN-to-creatinine ratio was computed from same-day values. Each patient’s baseline was the median of daily values in the 180 days before the index date. Follow-up values were summarized in windows centered on months 3, 6, 9, and 12 after the index date (each ±45 days, from day 1 and ending at the end of follow-up defined above), as the median of each patient’s daily values in the window minus that patient’s baseline. A measure was displayed when every window contained at least 11 patients in each group.
Clinical Thresholds
Values beyond standard clinical cutoffs were counted within ±30 days of each patient’s maximum weight loss, from day 1 and within follow-up, so that every patient was assessed over a window of the same length anchored at the depth of weight loss. The cutoffs were systolic BP below 90 mmHg, diastolic BP below 60 mmHg, and either of the two; heart rate above 100 beats per minute; hemoglobin below 12 g/dL in women or 13 g/dL in men; hematocrit below 36% in women or 39% in men; sodium below 135 mmol/L; potassium below 3.5 mmol/L; magnesium below 1.7 mg/dL; calcium below 8.5 mg/dL; phosphate below 2.5 mg/dL; albumin below 3.5 g/dL; prealbumin below 15 mg/dL; total protein below 6.0 g/dL; ferritin below 30 ng/mL; iron below 60 µg/dL; TSH above 4.5 mIU/L; 25-hydroxyvitamin D below 20 ng/mL; and a BUN-to-creatinine ratio above 20. The cutoffs were fixed before the analysis. A patient was counted as crossing a threshold when at least one value in the window lay beyond the cutoff, among patients with at least one value of that measure in the window; patients without a recorded sex were not assessed for the sex-specific hemoglobin and hematocrit cutoffs.
Statistical Analysis
Continuous variables are reported as mean (standard deviation) and categorical variables as count (column percentage). The number of prescriptions to maximum weight loss, the days to maximum weight loss, and follow-up are reported as median (interquartile range [IQR]); for the last two, the median and IQR were estimated from grouped frequency distributions in 10-day and 1-month intervals, respectively. Adverse event rates are reported as patients with a first documentation per 100 patient-years at risk with exact Poisson 95% CIs. Rate ratios for the adverse events and risk ratios for the interval events, excessive versus moderate weight loss, were estimated by the Mantel-Haenszel method stratified by medical center, with 95% CIs from the Greenland-Robins variance [29], and two-sided P-values from the corresponding Wald test. Multiplicity was controlled by the Benjamini-Hochberg (BH) false-discovery-rate procedure [30] within each comparison, separately for the 24 adverse events and for the ten interval events; every test in a family entered the correction, including tests whose counts are masked. The composite endpoint was a single prespecified test and is reported with its raw P-value. In the adverse event figure, a filled marker denotes q<0.05 (P<0.05 for the composite). Any cell with an event or patient count below 11 is reported as <11 with derived percentages suppressed, and a rate, ratio, P-value, or q-value is reported only when both of its counts are 11 or more, per the privacy convention adopted in this study. For laboratory values and vital signs, mean changes from baseline are reported with 95% CIs, and at each window the difference in mean change between the excessive and moderate weight-loss groups was tested by a two-sided test allowing unequal variances [31], with BH correction across all window comparisons of the displayed measures (13 measures at four windows). Threshold crossings were compared as risk ratios by the same Mantel-Haenszel method.
Statistical Analysis Plan for Study Advancement
The analytic approach followed established pharmacoepidemiologic and biostatistical conventions, and the study is reported in accordance with the Strengthening the Reporting of Observational Studies in Epidemiology (STROBE) statement and its extension for routinely collected health data, the Reporting of Studies Conducted Using Observational Routinely-Collected Health Data (RECORD) statement [32,33]. Confounding by the matching variables was addressed by propensity score matching [34,35] with greedy nearest-neighbor selection within a caliper of 0.2 standard deviations of the logit of the propensity score [27], and covariate balance was assessed by the SMD [28]. Confidence intervals for adverse event rates were exact Poisson limits [36]. Rate and risk ratios were estimated by the Mantel-Haenszel method [37] with the Greenland-Robins variance, which remains valid with sparse strata [29]. Multiplicity was controlled by the BH procedure [30]. The weight-loss thresholds, the matching variables, the endpoints, the comparison families, and the masking rules were fixed before the outcome analyses were run. Laboratory and vital-sign measures were pooled across the centers that recorded them, and patient-level medians were computed locally before means, standard deviations, and threshold counts were pooled.
De-Identification and Privacy
All data were de-identified under an expert determination consistent with the Health Insurance Portability and Accountability Act (HIPAA) Privacy Rule (45 CFR 164.514(b)(1)) before analysis, using a multi-layered transformation of structured and unstructured fields in which direct identifiers are removed, indirect identifiers are hashed or shifted, and clinical text is scrubbed by an ensemble de-identification system with greater than 99% recall for personally identifiable information [24].
Results
Fewer Than 2% of New Zepbound Users Lost 30% or More of Their Body Weight in the First Year
Of 419,929 patients prescribed tirzepatide, 111,629 were new Zepbound users after excluding patients whose first tirzepatide prescription preceded the approval of Zepbound, was for Mounjaro or a compounded formulation, or could not be identified as Zepbound, and patients who had taken another GLP-1 receptor agonist in the prior year (Figure 1). 59,565 adults remained after exclusion based on age, previous evidence of bariatric surgery, and requiring baseline and first-year body weight measurements. Of these, 1,039 (1.7%) reached a maximum weight loss of 30% or more, and 20,668 (34.7%) reached a maximum weight loss of 5% to 15% (Figure 1). Matching yielded 837 patients with excessive weight loss and 3,348 with moderate weight loss; 202 patients with excessive weight loss had fewer than four eligible controls within the caliper (Figure 1).
Before matching, patients with excessive weight loss were younger (46.3 versus 49.1 years), more often female (80.3% versus 71.6%), had a higher baseline BMI (37.0 versus 35.4 kg/m2), and received more Zepbound prescriptions before reaching their maximum weight loss (median 7 versus 3) over a longer interval (median 304 versus 174 days) (Table 1). After matching, age (47.5 versus 47.5 years), sex (77.3% versus 76.3% female), baseline BMI (36.8 versus 36.8 kg/m2), and baseline weight (109.1 versus 110.9 kg) were similar, with a SMD of 0.06 or less for every matching variable. The prevalence of eight diagnoses that could be related to treatment or excessive weight loss in the year before treatment differed by an SMD of 0.13 or less, with the largest difference observed for chronic kidney disease (5.7% versus 3.2%) (Table 1). Baseline hemoglobin A1c was 5.6% in both groups. The matched groups differed by design in maximum weight loss, with average values of 36.8% versus 10.4% (Table 1).
Matched Patients with Excessive and Moderate Weight Loss Had Comparable Treatment and Follow-Up
In the matched groups, the distributions of treatment exposure were closely aligned: the median time to maximum weight loss was 286 versus 282 days, with most patients in both groups reaching their lowest weight late in the first year, and the median number of Zepbound prescriptions to maximum weight loss was 6 in both groups (Figure 2A, Figure 2B). Follow-up was also similar, with a median of 13.0 versus 12.5 months (Figure 2C). The matched groups contributed 944 and 3,595 patient-years at risk for the composite adverse event endpoint (Table 2).
Excessive Weight Loss Was Associated with a Nearly Threefold Higher Rate of Adverse Events Attributed to Weight Loss
To assess whether excessive weight loss was associated with potential safety signals, we evaluated the rates at which 24 phenotypes were documented and attributed to weight loss in each group. The composite outcome (i.e. any of the 24 weight-loss attributed adverse events) was documented at 39.4 per 100 patient-years among those with excessive weight loss versus 14.4 per 100 patient-years among those with moderate weight loss (RR 2.78, 95% CI 2.40-3.21; 294 versus 479 patients; P<0.001) (Figure 3, Table 2). The rate was higher with excessive weight loss for each of the 24 adverse events (Table 2). The 11 adverse events with reportable counts in both matched groups had rate ratios ranging from 2.44 to 7.82, and all 11 remained significant after BH correction (q at most 0.002) (Figure 3).
The excess risk of adverse events were broad and spanned every body system. Symptoms of volume depletion and low blood pressure were prominent: dizziness or lightheadedness (12.1 versus 3.7 per 100 patient-years; RR 3.33, 95% CI 2.57-4.31; q<0.001), low blood pressure (RR 2.75, 95% CI 1.97-3.83; q<0.001), and syncope (RR 4.04, 95% CI 2.20-7.43; 21 versus 20 patients; q<0.001). Loss of strength and low energy were more common in patients with excessive weight loss: generalized weakness (RR 4.10, 95% CI 2.30-7.28; q<0.001), fatigue or low energy (RR 2.50, 95% CI 1.85-3.38; q<0.001), and muscle or lean mass loss (RR 2.44, 95% CI 1.73-3.43; q<0.001). The largest relative excesses were for pain, headache, or cramps (RR 7.82, 95% CI 4.01-15.26; 26 versus 13 patients; q<0.001) and for falls, fractures, or bone loss (RR 5.22, 95% CI 2.40-11.38; 15 versus 11 patients; q<0.001). Hair loss or thinning (RR 2.94, 95% CI 2.15-4.01; q<0.001), excess or loose skin (RR 3.19, 95% CI 2.08-4.88; q<0.001), and gastrointestinal symptoms attributed to the weight loss (RR 2.79, 95% CI 1.49-5.21; q=0.002) were also more frequent in patients with excessive weight loss (Figure 3, Table 2).
Several adverse events were documented in 11 or more patients with excessive weight loss but too rarely with moderate weight loss for a ratio to be reported, among them protein-calorie malnutrition (23 patients; 2.5 per 100 patient-years), cold intolerance (19 patients), sagging skin, wrinkles, or facial change (16 patients), and excessive or too rapid weight loss itself (14 patients) (Table 2). In the unmatched comparison, which retains all patients in both groups, the composite rate ratio was 2.68 (95% CI 2.40-3.00; 378 versus 2,091 patients), and all 22 adverse events with reportable counts remained significant after BH correction. Protein-calorie malnutrition (RR 6.95, 95% CI 4.12-11.75; q<0.001), hypoglycemia (RR 6.31, 95% CI 3.02-13.20; q<0.001), and cold intolerance (RR 5.90, 95% CI 3.52-9.89; q<0.001) reached reportable counts (Table 2).
Adverse events in patients with excessive weight loss were first documented after most of the weight had been lost. Among the 259 of 294 patients with excessive weight loss who had a weight recorded within 30 days of the first documentation, the median weight loss at that time was 27.2% (IQR 16.5-32.4); in 66.4% of these patients the weight loss at first documentation was 20% or more, and in 40.9% it was 30% or more. Among the 416 of 479 patients with moderate weight loss and a weight recorded, the corresponding median was 9.2% (IQR 5.5-12.9). Across the individual adverse events, the median weight loss at first documentation with excessive weight loss ranged from 20.8% for fatigue or low energy to 32.8% for generalized weakness (Supplementary Figure S1).
Hospitalization, Intensive Care, and New Heart Failure Were More Frequent During Excessive Weight Loss
Between the first prescription and maximum weight loss during the first year of treatment, 215 of 837 patients with excessive weight loss (25.7%) and 527 of 3,348 with moderate weight loss (15.7%) had a documented hospitalization (risk ratio 1.63 (95% CI 1.42-1.87); q<0.001), and 5.3% versus 2.3% had an ICU stay (risk ratio 2.29 (95% CI 1.59-3.28); q<0.001) (Table 3). A new diagnosis of heart failure was recorded in 11 versus 16 patients (1.3% versus 0.5%; risk ratio 2.75 (95% CI 1.28-5.91); q=0.028), whereas new type 2 diabetes did not differ (1.3% versus 1.0%; risk ratio 1.29 (95% CI 0.66-2.54); q=0.584) (Table 3). New malignancy was recorded in fewer than 11 patients with excessive weight loss and in 27 (0.8%) with moderate weight loss, and new metastatic cancer in fewer than 11 patients in each group (Table 3).
Excessive Weight Loss Was Associated with Reductions in Blood Pressure, Hemoglobin, Potassium, and Total Protein
Among the 837 patients with excessive weight loss and 3,348 with moderate weight loss, systolic blood pressure fell by 6.8 mmHg at 3 months and 9.4 mmHg at 12 months in patients with excessive weight loss, against 4.7 and 5.2 mmHg in patients with moderate weight loss. The difference in blood pressure change was significant at every window, from −2.1 mmHg at 3 months (q=0.004) to −4.5 mmHg at 9 months (q<0.001) (Figure 4A). Diastolic blood pressure followed the same course, falling by 3.0 to 5.8 mmHg with excessive and 1.8 to 2.5 mmHg with moderate weight loss, a difference that widened from −1.3 mmHg at 3 months (q=0.006) to −3.3 mmHg at 12 months (q<0.001) (Figure 4B).
Hemoglobin and hematocrit declined in the second half of the year in patients with excessive weight loss while remaining stable in patients with moderate weight loss. At 12 months, hemoglobin had changed by −0.50 versus −0.01 g/dL (difference −0.49 g/dL; q=0.004) and hematocrit by −1.66 versus −0.09 percentage points (difference −1.58; q<0.001), and both differences were statistically significant at 9 and 12 months (Figure 4D, Figure 4E). Potassium fell by 0.19 mmol/L at 6 months with excessive weight loss against 0.03 mmol/L with moderate weight loss (difference −0.15 mmol/L; q<0.001), with significant differences at 3, 6, and 9 months (q≤0.026) (Figure 4G). Total protein declined starting approximately 6 months after the first prescription in patients with excessive weight loss, by 0.25 g/dL at 9 months against 0.02 g/dL in patients with moderate weight loss (q<0.001), with significant differences at 6, 9, and 12 months (Figure 4M).
Heart rate, sodium, calcium, BUN, the BUN-to-creatinine ratio, creatinine, and albumin did not differ between the groups at any window (Figure 4C, Figure 4F, Figure 4H to Figure 4L). Magnesium, phosphate, prealbumin, ferritin, iron, TSH, and 25-hydroxyvitamin D were measured in too few patients for a trajectory to be estimated.
Low Blood Pressure, Anemia, Electrolyte Abnormalities, and Low Serum Protein Were More Frequent Near Maximum Weight Loss in Individuals with Excessive Weight Loss
Within 30 days of maximum weight loss, BP was recorded in 578 patients with excessive and 2,296 with moderate weight loss, and laboratory values in 49 to 311 and 115 to 891, respectively (Figure 5). A systolic BP below 90 mmHg was recorded in 4.2% versus 1.0% of these patients (24 of 578 versus 23 of 2,295; RR 4.12, 95% CI 2.35-7.23; q<0.001), a diastolic BP below 60 mmHg in 17.3% versus 5.4% (RR 3.21, 95% CI 2.51-4.11; q<0.001), and either in 18.2% versus 5.7% (RR 3.19, 95% CI 2.51-4.05; q<0.001) (Figure 5). Anemia was more frequent by hemoglobin (25.7% versus 13.7%; RR 1.86, 95% CI 1.45-2.40; q<0.001) and by hematocrit (27.1% versus 10.9%; RR 2.44, 95% CI 1.86-3.21; q<0.001) (Figure 5).
Electrolyte abnormalities were also more frequent: sodium below 135 mmol/L in 13.5% versus 4.9% (RR 2.74, 95% CI 1.63-4.60; q<0.001), potassium below 3.5 mmol/L in 13.9% versus 6.1% (RR 2.34, 95% CI 1.58-3.46; q<0.001), and calcium below 8.5 mg/dL in 12.9% versus 3.8% (RR 3.25, 95% CI 1.87-5.68; q<0.001). ABUN-to-creatinine ratio above 20 was recorded in 30.2% versus 21.0% (RR 1.39, 95% CI 1.06-1.83; q=0.030). Albumin below 3.5 g/dL (12.1% versus 4.3%; RR 2.93, 95% CI 1.83-4.70; q<0.001) and total protein below 6.0 g/dL (12.0% versus 2.9%; RR 3.89, 95% CI 2.32-6.52; q<0.001) were more frequent with excessive weight loss (Figure 5). Heart rate above 100 beats per minute (13.1% versus 10.3%; RR 1.27, 95% CI 1.00-1.61; q=0.066) and iron below 60 µg/dL (40.8% versus 39.1%; RR 1.02, 95% CI 0.68-1.55; q=0.911) did not differ, and the remaining thresholds were crossed by fewer than 11 patients in at least one group (Figure 5).
Physician Adjudication Confirmed the Accuracy of the Language-Model Extraction
Physicians reviewed 618 records of the language-model extraction, of which 576 were adjudicable and 42 (6.8%) were indeterminate. Overall accuracy was 92.5% (533 of 576; 95% CI 90.1-94.4) (Table 4). Accuracy by adverse-effect category ranged from 87.0% (20 of 23) for falls, fractures, or bone loss to 100.0% (38 of 38) for hair loss, and was 91.9% (91 of 99) for dizziness, hypotension, or syncope, 91.9% (34 of 37) for fatigue or low energy, 89.6% (69 of 77) for muscle loss or weakness, and 97.4% (38 of 39) for excess or loose skin; among records in which the model identified no qualifying adverse effect, 93.8% (183 of 195) were confirmed by physician review (Table 4).
In the exploratory evaluation of whether a record documented a qualifying adverse effect, across 572 records, sensitivity was 97.1% (368 of 379; 95% CI 94.9-98.4), specificity 95.3% (184 of 193; 95% CI 91.4-97.5), positive predictive value 97.6% (368 of 377; 95% CI 95.5-98.7), and negative predictive value 94.4% (184 of 195; 95% CI 90.2-96.8), with an F1 score of 0.974.
Discussion
Among new users of tirzepatide in routine care, patients whose weight loss in the first year reached 30% or more had a rate of clinician-documented adverse events attributed to weight loss nearly three times that of matched patients who lost 5% to less than 15% (RR 2.78), with higher rates for every one of the 24 adverse events studied. Because the two groups were matched on the number of tirzepatide (specifically Zepbound) prescriptions and on the time to maximum weight loss, and had similar follow-up, the excess cannot be explained by more intensive or longer treatment, more clinical contact, or a longer window for documentation. Patients with excessive weight loss were also more often hospitalized and admitted to intensive care during the period in which they were losing weight.
The adverse event risk related to the pathophysiology of large and rapid weight loss. Dizziness, low blood pressure, and fainting are consistent with low blood pressure and reduced intake in patients whose antihypertensive regimens were previously prescribed at a higher body weight. The excess rate of fatigue, generalized weakness, and documented muscle or lean mass loss is consistent with the substantial lean-tissue component of incretin-induced weight loss [12,13]. Falls, fractures, or bone loss were five fold higher rate with Zepbound and is consistent with weight loss from other causes [14,15]. Hair loss, loose skin, and protein-calorie malnutrition complete a picture of nutritional and structural strain, the risks that the recent joint nutritional advisory sought to prevent [19,20]. That these effects were recorded by treating clinicians, and attributed by them to the weight loss itself rather than to the drug’s gastrointestinal side effects, indicates that they were clinically apparent and consequential enough to be documented.
Structured laboratory and vital-sign measurements, an ascertainment route independent of the clinical notes, corroborated the adverse events that clinicians attributed to weight loss. Within 30 days of the lowest recorded weight, systolic (<90 mmHg) or diastolic (<60 mmHg) hypotension was documented three times as often with excessive as with moderate weight loss, matching the higher rates of documented low blood pressure, dizziness, and fainting from clinical notes. Anemia (below sex-specific thresholds), hyponatremia, hypokalemia, and hypocalcemia, and low albumin and total protein were each two to four times as frequent, consistent with the documented fatigue, weakness, cramps, and malnutrition. The trajectories place these changes in time: systolic and diastolic blood pressure separated by 3 months and the difference widened through the first year, whereas hemoglobin, hematocrit, and total protein diverged in the second half of the year, as weight loss deepened. That measured values and clinician-documented adverse events point in the same direction, and with ratios of similar magnitude, indicates that the excess is physiological and not solely a product of how often, or how closely, clinicians documented symptoms in patients who lost more weight.
Not every measure differed over time between weight loss groups. Heart rate, creatinine, blood urea nitrogen, and some biomarkers of iron did not differ between the groups, and magnesium, phosphate, ferritin, thyroid-stimulating hormone, and 25-hydroxyvitamin D were measured in too few patients for comparison. Laboratory tests were also drawn in a minority of patients within the window around maximum weight loss, and more often with excessive weight loss, so the laboratory threshold comparisons describe patients who were tested; blood pressure, recorded in most patients in both groups, showed the largest differences. Taken together, these measurements extend the note-based findings from what clinicians wrote to what they measured, and they identify blood pressure, blood counts, electrolytes, and serum protein as practical targets for monitoring as weight loss deepens.
These results complement efficacy evidence from clinical trials. The pivotal trials established that tirzepatide produces large average weight loss with an acceptable safety profile [3,5], but they report adverse events by randomized dose, which averages over participants who lose little and participants who lose a great deal at the same dose. In SURMOUNT-1 more than a third of participants receiving 15 mg lost 25% or more of their body weight [3], and in routine care the drug produces greater weight loss than its predecessor [38]. The tail of the weight-loss distribution is therefore not rare in absolute terms, and it is exactly the tail that a dose-level safety summary fails to describe. Our analysis conditions on the achieved weight loss and shows that this tail carries a distinct burden of harm.
The findings bear directly on how these drugs are presented to the public. Weight loss has been the organizing message of incretin development and marketing, from trial readouts reported as the largest reductions yet achieved to direct-to-consumer pharmacy channels, keyword advertising, and social media content that seldom conveys risk [8,9,10], while online prescribing allows patients to obtain and continue these drugs with little clinical oversight [11]. In that environment, patients and prescribers can reasonably infer that the goal of treatment is the largest attainable weight loss possible. Our data argue against that inference. A patient who has lost 30% of body weight and develops dizziness, weakness, or falls is associated with a greater rate of adverse events, some of which are potentially life-threatening.
Physician review also identified the limitations of language-model attribution of adverse events, particularly when symptoms co-occurred with weight loss without a clearly documented causal relationship. Some false-positive extractions reflected an alternative explanation, such as postoperative deconditioning, and others arose from overinterpretation of nonspecific symptoms or of associations reported by the patient. Conversely, attribution was sometimes supported by clinical management, such as a reduction in the dose of an antihypertensive medication or of tirzepatide, or by the assessment of a consulting clinician. These findings underline the distinction between detecting a symptom and documenting a clinician-supported causal attribution, and residual misclassification may affect the estimated rates of adverse events attributed to weight loss.
This study has several strengths. It draws on a large population of new Zepbound users in routine care across a federated EHR network; it matches on the intensity and duration of treatment, which separates the depth of weight loss from exposure to the drug; it uses an endpoint defined by the treating clinicians’ own attribution of harm to weight loss, which excludes the drug’s direct gastrointestinal effects by construction; it validates the language-model extraction by physician adjudication (92.5% accuracy). This study also corroborates the note-based findings with structured laboratory and vital-sign measurements, an ascertainment route independent of the clinical notes; it reports all 24 adverse events with correction for multiple comparisons.
Several limitations warrant emphasis. First, the design is observational, and excessive weight loss is not randomized; patients who lose 30% or more of their weight may differ in their adherence, diet, physical activity, or unmeasured comorbidity from patients who lose less. Second, some weight loss may itself reflect illness. The extraction excluded weight loss that the note attributed to an illness, new malignancy was not significantly more frequent with excessive weight loss, and the groups were matched on treatment duration, but hospitalization and ICU stays during the weight-loss interval cannot be assigned a direction: an admission can cause weight loss as well as follow it. Third, the endpoint depends on documentation. Adverse events are recorded only when a clinician notices them and attributes them to weight loss, so absolute rates are floors, and clinicians may look harder for harm in patients who have lost more weight; matching on prescriptions and on the timing of maximum weight loss equalizes treatment exposure but not the content of each encounter. The structured measurements partly address this concern, since blood pressure, recorded in most patients in both groups, were similar, but laboratory tests were drawn in a minority of patients and more often with excessive weight loss, so the laboratory threshold comparisons describe patients who were tested. Fourth, the extraction is a single language-model pass applied identically to both groups; physician adjudication found 92.5% accuracy, and misclassification should be non-differential but is not zero. Fifth, maximum weight loss rests on the lowest recorded weight, and isolated measurement errors can place a patient in the wrong group. Sixth, Zepbound doses were not considered, and events below the privacy threshold limited the adverse events, diagnoses, and laboratory measures for which a ratio could be reported.
Taken together, these results indicate that weight loss of 30% or more with Zepbound, a magnitude now reached by a meaningful number of patients, is accompanied by a broad and clinically recognized excess of harm, from dizziness and fainting to weakness, falls, malnutrition, and hospitalization. The findings support treatment goals defined by health rather than by the largest possible weight reduction, monitoring that intensifies as weight loss deepens, and public communication that presents the depth of weight loss as something to be managed, not maximized. Prospective studies that relate achieved weight loss to harm, and trials of dose de-escalation once a health-based target is reached, are needed to define how much weight loss is enough.
Supplementary Materials
The following supporting information can be downloaded at the website of this paper posted on Preprints.org.
Author Contributions
Venky Soundararajan conceived and supervised the study. Karthik Murugadoss designed the study, performed the analyses, and prepared the visualizations. Christopher Gregg and A.J. Venkatakrishnan contributed to interpretation and manuscript preparation. Gowtham Varma and Santhosh Shiv helped with the LLM-adjudication. Marcelo Montorzi, Joseph M. Smith, Clifford J. Rosen and C. Michael Gibson contributed clinical insights and feedback on study design and interpretation. All authors prepared, reviewed, and approved the final manuscript.
Funding
No external funding was received for this study.
Data Availability Statement
This study analyzed de-identified electronic health record data. The data were extracted under an established privacy-preserving protocol and cannot be shared beyond what is reported here due to the parameters of the expert determination.
Acknowledgments
The authors thank Patrick Lenehan for thorough review of the manuscript.
Conflicts of Interest
KM, CJG, GV, SS, AJV and VS are employees of nference, inc., which conducts research collaborations with various biopharmaceutical companies whose therapeutic products are included in this study. None of these companies, nor any other nference collaborator, funded, supported, or had any role in the independent study design, data acquisition, analysis, interpretation, manuscript preparation, or the decision to submit this work for publication. All analyses were conducted by the authors using de-identified electronic health record data. The authors declare no additional competing interests.
Code Availability
The analysis code is not publicly available. Please contact the corresponding author for details.
References
- Emmerich, S. D., Fryar, C. D., Stierman, B. & Ogden, C. L. Obesity and severe obesity prevalence in adults: United States, August 2021-August 2023. NCHS Data Brief (2024). [CrossRef]
- Wilding, J. P. H. et al. Once-weekly semaglutide in adults with overweight or obesity. N. Engl. J. Med. 384, 989–1002 (2021). [CrossRef]
- Jastreboff, A. M. et al. Tirzepatide once weekly for the treatment of obesity. N. Engl. J. Med. 387, 205–216 (2022). [CrossRef]
- Aronne, L. J. et al. Continued treatment with tirzepatide for maintenance of weight reduction in adults with obesity: The SURMOUNT-4 randomized clinical trial. JAMA 331, 38–48 (2024).
- Aronne, L. J. et al. Tirzepatide as compared with semaglutide for the treatment of obesity. N. Engl. J. Med. 393, 26–36 (2025). [CrossRef]
- Venkatakrishnan, A. J., Murugadoss, K. & Soundararajan, V. Weight-loss dynamics with tirzepatide versus semaglutide. PNAS Nexus 5, pgag171 (2026). [CrossRef]
- Malhotra, A. et al. Tirzepatide for the treatment of obstructive sleep apnea and obesity. N. Engl. J. Med. 391, 1193–1205 (2024). [CrossRef]
- Rome, B. N. Direct-to-consumer drug company pharmacies. JAMA 331, 1003–1004 (2024). [CrossRef]
- Eisenkraft Klein, D., Zenone, M. & Kesselheim, A. S. Glucagon-like peptide-1 receptor agonists and pay-per-click direct-to-consumer advertising. JAMA Netw. Open 8, e2538718 (2025). [CrossRef]
- Kresovich, A. et al. High-engagement social media posts related to prescription drug promotion for 3 major drug classes. JAMA 335, 181–183 (2026). [CrossRef]
- Chetty, A. K., Chen, A. S., Ross, J. S. & Ramachandran, R. Online prescribing of GLP-1 receptor agonists. JAMA 336, 428–431 (2026). [CrossRef]
- Look, M. et al. Body composition changes during weight reduction with tirzepatide in the SURMOUNT-1 study of adults with obesity or overweight. Diabetes Obes. Metab. 27, 2720–2729 (2025). [CrossRef]
- Conte, C., Hall, K. D. & Klein, S. Is weight loss-induced muscle mass loss clinically relevant? JAMA 332, 9–10 (2024). [CrossRef]
- Ensrud, K. E. et al. Intentional and unintentional weight loss increase bone loss and hip fracture risk in older women. J. Am. Geriatr. Soc. 51, 1740–1747 (2003). [CrossRef]
- Johnson, K. C. et al. The effect of intentional weight loss on fracture risk in persons with diabetes: Results from the Look AHEAD randomized clinical trial. J. Bone Miner. Res. 32, 2278–2287 (2017). [CrossRef]
- Marwaha, A. et al. Incident frailty and mortality risk with significant tirzepatide-associated weight loss in Medicare-age patients. Preprints (2026). [CrossRef]
- Weinsier, R. L., Wilson, L. J. & Lee, J. Medically safe rate of weight loss for the treatment of obesity: a guideline based on risk of gallstone formation. Am. J. Med. 98, 115–117 (1995). [CrossRef]
- He, L. et al. Association of glucagon-like peptide-1 receptor agonist use with risk of gallbladder and biliary diseases: A systematic review and meta-analysis of randomized clinical trials. JAMA Intern. Med. 182, 513–519 (2022).
- Mozaffarian, D. et al. Nutritional priorities to support GLP-1 therapy for obesity: a joint Advisory from the American College of Lifestyle Medicine, the American Society for Nutrition, the Obesity Medicine Association, and The Obesity Society. Am. J. Clin. Nutr. 122, 344–367 (2025).
- Godfrey, H., Leibovit-Reiben, Z., Jedlowski, P. & Thiede, R. Alopecia associated with the use of semaglutide and tirzepatide: A disproportionality analysis using the FDA adverse event reporting system (FAERS) from 2022 to 2023. J. Eur. Acad. Dermatol. Venereol. 39, e153–e154 (2025). [CrossRef]
- Marwaha, A., Venkatakrishnan, A. J., Murugadoss, K. & Soundararajan, V. New-onset alopecia is significantly higher with tirzepatide than with semaglutide, even after weight-loss matching. Preprints (2026). [CrossRef]
- Hussain, S. M. et al. Associations of change in body size with all-cause and cause-specific mortality among healthy older adults. JAMA Netw. Open 6, e237482 (2023). [CrossRef]
- Varma, G. et al. Auditable large language model curation of clinical notes refines glucagon-like peptide-1 initiation, persistence ascertainment, and compounding use beyond prescription records. Biol. Methods Protoc. 11, bpag035 (2026). [CrossRef]
- Murugadoss, K. et al. Building a best-in-class automated de-identification tool for electronic health records through ensemble learning. Patterns (N. Y.) 2, 100255 (2021). [CrossRef]
- Venkatakrishnan, A. J., Murugadoss, K. & Soundararajan, V. Decoding the hallmarks of GLP-1RA weight-loss super-responders. Biol. Methods Protoc. 11, (2026). [CrossRef]
- Lenehan, P. et al. Clinical nSights: A software platform to accelerate real world oncology analyses. J. Clin. Oncol. 42, e23316–e23316 (2024). [CrossRef]
- Austin, P. C. Optimal caliper widths for propensity-score matching when estimating differences in means and differences in proportions in observational studies. Pharm. Stat. 10, 150–161 (2011). [CrossRef]
- Austin, P. C. Balance diagnostics for comparing the distribution of baseline covariates between treatment groups in propensity-score matched samples. Stat. Med. 28, 3083–3107 (2009). [CrossRef]
- Greenland, S. & Robins, J. M. Estimation of a common effect parameter from sparse follow-up data. Biometrics 41, 55–68 (1985). [CrossRef]
- Benjamini, Y. & Hochberg, Y. Controlling the false discovery rate: A practical and powerful approach to multiple testing. J. R. Stat. Soc. Series B Stat. Methodol. 57, 289–300 (1995). [CrossRef]
- Welch, B. L. The generalisation of student’s problems when several different population variances are involved. Biometrika 34, 28–35 (1947).
- von Elm, E. et al. The Strengthening the Reporting of Observational Studies in Epidemiology (STROBE) statement: guidelines for reporting observational studies. Lancet 370, 1453–1457 (2007).
- Benchimol, E. I. et al. The REporting of studies Conducted using Observational Routinely-collected health Data (RECORD) statement. PLoS Med. 12, e1001885 (2015).
- Rosenbaum, P. R. & Rubin, D. B. The central role of the propensity score in observational studies for causal effects. Biometrika 70, 41–55 (1983).
- Austin, P. C. An introduction to propensity score methods for reducing the effects of confounding in observational studies. Multivariate Behav. Res. 46, 399–424 (2011). [CrossRef]
- Garwood, F. (i) Fiducial Limits for the Poisson Distribution. Biometrika 28, 437–442 (1936). [CrossRef]
- Mantel, N. & Haenszel, W. Statistical aspects of the analysis of data from retrospective studies of disease. J. Natl. Cancer Inst. 22, 719–748 (1959). [CrossRef]
- Rodriguez, P. J. et al. Semaglutide vs tirzepatide for weight loss in adults with overweight or obesity. JAMA Intern. Med. 184, 1056–1064 (2024). [CrossRef]
Figure 1.
Derivation of the study cohorts. Flow from 419,929 patients prescribed Zepbound to 111,629 new Zepbound users, 59,565 adults with baseline and first-year weights, and the excessive (30% or more) and moderate (5% to less than 15%) weight-loss groups, with the number excluded at each step. Both groups pass through a single 1:4 propensity score matching step on age, sex, baseline BMI, Zepbound prescriptions to maximum weight loss, and days to maximum weight loss, which yields 837 and 3,348 matched patients; the numbers beside the arrows are patients with excessive weight loss without four controls within the caliper and patients with moderate weight loss not selected as controls. Dark red denotes excessive and light red moderate weight loss throughout. Categories with fewer than 11 patients are shown as <11, and this masking convention applies to every figure and table in this study.
Figure 1.
Derivation of the study cohorts. Flow from 419,929 patients prescribed Zepbound to 111,629 new Zepbound users, 59,565 adults with baseline and first-year weights, and the excessive (30% or more) and moderate (5% to less than 15%) weight-loss groups, with the number excluded at each step. Both groups pass through a single 1:4 propensity score matching step on age, sex, baseline BMI, Zepbound prescriptions to maximum weight loss, and days to maximum weight loss, which yields 837 and 3,348 matched patients; the numbers beside the arrows are patients with excessive weight loss without four controls within the caliper and patients with moderate weight loss not selected as controls. Dark red denotes excessive and light red moderate weight loss throughout. Categories with fewer than 11 patients are shown as <11, and this masking convention applies to every figure and table in this study.
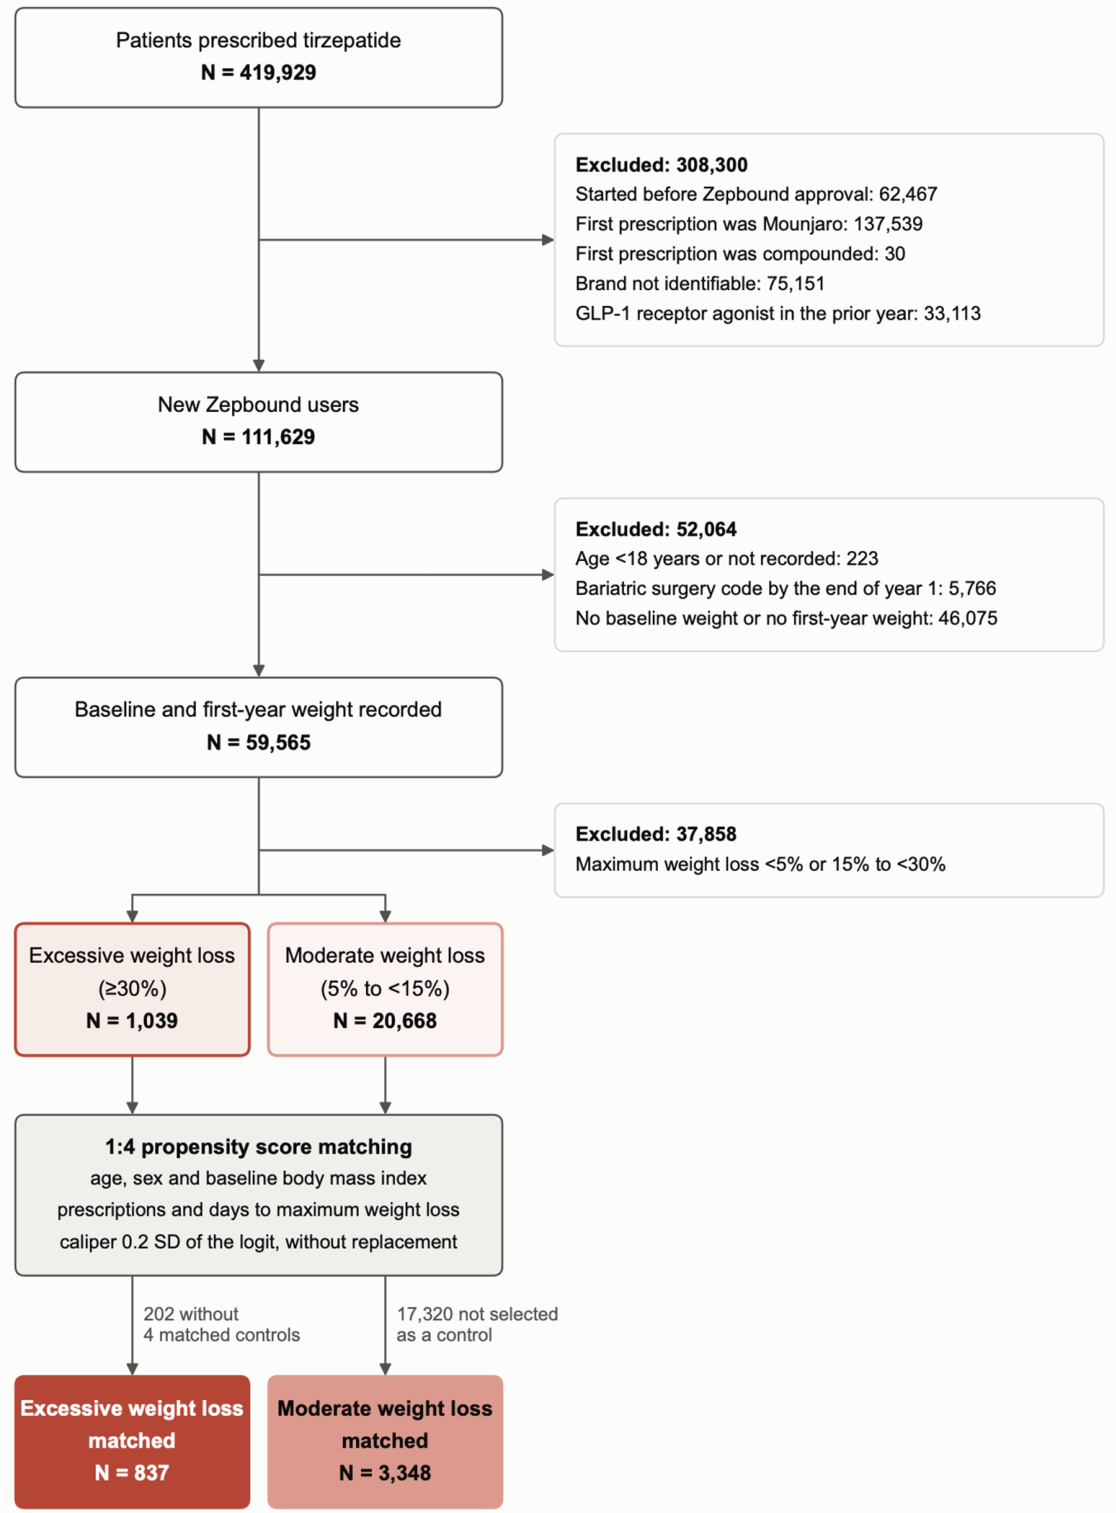
Figure 2.
Treatment course and follow-up in the matched cohorts. Distributions in 837 patients with excessive and 3,348 with moderate weight loss, as the percentage of each group. (A) Days from the first prescription to maximum weight loss, in 30-day intervals. (B) Number of tirzepatide prescriptions from the first prescription to maximum weight loss, counted as distinct days with a prescription record; refills authorized on an existing prescription are not counted separately. (C) Follow-up from the first prescription to the last clinical note before censoring, in 3-month intervals. The median in each group is given in the upper right of each panel.
Figure 2.
Treatment course and follow-up in the matched cohorts. Distributions in 837 patients with excessive and 3,348 with moderate weight loss, as the percentage of each group. (A) Days from the first prescription to maximum weight loss, in 30-day intervals. (B) Number of tirzepatide prescriptions from the first prescription to maximum weight loss, counted as distinct days with a prescription record; refills authorized on an existing prescription are not counted separately. (C) Follow-up from the first prescription to the last clinical note before censoring, in 3-month intervals. The median in each group is given in the upper right of each panel.
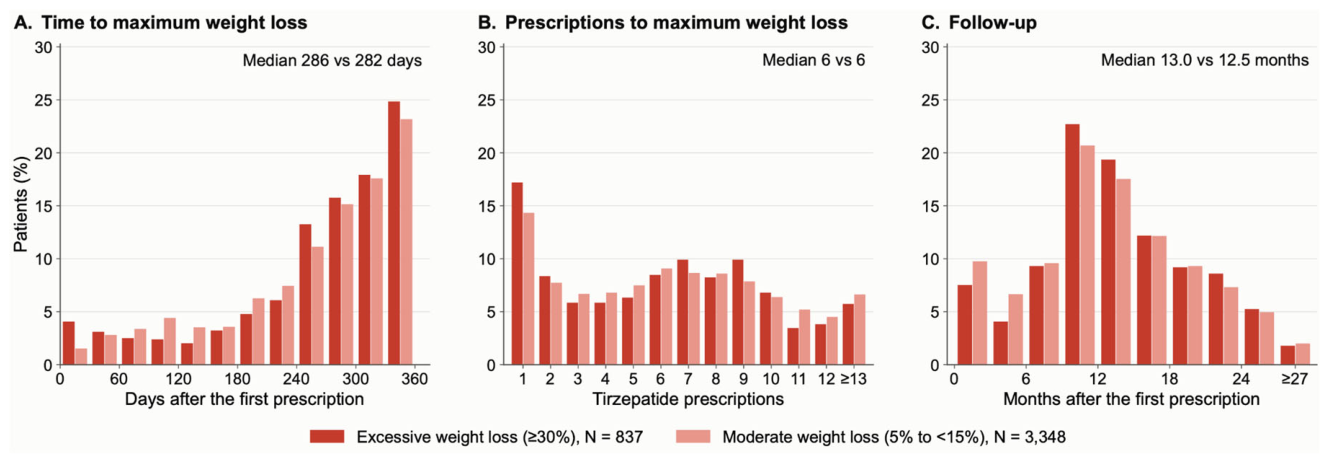
Figure 3.
Adverse events attributed to weight loss in the matched cohorts. (A) Patients with a first documentation of each adverse event per 100 patient-years, with exact Poisson 95% CIs, for excessive (dark red) and moderate (light red) weight loss. (B) Rate ratio for excessive versus moderate weight loss with its 95% CI on a log scale, followed by the number of patients with the adverse event in each group, the rate ratio, the two-sided P-value, and the BH-adjusted q-value (italic). A filled marker denotes q<0.05; the composite of any of the 24 adverse events is a single prespecified endpoint reported with its P-value only. Rows are the 11 adverse events with at least 11 patients in both groups, grouped by body system. The remaining 13 adverse events, which are included in the composite but had fewer than 11 patients in at least one group, are palpitations or shortness of breath; cold intolerance; skin-fold rash or infection; pannus or skin-fold complications; sagging skin, wrinkles, or facial change; hypoglycemia; protein-calorie malnutrition; poor intake or appetite; nutritional deficiency, unspecified; excessive or too rapid weight loss; gallstones or cholecystitis; body image, mood, or anxiety; and menstrual, hormonal, or sexual changes. All 24 are reported in Table 2.
Figure 3.
Adverse events attributed to weight loss in the matched cohorts. (A) Patients with a first documentation of each adverse event per 100 patient-years, with exact Poisson 95% CIs, for excessive (dark red) and moderate (light red) weight loss. (B) Rate ratio for excessive versus moderate weight loss with its 95% CI on a log scale, followed by the number of patients with the adverse event in each group, the rate ratio, the two-sided P-value, and the BH-adjusted q-value (italic). A filled marker denotes q<0.05; the composite of any of the 24 adverse events is a single prespecified endpoint reported with its P-value only. Rows are the 11 adverse events with at least 11 patients in both groups, grouped by body system. The remaining 13 adverse events, which are included in the composite but had fewer than 11 patients in at least one group, are palpitations or shortness of breath; cold intolerance; skin-fold rash or infection; pannus or skin-fold complications; sagging skin, wrinkles, or facial change; hypoglycemia; protein-calorie malnutrition; poor intake or appetite; nutritional deficiency, unspecified; excessive or too rapid weight loss; gallstones or cholecystitis; body image, mood, or anxiety; and menstrual, hormonal, or sexual changes. All 24 are reported in Table 2.
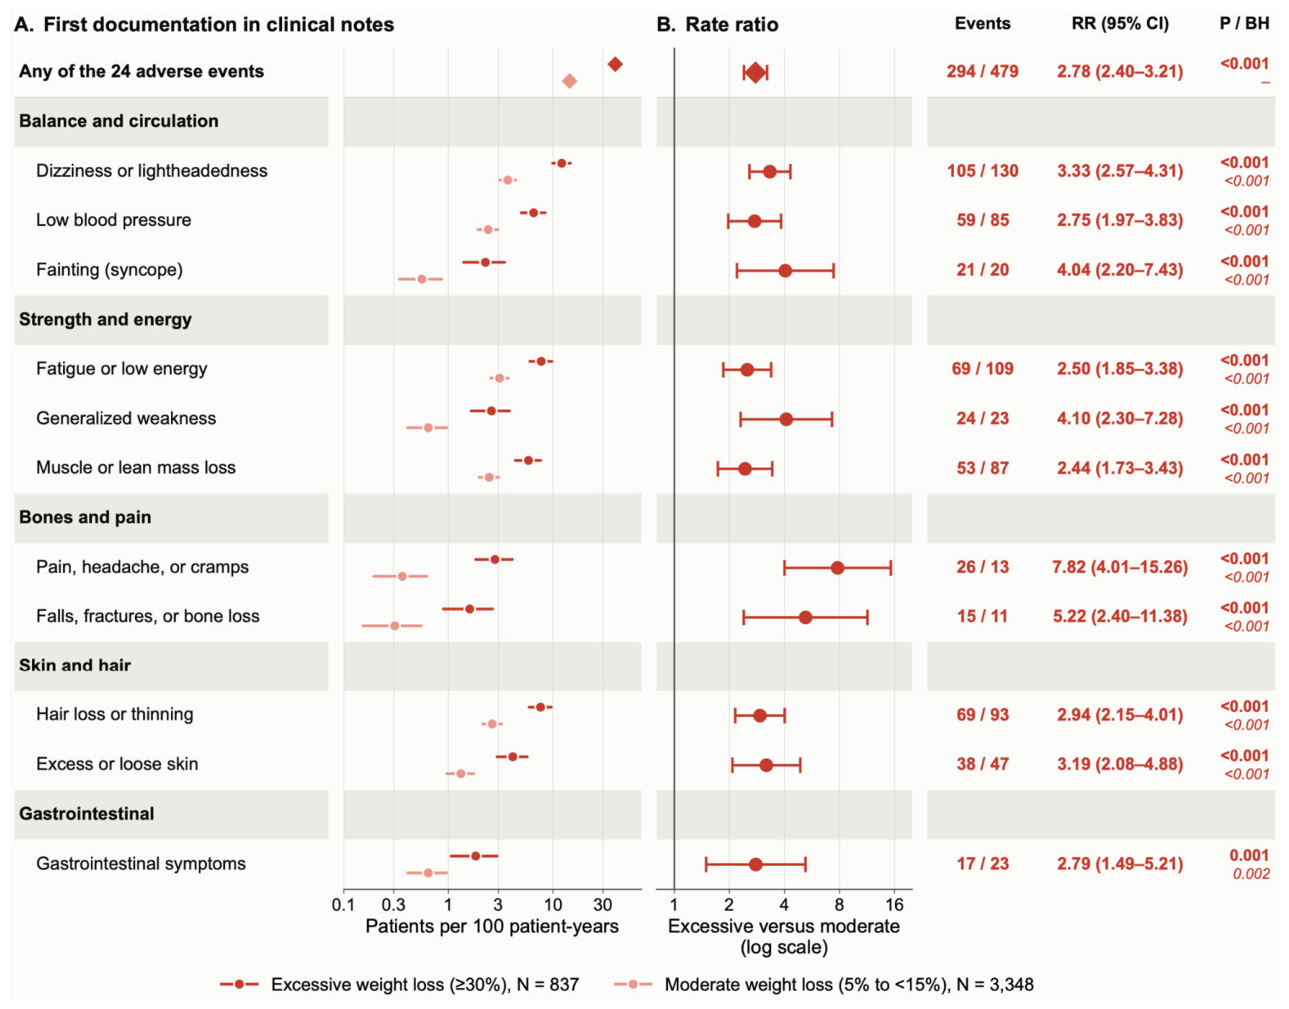
Figure 4.
Change in laboratory values and vital signs during tirzepatide treatment in the matched cohorts. Mean change from each patient’s baseline median (days −180 to 0) at months 3, 6, 9, and 12 after the first prescription, in 837 patients with excessive and 3,348 with moderate weight loss; month 0 is zero by construction. (A) Systolic BP. (B) Diastolic BP. (C) Heart rate. (D) Hemoglobin. (E) Hematocrit. (F) Sodium. (G) Potassium. (H) Calcium. (I) BUN. (J) BUN:creatinine ratio. (K) Creatinine. (L) Albumin. (M) Total protein. Dark red denotes excessive and light red moderate weight loss; shaded bands denote 95% CIs. Stars just above the zero line mark windows at which the mean change differed between the groups, after BH correction across all window comparisons in the figure (* q<0.05, ** q<0.01, *** q<0.001). Measures with fewer than 11 patients in either group at any window are not shown. BP, blood pressure; BUN, blood urea nitrogen.
Figure 4.
Change in laboratory values and vital signs during tirzepatide treatment in the matched cohorts. Mean change from each patient’s baseline median (days −180 to 0) at months 3, 6, 9, and 12 after the first prescription, in 837 patients with excessive and 3,348 with moderate weight loss; month 0 is zero by construction. (A) Systolic BP. (B) Diastolic BP. (C) Heart rate. (D) Hemoglobin. (E) Hematocrit. (F) Sodium. (G) Potassium. (H) Calcium. (I) BUN. (J) BUN:creatinine ratio. (K) Creatinine. (L) Albumin. (M) Total protein. Dark red denotes excessive and light red moderate weight loss; shaded bands denote 95% CIs. Stars just above the zero line mark windows at which the mean change differed between the groups, after BH correction across all window comparisons in the figure (* q<0.05, ** q<0.01, *** q<0.001). Measures with fewer than 11 patients in either group at any window are not shown. BP, blood pressure; BUN, blood urea nitrogen.
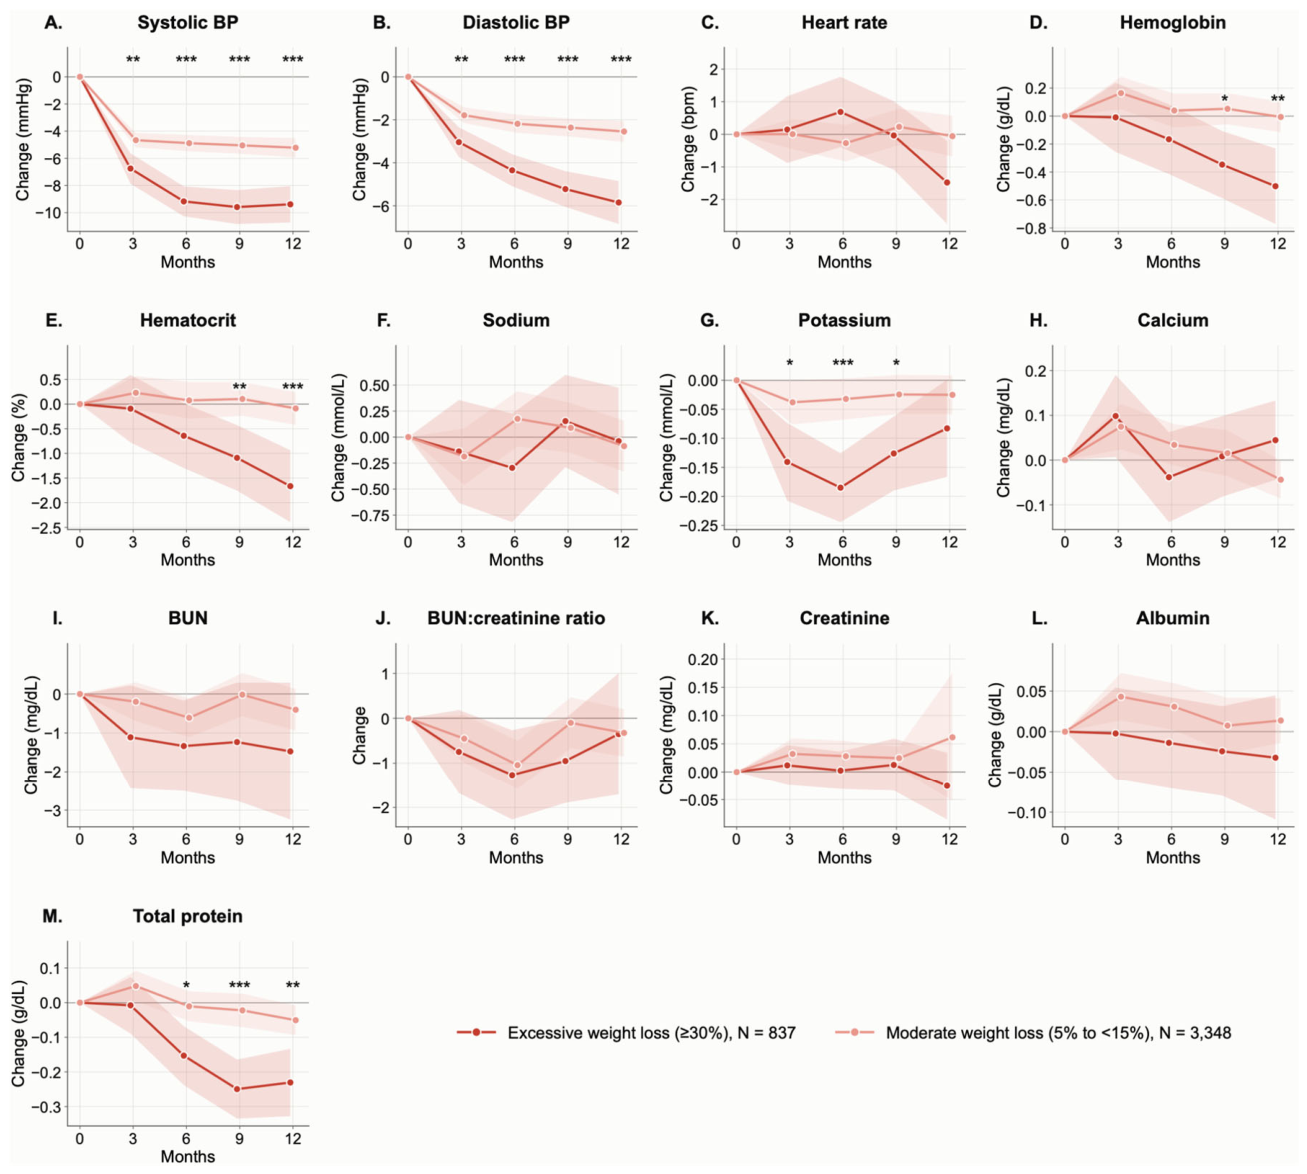
Figure 5.
Laboratory and vital-sign values beyond clinical thresholds within 30 days of maximum weight loss in the matched cohorts. For each threshold, the number of patients with at least one measurement within ±30 days of maximum weight loss in each group, the percentage of those patients with at least one value beyond the threshold, and the risk ratio for excessive versus moderate weight loss with its 95% CI (log scale), followed by the two-sided P-value and the BH-adjusted q-value (italic). A filled marker denotes q<0.05. Rows are grouped by physiological system; hemoglobin and hematocrit thresholds are sex-specific (F, female; M, male). Thresholds crossed by fewer than 11 patients in either group are not shown.
Figure 5.
Laboratory and vital-sign values beyond clinical thresholds within 30 days of maximum weight loss in the matched cohorts. For each threshold, the number of patients with at least one measurement within ±30 days of maximum weight loss in each group, the percentage of those patients with at least one value beyond the threshold, and the risk ratio for excessive versus moderate weight loss with its 95% CI (log scale), followed by the two-sided P-value and the BH-adjusted q-value (italic). A filled marker denotes q<0.05. Rows are grouped by physiological system; hemoglobin and hematocrit thresholds are sex-specific (F, female; M, male). Thresholds crossed by fewer than 11 patients in either group are not shown.
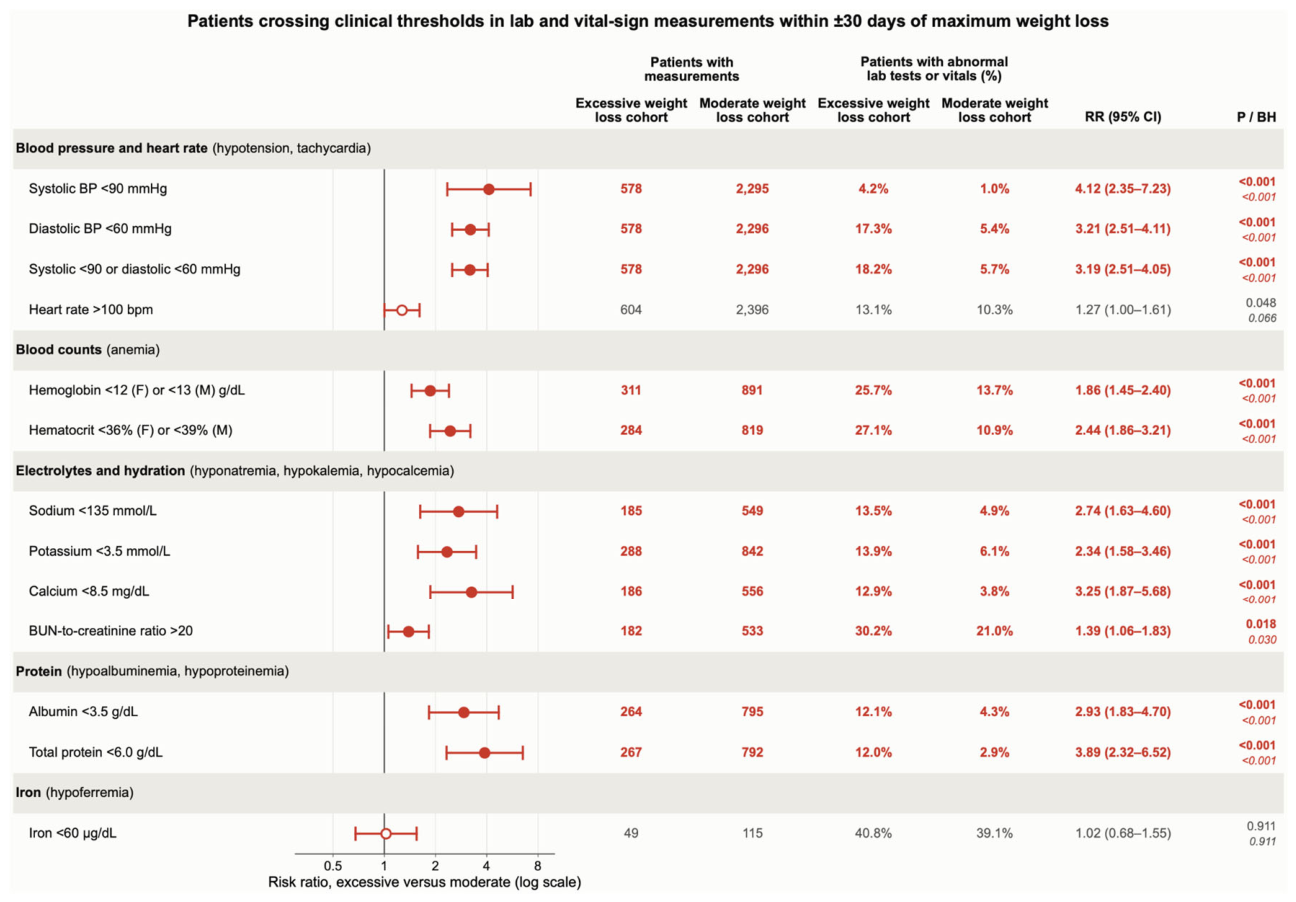

Table 1.
Characteristics of patients with excessive and moderate weight loss before and after matching. Unmatched groups comprise 1,039 patients with excessive (30% or more) and 20,668 with moderate (5% to less than 15%) maximum weight loss in the first year; matched groups comprise 837 and 3,348. Continuous variables are mean (standard deviation) unless labeled median (IQR); categorical variables are count (column percentage). Rows are grouped into the matching variables, other baseline characteristics, weight loss and follow-up, and diagnoses coded in the 365 days before the first prescription. Cells with counts below 11 are reported as <11 with percentages suppressed, per the privacy convention adopted in this study (Figure 1, Figure 2).
Table 1.
Characteristics of patients with excessive and moderate weight loss before and after matching. Unmatched groups comprise 1,039 patients with excessive (30% or more) and 20,668 with moderate (5% to less than 15%) maximum weight loss in the first year; matched groups comprise 837 and 3,348. Continuous variables are mean (standard deviation) unless labeled median (IQR); categorical variables are count (column percentage). Rows are grouped into the matching variables, other baseline characteristics, weight loss and follow-up, and diagnoses coded in the 365 days before the first prescription. Cells with counts below 11 are reported as <11 with percentages suppressed, per the privacy convention adopted in this study (Figure 1, Figure 2).
| Characteristic | Unmatched | Matched | ||||
|---|---|---|---|---|---|---|
| Excessive (N=1,039) | Moderate (N=20,668) | SMD | Excessive (N=837) | Moderate (N=3,348) | SMD | |
| Matching variables | ||||||
| Age at first prescription, years | 46.3 (13.8) | 49.1 (14.2) | 0.201 | 47.5 (13.8) | 47.5 (13.9) | 0.001 |
| Female | 834 (80.3) | 14,803 (71.6) | 0.203 | 647 (77.3) | 2,553 (76.3) | 0.025 |
| Male | 204 (19.6) | 5,803 (28.1) | 0.199 | 190 (22.7) | 794 (23.7) | 0.024 |
| Sex not recorded | <11 | 62 (0.3) | 0.046 | 0 | <11 | 0.024 |
| Body mass index at baseline, kg/m2 | 37.0 (3.6) | 35.4 (4.7) | 0.398 | 36.8 (3.6) | 36.8 (4.3) | 0.009 |
| Body mass index recorded | 1,006 (96.8) | 20,072 (97.1) | 0.017 | 811 (96.9) | 3,250 (97.1) | 0.010 |
| Tirzepatide prescriptions to maximum weight loss, median (IQR) | 7 (3-10) | 3 (1-5) | 0.891 | 6 (2-9) | 6 (3-9) | 0.064 |
| Days to maximum weight loss, median (IQR) | 304 (247-341) | 174 (103-251) | 1.027 | 286 (228-330) | 282 (208-328) | 0.039 |
| Other baseline characteristics | ||||||
| Weight at baseline, kg | 109.1 (21.7) | 105.7 (23.5) | 0.152 | 109.1 (22.5) | 110.9 (23.8) | 0.076 |
| Hemoglobin A1c at baseline, % | 5.5 (0.5) | 5.6 (0.6) | 0.079 | 5.6 (0.6) | 5.6 (0.5) | 0.004 |
| Hemoglobin A1c recorded | 465 (44.8) | 8,846 (42.8) | 0.039 | 369 (44.1) | 1,518 (45.3) | 0.025 |
| Weight loss and follow-up | ||||||
| Maximum weight loss in the first year, % | 36.4 (8.5) | 9.4 (2.8) | 4.279 | 36.8 (9.0) | 10.4 (2.9) | 3.950 |
| Follow-up, months, median (IQR) | 13.5 (10.3-18.3) | 8.5 (4.5-13.6) | 0.661 | 13.0 (9.7-18.0) | 12.5 (8.7-17.6) | 0.096 |
| Diagnoses in the year before the first prescription | ||||||
| Malignancy | 55 (5.3) | 1,116 (5.4) | 0.005 | 48 (5.7) | 189 (5.6) | 0.004 |
| Metastatic cancer | <11 | 162 (0.8) | 0.038 | <11 | 29 (0.9) | 0.032 |
| Chronic obstructive pulmonary disease | 37 (3.6) | 638 (3.1) | 0.026 | 31 (3.7) | 85 (2.5) | 0.067 |
| Chronic kidney disease | 57 (5.5) | 778 (3.8) | 0.082 | 48 (5.7) | 106 (3.2) | 0.125 |
| End-stage renal disease | <11 | 34 (0.2) | 0.042 | <11 | <11 | 0.015 |
| Cirrhosis | <11 | 92 (0.4) | 0.005 | <11 | 11 (0.3) | 0.024 |
| Heart failure | 35 (3.4) | 563 (2.7) | 0.038 | 31 (3.7) | 90 (2.7) | 0.058 |
| Type 2 diabetes | 25 (2.4) | 482 (2.3) | 0.005 | 21 (2.5) | 76 (2.3) | 0.016 |
Table 2.
Adverse events attributed to weight loss, matched and unmatched. Matched groups comprise 837 patients with excessive and 3,348 with moderate weight loss; unmatched groups comprise 1,039 and 20,668. Cells give the number of patients with a first documentation of the adverse event in follow-up, with the rate per 100 patient-years at risk in parentheses; the first row gives the patient-years of follow-up. Rate ratios are Mantel-Haenszel estimates with 95% CIs; q-values are BH-adjusted within each comparison across the 24 adverse events, and the composite is reported with its P-value only. Rows are grouped by body system. Cells with counts below 11 are reported as <11, and a rate, ratio, P-value, or q-value is shown only when both counts are 11 or more, per the privacy convention adopted in this study (Figure 3).
Table 2.
Adverse events attributed to weight loss, matched and unmatched. Matched groups comprise 837 patients with excessive and 3,348 with moderate weight loss; unmatched groups comprise 1,039 and 20,668. Cells give the number of patients with a first documentation of the adverse event in follow-up, with the rate per 100 patient-years at risk in parentheses; the first row gives the patient-years of follow-up. Rate ratios are Mantel-Haenszel estimates with 95% CIs; q-values are BH-adjusted within each comparison across the 24 adverse events, and the composite is reported with its P-value only. Rows are grouped by body system. Cells with counts below 11 are reported as <11, and a rate, ratio, P-value, or q-value is shown only when both counts are 11 or more, per the privacy convention adopted in this study (Figure 3).
| adverse event | Matched | Unmatched | ||||||||
|---|---|---|---|---|---|---|---|---|---|---|
| Excessive (N=837) | Moderate (N=3,348) | Rate ratio (95% CI) | P | q | Excessive (N=1,039) | Moderate (N=20,668) | Rate ratio (95% CI) | P | q | |
| Follow-up, patient-years | 944 | 3,595 | 1,212 | 16,536 | ||||||
| Any of the 24 adverse events | 294 (39.37) | 479 (14.43) | 2.78 (2.40-3.21) | <0.001 | - | 378 (39.58) | 2,091 (13.43) | 2.68 (2.40-3.00) | <0.001 | - |
| Balance and circulation | ||||||||||
| Dizziness or lightheadedness | 105 (12.12) | 130 (3.70) | 3.33 (2.57-4.31) | <0.001 | <0.001 | 138 (12.39) | 627 (3.86) | 2.83 (2.34-3.42) | <0.001 | <0.001 |
| Low blood pressure | 59 (6.52) | 85 (2.40) | 2.75 (1.97-3.83) | <0.001 | <0.001 | 78 (6.73) | 414 (2.53) | 2.52 (1.97-3.23) | <0.001 | <0.001 |
| Fainting (syncope) | 21 (2.25) | 20 (0.56) | 4.04 (2.20-7.43) | <0.001 | <0.001 | 22 (1.84) | 85 (0.51) | 3.55 (2.14-5.86) | <0.001 | <0.001 |
| Palpitations or shortness of breath | 11 (1.17) | <11 | - | - | - | 11 (0.91) | 51 (0.31) | 3.16 (1.67-6.00) | <0.001 | <0.001 |
| Strength and energy | ||||||||||
| Fatigue or low energy | 69 (7.71) | 109 (3.08) | 2.50 (1.85-3.38) | <0.001 | <0.001 | 91 (7.92) | 506 (3.10) | 2.49 (1.97-3.13) | <0.001 | <0.001 |
| Generalized weakness | 24 (2.58) | 23 (0.64) | 4.10 (2.30-7.28) | <0.001 | <0.001 | 29 (2.42) | 126 (0.76) | 2.71 (1.82-4.06) | <0.001 | <0.001 |
| Muscle or lean mass loss | 53 (5.82) | 87 (2.45) | 2.44 (1.73-3.43) | <0.001 | <0.001 | 67 (5.74) | 338 (2.06) | 2.33 (1.78-3.04) | <0.001 | <0.001 |
| Cold intolerance | 19 (2.03) | <11 | - | - | - | 25 (2.08) | 51 (0.31) | 5.90 (3.52-9.89) | <0.001 | <0.001 |
| Bones and pain | ||||||||||
| Pain, headache, or cramps | 26 (2.79) | 13 (0.36) | 7.82 (4.01-15.26) | <0.001 | <0.001 | 34 (2.84) | 63 (0.38) | 7.67 (4.88-12.04) | <0.001 | <0.001 |
| Falls, fractures, or bone loss | 15 (1.60) | 11 (0.31) | 5.22 (2.40-11.38) | <0.001 | <0.001 | 18 (1.49) | 38 (0.23) | 6.11 (3.39-11.02) | <0.001 | <0.001 |
| Skin and hair | ||||||||||
| Hair loss or thinning | 69 (7.60) | 93 (2.63) | 2.94 (2.15-4.01) | <0.001 | <0.001 | 92 (7.92) | 329 (2.01) | 3.45 (2.71-4.38) | <0.001 | <0.001 |
| Excess or loose skin | 38 (4.12) | 47 (1.31) | 3.19 (2.08-4.88) | <0.001 | <0.001 | 51 (4.32) | 180 (1.09) | 3.53 (2.56-4.86) | <0.001 | <0.001 |
| Skin-fold rash or infection | 12 (1.28) | <11 | - | - | - | 13 (1.08) | 31 (0.19) | 6.23 (3.18-12.23) | <0.001 | <0.001 |
| Pannus or skin-fold complications | 16 (1.71) | <11 | - | - | - | 21 (1.75) | 46 (0.28) | 5.97 (3.50-10.20) | <0.001 | <0.001 |
| Sagging skin, wrinkles, or facial change | 16 (1.71) | <11 | - | - | - | 16 (1.33) | 46 (0.28) | 4.99 (2.72-9.13) | <0.001 | <0.001 |
| Nutrition and metabolism | ||||||||||
| Hypoglycemia | 11 (1.17) | <11 | - | - | - | 11 (0.91) | 33 (0.20) | 6.31 (3.02-13.20) | <0.001 | <0.001 |
| Protein-calorie malnutrition | 23 (2.48) | <11 | - | - | - | 23 (1.92) | 49 (0.30) | 6.95 (4.12-11.75) | <0.001 | <0.001 |
| Poor intake or appetite | <11 | <11 | - | - | - | 13 (1.08) | 42 (0.25) | 3.59 (1.88-6.85) | <0.001 | <0.001 |
| Nutritional deficiency, unspecified | <11 | <11 | - | - | - | 11 (0.91) | 27 (0.16) | 4.35 (2.18-8.65) | <0.001 | <0.001 |
| Excessive or too rapid weight loss | 14 (1.49) | <11 | - | - | - | 19 (1.58) | 48 (0.29) | 5.36 (3.14-9.17) | <0.001 | <0.001 |
| Gastrointestinal | ||||||||||
| Gastrointestinal symptoms | 17 (1.82) | 23 (0.64) | 2.79 (1.49-5.21) | 0.001 | 0.002 | 23 (1.92) | 88 (0.53) | 3.59 (2.22-5.81) | <0.001 | <0.001 |
| Gallstones or cholecystitis | <11 | <11 | - | - | - | <11 | 28 (0.17) | - | - | - |
| Emotional wellbeing | ||||||||||
| Body image, mood, or anxiety | <11 | <11 | - | - | - | 11 (0.91) | 31 (0.19) | 4.20 (2.04-8.66) | <0.001 | <0.001 |
| Hormonal and sexual health | ||||||||||
| Menstrual, hormonal, or sexual changes | <11 | 14 (0.39) | - | - | - | <11 | 32 (0.19) | - | - | - |
Table 3.
Hospitalization, intensive care, and new diagnoses from the first prescription to maximum weight loss. Matched groups comprise 837 patients with excessive and 3,348 with moderate weight loss; unmatched groups comprise 1,039 and 20,668. Cells give the number of patients (column percentage). Hospitalization and ICU stays were documented in clinical notes and dated within the weight-loss interval; new diagnoses required a first diagnosis code within the interval and none at any time before the first prescription. Risk ratios are Mantel-Haenszel estimates with 95% CIs; q-values are BH-adjusted within each comparison across the ten events. Cells with counts below 11 are reported as <11 with percentages suppressed, and a ratio, P-value, or q-value is shown only when both counts are 11 or more, per the privacy convention adopted in this study.
Table 3.
Hospitalization, intensive care, and new diagnoses from the first prescription to maximum weight loss. Matched groups comprise 837 patients with excessive and 3,348 with moderate weight loss; unmatched groups comprise 1,039 and 20,668. Cells give the number of patients (column percentage). Hospitalization and ICU stays were documented in clinical notes and dated within the weight-loss interval; new diagnoses required a first diagnosis code within the interval and none at any time before the first prescription. Risk ratios are Mantel-Haenszel estimates with 95% CIs; q-values are BH-adjusted within each comparison across the ten events. Cells with counts below 11 are reported as <11 with percentages suppressed, and a ratio, P-value, or q-value is shown only when both counts are 11 or more, per the privacy convention adopted in this study.
| Event | Matched | Unmatched | ||||||||
|---|---|---|---|---|---|---|---|---|---|---|
| Excessive (N=837) | Moderate (N=3,348) | Risk ratio (95% CI) | P | q | Excessive (N=1,039) | Moderate (N=20,668) | Risk ratio (95% CI) | P | q | |
| Clinical care | ||||||||||
| Hospitalization | 215 (25.7) | 527 (15.7) | 1.63 (1.42-1.87) | <0.001 | <0.001 | 254 (24.4) | 3,039 (14.7) | 1.57 (1.40-1.76) | <0.001 | <0.001 |
| Intensive care unit stay | 44 (5.3) | 77 (2.3) | 2.29 (1.59-3.28) | <0.001 | <0.001 | 50 (4.8) | 548 (2.7) | 1.79 (1.33-2.39) | <0.001 | <0.001 |
| New diagnoses | ||||||||||
| Malignancy | <11 | 27 (0.8) | - | - | - | 12 (1.2) | 127 (0.6) | 1.61 (0.88-2.93) | 0.123 | 0.206 |
| Metastatic cancer | <11 | <11 | - | - | - | <11 | 24 (0.1) | - | - | - |
| Chronic obstructive pulmonary disease | <11 | 11 (0.3) | - | - | - | <11 | 80 (0.4) | - | - | - |
| Chronic kidney disease | <11 | 23 (0.7) | - | - | - | 12 (1.2) | 149 (0.7) | 1.39 (0.76-2.52) | 0.283 | 0.404 |
| End-stage renal disease | <11 | 0 | - | - | - | <11 | 11 (0.1) | - | - | - |
| Cirrhosis | <11 | <11 | - | - | - | <11 | 19 (0.1) | - | - | - |
| Heart failure | 11 (1.3) | 16 (0.5) | 2.75 (1.28-5.91) | 0.009 | 0.028 | 11 (1.1) | 103 (0.5) | 1.90 (0.99-3.66) | 0.053 | 0.133 |
| Type 2 diabetes | 11 (1.3) | 34 (1.0) | 1.29 (0.66-2.54) | 0.455 | 0.584 | 13 (1.3) | 163 (0.8) | 1.32 (0.75-2.34) | 0.334 | 0.418 |
Table 4.
Physician validation of the language-model extraction of adverse events attributed to weight loss. Physicians reviewed 618 records: notes with a patient’s first documentation of one of the 11 adverse events significantly more frequent with excessive weight loss (Figure 3), and notes in which the model identified no qualifying adverse effect, each sampled in equal numbers from the excessive and moderate groups. Rows are the adverse-effect categories assigned by the model; dizziness, hypotension, or syncope comprises dizziness or lightheadedness, low blood pressure, and fainting; muscle loss or weakness comprises generalized weakness and muscle or lean mass loss; and other adverse events comprises gastrointestinal symptoms and pain, headache, or cramps. Each extraction was judged correct, incorrect, or indeterminate against the source clinical documentation; accuracy is the percentage of adjudicable (correct or incorrect) records judged correct, with Wilson 95% CIs.
Table 4.
Physician validation of the language-model extraction of adverse events attributed to weight loss. Physicians reviewed 618 records: notes with a patient’s first documentation of one of the 11 adverse events significantly more frequent with excessive weight loss (Figure 3), and notes in which the model identified no qualifying adverse effect, each sampled in equal numbers from the excessive and moderate groups. Rows are the adverse-effect categories assigned by the model; dizziness, hypotension, or syncope comprises dizziness or lightheadedness, low blood pressure, and fainting; muscle loss or weakness comprises generalized weakness and muscle or lean mass loss; and other adverse events comprises gastrointestinal symptoms and pain, headache, or cramps. Each extraction was judged correct, incorrect, or indeterminate against the source clinical documentation; accuracy is the percentage of adjudicable (correct or incorrect) records judged correct, with Wilson 95% CIs.
| Model-extracted adverse-effect category | Reviewed, n | Adjudicable, n | Correct, n | Incorrect, n | Indeterminate, n | Accuracy, % (95% CI) |
|---|---|---|---|---|---|---|
| No qualifying harm identified | 200 | 195 | 183 | 12 | 5 | 93.8 (89.6-96.4) |
| Dizziness, hypotension, or syncope | 113 | 99 | 91 | 8 | 14 | 91.9 (84.9-95.8) |
| Muscle loss or weakness | 80 | 77 | 69 | 8 | 3 | 89.6 (80.8-94.6) |
| Other adverse events | 75 | 68 | 60 | 8 | 7 | 88.2 (78.5-93.9) |
| Fatigue or low energy | 40 | 37 | 34 | 3 | 3 | 91.9 (78.7-97.2) |
| Hair loss | 40 | 38 | 38 | 0 | 2 | 100.0 (90.8-100.0) |
| Excess or loose skin | 40 | 39 | 38 | 1 | 1 | 97.4 (86.8-99.5) |
| Falls, fractures, or bone loss | 30 | 23 | 20 | 3 | 7 | 87.0 (67.9-95.5) |
| Overall | 618 | 576 | 533 | 43 | 42 | 92.5 (90.1-94.4) |
Disclaimer/Publisher’s Note: The statements, opinions and data contained in all publications are solely those of the individual author(s) and contributor(s) and not of MDPI and/or the editor(s). MDPI and/or the editor(s) disclaim responsibility for any injury to people or property resulting from any ideas, methods, instructions or products referred to in the content. |
© 2026 by the authors. Licensee MDPI, Basel, Switzerland. This article is an open access article distributed under the terms and conditions of the Creative Commons Attribution (CC BY) license (http://creativecommons.org/licenses/by/4.0/).
Copyright: This open access article is published under a Creative Commons CC BY 4.0 license, which permit the free download, distribution, and reuse, provided that the author and preprint are cited in any reuse.