

Submitted:
20 October 2026
Posted:
21 October 2026
You are already at the latest version
Abstract
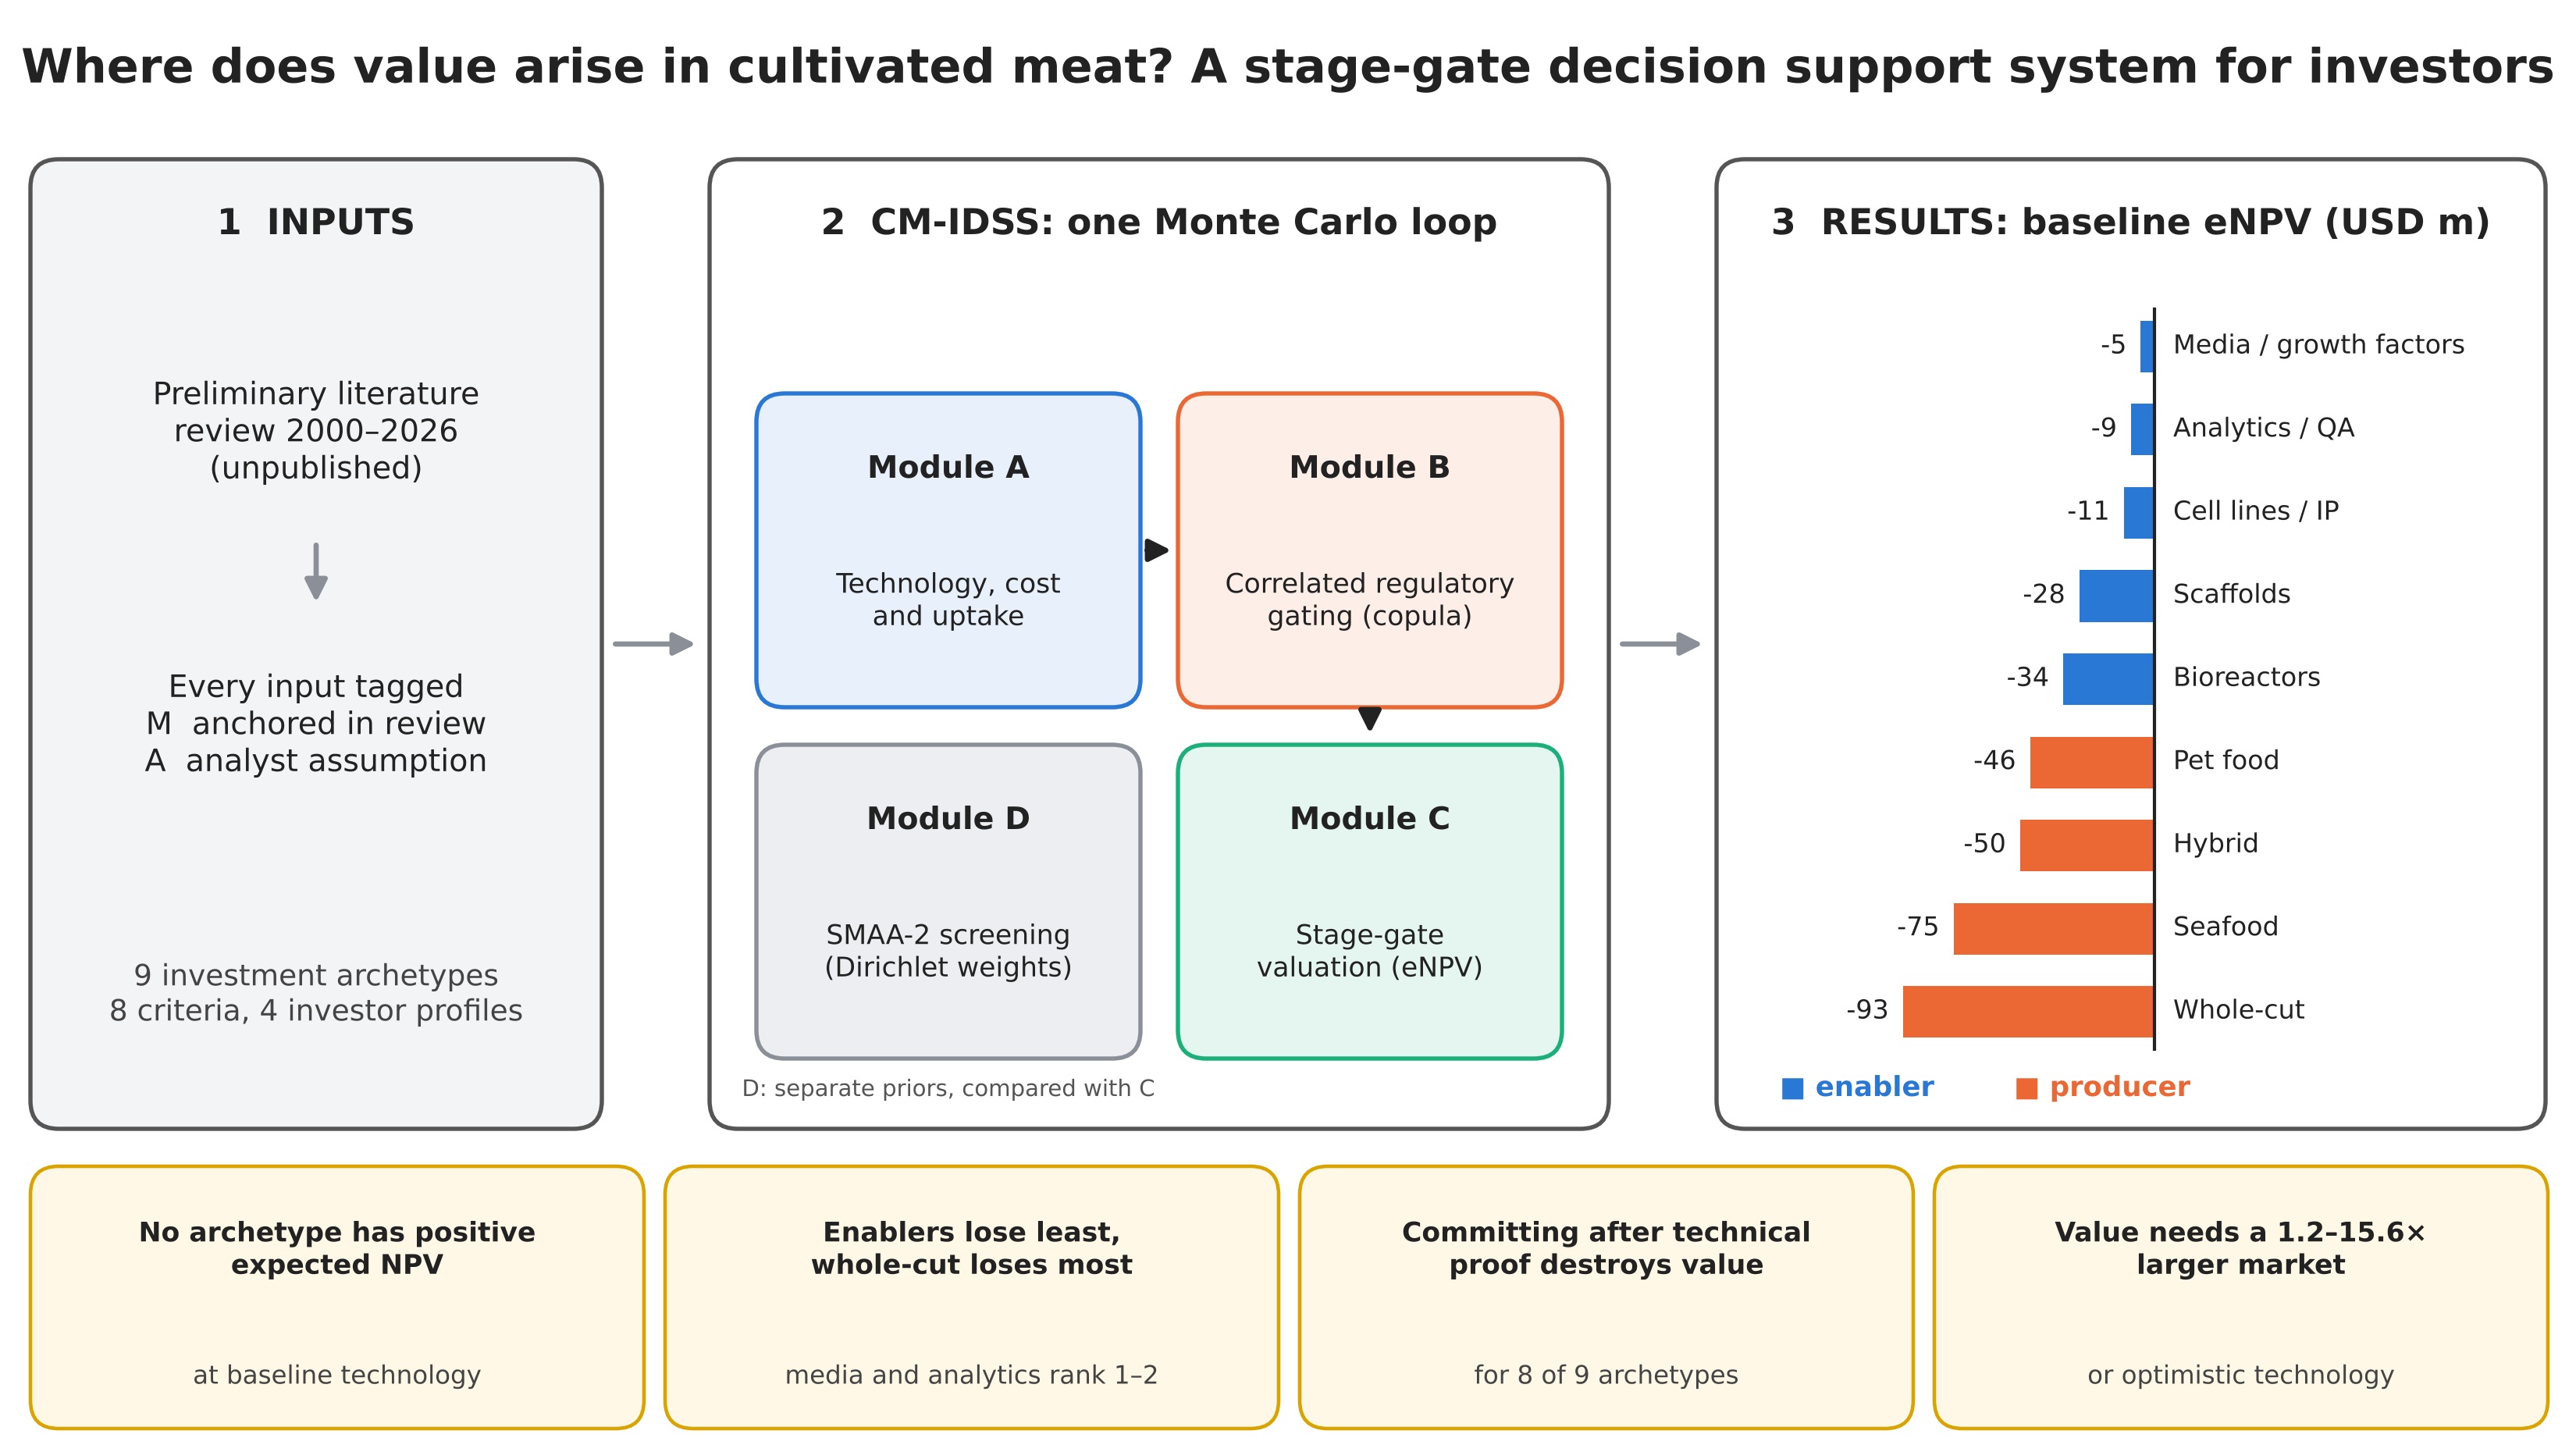
Investors in cultured meat face technical, regulatory and market uncertainties that compound across development stages, while the evidence they rely on is largely modelled, small-scale or company reported. We present CM-IDSS, a stand-alone decision support system that combines stochastic multicriteria screening (SMAA-2) of nine investment archetypes, a stochastic techno-economic cost trajectory, correlated jurisdictional approval gating and stage-gate Monte Carlo valuation with global sensitivity analysis. Inputs were parameterized from a preliminary review of the literature published between 2000 and 2026 and tagged by provenance. In a baseline analysis (20,000 draws, 12% discount rate), no archetype had a positive expected net present value (NPV): values ranged from USD −93 million (whole-cut producer) to −5 million (media and growth-factor supply). Media and growth-factor supply and analytics and quality assurance held the top two screening ranks under four investor profiles, and the whole-cut producer ranked last under all of them. Continuing after technical proof destroyed value for eight of nine archetypes. Expected NPV turned positive only if the 2032 market was 1.2 to 15.6 times the forecast range, depending on archetype, or if technology followed an optimistic trajectory. Rankings were stable in 15 of 17 parameter perturbations but inverted when optimistic technology and a fourfold larger market were combined. The model is a transparent framework for expert calibration, not a forecast.
Keywords:
cultured meat
; investment decision support
; Monte Carlo simulation
; regulatory risk
; stochastic multicriteria acceptability analysis
; techno-economic analysis
1. Introduction
Cultured meat, produced by growing animal cells in bioreactors rather than by rearing and slaughtering animals, is promoted as a route to protein supply with lower land use, reduced zoonotic and antimicrobial-resistance risk and less animal suffering [1]. Since the first prototype burger in 2013, reported production cost has fallen by several orders of magnitude, regulators in Singapore, the United States, Israel and Australia–New Zealand have authorized products, and more than 170 companies have been announced [2]. Yet most products on the market are hybrids with a minor cell fraction, structured whole-cut tissue remains a laboratory demonstration, and the four technical pillars (cell source, serum-free medium, scaffolds and bioreactors) have to be advanced together rather than one at a time [2,3].
Capital has followed the promise and then retreated. Private investment in cultured meat and seafood reached about USD 3.1 billion cumulatively by the end of 2023, annual investment fell in 2023 and again in 2024, and several companies have downsized or closed, including one that had reportedly raised more than USD 390 million [4]. Systematic reviews describe an emerging value chain in which investors, start-ups, incumbents and non-governmental organizations all play roles, and call for more work on how influence and risk are distributed among them [5].
An investor in this field reasons under uncertainty that is deeper than in most food-technology sectors, for four reasons. First, cost projections span more than five orders of magnitude, from USD 437,000 per kg in a near-term process model to USD 1.95 per kg in an idealized one [6,7], with conceptual large-scale facilities at USD 37–63 per kg [8,9]. The spread reflects assumptions about medium price, cell density and scale-up more than measured performance [6,7,8,9]. Second, environmental benefit, a central part of the investment narrative, is contested: life-cycle studies disagree on whether cultured meat outperforms conventional beef, poultry or pork, and results depend strongly on energy source and medium purity [10,11,12,13]. Third, regulatory frameworks are fragmented and politicized, with approval timelines from about one year to three years or more and statutory bans in some jurisdictions [1]. Fourth, consumer acceptance is limited by perceived unnaturalness and disgust more than by price alone, and is mostly measured in hypothetical scenarios [14,15].
Decision-support methods exist for adjacent problems. Risk-adjusted net present value and real-options approaches are standard for staged biotechnology development [16,17], and stochastic multicriteria acceptability analysis (SMAA) handles uncertain preferences and uncertain scores without requiring an investor to state exact weights [18,19]. Published techno-economic analyses of cultured meat are, however, deterministic or scenario-based [6,7,8,9]. To our knowledge, no published study links technology trajectories, jurisdictional approval risk, stage-gate attrition and multi-criteria screening in one reproducible model that an investor or analyst can run and challenge.
The parameters of the model were drawn from a preliminary review of the cultured-meat literature published between 2000 and 2026, which the authors prepared as the basis of this work. The review covers production technology, nutrition, safety, environmental performance, regulation, economics, ethics and consumer acceptance. Five of its conclusions bear on investment. First, culture medium accounts for 55–95% of production cost, with recombinant growth factors the largest single item, and medium components also dominate the life-cycle impact in the studies reviewed. Second, cell source, medium, scaffolds and bioreactors are coupled bottlenecks, and most evidence still comes from the bench or from pilots of up to about 10,000 L. Third, safety evidence is incomplete: more than 40 potential hazards have been identified in the FAO/WHO assessment [1], and standardized risk-assessment protocols and shelf-life data are lacking. Fourth, approval takes about 12–18 months in the United States, 18–24 months in Singapore and 2.5–3 years in the European Union, and some jurisdictions have introduced bans. Fifth, forecasts of the market in the early 2030s range from USD 0.42 to 1.75 billion, and consumer studies report that willingness to try rises at price parity and again if cultured products undercut conventional ones, although the evidence comes from hypothetical scenarios. Values that the model takes from this review are tagged M and all others are analyst assumptions tagged A (Section 2.2).
This paper develops and tests such a model. Its objectives are to (i) build a stand-alone decision support system, CM-IDSS, parameterized from the aforementioned preliminary review of the cultured-meat literature with the provenance of every input recorded; (ii) verify the model and compare its cost trajectories with published techno-economic benchmarks; (iii) apply it to nine investment archetypes spanning producers, enabling technologies and services; and (iv) identify, through gate economics, sensitivity and robustness analysis, the conditions under which investment would create value. The model is offered as a transparent framework for expert calibration and not as a forecast.
2. Materials and Methods
2.1. Design Principles
CM-IDSS evaluates one investment opportunity at a time inside a single Monte Carlo loop that links four modules (Figure 1): a stochastic cost and uptake trajectory (Module A), jurisdictional approval gating (Module B), stage-gate valuation (Module C) and multi-criteria screening (Module D). Five principles govern design. Every uncertain input is a probability distribution, not a point value. Every input carries a provenance tag, M where the value is taken from or anchored in the preliminary literature review and A where it is an analyst prior awaiting expert calibration. All archetypes are evaluated on the same random industry draws (common random numbers), so differences between archetypes are not sampling noise. The model reports where value is lost (gate economics) and what drives it (sensitivity), not only an expected value. Finally, the tool is stand-alone: one HTML file with no external dependencies, plus a test suite, so that any result can be reproduced from a seed (Figure 1).
2.2. Evidence Base and Parameter Provenance
2.2.1. Source of the M-Tagged Values.
Values tagged M were taken from a preliminary, unpublished review of the cultivated-meat literature published between 2000 and 2026. The review was built from a Scopus search (3,233 records) and prepared as a PRISMA-informed narrative synthesis: records were identified, screened on title and abstract, assessed in full text and grouped into six themes (production technology, nutrition, safety, environmental performance, regulation, economics, ethics and consumer acceptance). The search string, selection criteria, record counts at each stage, review status and limitations are given in Text S1 (Supplementary Materials), and the review section from which each M value was transcribed is given in Table S3.
Values that the preliminary review reports were transcribed and tagged M: the 55–95% share of medium in production cost, techno-economic cost benchmarks (Section 2.9), approval timelines (United States 12–18 months, Singapore 18–24 months, European Union 2.5–3 years), the 2032 market range of USD 0.42–1.75 billion and the increases in willingness to try at price parity (+27%) and price undercut (+55%). All other values, including stage success probabilities, capital requirements, market share weights and conventional price benchmarks, are tagged A. They are structured placeholders that the validation protocol in Section 4.4 replaces with expert-elicited distributions; the results are therefore conditional on them and are interpreted as such.
2.3. Investment Archetypes
Nine archetypes span the value chain: four producer strategies (whole-cut cell-based, hybrid cell/plant, seafood, pet food) and five enabling technologies or services (media and growth factors, bioreactors and process control, scaffolds and bioprinting, cell lines and intellectual property, analytics and quality assurance). Table 1 summarizes their regulatory exposure, joint probability of passing the three technical gates and modal capital requirement.
2.4. Module D: Multi-Criteria Screening
Screening uses SMAA-2 [18,19]. Eight criteria were derived from the six themes of the preliminary review (Table 2). Each archetype receives a modal score from 1 (worst) to 5 (best) on each criterion (Table 3) with a uniform uncertainty band of half-width 0.5 to 1.0 that records the strength of the supporting evidence. Investor preferences are expressed through a prior weight vector (Table 2, right-hand columns) for four profiles: venture or growth equity, institutional or conservative, impact or sustainability-led, and strategic corporate. In each of n = 50,000 iterations, weights are drawn from a Dirichlet distribution (through gamma variates [20]) and scores are drawn from their bands (1):
where C = 8 criteria, w̄ is the profile prior and κ is the preference strength (κ = 0 gives uniform weights; κ = 2 is the default; κ = 10 stays close to the profile). Archetypes are ranked by vₐ in each iteration. The outputs are the rank acceptability index bₐʳ, the share of iterations in which archetype a takes rank r, the first-rank acceptability bₐ¹ and the mean rank.
w ~ Dirichlet(α), α(c) = 1 + κ · C · w̄(c), s(a,c) ~ Uniform[lower(a,c), upper(a,c)], v(a) = Σ w(c) · s(a,c),
summed over c = 1, …, C
2.5. Module A: Technology, Cost and Uptake
Medium price and attainable cell density are the technology state variables, because medium accounts for 55–95% of production cost and recombinant growth factors are its largest single item [7]. For a draw with scenario parameters and Δt years after 2026, the unit cost of cell biomass and of the finished product are described in the following equations (2-5):
where Pm is medium price (USD L⁻¹), X wet cell density (g L⁻¹), d the annual fall in medium price, g the annual rise in density, φ the fraction of laboratory performance retained at commercial scale, Xmax a physical ceiling, r the medium recycling fraction, η the harvest yield, smed the medium share of cost, h the cell fraction of the product (h = 1 for fully cell-based products, h < 1 for hybrids) and cmatrix, cproc the plant-matrix and forming costs (USD kg⁻¹). Three technology trajectories (conservative, baseline, optimistic) differ in the distributions of Pm0, X0, d, g and φ (Table 4).
Pm(t) = Pm0 · (1 − d)^Δt
X(t) = φ · min[ Xmax, X0 · (1 + g)^Δt ]
Ccell(t) = Pm(t) · (1 − r) / [ (X(t) / 1000) · η · smed ]
Cprod(t) = h · Ccell(t) + (1 − h) · cmatrix + cproc
The selling price is Ps = min[πmax Pconv, max(0.8 Pconv, (1 + m) Cprod)], where Pconv is the conventional benchmark price, m a mark-up and πmax the largest premium the market bears. Gross margin is μ = (Ps − Cprod)/Ps, bounded to [−0.8, 0.4]; when μ < 0 volume is limited to 20% of capacity. Consumer uptake multiplies revenue by a(ρ), with ρ = Ps/Pconv, interpolated linearly through (0.8, 1.55), (1.0, 1.27), (2.0, 1.00) and (4.0, 0.40). The first two anchors transcribe the reported rises in willingness to try of 55% when price undercuts and 27% when price equals that of conventional meat; the others are assumptions. Producers use the price benchmark of their own product class; enabling technologies inherit the uptake multiplier of a representative hybrid product (cell fraction 0.15, benchmark USD 8 kg⁻¹), clipped to [0.4, 1.55], so that their revenue still depends on consumer demand.
Table 4 lists the principal distributions. Triangular distributions are written minimum–mode–maximum; the market size is lognormal and specified by its 5th and 95th percentiles.
2.6. Module B: Regulatory Gating
Regulatory risk is modelled for the set of jurisdictions in which the investor chooses to seek approval (Table 5). In jurisdiction j, an archetype with regulatory exposure e (Table 1) is approved with an effective probability that shrinks toward one as exposure falls, so that an enabler with little dependence on product approval is hardly constrained by it. Approvals are positively correlated across jurisdictions through a Gaussian copula [21] with a single common factor z ~ N(0,1), which represents the global regulatory climate (for example a high-profile safety event or a wave of political opposition), and an independent term εj for each jurisdiction:
peff(j) = 1 − (1 − p(j)) · e
u(j) = Φ( √ρ · z + √(1 − ρ) · ε(j) ); jurisdiction j approves if u(j) < peff(j)
The copula leaves each marginal approval probability unchanged, because uj is uniform on (0,1), and raises the probability that approvals succeed or fail together; ρ = 0.4 is the default (tag A) and 0 and 0.8 are tested. The review time in jurisdiction j is Tj max(e, 0.15), where Tj is drawn from the triangular distribution in Table 5, so that low-exposure archetypes face a short, but never negligible, review. The approval stage ends at the earliest approval, or, if none is obtained, at the longest review time of the selected jurisdictions. An archetype with e above 0.25 cannot proceed to construction without at least one approval. Revenue is scaled by the accessible market fraction, in which the market weight wj of each approved jurisdiction is reduced by an access factor αj for bans, labelling rules and distribution constraints:
where 𝒜 is the set of approved jurisdictions. The baseline strategy seeks approval in the United States, the European Union, Singapore and the United Kingdom; alternative strategies are compared in Section 3.5.
access = (1 − e) + e · Σ w(j) · α(j), summed over the approved jurisdictions j in 𝒜
2.7. Module C: Stage-Gate Valuation
Each archetype is valued as a four-stage program with three technical gates and a parallel regulatory track. Stage 1 (technical proof) has cost k1, duration d1 and success probability p1. After success, Stage 2 (pilot and scale-up; k2, d2, p2) starts together with the approval track of Module B (cost k3, duration as drawn in Section 2.6). Stage 4 (construction of commercial capacity or commercial launch; k4, d4, p4) begins when both have finished, which means that approval time can delay the whole program. Failure at a gate ends the program with outcome fail_tech, fail_scaleup, fail_reg or fail_build; costs already incurred are not recovered. All stage costs are spread evenly over the stage duration, and distributions for every archetype are given in the Supplementary Materials.
In commercial operation, a producer earns revenue equal to the market size, its revenue share s, the accessible market fraction, the ramp-up factor, the uptake multiplier and a volume factor. Operating profit (EBITDA) is revenue times the gross margin of Section 2.5, minus fixed costs. An enabling technology earns revenue equal to the market size times the share of the market value that accrues to its category (φa, Table 1 of the Supplementary Materials), its share s, access, ramp-up and the representative uptake multiplier, and its EBITDA is revenue times a category gross margin minus fixed costs. The global market follows a quadratic build-up to 2032 and constant growth afterwards, and may be cut by an industry-wide shake-out that is common to all archetypes in a draw:
M(y) = M2032 · ((y − 2026) / 6)² for y ≤ 2032
M(y) = M2032 · (1 + gM)^(y − 2032) for y > 2032
Tax is levied on positive EBITDA only; negative EBITDA is a funding outflow. If EBITDA is negative for three consecutive years after ramp-up, the business is abandoned and 10% of the capital spent is recovered. At the end of the 15-year horizon (2027–2041) a terminal value equal to the larger of the EV/EBITDA and EV/revenue exit values is added. Cash flows are discounted at mid-year at the rate of the investor profile (venture 20%, institutional 12%, impact 9%, strategic 10%), giving
where Ik and Ok are inflows and outflows in year k. The expected NPV (eNPV) is the mean over draws. In the model all stages are undertaken once the program has started, so eNPV is an expected value under a commitment to proceed after each success unless the three-year abandonment rule applies. It does not include a discretionary decision to stop at a gate, a restriction that Section 2.8 quantifies and Section 4.3 discusses.
NPV = Σ (Ik − Ok) / (1 + r)^(k + ½), summed over k = 0, …, 14
2.8. Gate Economics, Sensitivity and What-Must-Be-True Analysis
To show where value is created or destroyed, the discounted outcome of each draw is split by gate. Writing S1 for passing Stage 1, S23 for passing Stages 2 and 3 (including approval) and S4 for reaching market, the value to go at the first gate is
where c1, c23 and c4 are the discounted outlays of the stages and PVop is the discounted value of operations, including the terminal value. The values to go at the second gate (V2, conditional on S23) and the third gate (V3, conditional on S4) are defined in the same way. A negative V1 together with a positive V3 means that value is created only by the final stage and that an investor who learns the outcome of Stage 1 has reason to stop; the identity above reconciles the gate values with the total eNPV.
V1 = E[ −c23 + 1[S23] · ( −c4 + 1[S4] · PVop ) | S1 ]
eNPV = −E[c1] + Pr(S1) · V1
Global sensitivity is measured by the Spearman rank correlation between each sampled input (Table 4 inputs, the capital requirement, the approval outcome and the success of each stage) and the NPV of the same draw [22,23]. A what-must-be-true grid evaluates the eNPV and the probability of a positive NPV across the three technology trajectories and five multipliers (0.5, 1, 2, 4, 8) applied to the 2032 market distribution, with 2,000 draws per cell. For each archetype the multiplier at which eNPV crosses zero under baseline technology is found by log-linear interpolation of a 3,000-draw grid. Paired dominance, P(A > B), is the share of common draws in which archetype A has a higher NPV than B. Convergence between the screening and valuation modules is the Spearman correlation across the nine archetypes between eNPV and the negative mean SMAA rank under each profile.
2.9. Verification, Calibration and Experimental Design
The engine was verified with 45 automated tests. They cover the random-number generators and the sampled distributions against analytical moments and percentiles, tie-averaged ranking and Spearman correlation, the cost equations against hand calculations (including the density ceiling), the interpolation of the uptake multiplier, reproducibility and the independence of results from different seeds, monotonic responses (a higher discount rate lowers eNPV, technology scenarios are ordered, additional jurisdictions raise inflows for a producer), the identity NPV = PV(inflows) − PV(outflows), the marginal approval probability and the effect of correlation under the copula, the unit sums of the SMAA rank-acceptability matrix and weights, and limiting cases (all success probabilities equal to 1 give commercial operation in every draw; one dominant alternative ranks first with probability close to 1). Verification found two defects, both corrected: a seed-hashing rule under which some combinations of seed and random stream shared random numbers (now replaced by avalanche mixing of each argument) and a mis-specified price benchmark for hybrid products, which led to the separate premium-processed price tier in Table 4.
The cost module was calibrated against the techno-economic benchmarks that the preliminary review reports [6,7,8,9]. The baseline trajectory must start at pilot-scale cost, well above the large-scale benchmarks of USD 37–63 per kg, and the optimistic trajectory must reach 2040 costs between the idealized and the conceptual-plant benchmarks. Both conditions are tested automatically and the resulting trajectories are reported in Section 3.1. This is a plausibility check of the priors and not a validation of the forecasts.
The baseline analysis uses 20,000 draws, a seed of 20261010, a 12% discount rate (institutional profile), baseline technology, approval sought in the United States, European Union, Singapore and United Kingdom, regulatory correlation ρ = 0.4 and an industry shake-out probability of 0.25. SMAA uses 50,000 iterations per profile. Sampling error was assessed by repeating the run with different seeds at 2,000 to 50,000 draws. Robustness was assessed by 17 one-at-a-time perturbations at 6,000 draws: regulatory correlation of 0 and 0.8; no shake-out and a shake-out probability of 0.5; discount rates of 8% and 20%; all stage success probabilities multiplied by 0.8 and by 1.2 (capped at 0.95); capital requirements multiplied by 0.7 and 1.3; fixed costs halved; revenue shares doubled; conventional price benchmarks raised by 25%; exit multiples raised by 50%; approval probabilities reduced by 0.15 (floor 0.05); a fourfold larger 2032 market; and optimistic technology combined with the fourfold market. For each perturbation we report the Spearman rank correlation between the archetype eNPVs and those of the baseline, the three highest-ranked archetypes and the number of archetypes whose probability of a positive NPV exceeds 20%. The SMAA module was re-run with wider uncertainty bands, with κ = 10 and with shifted modal scores, and the rank acceptabilities were compared with the baseline.
2.10. Software and Availability
CM-IDSS is written in JavaScript with no external dependencies. The engine (644 lines) runs unchanged in a web browser and in Node.js, and is embedded with the interface in a single HTML file that works offline. All random numbers come from a seeded generator (mulberry32) with separate streams for the shared industry draw and for each archetype and iteration, which makes every result reproducible from the seed and allows the common-random-number comparisons of Section 2.1. The baseline analysis of all archetypes takes about one minute on a standard computer. The source code, test suite and analysis scripts will be deposited in a public repository with a persistent identifier on acceptance.
3. Results
All values are USD million unless stated and refer to the baseline analysis of Section 2.9 (20,000 draws, 12% discount rate, baseline technology, approval sought in the United States, European Union, Singapore and United Kingdom). They are conditional on the analyst priors (tag A) and are not forecasts.
3.1. Cost Trajectories and Calibration
Under baseline technology the median production cost of a whole-cut cell-based product falls from USD 428 per kg in 2027 to 227 in 2030, 80 in 2035 and 30 in 2040, with a 5th to 95th percentile range in 2040 of USD 7.8 to 142 per kg (Figure 2). The conventional beef benchmark in the model is USD 9.6 per kg (mean), so the probability that cost is at or below it is below 1% in 2035 and 9.3% in 2040. Hybrid products start lower (USD 101 per kg in 2027) and reach a median of USD 12.6 per kg in 2040 against a benchmark of 8.7, with a parity probability of 19.4% and a positive gross margin in 79% of draws. Seafood (median USD 28.7 per kg against a benchmark of 15.6) reaches parity in 24.3% of draws in 2040 and pet food (USD 13.8 per kg against 7.0) in 8.0%. The baseline 2027 cost is far above the USD 37–63 per kg of conceptual large-scale plants [8,9], as required of a pilot-scale starting point. Under optimistic technology the whole-cut median falls to USD 4.1 per kg in 2040, within the band between the idealised and conceptual-plant benchmarks, and parity is reached in 80% of draws by 2035 and 98.5% by 2040. Under conservative technology the 2040 median is still USD 443 per kg and parity is not reached in any draw.
3.2. Multi-Criteria Screening
Two archetypes, media and growth-factor supply (A3) and analytics and quality assurance (A9), hold the top two places in every profile (Table 6, Figure 3). Their combined first-rank acceptability exceeds 95% under all four profiles and is 92.7% under uniform weights. A3 is most often ranked first under the venture (79.1%), impact (57.1%) and strategic (57.3%) profiles, because these profiles weight cost-reduction leverage, environmental robustness and demand resilience, where A3 scores highest; A9 is the more probable winner under the institutional profile (49.0% against 46.8%), which weights capital lightness and regulatory resilience. Under uniform weights A3 is first in 50.7% and A9 in 42.0% of iterations. Bioreactors (A4) and cell lines (A6) fill the next places, with first-rank acceptabilities of 0.5 to 3.9%. The whole-cut producer (A1) is ranked last in every iteration under every profile, and the hybrid producer (A2) and seafood producer (A7) are in the bottom three in 71 to 89% of iterations. Re-running the module with wider uncertainty bands, κ = 10 and shifted modal scores left the order of mean ranks almost unchanged (rank correlations 1.00, 1.00 and 0.98), and the top two stayed A3 and A9.
| Archetype | Venture | Institutional | Impact | Strategic | Uniform weights | Mean rank (institutional) |
| A1 Whole-cut producer | 0 | 0 | 0 | 0 | 0 | 9.00 |
| A2 Hybrid producer | 0 | 0 | 0 | 0 | 0 | 7.05 |
| A3 Media / growth factors | 79.1 | 46.8 | 57.1 | 57.3 | 50.7 | 1.72 |
| A4 Bioreactors / process | 2.3 | 3.3 | 2.8 | 3.9 | 4.2 | 3.21 |
| A5 Scaffolds / bioprinting | 0 | 0 | 0 | 0 | 0.1 | 5.78 |
| A6 Cell lines / IP | 2.0 | 0.5 | 0.7 | 0.6 | 2.3 | 4.62 |
| A7 Seafood producer | 0 | 0 | 0 | 0 | 0 | 7.44 |
| A8 Pet food | 0 | 0.3 | 0.1 | 0.2 | 0.5 | 4.49 |
| A9 Analytics / QA | 16.5 | 49.0 | 39.3 | 38.0 | 42.0 | 1.69 |
3.3. Stochastic Valuation.
No archetype has a positive expected NPV at baseline technology (Table 7, Figure 4). The expected loss is largest for the whole-cut producer (USD −93.4 million) and the seafood producer (−74.6), followed by the hybrid producer (−49.9), pet food (−46.2), bioreactors (−33.9) and scaffolds (−27.9). The three smallest losses belong to cell lines (−11.4), analytics (−8.7) and media and growth factors (−5.1). The sampling error of the means is 0.1 to 0.7, and the standard deviation across five seeds at 20,000 draws is 0.3 for A2 and 0.17 for A3, so that these ranks are not artefacts of sampling. Distributions are strongly skewed. The 95th percentile NPV is USD +105.8 million for A3, +64.5 for A2 and +39.3 for A8, but −20.8 for A1, while 5th percentiles reach −273.7 for A1 and −205.2 for A7. The probability of a positive NPV is at most 14.3% (A3), followed by A9 (9.5%), A2 (7.8%) and A6 (7.1%), and only 0.6% for A1. The profitability index (present value of inflows to present value of outflows) is 0.85 for A3, 0.44 for A9, 0.41 for A2 and 0.06 for A1.
These results arise from attrition. A whole-cut producer reaches commercial operation in 18.4% of draws and is still operating in the last year in 15.1%: 44.7% of draws end at the first technical gate, 27.7% at scale-up, 7.9% at construction, 1.3% at approval and 3.4% by abandonment. Analytics reaches the market most often (41.9%), followed by the hybrid producer (32.9%) and bioreactors (31.4%), and the median first-sale year is 2032 for analytics and 2034 for most others, but 2036 for A1 and A7. In common-draw comparisons, A3 has a higher NPV than A1 in 85.7% of draws and than A2 in 75.8%, A2 beats A1 in 63.7%, A6 beats A4 in 78.0%, and A8 beats A2 in only 51%. A9 beats A3 in 61.2% of draws, although A3 has the higher mean, because A3 carries the larger upside.
3.4. Gate Economics and Sensitivity
The gate values explain where value is lost (Table 8, Figure 5). For the whole-cut producer, the expected value of continuing after technical proof is USD −120.8 million, after scale-up and approval it is still −136.2 million, and even for a producer that has reached market the discounted value of operations is only −1.1 million. The hybrid producer is different: continuing after Stage 1 loses USD 49.6 million and after Stage 2 and approval 20.7 million, but a producer that reaches market is worth +83.5 million, so value is created only in the last gate. Only the media and growth-factor supplier has a positive value of continuing after the first gate (+5.6 million; +37.1 after the second and +101.9 after the third), at an initial outlay of 8.4 million, so its negative eNPV (−5.1) comes from the 40.5% of draws that fail at the first gate. The values reconcile with the totals: for A1, −26.5 + 0.553 × (−120.8) = −93.3, and for A3, −8.4 + 0.595 × 5.6 = −5.1.
The Spearman rank correlations explain the same pattern. The strongest association with NPV is the success of Stage 1, and it is negative: −0.84 for A1, −0.59 for A2, −0.54 for A9 and −0.40 for A3. Technical success triggers the large later outlays, which are not recovered in most draws, so that a draw that fails early loses little. Next in order are the success of construction (A3, +0.34; A2, +0.16; A9, +0.18), market growth (+0.13 to +0.22), market size (+0.12 to +0.21), the revenue share (+0.11 to +0.19), an industry shake-out (−0.13 for A3, −0.16 for A9) and the capital requirement (−0.07 to −0.15). For the whole-cut producer no technology or market input has a rank correlation with NPV above 0.07 in magnitude except the success of scale-up (−0.22): because 85% of draws never operate and operation itself does not pay, favourable technology draws are not translated into value.
3.5. Jurisdiction Strategies
For the three archetypes tested, the choice of jurisdictions matters less than the technical outlook (Table 9). Relative to approval in the United States only, adding the European Union, Singapore and the United Kingdom, or all seven jurisdictions, raises the eNPV of the hybrid producer from USD −56.0 to −50.4 and −44.5 million and the probability of reaching market from 27.3% to 32.5% and 33.1%, and that of the media supplier from −10.8 to −6.4 and −3.3 million. Singapore alone is the worst choice for the hybrid producer (−72.3), because its 3% market weight leaves little revenue to cover fixed costs. For the whole-cut producer, wider access does not help: eNPV is −89.3 for the United States alone, −93.4 for the four-jurisdiction strategy and −93.3 for all seven, and the European Union alone gives the smallest loss (−74.4) because it lowers the probability of reaching a market at all (8.6%). This is a property of the model and not a recommendation: when unit cost exceeds price, each additional unit of market access multiplies a negative margin, and the strategy that sells least loses least.
3.6. What must be True
Expected NPV becomes positive only if the market or the technology departs substantially from the baseline (Table 10, Figure 6). With baseline technology, the 2032 market has to be 1.2 times the forecast range for media and growth factors, 1.9 times for analytics, 2.2 for hybrids, 2.3 for cell lines, 3.0 for pet food, 3.9 for bioreactors, 5.3 for scaffolds, 8.0 for seafood and 15.6 for whole-cut products. Under optimistic technology the multipliers fall to between 1.0 and 4.3 for the enablers and the hybrid and pet-food producers (A3, 1.0; A2 and A8, 1.2; A9, 1.4), and to 2.5 and 2.6 for seafood and whole-cut products. At the optimistic technology level, A3 is the only archetype with a positive eNPV (+3.1) at the unscaled market. With a fourfold larger market and baseline technology, eNPV rises from USD −92.6 to −75.1 million for A1 and from −47.6 to +64.9 million for A2, while under conservative technology a larger market worsens the result for the producers (A1 from −101.1 to −111.7 million), because revenue is then earned at a negative margin. When optimistic technology and the fourfold market are combined, all archetypes except scaffolds (−4.2) have a positive eNPV, led by hybrids (+182.7), pet food (+152.9) and media and growth factors (+123.7).
3.7. Convergence and Robustness
The ranking by expected NPV agrees with the screening ranking: the rank correlation across archetypes between eNPV and negative mean SMAA rank is 0.83 under the venture profile (20% discount rate), 0.85 under the institutional (12%), 0.90 under the impact (9%) and 0.92 under the strategic (10%). The most probable first-ranked archetype differs, however: at 12% eNPV favors A3 and SMAA slightly favors A9, and at 20% eNPV favors A9 and SMAA favors A3. As both modules use the same author-defined priors, this agreement is a consistency check and not independent validation (Section 4.3). At a 9% discount rate, A3 is marginally positive (+2.1 in a 6,000-draw run), the only archetype with a positive eNPV at baseline technology in any profile.
In the 17 perturbations the rank correlation of eNPV with the baseline is at least 0.90 in 15 and 0.95 or higher in 14 (Figure 7). In these 15 runs the three highest-ranked archetypes are always A3, A9 and A6, in some order. The leader changes from A3 to A9 when the shake-out probability is raised to 0.5, the discount rate to 20%, success probabilities are multiplied by 0.8 or capital requirements by 1.3. In these 15 runs no archetype has a probability of positive NPV above 25%, and A3 reaches a positive eNPV only when the discount rate is 8% (+4.8), success probabilities are multiplied by 1.2 (+4.8), capital by 0.7 (+2.6), exit multiples by 1.5 (+1.2) or revenue shares are doubled (+22.6). The two perturbations that change the ranking are those of the market: with a fourfold market the correlation falls to 0.57, four archetypes have a probability of positive NPV above 20% and the top three become A3, A2 and A8, and with optimistic technology as well the correlation is −0.28, six do and A2, A8 and A3 lead. The ranking of enablers over producers is therefore stable across risk and cost assumptions, but it is reversed if the market is both larger and cheaper to serve than the baseline.
4. Discussion
4.1. Principal Findings and Implications for Investors
With priors taken from the literature or set by the authors, CM-IDSS gives three findings. First, none of the nine archetypes has a positive expected NPV at baseline technology and expected NPV becomes positive only when the 2032 market is 1.2 to 15.6 times the forecast range or technology follows the optimistic path. Second, enabling technologies, led by media and growth factors and by analytics and quality assurance, hold the top places in screening and lose less than every producer in valuation, and the three leading archetypes (media and growth factors, analytics and cell lines) are the same in 15 of 17 parameter perturbations. Third, value is created late: for eight of nine archetypes the expected value of continuing after technical proof is negative, and for the hybrid producer value appears only after market entry. The pattern is consistent with a sector in which capital has retreated after the first wave of enthusiasm [4], although the model has not been tested against company outcomes.
Published techno-economic analyses report cost as a point estimate or as scenarios [6,7,8,9]. The cost module reproduces their range but shows what a point estimate hides. Under baseline technology the median 2040 cost of a whole-cut product is USD 30 per kg, but the 90% interval is USD 8 to 142 per kg and the probability of parity with the conventional benchmark is 9%. The width of this interval comes from medium price, achievable cell density and the share of laboratory performance retained at scale and is in line with the conclusion of earlier analyses that medium cost and bioreactor capital dominate [7,8]. An investor deciding on a producer is therefore deciding on a wide distribution, whose lower tail requires several favorable technical outcomes at once.
The gate economics suggest where the decision lies. Technical proof is cheap relative to what follows: its discounted expected cost is USD 3.6 to 26.5 million, whereas construction and approval run to tens or hundreds of millions. The negative correlation between early technical success and NPV in the sensitivity analysis is the signature of this structure, since success commits capital that is not recovered in most draws. The implication is the one drawn in real-options theory [17,24]: buy technical information while it is cheap and defer irreversible capital until cost and market indicators have moved. Our eNPV assumes commitment after each success and therefore understates the value of this flexibility. The negative values for producers are the value of unconditional commitment and not of the opportunity as a whole.
The ranking of strategies depends on the scenario, which is the most useful result for an investor. Under baseline conditions the lowest-capital, lowest-exposure enablers lose least. Under the combination of optimistic technology and a fourfold larger market, hybrid and pet-food producers gain most (eNPV USD +182.7 and +152.9 million) and the ranking of Section 3.7 is reversed. Hybrid and pet-food producers are thus leveraged bets on the joint arrival of low cost and large demand, whereas enablers earn a smaller return in the favorable case but lose less in the unfavorable one. A whole-cut producer, which needs a market 15.6 times the forecast range at baseline technology, is not a venture-return investment at current priors but a technology bet that needs public or strategic capital. The regulatory choices tested had a smaller effect than these technical and market conditions: seeking approval in all seven jurisdictions instead of the United States alone raises the eNPV of a hybrid producer by USD 11.5 million, and the correlation between jurisdictions did not change any ranking. This may reflect the priors, in which gate attrition is larger than regulatory attrition, and it does not mean that regulation is unimportant, since bans reduce access and are modelled only through access factors.
4.2. Implications for Policy and Research
Three implications follow for public funders and regulators, subject to the limitations below. First, the largest source of value loss is attrition at the technical gates, and the sensitivity of NPV to early success was the strongest in the model. Pre-competitive work on shared bottlenecks, such as low-cost serum-free media and growth factors, characterized cell lines and scalable scaffolds, reduces this risk for all producers at once and is where public money is least likely to displace private capital. Data-driven design of media and bioprocesses is a plausible route [25]. Second, the demand for analytics and quality assurance arises from the evidence gaps identified in the preliminary review, including the lack of standardized risk assessment, allergenicity and shelf-life data. Shared standards would reduce the safety burden on producers and, at the same time, define the market for A9. Third, reliable investment analysis needs reliable inputs. Company-level, audited data on cell density, medium consumption, yield and capital cost, shared in anonymized form, would allow the analyst priors in this paper to be replaced by evidence.
4.3. Limitations
The results are conditional on analyst priors. Of the model's parameters, only those tagged M are anchored in the preliminary review. Stage success probabilities, capital requirements, revenue shares, criterion scores and price benchmarks are the authors' judgements, and the rankings and break-even multipliers reported here should be read as consequences of those judgements and not as findings about the world. In particular, the position of media and growth factors in the ranking partly reflects a high score for cost-reduction leverage that follows from the share of medium in cost, an input of the model.
The agreement between the screening and valuation modules is partly circular. Both draw on the same priors, so the rank correlations of 0.83 to 0.92 show that the modules are internally consistent, not that either predicts outcomes. For the same reason, passing the 45 verification tests shows that the code implements the intended equations, not that the equations describe the sector [26]. Analytics and quality assurance overlaps with the expertise of the authors' group, and its score may be biased towards optimism; this is declared and will be tested with an independent panel.
Structural simplifications limit interpretation. The valuation assumes commitment after each success, as discussed above. Costs fall with time and not with cumulative production, as in an experience curve [27]. Archetypes share one global market and do not compete for it, no price feedback arises from supply, and financing, dilution and exit timing are not modelled. Enabling technologies take the uptake multiplier of a representative hybrid, only the first two anchors of which are based on the preliminary review. Those two anchors come from hypothetical willingness-to-try scenarios, which tend to overstate behavior [14,15]. The model also shows a counter-intuitive property, namely that producers whose unit cost exceeds price lose more as market access grows, which is a logical consequence of the volume rule and not evidence about strategy. Finally, the evidence base is a single preliminary review that is unpublished and has not been peer reviewed, and several of its sources are secondary.
4.4. Validation Roadmap
Three steps would turn the framework into a validated tool. First, a Delphi exercise [28,29] with at least 15 independent experts in process engineering, cell biology, food regulation and investment should elicit minimum, most likely and maximum values for every tag A parameter and the criterion scores with their bands. Second, the model should be back-tested against what happened between 2020 and 2026 to companies that raised funding, were approved, downsized or closed, so that the predicted attrition and timing can be compared with observation. Third, the commitment assumption should be replaced by explicit gate rules, with the abandonment decision optimized by backward induction, to quantify the value of flexibility. The original (analyst) and elicited parameter sets should be published side by side, and the application will be released with the elicited set as default.
5. Conclusions
CM-IDSS combines multi-criteria screening, a stochastic cost and uptake model, correlated regulatory gating and stage-gate valuation in a single reproducible tool, with the provenance of every input recorded. Applied to nine archetypes with priors drawn from a preliminary literature review and from analyst judgement, it shows that the case for cultivated-meat investment is conditional and not general. Expected NPV is negative for all archetypes at baseline technology, enablers lose less than producers and hold the leading ranks across profiles, and value arises late, so that a decision to commit capital after technical proof destroys value unless market or technology is far better than baseline. Rankings are stable to most perturbations and are reversed only by a larger and cheaper-to-serve market, which makes the market and technology trajectories, not regulatory strategy, the quantities investors most need to observe.
These results are conditional on analyst priors and should be treated as hypotheses. The contribution of the paper is the framework, which makes those hypotheses explicit and testable: its conclusions can be changed by changing a tagged input, and the next step is expert elicitation and back-testing, after which CM-IDSS can be used as an investor-facing screening tool.
Supplementary Materials
The following supporting information is available: Table S1, stage-gate, revenue and category parameters of the nine archetypes; Table S2, criterion scores, uncertainty bands, rationales and definitions; Table S3, parameter register with provenance tags; Table S4, robustness to parameter perturbations; Table S5, Monte Carlo convergence; reproduction notes; Text S1, summary of the preliminary literature review and of the values transcribed from it; the stand-alone CM-IDSS application (single HTML file).
Author Contributions
Conceptualization, M.D. and S.K.; methodology, S.K.; software, M.D..; validation, M.D. and S.K.; formal analysis, S.K.; investigation, M.D.; writing—original draft preparation, M.D. and S.K.; writing—review and editing, S.K.; supervision, S.K. All authors have read and agreed to the published version of the manuscript.
Funding
This research received no external funding.
Institutional Review Board Statement
Not applicable.
Informed Consent Statement
Not applicable.
Data Availability Statement
The original contributions presented in the study are included in the article/supplementary material, further inquiries can be directed to the corresponding author.
Acknowledgments
During the preparation of this work the authors used Claude (Anthropic; Claude Sonnet 5.5, 2026) to develop and test the simulation software and to run the analyses. The authors reviewed and edited the content and take full responsibility for the content of this publication.
Conflicts of Interest
The authors declare no conflicts of interest. Both authors are affiliated as co-founders with the AUA-spin-off Key2Core, with no economic interest associated with the present study.
Abbreviations
The following abbreviations are used in this manuscript:
| A1–A9 | Investment archetypes 1–9 (A1 whole-cut producer, A2 hybrid producer, A3 media and growth factors, A4 bioreactors and process, A5 scaffolds and bioprinting, A6 cell lines and IP, A7 seafood producer, A8 pet food, A9 analytics and quality assurance) |
| AI | Artificial intelligence |
| CAPI | Capital lightness (screening criterion) |
| CM-IDSS | Cultivated-Meat Investor Decision Support System |
| CRediT | Contributor Roles Taxonomy |
| DOI | Digital object identifier |
| DSS | Decision support system |
| EBITDA | Earnings before interest, taxes, depreciation and amortisation |
| ECON | Cost-reduction leverage (screening criterion) |
| eNPV | Expected net present value |
| ENV | Environmental-claim robustness (screening criterion) |
| EU | European Union |
| EV | Enterprise value (as in EV/EBITDA and EV/revenue exit multiples) |
| FAO | Food and Agriculture Organization of the United Nations |
| HTML | Hypertext Markup Language |
| IP | Intellectual property |
| M, A (tags) | Provenance tags: M, value anchored in the preliminary literature review; A, analyst assumption |
| MDPI | Multidisciplinary Digital Publishing Institute |
| MKT | Demand and social-licence resilience (screening criterion) |
| MOAT | Defensibility and value-chain position (screening criterion) |
| NPV | Net present value |
| P(NPV > 0) | Probability that net present value is positive |
| P5, P95 | 5th and 95th percentiles |
| PV | Present value (PVop, present value of operations) |
| QA | Quality assurance |
| REG | Regulatory resilience (screening criterion) |
| SAFE | Safety-evidence burden (screening criterion) |
| SMAA-2 | Stochastic Multicriteria Acceptability Analysis, version 2 |
| TECH | Technological maturity (screening criterion) |
| UK, US, USA | United Kingdom; United States; United States of America |
| USD | United States dollar |
| V1, V2, V3 | Value to go at the first, second and third gate |
| S1, S23, S4 | Probabilities of passing Stage 1, Stages 2–3 (including approval) and Stage 4 |
| WHO | World Health Organization |
References
- FAO; WHO. Food Safety Aspects of Cell-Based Food; Food and Agriculture Organization of the United Nations and World Health Organization: Rome, Italy, 2023. [Google Scholar] [CrossRef]
- Post, M.J.; Levenberg, S.; Kaplan, D.L.; et al. Scientific, sustainability and regulatory challenges of cultured meat. Nat. Food 2020, 1, 403–415. [Google Scholar] [CrossRef]
- Broucke, K.; Van Pamel, E.; Van Coillie, E.; Herman, L.; Van Royen, G. Cultured meat and challenges ahead: A review on nutritional, technofunctional and sensorial properties, safety and legislation. Meat Sci. 2023, 195, 109006. [Google Scholar] [CrossRef] [PubMed]
- Good Food Institute. 2023 State of the Industry Report: Cultivated Meat and Seafood; Good Food Institute: Washington, DC, USA, 2024. [Google Scholar]
- Benussi, C.; Samoggia, A. A Systematic Literature Review of Cultured Meat Through the Conceptual Frameworks of the Entrepreneurial Ecosystem and Global Value Chain. Foods 2025, 14, 885. [Google Scholar] [CrossRef] [PubMed]
- Risner, D.; Li, F.; Fell, J.S.; Pace, S.A.; Siegel, J.B.; Tagkopoulos, I.; Spang, E.S. Preliminary techno-economic assessment of animal cell-based meat. Foods 2021, 10, 3. [Google Scholar] [CrossRef] [PubMed]
- Specht, L. An Analysis of Culture Medium Costs and Production Volumes for Cultivated Meat; Good Food Institute: Washington, DC, USA, 2020. [Google Scholar]
- Humbird, D. Scale-up economics for cultured meat. Biotechnol. Bioeng. 2021, 118, 3239–3250. [Google Scholar] [CrossRef] [PubMed]
- Garrison, G.L.; Biermacher, J.T.; Brorsen, B.W. How much will large-scale production of cell-cultured meat cost? J. Agric. Food Res. 2022, 10, 100358. [Google Scholar] [CrossRef]
- Tuomisto, H.L.; Teixeira de Mattos, M.J. Environmental impacts of cultured meat production. Environ. Sci. Technol. 2011, 45, 6117–6123. [Google Scholar] [CrossRef] [PubMed]
- Mattick, C.S.; Landis, A.E.; Allenby, B.R.; Genovese, N.J. Anticipatory life cycle analysis of in vitro biomass cultivation for cultured meat production in the United States. Environ. Sci. Technol. 2015, 49, 11941–11949. [Google Scholar] [CrossRef] [PubMed]
- Lynch, J.; Pierrehumbert, R. Climate impacts of cultured meat and beef cattle. Front. Sustain. Food Syst. 2019, 3, 5. [Google Scholar] [CrossRef] [PubMed]
- Tuomisto, H.L.; Allan, S.J.; Ellis, M.J. Prospective life cycle assessment of a bioprocess design for cultured meat production in hollow fiber bioreactors. Sci. Total Environ. 2022, 851, 158051. [Google Scholar] [CrossRef] [PubMed]
- Siegrist, M.; Hartmann, C. Consumer acceptance of novel food technologies. Nat. Food 2020, 1, 343–350. [Google Scholar] [CrossRef] [PubMed]
- Bryant, C.; Barnett, J. Consumer acceptance of cultured meat: A systematic review. Meat Sci. 2018, 143, 8–17. [Google Scholar] [CrossRef] [PubMed]
- Stewart, J.J.; Allison, P.N.; Johnson, R.S. Putting a price on biotechnology. Nat. Biotechnol. 2001, 19, 813–817. [Google Scholar] [CrossRef] [PubMed]
- Trigeorgis, L. Real Options: Managerial Flexibility and Strategy in Resource Allocation; MIT Press: Cambridge, MA, USA, 1996. [Google Scholar]
- Lahdelma, R.; Salminen, P. SMAA-2: Stochastic multicriteria acceptability analysis for group decision making. Oper. Res. 2001, 49, 444–454. [Google Scholar] [CrossRef]
- Tervonen, T.; Lahdelma, R. Implementing stochastic multicriteria acceptability analysis. Eur. J. Oper. Res. 2007, 178, 500–513. [Google Scholar] [CrossRef]
- Marsaglia, G.; Tsang, W.W. A simple method for generating gamma variables. ACM Trans. Math. Softw. 2000, 26, 363–372. [Google Scholar] [CrossRef]
- Li, D.X. On default correlation: A copula function approach. J. Fixed Income 2000, 9, 43–54. [Google Scholar] [CrossRef]
- Saltelli, A.; Ratto, M.; Andres, T.; Campolongo, F.; Cariboni, J.; Gatelli, D.; Saisana, M.; Tarantola, S. Global Sensitivity Analysis: The Primer; Wiley: Chichester, UK, 2008. [Google Scholar]
- Spearman, C. The proof and measurement of association between two things. Am. J. Psychol. 1904, 15, 72–101. [Google Scholar] [CrossRef] [PubMed]
- Dixit, A.K.; Pindyck, R.S. Investment under Uncertainty; Princeton University Press: Princeton, NJ, USA, 1994. [Google Scholar]
- Negulescu, P.G.; Risner, D.; Spang, E.S.; Sumner, D.; Block, D.; Nandi, S.; McDonald, K.A. Techno-economic modeling and assessment of cultivated meat: Impact of production bioreactor scale. Biotechnol. Bioeng. 2023, 120, 1055–1067. [Google Scholar] [CrossRef] [PubMed]
- Sargent, R.G. Verification and validation of simulation models. J. Simul. 2013, 7, 12–24. [Google Scholar] [CrossRef]
- Wright, T.P. Factors affecting the cost of airplanes. J. Aeronaut. Sci. 1936, 3, 122–128. [Google Scholar] [CrossRef]
- Dalkey, N.; Helmer, O. An experimental application of the Delphi method to the use of experts. Manag. Sci. 1963, 9, 458–467. [Google Scholar] [CrossRef]
- Okoli, C.; Pawlowski, S.D. The Delphi method as a research tool: An example, design considerations and applications. Inf. Manag. 2004, 42, 15–29. [Google Scholar] [CrossRef]
Figure 1.
Architecture of CM-IDSS. Modules A to C run in one Monte Carlo loop on shared industry draws; Module D screens the archetypes on its own priors and is compared with the valuation output.
Figure 1.
Architecture of CM-IDSS. Modules A to C run in one Monte Carlo loop on shared industry draws; Module D screens the archetypes on its own priors and is compared with the valuation output.
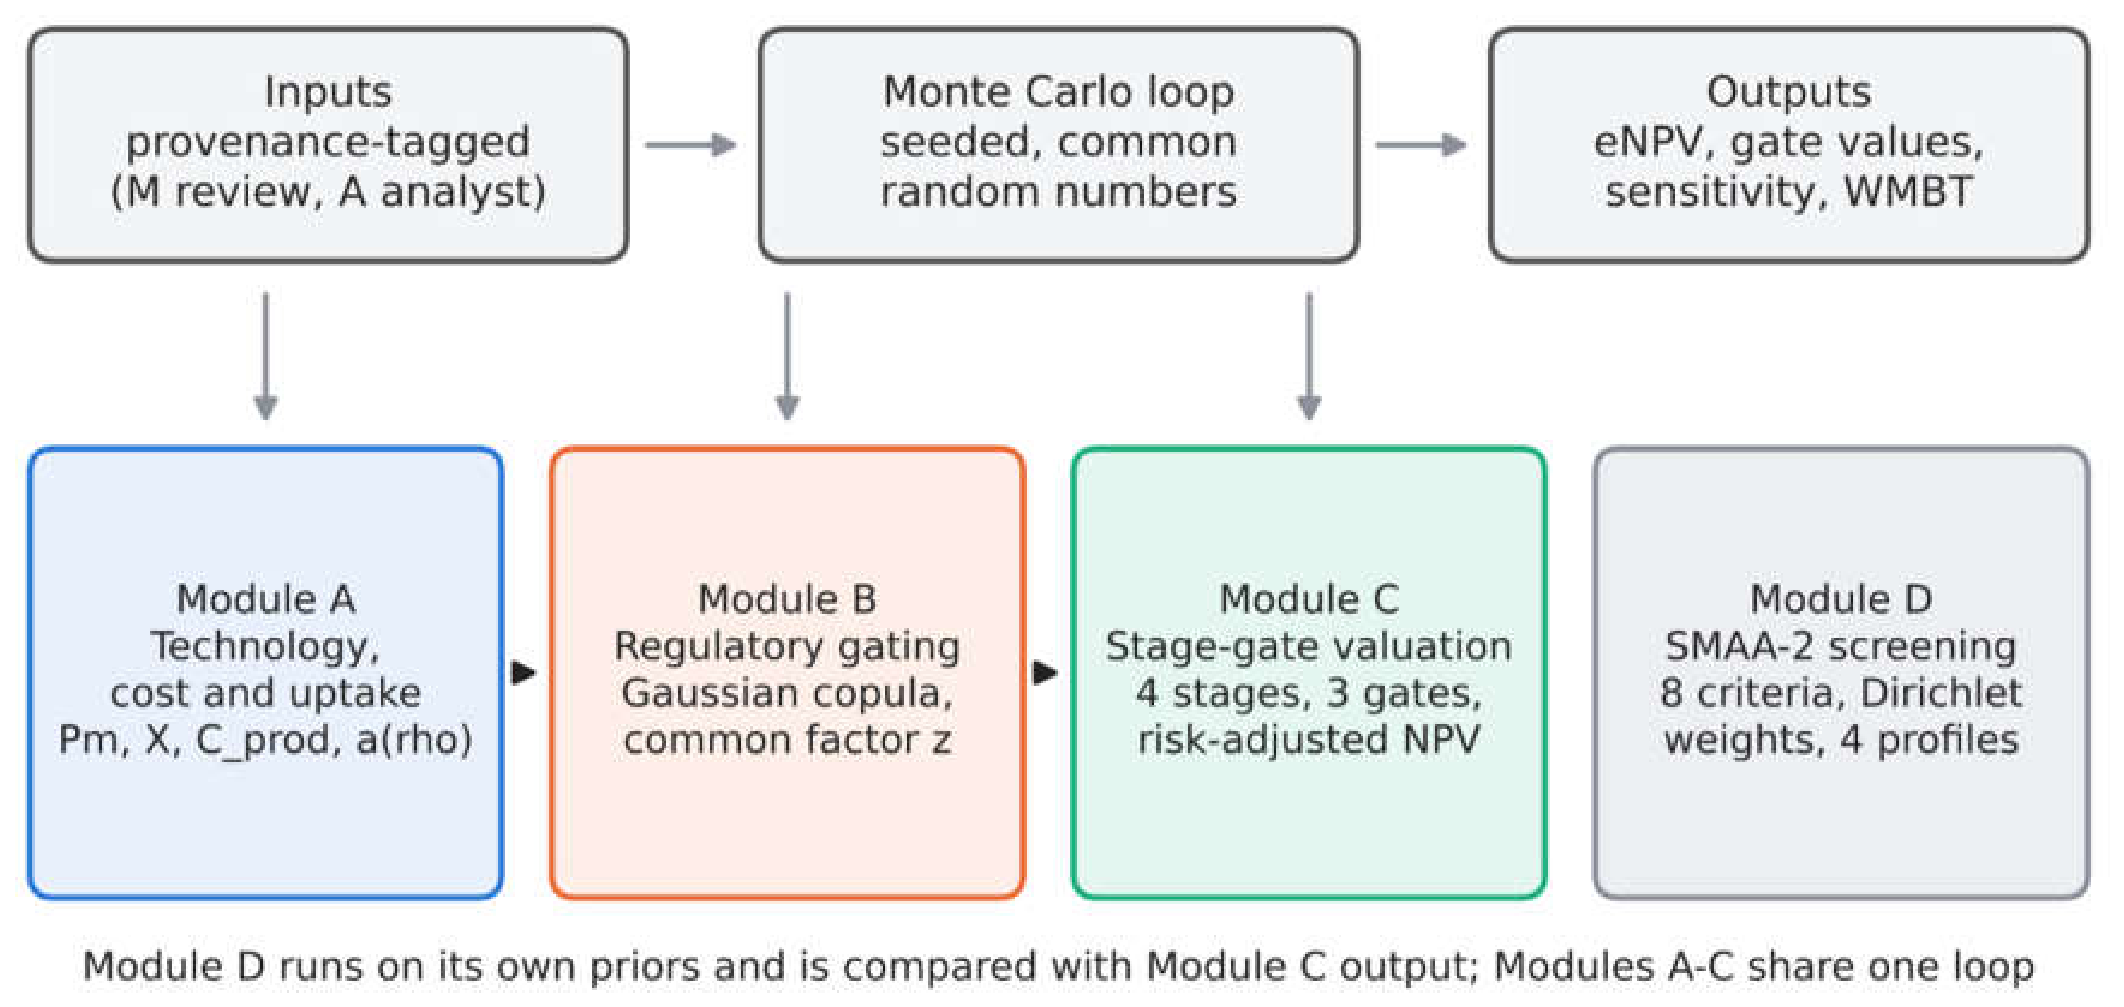
Figure 2.
Median and 5th–95th percentile production cost of whole-cut and hybrid products under conservative, baseline and optimistic technology, with the conventional price benchmark.
Figure 2.
Median and 5th–95th percentile production cost of whole-cut and hybrid products under conservative, baseline and optimistic technology, with the conventional price benchmark.
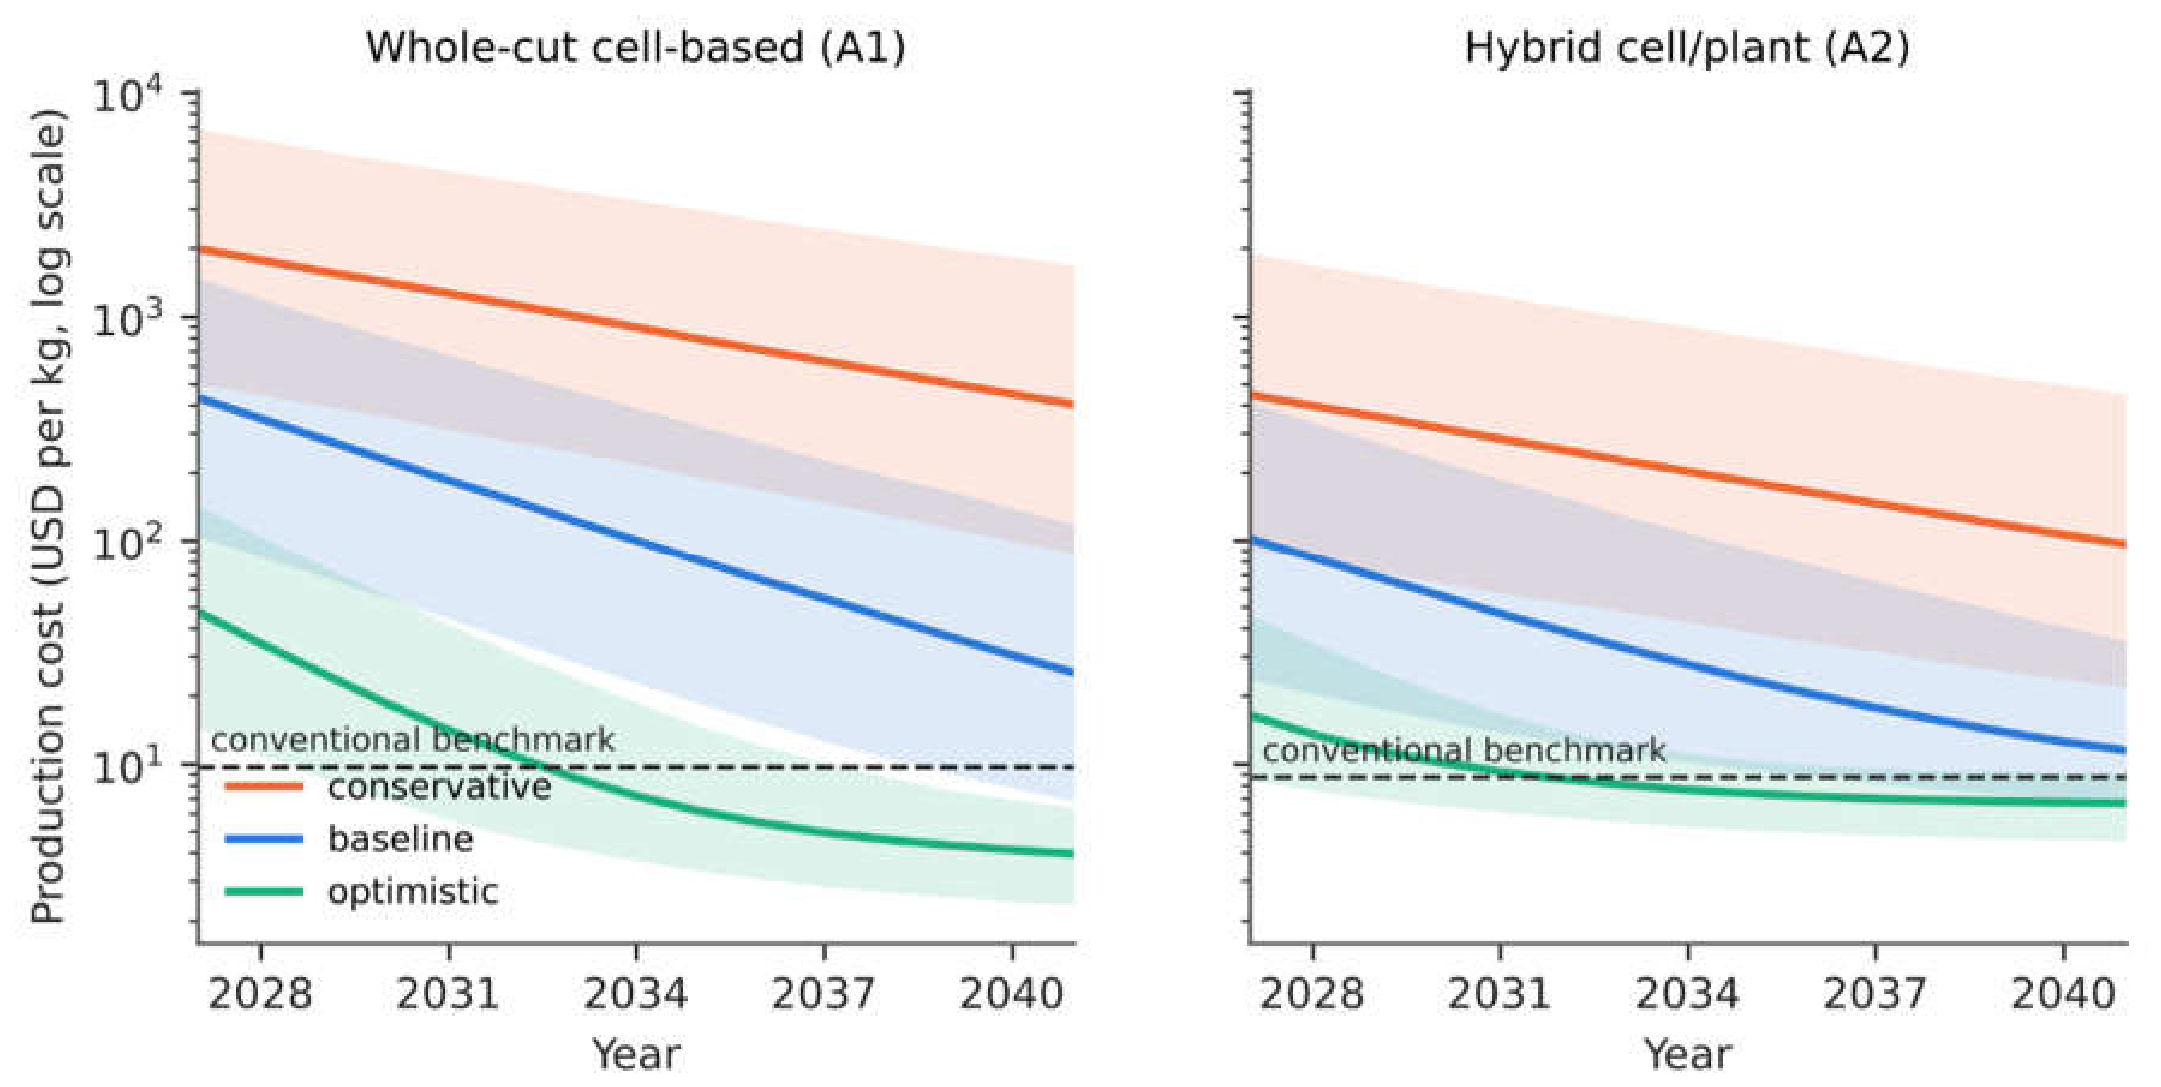
Figure 3.
Rank acceptability of the nine archetypes under the institutional profile (share of iterations at each rank).
Figure 3.
Rank acceptability of the nine archetypes under the institutional profile (share of iterations at each rank).
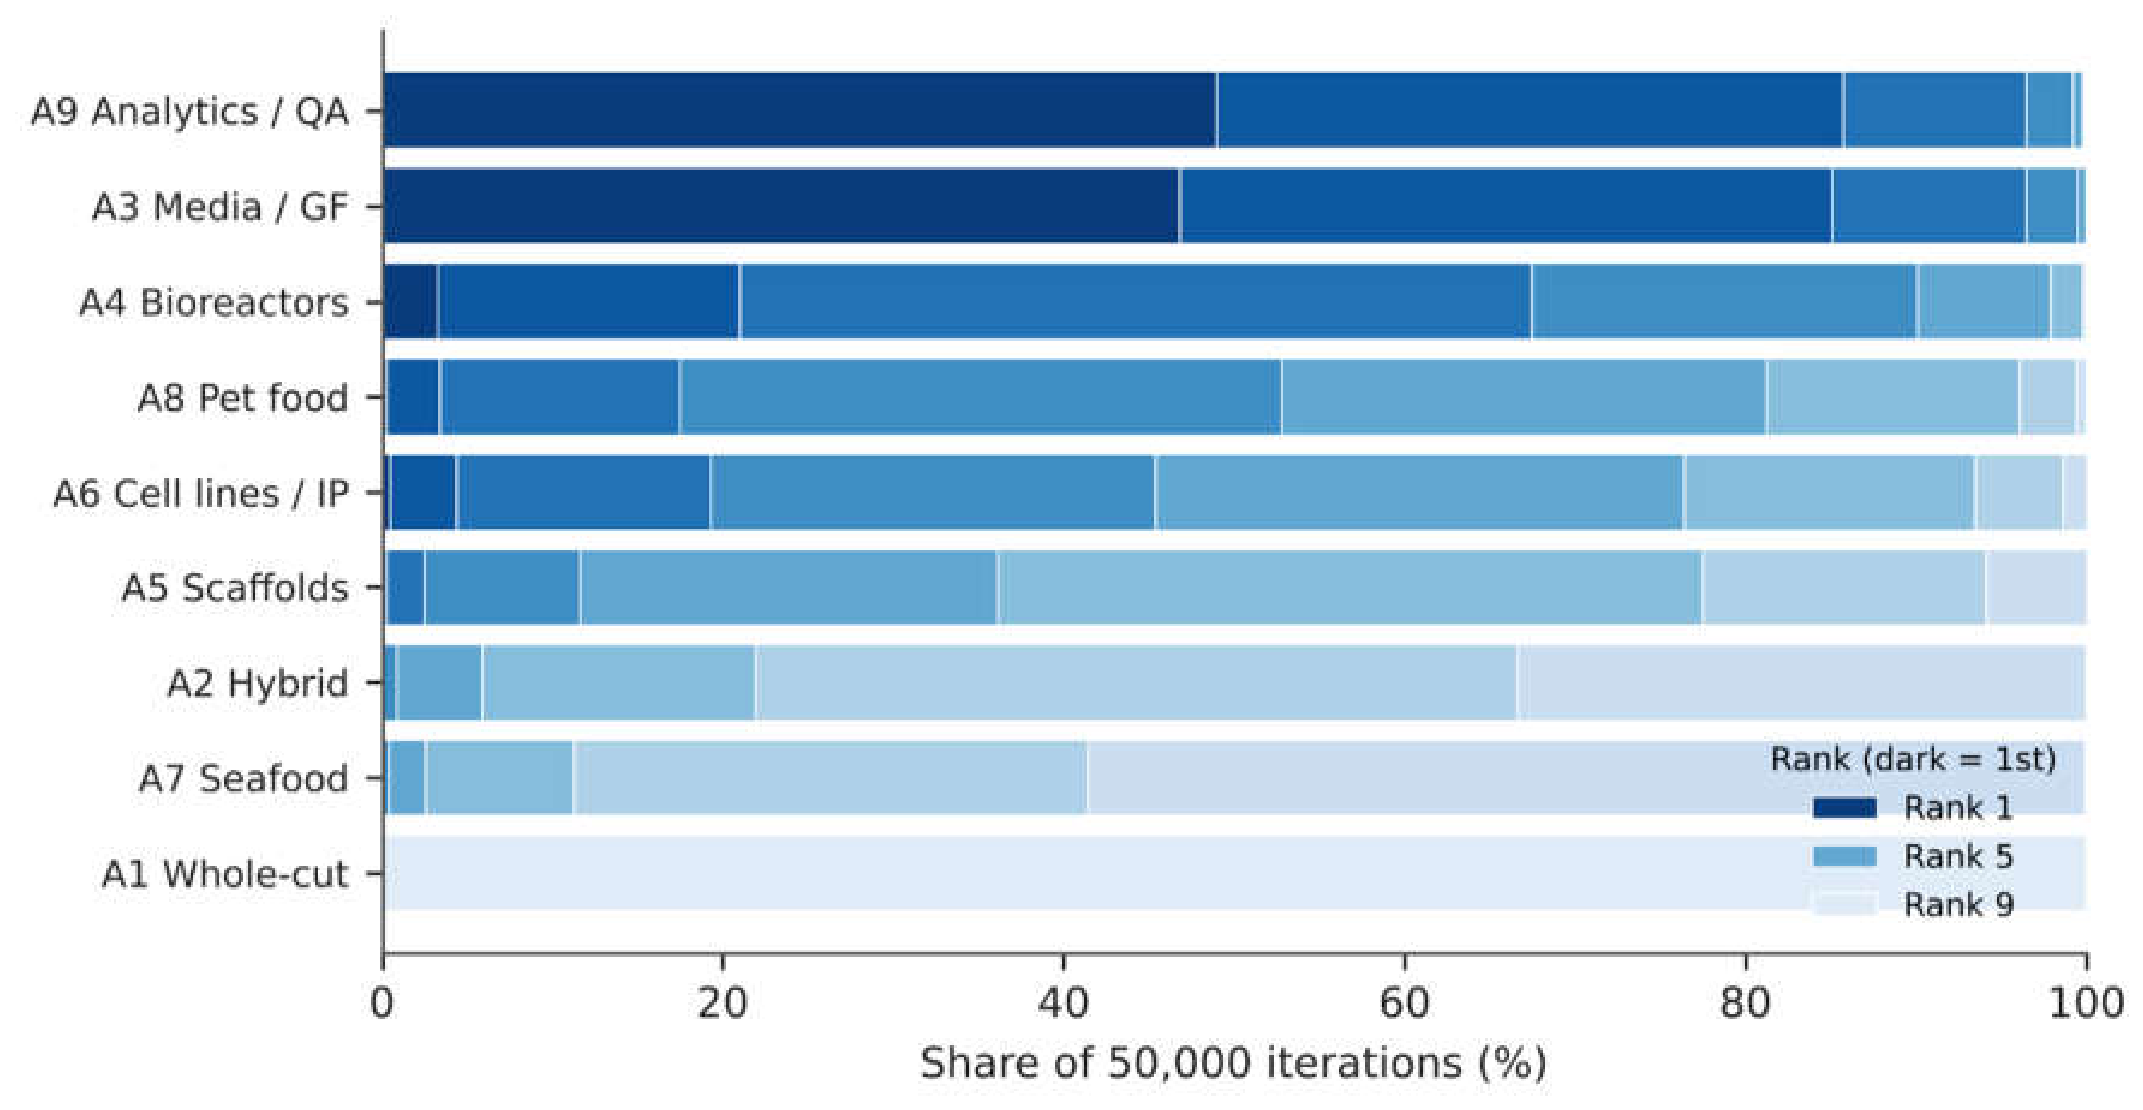
Figure 4.
Expected NPV (bars) with 5th–95th percentile range (whiskers) for the nine archetypes at baseline technology.
Figure 4.
Expected NPV (bars) with 5th–95th percentile range (whiskers) for the nine archetypes at baseline technology.
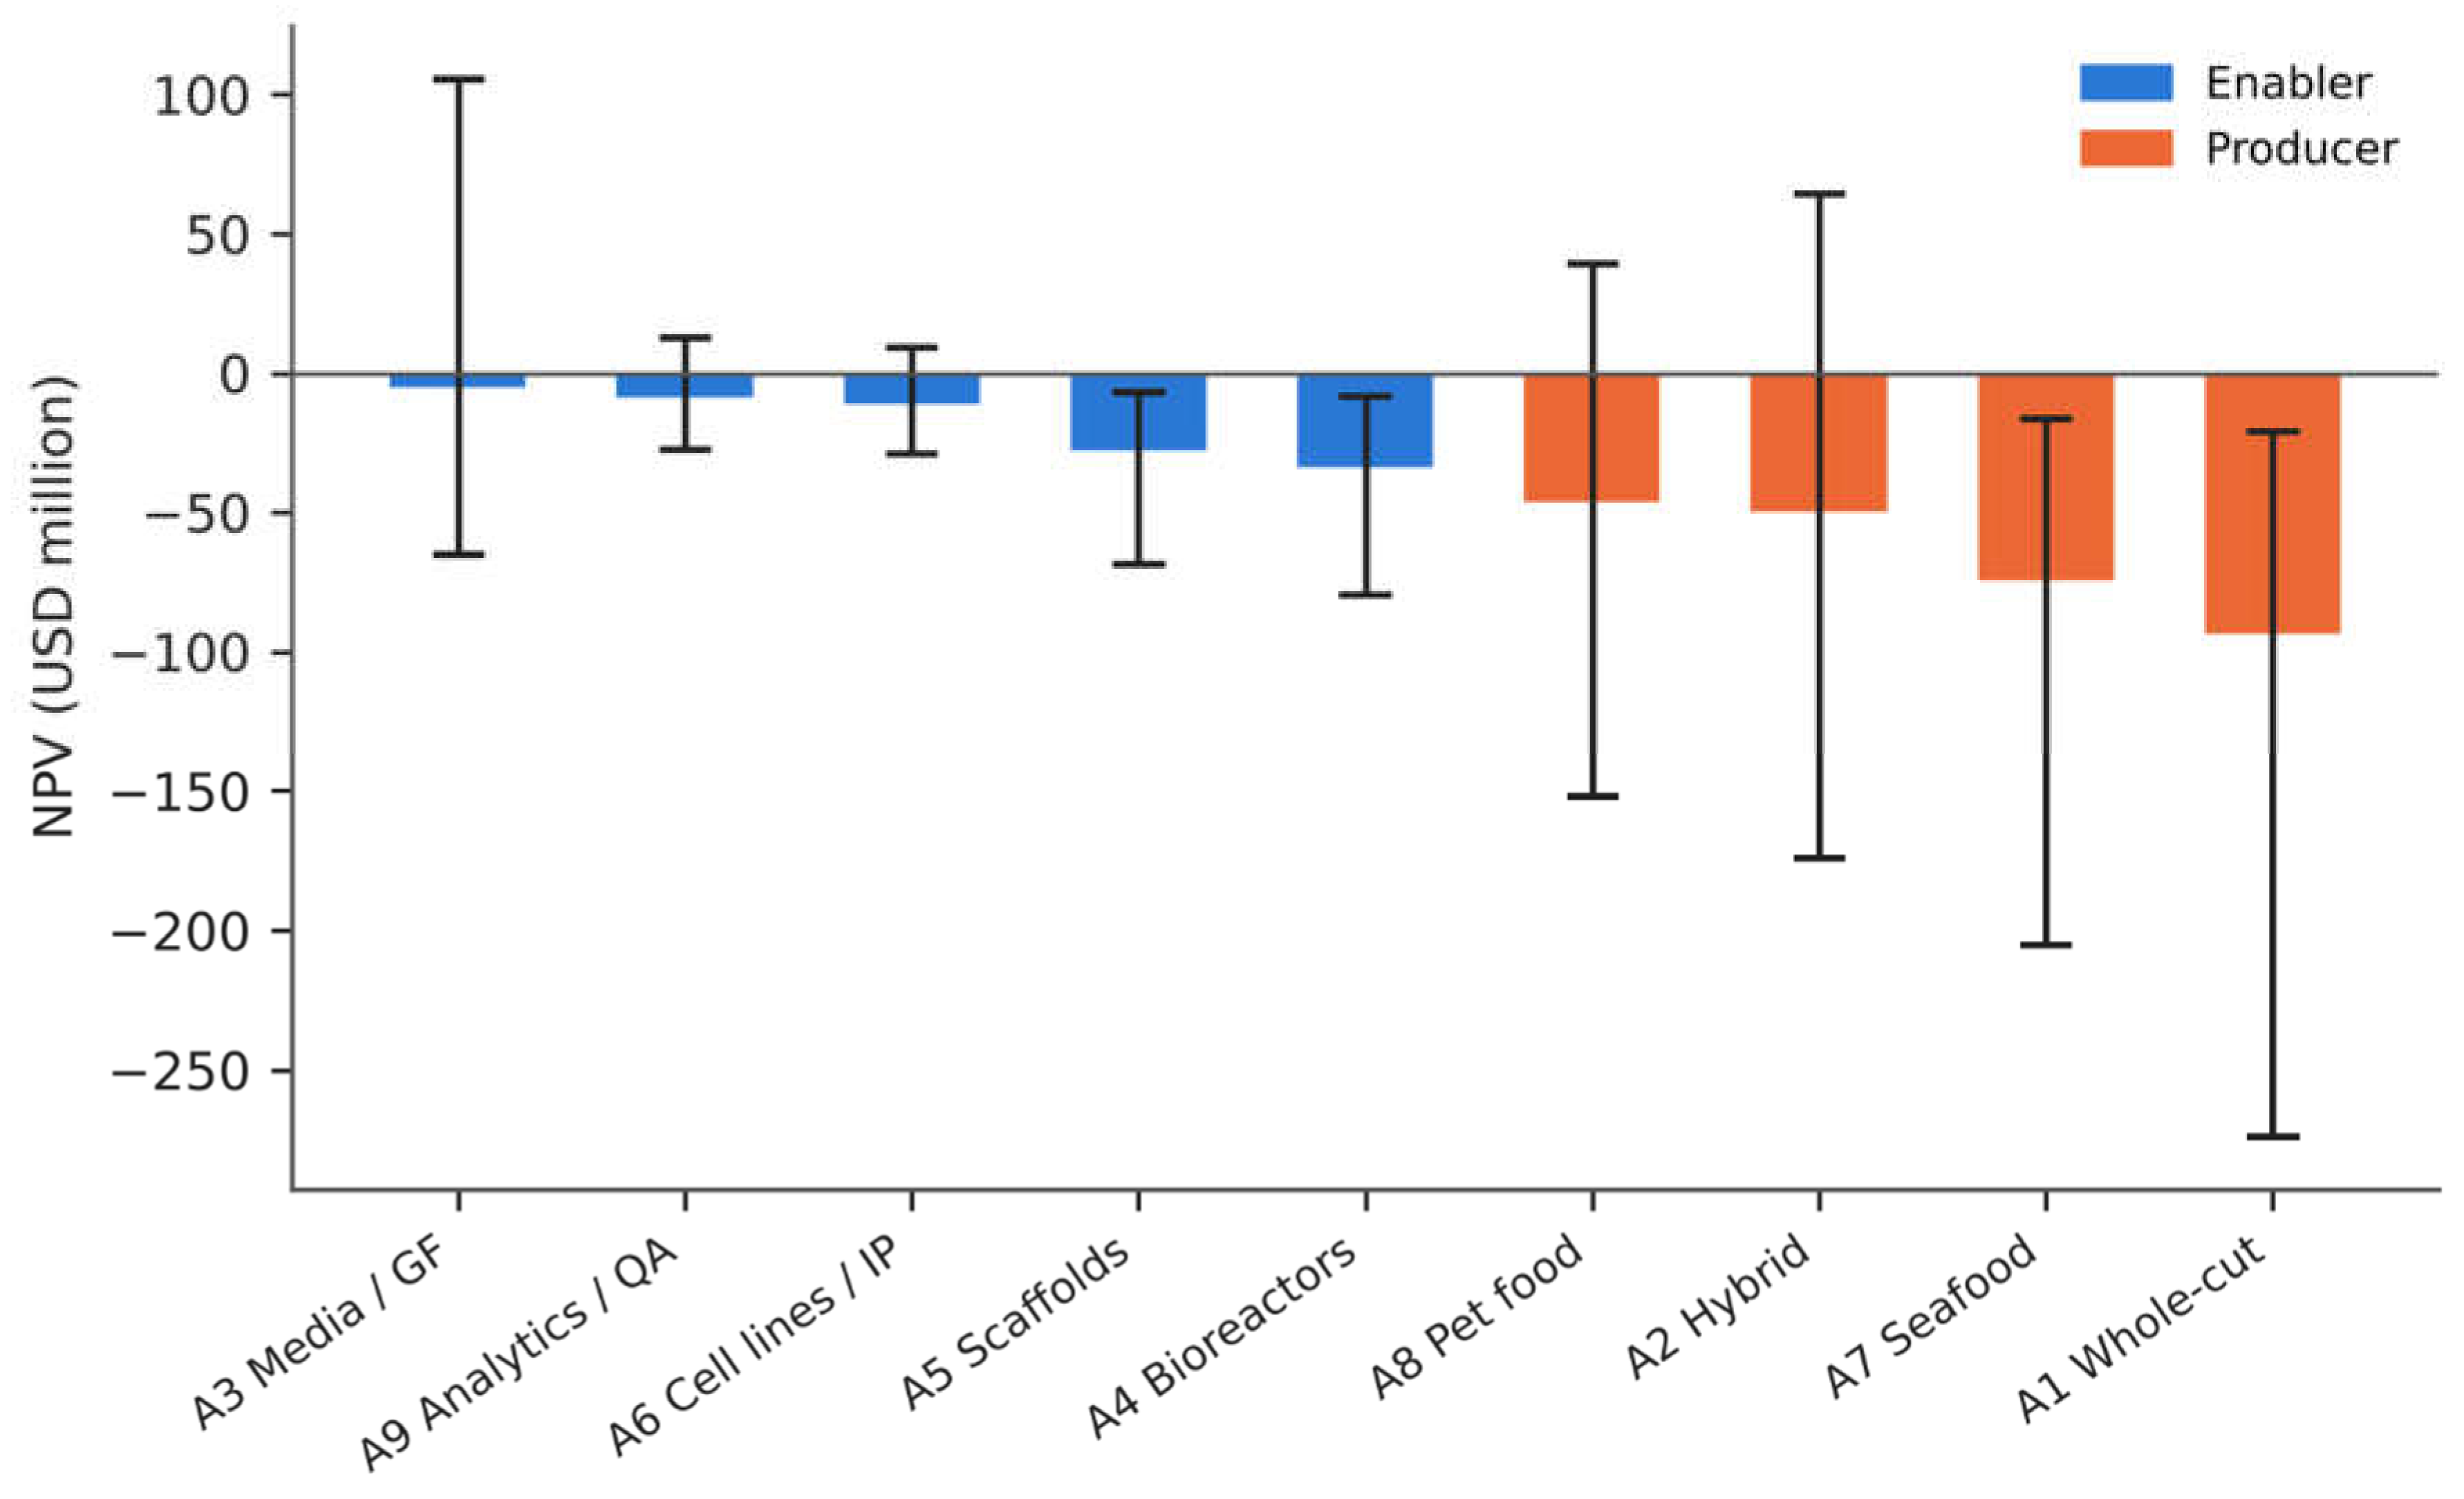
Figure 5.
Expected value to go at the three gates for the nine archetypes (baseline).
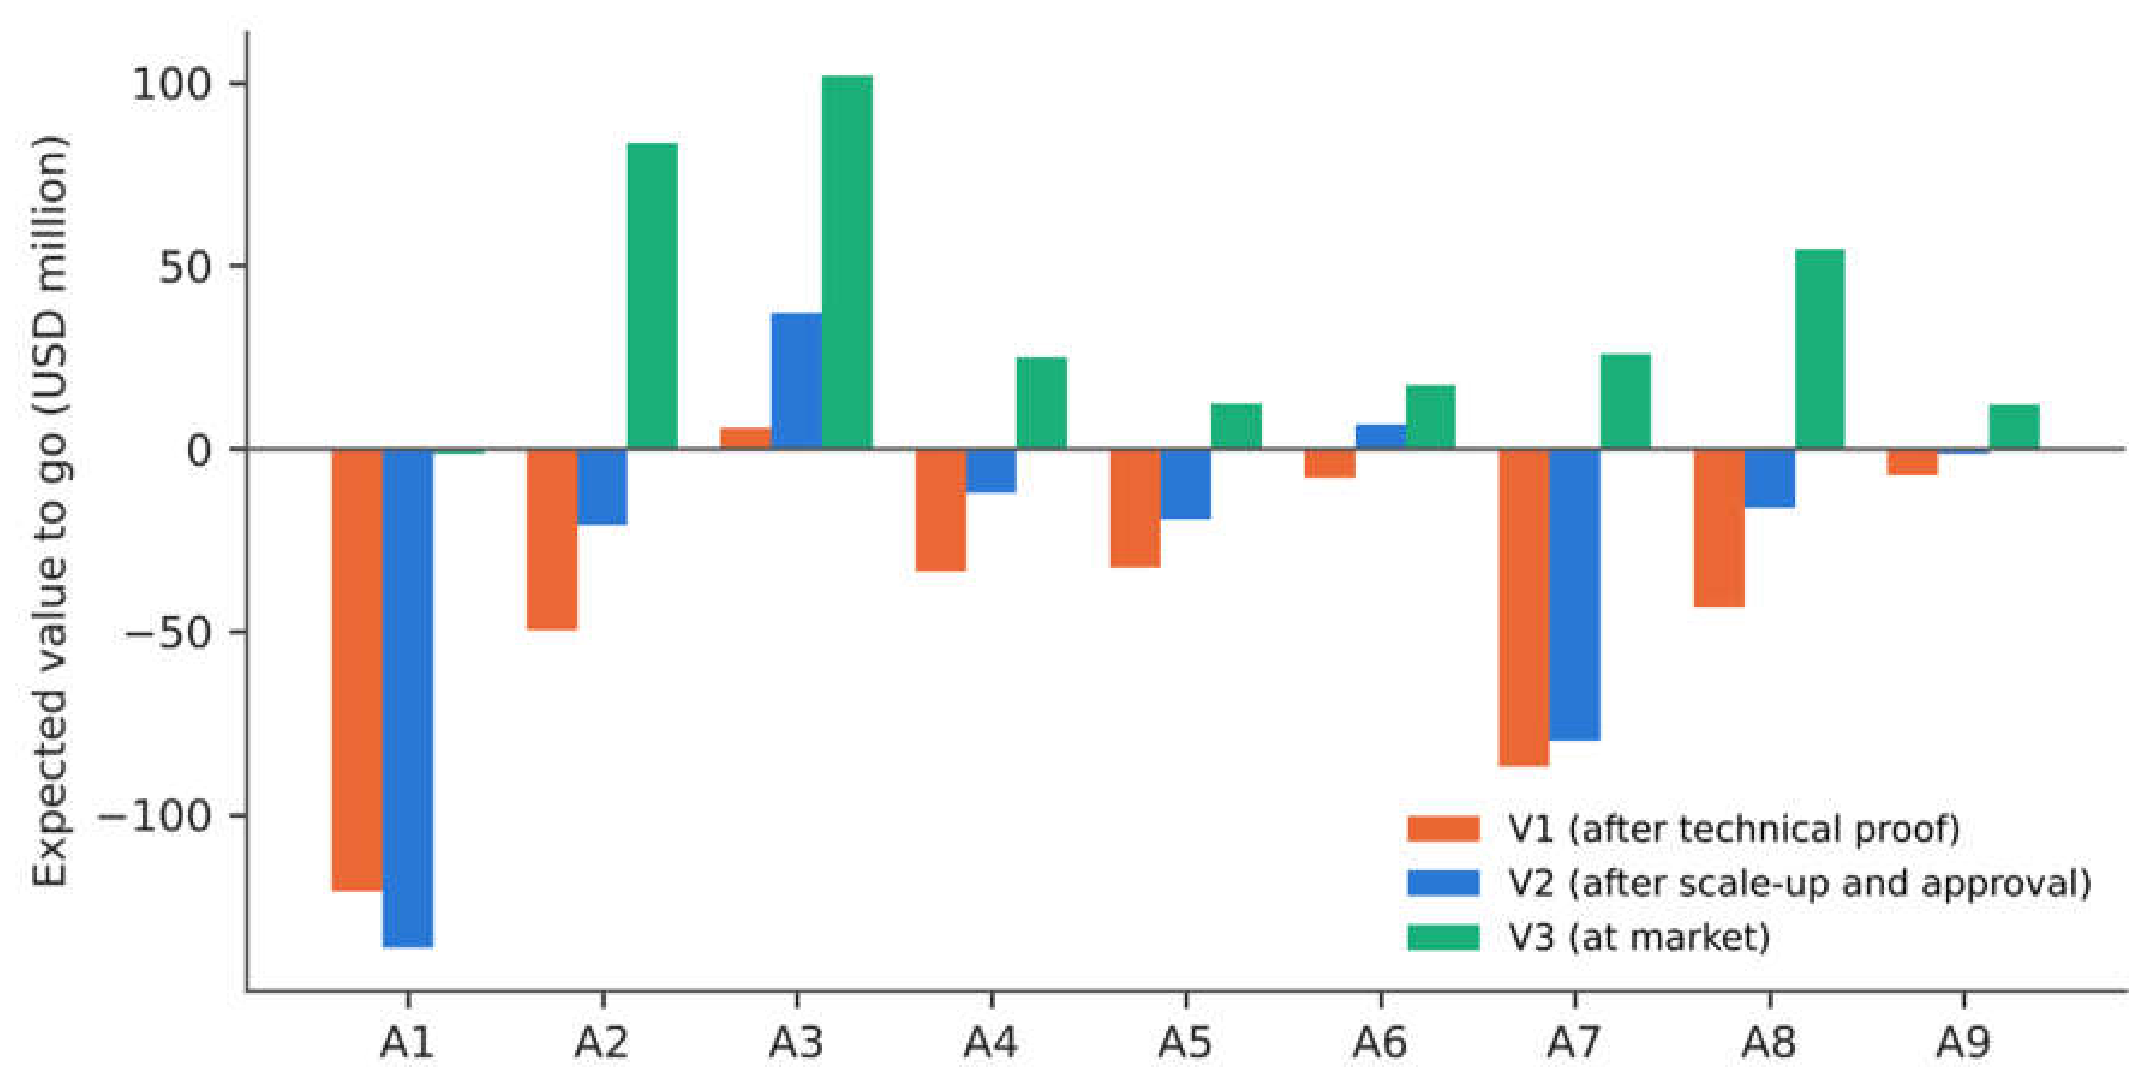
Figure 6.
Expected NPV of A1, A2 and A3 as a function of the technology trajectory and the multiplier of the 2032 market size (2,000 draws per cell).
Figure 6.
Expected NPV of A1, A2 and A3 as a function of the technology trajectory and the multiplier of the 2032 market size (2,000 draws per cell).
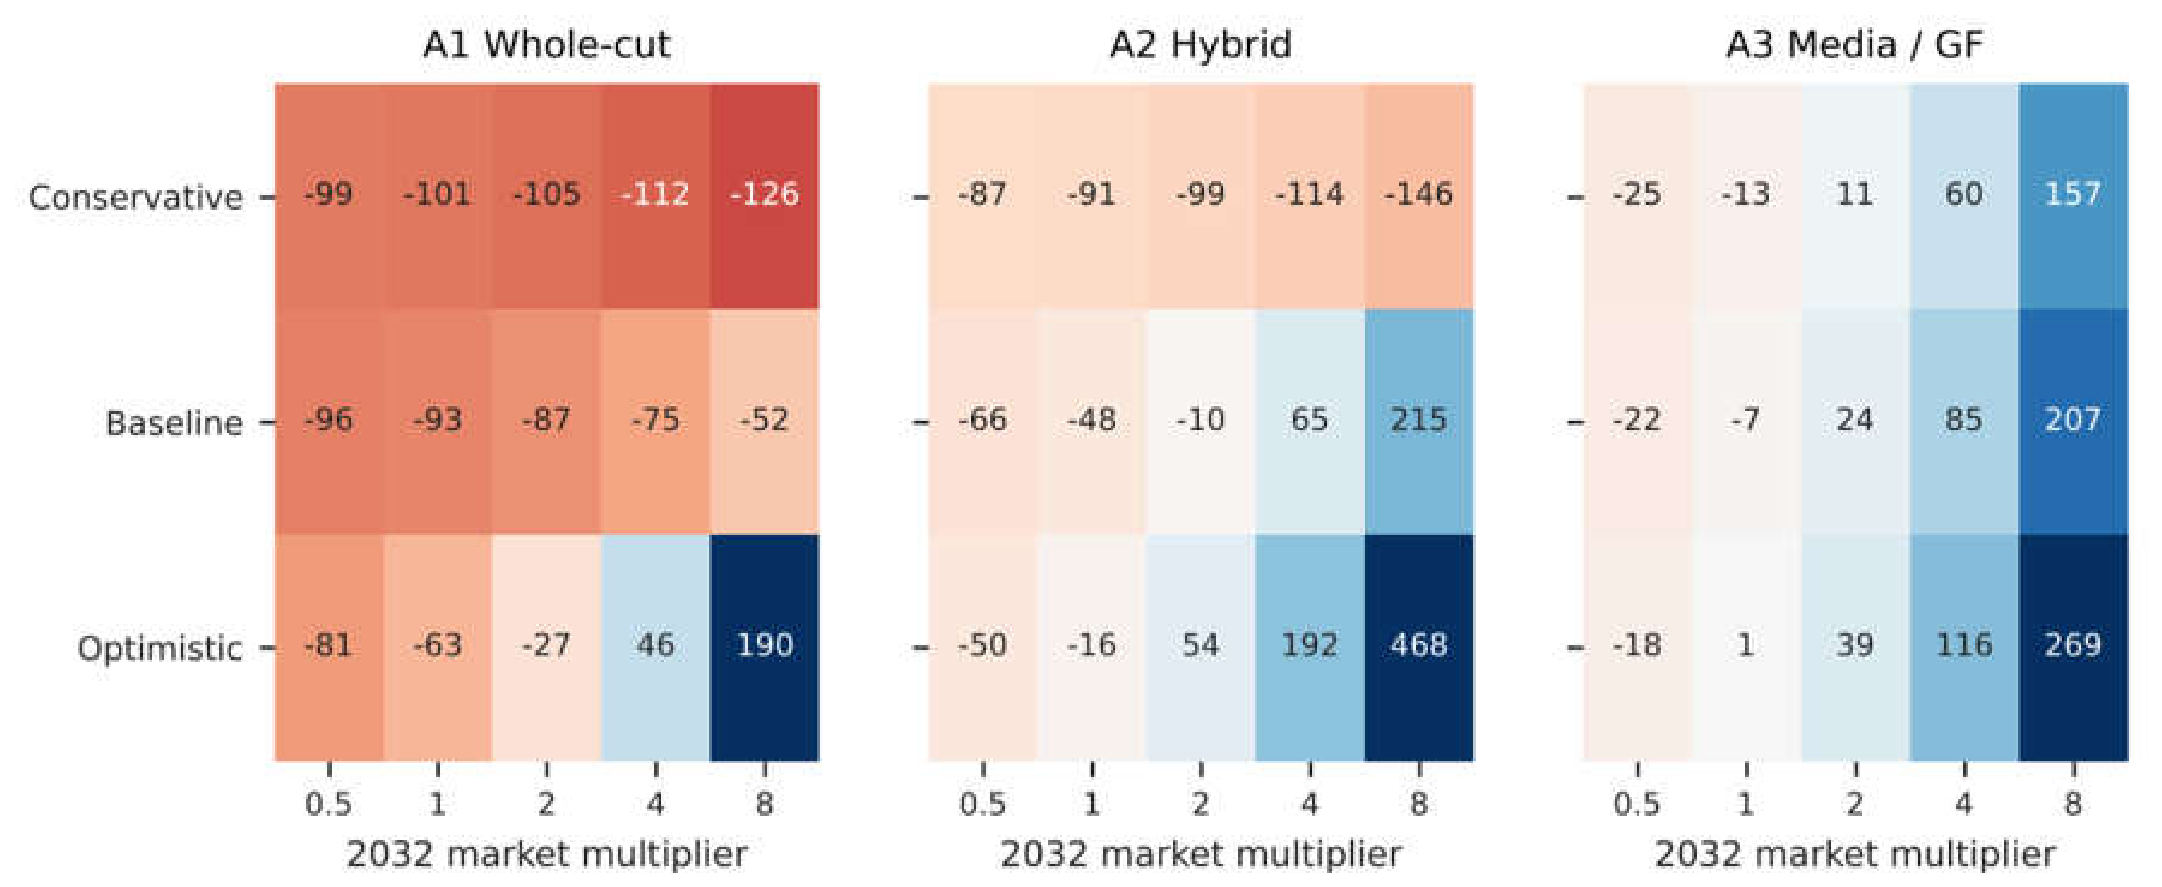
Figure 7.
Rank correlation between the eNPV ranking under each perturbation and the baseline ranking.
Figure 7.
Rank correlation between the eNPV ranking under each perturbation and the baseline ranking.
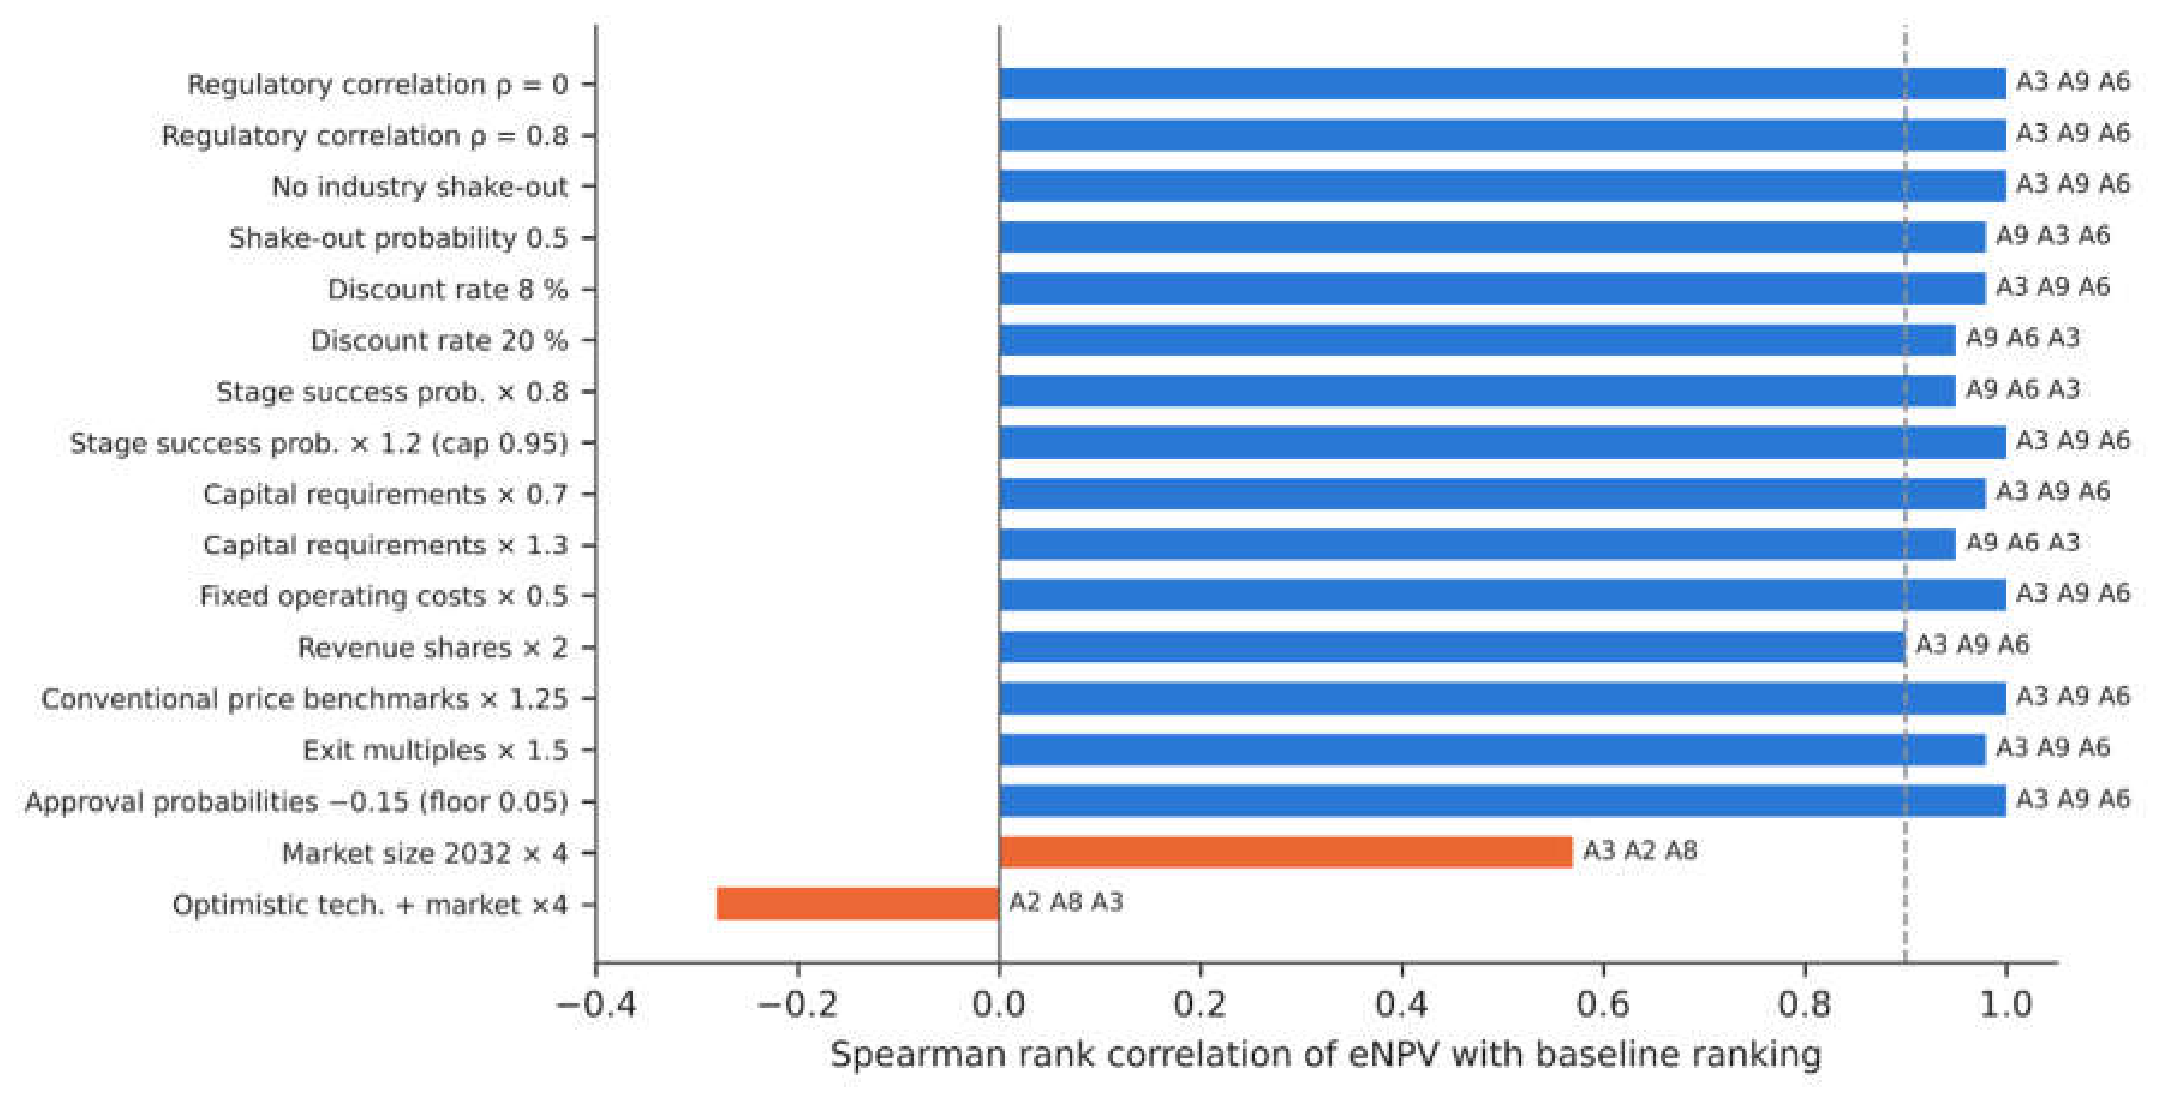

Table 1.
Investment archetypes. Exposure e (0–1) scales an archetype’s dependence on product approval; capital is the sum of modal stage costs. All entries are tag A.
Table 1.
Investment archetypes. Exposure e (0–1) scales an archetype’s dependence on product approval; capital is the sum of modal stage costs. All entries are tag A.
| ID | Archetype | Type | Regulatory exposure e | Joint success, Stages 1, 2 and 4 | Modal capital to market (USD million) |
|---|---|---|---|---|---|
| A1 | Whole-cut cell-based producer | Producer | 1.0 | 0.19 | 395 |
| A2 | Hybrid cell/plant producer | Producer | 0.9 | 0.34 | 205 |
| A3 | Media and growth-factor supplier | Enabler | 0.5 | 0.27 | 93 |
| A4 | Bioreactor and process-control technology | Enabler | 0.1 | 0.32 | 99 |
| A5 | Scaffold, microcarrier and bioprinting platform | Enabler | 0.5 | 0.23 | 91 |
| A6 | Cell-line development and IP licensing | Enabler | 0.6 | 0.29 | 33 |
| A7 | Cultivated seafood producer | Producer | 1.0 | 0.21 | 295 |
| A8 | Pet-food entry strategy | Producer | 0.6 | 0.32 | 167 |
| A9 | Analytics, quality assurance and regulatory-safety services | Enabler | 0.1 | 0.42 | 29 |
Table 2.
Screening criteria, their source in the preliminary literature review and prior weights by investor profile. Section numbers refer to the structure of the preliminary review, a summary of which is in the Supplementary Materials.
Table 2.
Screening criteria, their source in the preliminary literature review and prior weights by investor profile. Section numbers refer to the structure of the preliminary review, a summary of which is in the Supplementary Materials.
| Criterion | A high score means | Review section | Venture | Institutional | Impact | Strategic |
|---|---|---|---|---|---|---|
| TECH Technological maturity | Close to demonstrated industrial scale across cells, media, scaffolds and bioreactors | §2, §12 | 0.10 | 0.12 | 0.08 | 0.15 |
| ECON Cost-reduction leverage | Sits on or captures value from the dominant cost locus (medium, growth factors) | §2.2, §7 | 0.22 | 0.12 | 0.12 | 0.15 |
| REG Regulatory resilience | Low exposure to slow, fragmented, politicised approval and to bans | §6 | 0.10 | 0.18 | 0.10 | 0.12 |
| SAFE Safety-evidence burden | Little dependence on missing safety, allergenicity, shelf-life and toxicology evidence | §4 | 0.05 | 0.15 | 0.10 | 0.12 |
| ENV Environmental-claim robustness | Value proposition survives contested life-cycle evidence | §5 | 0.05 | 0.05 | 0.25 | 0.06 |
| MKT Demand and social-licence resilience | Insulated from purity-based rejection, parity dependence and hybrid-labelling distrust | §8–§10 | 0.15 | 0.10 | 0.15 | 0.18 |
| CAPI Capital lightness | Low capital intensity and scale-up risk | §2.4, §7 | 0.13 | 0.20 | 0.10 | 0.10 |
| MOAT Defensibility | Strong IP, switching costs and value-chain position | §1.1, §7 | 0.20 | 0.08 | 0.10 | 0.12 |
Table 3.
Modal criterion scores (1 = worst, 5 = best). All entries are tag A; bands and one-line rationales are in the Supplementary Materials.
Table 3.
Modal criterion scores (1 = worst, 5 = best). All entries are tag A; bands and one-line rationales are in the Supplementary Materials.
| ID | TECH | ECON | REG | SAFE | ENV | MKT | CAPI | MOAT |
|---|---|---|---|---|---|---|---|---|
| A1 | 1.5 | 1.5 | 2.0 | 1.5 | 2.0 | 2.0 | 1.0 | 2.5 |
| A2 | 3.0 | 3.0 | 3.0 | 2.5 | 2.5 | 2.5 | 2.5 | 2.5 |
| A3 | 3.0 | 4.5 | 4.0 | 3.0 | 3.5 | 3.5 | 3.5 | 4.0 |
| A4 | 3.0 | 3.5 | 4.0 | 3.5 | 3.0 | 3.5 | 3.0 | 3.0 |
| A5 | 2.0 | 3.0 | 3.5 | 2.5 | 3.0 | 3.0 | 3.0 | 3.5 |
| A6 | 2.5 | 3.5 | 2.5 | 2.5 | 3.0 | 3.0 | 4.0 | 4.0 |
| A7 | 2.5 | 3.0 | 2.5 | 2.5 | 3.0 | 3.0 | 2.0 | 3.0 |
| A8 | 3.0 | 3.0 | 4.0 | 3.5 | 2.5 | 3.0 | 3.0 | 2.5 |
| A9 | 3.5 | 2.5 | 4.0 | 4.0 | 3.5 | 4.0 | 4.0 | 3.0 |
Table 4.
Principal model parameters and provenance tags. M, anchored in the preliminary literature review; A, analyst assumption. Archetype-specific stage costs, durations and success probabilities are summarized in Table 1 and listed in full in the Supplementary Materials.
Table 4.
Principal model parameters and provenance tags. M, anchored in the preliminary literature review; A, analyst assumption. Archetype-specific stage costs, durations and success probabilities are summarized in Table 1 and listed in full in the Supplementary Materials.
| Parameter | Distribution | Tag |
|---|---|---|
| Global market in 2032, M2032 (USD million) | Lognormal, P5–P95 420–1,750 | M |
| Market growth after 2032 (per year) | Triangular 0.05–0.15–0.35 | A |
| Industry shake-out: probability; market retained; year | 0.25; triangular 0.2–0.4–0.7; uniform 2027–2031 | A |
| Medium price today, Pm0 (USD L⁻¹): conservative / baseline / optimistic | 3–12–60 / 1–5–30 / 0.3–1.5–8 | A |
| Wet cell density today, X0 (g L⁻¹) | 3–12–40 / 5–20–60 / 10–40–100 | A |
| Annual fall in medium price, d | 0.02–0.06–0.12 / 0.05–0.10–0.20 / 0.10–0.18–0.30 | A |
| Annual rise in density, g | 0–0.04–0.10 / 0.02–0.08–0.18 / 0.05–0.14–0.25 | A |
| Performance retained at scale, φ | 0.3–0.55–0.85 / 0.4–0.7–0.95 / 0.6–0.85–1.0 | A |
| Medium share of production cost, smed | Triangular 0.55–0.75–0.95 | M |
| Medium recycling r; harvest yield η; density ceiling Xmax (g L⁻¹) | 0–0.2–0.6; 0.85–0.92–0.98; 150–250–350 | A |
| Plant-matrix cost; forming cost (USD kg⁻¹) | 2–4–8; 1–2.5–5 | A |
| Mark-up m; maximum premium πmax | 0.15–0.25–0.40; 1.5–2.5–4 | A |
| Conventional price (USD kg⁻¹): beef; seafood; blended; pet food | 6–9–14; 8–14–25; 5–8–13; 3–6–12 | A |
| Uptake multiplier a(ρ) | Anchors (0.8, 1.55), (1.0, 1.27), (2.0, 1.00), (4.0, 0.40) | M for the first two, A otherwise |
| Ramp-up to full volume (years); tax on positive EBITDA | 3–4–6; 20% | A |
| Exit multiple at horizon: EV/EBITDA; EV/revenue | 4–6–10; 0.5–1.5–3 | A |
| Salvage value on abandonment; abandonment rule | 10% of capital spent; after 3 consecutive loss-making years | A |
Table 5.
Jurisdiction parameters. Review times and access factors are triangular (minimum–mode–maximum). Review-time ranges for the United States, European Union and Singapore are taken from the preliminary review; all approval probabilities, market weights and access factors are tag A. The United States access factor reflects state-level bans covering about 21% of the population (analyst calculation).
Table 5.
Jurisdiction parameters. Review times and access factors are triangular (minimum–mode–maximum). Review-time ranges for the United States, European Union and Singapore are taken from the preliminary review; all approval probabilities, market weights and access factors are tag A. The United States access factor reflects state-level bans covering about 21% of the population (analyst calculation).
| Jurisdiction | Market weight w | Approval probability p | Review time T (years) | Access factor α | Timeline tag |
|---|---|---|---|---|---|
| United States | 0.38 | 0.80 | 1.0–1.25–1.5 | 0.55–0.79–0.85 | M |
| European Union | 0.28 | 0.45 | 2.5–3.0–4.0 | 0.40–0.65–0.85 | M |
| China | 0.18 | 0.25 | 3–5–8 | 0.6–0.8–1.0 | A |
| United Kingdom | 0.06 | 0.55 | 1.5–2.5–3.5 | 0.85–0.95–1.0 | A |
| Australia / New Zealand | 0.04 | 0.60 | 1.5–2.5–3.5 | 0.85–0.95–1.0 | A |
| Singapore | 0.03 | 0.85 | 1.5–1.75–2.0 | 0.90–0.97–1.0 | M |
| Israel | 0.03 | 0.75 | 1–2–3 | 0.85–0.95–1.0 | A |
Table 7.
Baseline valuation (USD million, 12% discount rate, 20,000 draws). P5 and P95 are the 5th and 95th percentiles of NPV.
Table 7.
Baseline valuation (USD million, 12% discount rate, 20,000 draws). P5 and P95 are the 5th and 95th percentiles of NPV.
| Archetype | eNPV | P5 | Median | P95 | P(NPV > 0), % | P(reach market), % | P(operating at horizon), % | Profitability index |
|---|---|---|---|---|---|---|---|---|
| A1 Whole-cut producer | −93.4 | −273.7 | −69.9 | −20.8 | 0.6 | 18.4 | 15.1 | 0.06 |
| A2 Hybrid producer | −49.9 | −174.0 | −48.3 | 64.5 | 7.8 | 32.9 | 22.6 | 0.41 |
| A3 Media / growth factors | −5.1 | −64.9 | −10.3 | 105.8 | 14.3 | 26.9 | 26.0 | 0.85 |
| A4 Bioreactors / process | −33.9 | −79.4 | −33.8 | −8.1 | 3.3 | 31.4 | 24.9 | 0.22 |
| A5 Scaffolds / bioprinting | −27.9 | −68.5 | −24.6 | −6.9 | 1.3 | 22.9 | 16.7 | 0.13 |
| A6 Cell lines / IP | −11.4 | −28.8 | −9.9 | 9.5 | 7.1 | 29.0 | 24.3 | 0.34 |
| A7 Seafood producer | −74.6 | −205.2 | −61.7 | −16.5 | 1.5 | 20.6 | 17.2 | 0.12 |
| A8 Pet food | −46.2 | −151.7 | −44.5 | 39.3 | 7.0 | 30.7 | 18.9 | 0.35 |
| A9 Analytics / QA | −8.7 | −27.5 | −9.1 | 12.8 | 9.5 | 41.9 | 30.5 | 0.44 |
Table 8.
Gate economics at baseline (USD million). Stage-1 outlay is the discounted expected cost of Stage 1; P(S1), P(S23 | S1) and P(market | S23) are the conditional probabilities of passing each gate; V1, V2 and V3 are the expected values to go after the first, second and third gates.
Table 8.
Gate economics at baseline (USD million). Stage-1 outlay is the discounted expected cost of Stage 1; P(S1), P(S23 | S1) and P(market | S23) are the conditional probabilities of passing each gate; V1, V2 and V3 are the expected values to go after the first, second and third gates.
| Archetype | Stage-1 outlay | P(S1), % | P(S23 | S1), % | P(market | S23), % | V1 | V2 | V3 | eNPV |
|---|---|---|---|---|---|---|---|---|
| A1 | 26.5 | 55.3 | 47.5 | 70.1 | −120.8 | −136.2 | −1.1 | −93.4 |
| A2 | 15.0 | 70.2 | 62.1 | 75.4 | −49.6 | −20.7 | 83.5 | −49.9 |
| A3 | 8.4 | 59.5 | 64.1 | 70.6 | 5.6 | 37.1 | 101.9 | −5.1 |
| A4 | 11.9 | 65.1 | 64.7 | 74.6 | −33.8 | −11.9 | 24.8 | −33.9 |
| A5 | 9.8 | 55.3 | 59.3 | 69.8 | −32.7 | −19.2 | 12.3 | −27.9 |
| A6 | 6.6 | 60.3 | 64.0 | 75.1 | −7.9 | 6.7 | 17.2 | −11.4 |
| A7 | 22.6 | 59.9 | 51.6 | 66.7 | −86.9 | −79.9 | 25.8 | −74.6 |
| A8 | 18.0 | 65.1 | 63.7 | 74.1 | −43.3 | −16.1 | 54.6 | −46.2 |
| A9 | 3.6 | 70.4 | 75.2 | 79.2 | −7.3 | −1.2 | 12.1 | −8.7 |
Table 9.
Expected NPV (USD million) and probability of reaching market by regulatory strategy, baseline technology.
Table 9.
Expected NPV (USD million) and probability of reaching market by regulatory strategy, baseline technology.
| Strategy | A1 eNPV | A1 P(market), % | A2 eNPV | A2 P(market), % | A3 eNPV | A3 P(market), % |
|---|---|---|---|---|---|---|
| United States | −89.3 | 15.6 | −56.0 | 27.3 | −10.8 | 24.3 |
| European Union | −74.4 | 8.6 | −51.3 | 17.1 | −14.0 | 19.6 |
| Singapore | −93.2 | 16.0 | −72.3 | 28.9 | −15.6 | 24.7 |
| US + Singapore | −94.7 | 18.2 | −58.8 | 31.8 | −10.1 | 26.4 |
| US + EU | −89.5 | 16.4 | −50.9 | 29.1 | −8.0 | 25.5 |
| US + EU + Singapore + UK | −93.4 | 18.5 | −50.4 | 32.5 | −6.4 | 26.6 |
| All seven | −93.3 | 19.0 | −44.5 | 33.1 | −3.3 | 26.7 |
Table 10.
Expected NPV (USD million) under three technology trajectories and the multiple of the 2032 market forecast range at which eNPV reaches zero.
Table 10.
Expected NPV (USD million) under three technology trajectories and the multiple of the 2032 market forecast range at which eNPV reaches zero.
| Archetype | eNPV, conservative | eNPV, baseline | eNPV, optimistic | Break-even market multiplier, baseline technology | Break-even market multiplier, optimistic technology |
|---|---|---|---|---|---|
| A1 | −101.5 | −93.4 | −68.4 | 15.6 | 2.6 |
| A2 | −91.8 | −49.9 | −19.1 | 2.2 | 1.2 |
| A3 | −11.6 | −5.1 | 3.1 | 1.2 | 1.0 |
| A4 | −36.3 | −33.9 | −30.8 | 3.9 | 2.9 |
| A5 | −29.1 | −27.9 | −26.4 | 5.3 | 4.3 |
| A6 | −12.9 | −11.4 | −9.3 | 2.3 | 1.9 |
| A7 | −88.0 | −74.6 | −53.6 | 8.0 | 2.5 |
| A8 | −76.8 | −46.2 | −13.9 | 3.0 | 1.2 |
| A9 | −10.5 | −8.7 | −6.2 | 1.9 | 1.4 |
Disclaimer/Publisher’s Note: The statements, opinions and data contained in all publications are solely those of the individual author(s) and contributor(s) and not of MDPI and/or the editor(s). MDPI and/or the editor(s) disclaim responsibility for any injury to people or property resulting from any ideas, methods, instructions or products referred to in the content. |
© 2026 by the authors. Licensee MDPI, Basel, Switzerland. This article is an open access article distributed under the terms and conditions of the Creative Commons Attribution (CC BY) license (http://creativecommons.org/licenses/by/4.0/).
Copyright: This open access article is published under a Creative Commons CC BY 4.0 license, which permit the free download, distribution, and reuse, provided that the author and preprint are cited in any reuse.