

Submitted:
18 October 2026
Posted:
20 October 2026
You are already at the latest version
Abstract
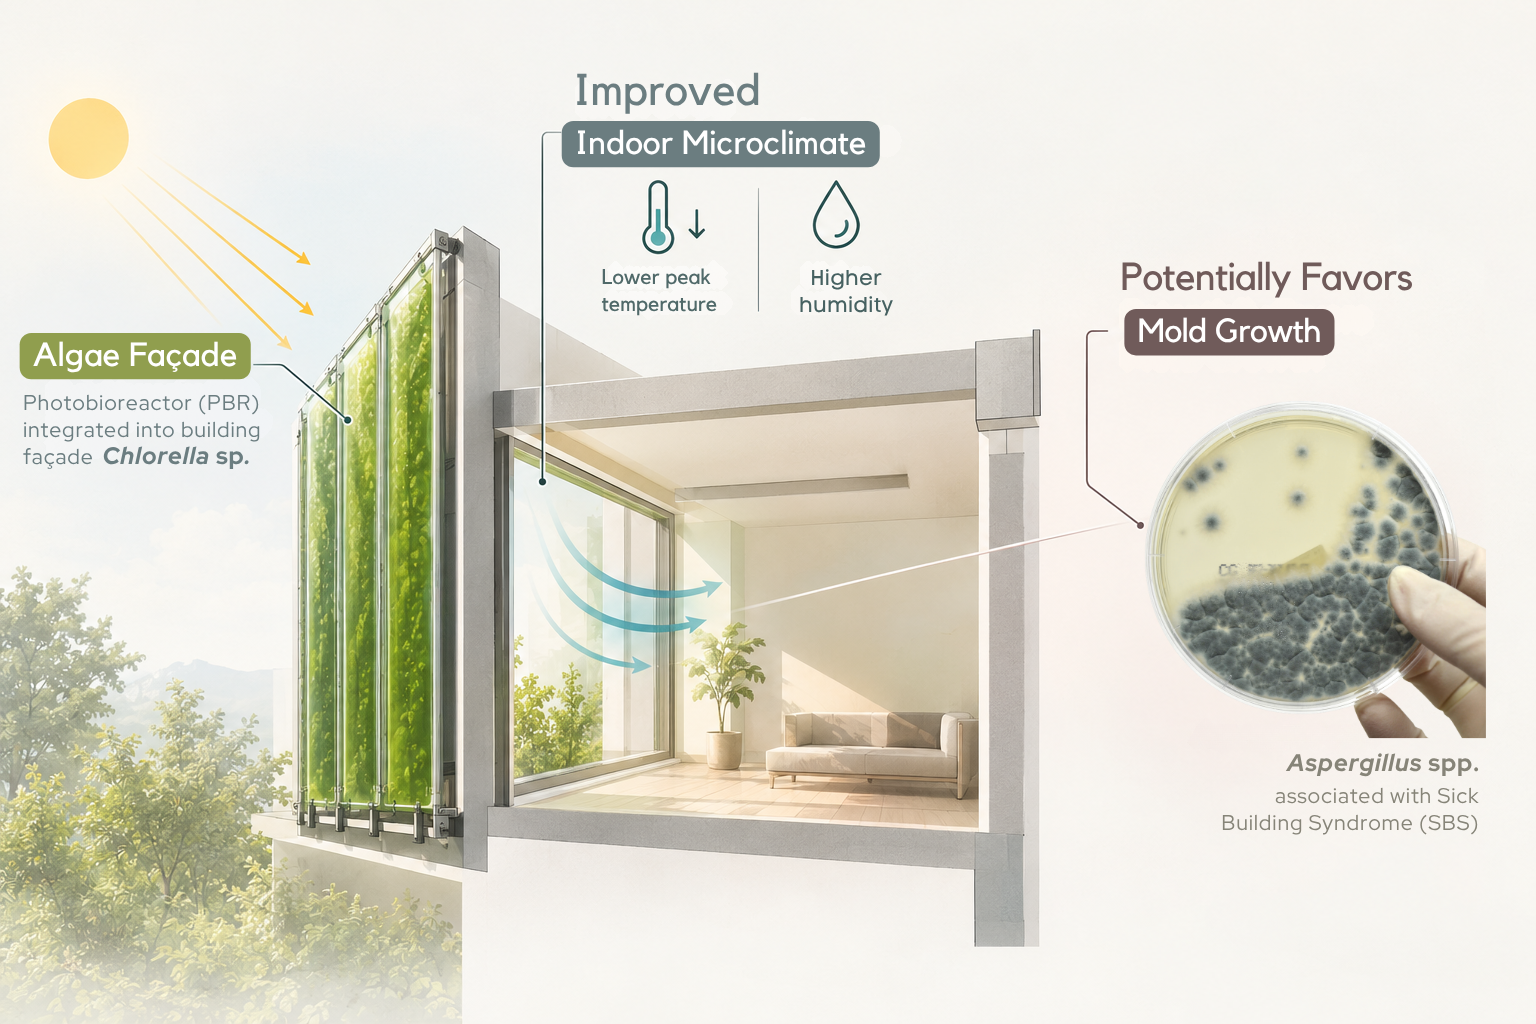
This research addresses concerns related to Sick Building Syndrome (SBS) and evolving strategies for managing hazardous biological agents in indoor environments, such as toxic fungi. This pilot scale-model study investigates the impact of a photobioreactor (PBR) algae façade on the microclimate and on the growth of Aspergillus niger and A. fumigatus. Glass simulation chambers were built without a PBR (control), with a PBR on one side (partial PBR) or with a U-shaped PBR surrounding the test space (PBR; 40 × 40 × 40 cm), with two chambers per treatment. Temperature and humidity were recorded every minute, and 15 plates of each fungus (five per treatment) were exposed for 8 days. The PBR did not change the mean temperature but reduced the daily maximum temperature by 5.4 °C (39.2 vs. 44.6 °C) and kept humidity ≥ 80% RH for 23.9 h day−1, compared with 17.4 h day−1 in the control chamber; the partial PBR gave intermediate values as expected. A. niger grew larger with increasing PBR coverage (control 6.0, partial PBR 9.0 and PBR 11.4 cm2; p for trend = 0.002), and A. fumigatus showed a similar but non-significant trend (6.8, 8.4 and 9.4 cm2; p for trend = 0.146). These results indicate that the algae façade can improve thermal comfort but may also favor mold growth, a crucial effect on building health that requires further study.
Keywords:
photobioreactor
; algae façade
; indoor microclimate
; thermal comfort
; sick building syndrome
; Aspergillus niger
; Aspergillus fumigatus
1. Introduction
In an effort to overcome the negative effects of unsustainable development practices and reduce their impact on an increasingly fragile natural environment, biological systems and processes are gaining increasing attention in building design. The integration of microalgae into building façades is one approach to these problems. A photobioreactor (PBR) is a bioreactor that uses sunlight as the energy source for photosynthesis to produce biomass. Integrating algae into a building provides many benefits, such as absorbing CO2 from the air, producing O2, which can improve air quality, and producing biomass (biofuel) for building energy [1,2].
Apart from addressing the energy issue, the algae façade also has a sun-shading effect and can effectively limit the heat gain of the building, so it may improve the quality of the indoor microclimate [2,3]. This effect occurs because microalgae cells absorb solar radiation for photosynthesis [4,5,6]. The ability of an algae façade to moderate high temperatures between the outdoor and indoor environment of devices equipped with an algae PBR was also reported by Martokusumo et al. [7]. Meanwhile, Pruvost et al. stated that an algae façade could provide a symbiosis for buildings to control room temperature in summer and winter [8].
On the other hand, microclimate problems frequently interfere with the comfort and health of the occupants and can lead to Sick Building Syndrome (SBS). SBS is commonly caused by poor temperature and humidity conditions and by the spores, mycotoxins and volatile compounds of toxic microorganisms such as fungi, bacteria and other pathogenic organisms [9,10]. Moreover, many studies have shown that the occurrence of microorganisms, especially mold, is related to the room microclimate [9,11,12].
One of the fungi commonly found in buildings is Aspergillus spp. [13]. This fungal genus is undesirable indoors because it produces mycotoxins such as aflatoxin B1, fumonisins, gliotoxin and ochratoxin A [10,13,14,15,16]. These mycotoxins are carried on fungal spores, which can become airborne even under normal ventilation, and can cause respiratory symptoms, allergies and asthma if inhaled [14,17]. In addition, this genus releases harmful microbial volatile organic compounds (MVOC) such as alcohols and terpenes [10]. A. fumigatus, in particular, is a thermotolerant opportunistic pathogen and the main cause of aspergillosis [18]. A. niger has been reported to produce the mycotoxins ochratoxin A and fumonisin B2 [13,14], and it is also frequently found on damp building materials indoors [13].
This study aims to measure the potential of algae façades in overcoming building health problems, especially the microclimate and the growth of Aspergillus niger and A. fumigatus, which often appear in buildings [13]. We hypothesized that the algae façade, by moderating the indoor microclimate, would reduce the growth of both species. To test whether any effect depends on the extent of the façade, a partial façade covering only one side of the test space was also included. Because a full-size building was not available, the study was carried out as a pilot study using scale-model (replica) chambers. The results of this study are expected to help stakeholders in solving energy and building health problems.
2. Materials and Methods
2.1. Algae Cultivation
Microalgae of the genus Chlorella are commonly used in algae façade technology due to their durability, fast growth and high oxygen production, as well as their carbon dioxide uptake [19,20,21,22]. In this research, Chlorella pyrenoidosa was used because its optimal growth temperature is close to the local climate. Han et al. showed that the optimal growth temperature for Chlorella pyrenoidosa is 30 °C, which is characterized by high biomass and lipid production [23].
In the experiment, the seed of Chlorella pyrenoidosa (1 L) was purchased from BettaFish City, Bogor, Indonesia. Then, the seed was cultured (for seven days) by adding 5 L of distilled water and 500 mL of fertilizers for nutrition. Fertilizer was made by diluting 30 g of bran, 10 mL of molasses, 18 mL of Effective Microorganism 1201179 (Persada, Jakarta, Indonesia), 4.30 g of urea 2801 (Pupuk Indonesia, Jakarta, Indonesia), and 30 g of NPK 2803 (Saprotan Utama, Semarang, Indonesia). Lastly, artificial light was added using a Philips TL LED 16 W, and an aquarium air pump AA-350 (AMARA) was used to avoid cell deposition [24].
2.2. Mold Samples
To test mold growth in the environment of the simulation chambers, a total of 30 mold samples were prepared: 15 samples of A. niger FNCC-6174 and 15 samples of A. fumigatus FNCC-6127. Both strains originated from the Food and Nutrition Culture Collection (FNCC), Universitas Gadjah Mada, Yogyakarta, Indonesia, and were obtained through a commercial distributor; species identity was confirmed from colony morphology. The original culture of each species was taken using a cork borer and placed onto fresh medium in a Petri dish containing 10 mL of Malt Extract Agar (MEA) 1.05398.0500 (Merck, Darmstadt, Germany). The medium was prepared by dissolving 48 g of MEA in 1000 mL of distilled water (4.8% w/v). Each inoculated Petri dish was then sealed and was ready to be tested in the chambers. Plate preparation and disposal were conducted under BSL-2 conditions at the Biology Department Laboratory, Universitas Syiah Kuala. The plates remained sealed throughout the outdoor exposure, and the cultures were autoclaved before disposal.
2.3. Simulation Chambers
The simulation chambers are scale models (replicas) of a building with an algae façade, not full-size buildings. Three chamber types were built from 5 mm glass, each with the same test space of 20 × 30 × 40 cm (width × depth × height; about 0.024 m3) for measuring the microclimate and mold growth (Figure 1a). In the PBR chamber (40 × 40 × 40 cm overall), the PBR column was formed in the shape of the letter “U” around the test space, 10 cm thick on both sides and at the back, and held about 30 L of Chlorella pyrenoidosa culture. In the partial PBR chamber (30 × 30 × 40 cm overall), a single 10 cm PBR column was placed on one side of the test space. Each PBR was equipped with an AA-1880 aerator as a stirrer. The control chamber had the same test space without a PBR. Two chambers of each type were built (Figure 1b).
The simulation was carried out in an open space around the laboratory of Sukma Bangsa Senior High School, Lhokseumawe, Aceh, Indonesia, which was quite far from residents’ settlements. To avoid extreme weather, the test site is protected by 6 × 4 m of agricultural shade net.
2.4. Experiment and Data Collection
The experiment was carried out on 10–18 April 2021 at Sukma Bangsa Senior High School of Lhokseumawe, Aceh, Indonesia (5°11′38.7″ N, 97°06′47.0″ E). Three treatments were compared, control, partial PBR and PBR, with two chambers per treatment (six chambers in total). The growth of A. niger and A. fumigatus was tested in all six chambers; five Petri dishes were placed in each chamber (two or three of each species), giving five plates of each species per treatment and 30 plates in total.
In this experiment, the PBR façade (none, partial or full) was the independent variable and the chamber microclimate was the dependent variable. For mold growth, the chamber microclimate in turn acted as an independent variable [16,25]. The controlled variables, such as the outdoor climate, the volume of agar and other materials, were kept the same for all chambers.
For the chamber microclimate, a USB data logger (BTH-81) was placed in the test space of one chamber of each treatment to record the temperature and humidity every 1 min (every 1 min 50 s during the first 33 h; Figure 1a). The logger records were downloaded daily and merged into one continuous record per chamber, were analyzed. To measure the light that penetrated through the PBR, the light intensity inside the control and PBR chambers and outdoors was measured daily with a digital lux meter (MT-30) at 08:00, 12:00 and 20:00; the readings at 12:00 are reported.
For algae measurements, the cell density (cells mL−1) of the two PBR chambers was determined daily from day 2 to day 11 using a hemocytometer (Improved Neubauer). Approximately 10 mL of algae sample from each PBR was diluted with distilled water to a dilution of 10−3 to 10−4, and the cell density was calculated as:
cell density = (number of cells × dilution factor)/number of small squares.
Lastly, to measure mold growth, each of the 30 plates was photographed daily together with a millimeter ruler from day 0 to day 8 of exposure. The colony area was measured from all pictures with a custom image-analysis script in Python (OpenCV 5.0). The Petri dish in each picture was detected automatically, and its diameter was calibrated against the ruler to convert pixels to centimeters. The colony edge was located along 72 radial lines from the center of the colony as the point where the color changed from colony to agar (CIELAB color difference ΔE < 15), and the colony area was calculated from these lines; the colony diameter was calculated as twice the mean length of the 72 lines. Satellite colonies that touched the main colony were excluded. The black spore area of A. niger was measured as the dark pixels inside the colony. The final colony size was the mean of days 6–8, and every result was checked visually.
2.5. Statistical Analysis
Non-parametric tests and linear mixed models were used to compare the treatments. For the microclimate, the daily values (n = 9 days) of the three treatments were compared with the Friedman test, followed by pairwise Wilcoxon signed-rank tests paired by day with Holm adjustment. The noon light intensity in the PBR and control chambers was compared with the Wilcoxon signed-rank test paired by day (n = 11 days). For mold growth, the plates inside one chamber are not independent, so the final colony area, colony diameter and black spore area were analyzed with a linear mixed model with treatment as a fixed effect and chamber as a random intercept; pairwise comparisons between treatments were Holm-adjusted. A linear trend across control → partial PBR → PBR was tested in the same model with treatment coded as 0, 1 and 2. All tests were performed in Python (SciPy and statsmodels) at α = 0.05.
3. Results and Discussion
3.1. Microclimate
The temperature and humidity of the chambers during the experiment are shown in Figure 2 and Table 1. The temperature in the PBR chamber was higher than in the control chamber during the night, from about 16:00 to 07:00 (by 2.9 °C on average), but lower from 10:00 to 16:00, when solar radiation was strongest (by 4.5 °C on average). The PBR therefore damped the daily peak: the mean daily maximum was 39.2 °C in the PBR chamber, 41.2 °C in the partial PBR chamber and 44.6 °C in the control chamber, and the control chamber exceeded 40 °C for 3.6 h day−1, compared with 1.1 and 0.6 h day−1 in the partial PBR and PBR chambers (Table 1; Figure 2c). As a result, the daily temperature range decreased from 19.1 °C (control) to 14.7 °C (partial PBR) and 11.8 °C (PBR), and the daily minimum increased from 25.5 to 27.4 °C, while the mean temperature did not differ between treatments (31.8–32.0 °C). The maximum and minimum temperatures and the temperature range differed significantly among all three treatments, so the effect increased with the PBR coverage. These results are similar to those of Martokusumo et al., who reported that an algae PBR could decrease the indoor temperature when the outside temperature was high [7]. Martokusumo et al. also indicated that an algae PBR could increase the temperature when the outside temperature was low by releasing heat absorbed from solar radiation during the daytime [7]. This pattern is related to the ability of the PBR to absorb solar radiation: Ismail and Al-Obaidi reported that a PBR panel could block up to 44.9% of solar radiation and 25% of solar transmission, which could reduce the heat gain of the building [3].
For humidity, from 08:00 to 16:00 the humidity in the control chamber was lower than in the PBR chamber by 18.5% RH on average, whereas from 18:00 to 08:00 it was higher by 4.9% RH (Figure 2b). Sedlbauer stated that humidity is strongly related to temperature, because excessive heat lowers the relative humidity of the air [16]. This relationship is also visible in Figure 2a,b: when the temperature was higher (08:00 to 16:00), the humidity was lower, and vice versa. Over the whole day, however, the PBR kept the humidity high: the mean daily minimum humidity was 77.0% RH in the PBR chamber, 74.3% RH in the partial PBR chamber and 54.0% RH in the control chamber, and the humidity was ≥ 80% RH for 23.9, 23.2 and 17.4 h day−1, respectively (Table 1; Figure 2c). The time with ≥ 90% RH (19.0, 15.2 and 14.8 h day−1) did not differ significantly among treatments. This buffering is also described by Pruvost et al. as the “symbiosis” provided by the algae façade, which can warm a building in winter by releasing heat and cool it in summer by preventing excessive heat gain [8].
3.2. Light Intensity and Algae Cell Density
As studied by Ismail and Al-Obaidi [3], the algae culture in a PBR can block excessive sun exposure and absorb heat and radiation from the sun. At 12:00, the median light intensity was 1.7 klx in the PBR chambers and 12.1 klx in the control chambers, so the PBR chambers received only about 14% of the light of the control chambers (p < 0.001; Figure 3a). Meanwhile, the algae cell density increased about three times during the experiment, from 48 × 104 cells mL−1 on day 2 to 139–149 × 104 cells mL−1 on days 10–11 (Figure 3b), indicating successful culture growth in the PBR. This ability of the algae PBR to protect a building from direct sun exposure is called the sun-shading effect [2]. Such shading can reduce the heat gain of buildings, providing natural cooling and improving thermal comfort [1,7]. However, long exposure of algae façades to strong sunlight can cause growth inhibition and cell damage [26]. According to Slegers [27], a north or south orientation is preferable at latitudes below 35° to avoid direct sun exposure.
3.3. Mold Growth
Contrary to our hypothesis, the growth of A. niger and A. fumigatus increased with PBR coverage: it was highest in the PBR chambers, intermediate in the partial PBR chambers and lowest in the control chambers (Figure 4). The difference appeared within the first two days: on day 2, the colony area of A. niger was 10.4 cm2 in the PBR chambers and 4.5 cm2 in the control chambers. After that, the colonies grew slowly in all chambers, so the difference remained until the end of the experiment. All A. niger samples showed black spores on top, which is characteristic of Aspergillus niger [13,28], while A. fumigatus formed blue-green colonies with a white margin. In all A. fumigatus samples, the spores spread inside the sealed Petri dish and formed small satellite colonies; only the main colony was measured.
The final colony area of A. niger was 11.35 ± 1.08 cm2 in the PBR chambers, 8.96 ± 1.97 cm2 in the partial PBR chambers and 5.98 ± 2.36 cm2 in the control chambers (Table 2; Figure 4d). The PBR and control chambers differed significantly, the partial PBR did not differ from either, and the linear trend across the three treatments was significant (p = 0.002); the colony diameter showed the same pattern (p for trend = 0.004). The black spore area of A. niger was also larger in the PBR chambers (3.99 ± 1.20 cm2) than in the control chambers (1.69 ± 1.27 cm2), although this difference was not significant when the chamber was considered (p = 0.082). For A. fumigatus, the final colony area was 9.37 ± 2.27 cm2 in the PBR chambers, 8.41 ± 2.95 cm2 in the partial PBR chambers and 6.83 ± 0.93 cm2 in the control chambers (Table 2; Figure 4e); the treatments did not differ significantly, and the trend was not significant (p = 0.146).
The morphological characteristics, colony area and spore production (Figure 4; Table 2) indicate that the mold samples in the PBR chambers experienced better conditions for growth and reproduction than those in the control chambers. In the PBR chambers, the A. niger colonies had a wide area of black spores surrounded by white mycelium, whereas in the control chambers the colonies were smaller, with a narrower black center. Temperature and humidity are essential factors affecting fungal growth and the production of spores and conidia [16,25]. In the fungal life cycle, spores germinate if the substrate provides sufficient moisture and nutrients. After germination, hyphae (fungal filaments) are formed and continue to grow to form lateral branches. With sufficient humidity, the hyphae thicken and form a mycelium, at which stage the fungus metabolizes and retains sufficient moisture to sustain growth [25].
Because the Petri dishes were sealed, the agar surface was exposed to the chamber temperature and light, but its humidity stayed close to saturation in all chambers. Therefore, the difference in growth most likely came from temperature and light rather than from the chamber humidity. In the control chambers, the temperature was above 40 °C for 3.6 h day−1 and reached 44.6 °C on average, which is higher than the optimum temperature for A. niger (30–37 °C) [29], whereas the PBR kept the chamber in a narrower and more favorable range. The partial PBR, which reduced the time above 40 °C to 1.1 h day−1, gave intermediate growth, which supports the role of the daily temperature peak. A. fumigatus is thermotolerant [18], which is consistent with its smaller and non-significant response. The PBR also reduced the light by about 86%, and light is known to regulate fungal development and secondary metabolism in Aspergillus [30]. In real buildings, where mold grows on surfaces that exchange moisture with the room air, the long periods of high humidity in the PBR chamber may become even more important [11,16]. Therefore, the algae façade may improve thermal comfort but also has a potential negative effect on building health, which should be considered in its design, for example through ventilation and moisture control.
In summary, the maximum and minimum temperatures, the temperature range, the mean and maximum humidity and the time with ≥ 80% RH differed significantly among all three treatments; the minimum humidity was lower and the time above 40 °C was longer in the control chambers than in both PBR treatments; and the mean temperature and the time with ≥ 90% RH did not differ (Table 1). For mold growth, the colony area of A. niger differed significantly between the PBR and control chambers and increased linearly with PBR coverage (p for trend = 0.002), whereas the response of A. fumigatus was not significant at the 95% confidence level (p for trend = 0.146; Table 2).
This study has several limitations. First, it is a pilot study using scale-model chambers (0.024 m3 test space), not a real building. Second, two chambers per treatment limit the statistical power, and because the microclimate was recorded with one data logger per treatment, the microclimate comparison is based on days rather than on replicate chambers. Third, the mold grew on agar in sealed Petri dishes, not on building materials exposed to the room air. These limitations should be addressed in future studies that measure the microclimate and mold growth at the same time under controlled yet still closed to the real buildings condition
4. Conclusions
Several points can be drawn from this study. First, the algae façade has the potential to improve thermal comfort by lowering the daily maximum temperature and reducing the daily temperature fluctuation, although the mean temperature did not change; a partial façade gave intermediate effects. Second, the algae façade kept the humidity high throughout the day and, in this scale-model study, increased the growth of Aspergillus niger with increasing façade coverage, whereas the trend for A. fumigatus was not significant. Nevertheless, these results indicate a potential trade-off between the thermal benefits of renewable façade technologies and building health. Finally, since this experiment conducted in tropical region, the duration of rainy and hot seasons may affect these results, so testing in real buildings over one year and multiple seasons, is suggested.
Author Contributions
Conceptualization, M.H.A. and R.M.D.; methodology, M.H.A. and R.M.D.; software, M.H.A.; formal analysis, M.H.A.; investigation, M.H.A., R.M.D. and F.A.; writing—original draft preparation, M.H.A. and R.M.D.; writing—review and editing, F.A. and N.; supervision, F.A. and N. All authors have read and agreed to the published version of the manuscript.
Funding
This research was funded by Sukma Bangsa Senior High School of Lhokseumawe and by the mentoring fund of the National Youth Paper Award (LKIR) and the Regeneron International Science and Engineering Fair (ISEF).
Data Availability Statement
The original contributions presented in this study are included in the article. Further inquiries can be directed to the corresponding author.
Acknowledgments
This research won the National Youth Paper Award (LKIR) competition held by the Indonesian Institute of Sciences (now the National Research and Innovation Agency, BRIN) and participated in the Regeneron International Science and Engineering Fair (ISEF) 2021. The authors thank Sukma Bangsa Senior High School of Lhokseumawe for funding this research, and the Food and Microbiology Laboratory, Department of Chemical Engineering, Universitas Syiah Kuala, and Lhokseumawe State Polytechnic for facilitating the laboratory work. The authors have reviewed and edited the output and take full responsibility for the content of this publication.
Conflicts of Interest
The authors declare no conflicts of interest.
References
- Talaei, M.; Mahdavinejad, M.; Azari, R. Thermal and energy performance of algae bioreactive façades: A review. J. Build. Eng. 2020, 28, 101011. [Google Scholar] [CrossRef]
- Elrayies, G.M. Microalgae: Prospects for greener future buildings. Renew. Sustain. Energy Rev. 2018, 81, 1175–1191. [Google Scholar] [CrossRef]
- Ismail, M.A.; Al-Obaidi, K.M. Exploration in using algae to enhance indoor environment in the tropical climate. In Proceedings of the 2019 2nd Asia Conference on Energy and Environment Engineering (ACEEE), Hong Kong, 2019; pp. 25–29. [Google Scholar] [CrossRef]
- Decker, M.; Hahn, G.; Harris, L.M. Bio-enabled façade systems—Managing complexity of life through emergent technologies. In Proceedings of the 34th eCAADe Conference, Oulu, Finland, 2016; Volume 1, pp. 603–612. [Google Scholar]
- Flynn, E. (Experimenting with) living architecture: A practice perspective. Archit. Res. Q. 2016, 20, 20–28. [Google Scholar] [CrossRef]
- Kim, J.T.; Todorovic, M.S. Tuning control of buildings glazing’s transmittance dependence on the solar radiation wavelength to optimize daylighting and building’s energy efficiency. Energy Build. 2013, 63, 108–118. [Google Scholar] [CrossRef]
- Martokusumo, W.; Koerniawan, M.D.; Poerbo, H.W.; Ardiani, N.A.; Krisanti, S.H. Algae and building façade revisited: A study of façade system for infill design. J. Archit. Urban. 2017, 41, 296–304. [Google Scholar] [CrossRef]
- Pruvost, J.; Le Gouic, B.; Lepine, O.; Legrand, J.; Le Borgne, F. Microalgae culture in building-integrated photobioreactors: Biomass production modelling and energetic analysis. Chem. Eng. J. 2016, 284, 850–861. [Google Scholar] [CrossRef]
- Sahlberg, B.; Gunnbjörnsdottir, M.; Soon, A.; Jogi, R.; Gislason, T.; Wieslander, G.; Janson, C.; Norbäck, D. Airborne molds and bacteria, microbial volatile organic compounds (MVOC), plasticizers and formaldehyde in dwellings in three North European cities in relation to sick building syndrome (SBS). Sci. Total Environ. 2013, 444, 433–440. [Google Scholar] [CrossRef]
- Gao, P.; Korley, F.; Martin, J.; Chen, B.T. Determination of unique microbial volatile organic compounds produced by five Aspergillus species commonly found in problem buildings. AIHA J. 2002, 63, 135–140. [Google Scholar] [CrossRef]
- Kozdon, B.O. Microclimate conditions in rooms: Their impact on mold development in buildings. Energies 2020, 13, 4492. [Google Scholar] [CrossRef]
- Gravesen, S.; Nielsen, P.A.; Iversen, R.; Nielsen, K.F. Microfungal contamination of damp buildings—Examples of risk constructions and risk materials. Environ. Health Perspect. 1999, 107 (Suppl. 3), 505–508. [Google Scholar] [CrossRef]
- Nielsen, K.F. Mould Growth on Building Materials: Secondary Metabolites, Mycotoxins and Biomarkers. Ph.D. Thesis, Technical University of Denmark, Lyngby, Denmark, 2002. [Google Scholar]
- Frisvad, J.C.; Larsen, T.O.; Thrane, U.; Meijer, M.; Varga, J.; Samson, R.A.; Nielsen, K.F. Fumonisin and ochratoxin production in industrial Aspergillus niger strains. PLoS ONE 2011, 6, e23496. [Google Scholar] [CrossRef]
- Nieminen, S.M.; Kärki, R.; Auriola, S.; Toivola, M.; Laatsch, H.; Laatikainen, R.; Hyvärinen, A.; von Wright, A. Isolation and identification of Aspergillus fumigatus mycotoxins on growth medium and some building materials. Appl. Environ. Microbiol. 2002, 68, 4871–4875. [Google Scholar] [CrossRef]
- Sedlbauer, K. Prediction of Mould Fungus Formation on the Surface of and Inside Building Components. Ph.D. Thesis, University of Stuttgart, Fraunhofer Institute for Building Physics, Stuttgart, Germany, 2001. [Google Scholar]
- Blease, K.; Jakubzick, C.; Schuh, J.M.; Joshi, B.H.; Puri, R.K.; Hogaboam, C.M. IL-13 fusion cytotoxin ameliorates chronic fungal-induced allergic airway disease in mice. J. Immunol. 2001, 167, 6583–6592. [Google Scholar] [CrossRef]
- Kwon-Chung, K.J.; Sugui, J.A. Aspergillus fumigatus—What makes the species a ubiquitous human fungal pathogen? PLoS Pathog. 2013, 9, e1003743. [Google Scholar] [CrossRef]
- Arbye, S.; Arianti, R.F.; Pradana, Y.S.; Suyono, E.A.; Koerniawan, M.D.; Suwanti, L.T.; Siregar, U.T.; Budiman, A. The design of microalgae (Chlorella sp.) photobioreactor as a façade bus shelter building in Indonesia. AIP Conf. Proc. 2020, 2296, 020044. [Google Scholar] [CrossRef]
- Ferreira, C.B.; Padilla, L.C.; Sanchez, G.V.; Gonzalez-Delgado, A.; Barajas-Solano, A. Design of a microalgae bioreactive façade reactor for cultivation of Chlorella vulgaris. Contemp. Eng. Sci. 2017, 10, 1067–1074. [Google Scholar] [CrossRef]
- Pires, J.C.M.; Alvim-Ferraz, M.C.M.; Martins, F.G. Photobioreactor design for microalgae production through computational fluid dynamics: A review. Renew. Sustain. Energy Rev. 2017, 79, 248–254. [Google Scholar] [CrossRef]
- Mulyanto, A. Mikroalga (Chlorella sp.) sebagai agensia penambat gas karbon dioksida. J. Hidrosfir Indones. 2010, 5, 13–23. [Google Scholar]
- Han, F.; Wang, W.; Li, Y.; Shen, G.; Wan, M.; Wang, J. Changes of biomass, lipid content and fatty acids composition under a light–dark cyclic culture of Chlorella pyrenoidosa in response to different temperature. Bioresour. Technol. 2013, 132, 182–189. [Google Scholar] [CrossRef]
- Poerbo, H.W.; Martokusumo, W.; Koerniawan, M.D.; Ardiani, N.A.; Krisanti, S.H. Algae façade as green building method: Application of algae as a method to meet the green building regulation. IOP Conf. Ser. Earth Environ. Sci. 2017, 99, 012012. [Google Scholar] [CrossRef]
- Moon, H.J. Assessing Mold Risks in Buildings under Uncertainty. Ph.D. Thesis, Georgia Institute of Technology, Atlanta, GA, USA, 2005. [Google Scholar]
- Masojídek, J.; Papáček, Š.; Sergejevová, M.; Jirka, V.; Červený, J.; Kunc, J.; Korečko, J.; Verbovikova, O.; Kopecký, J.; Štys, D.; et al. A closed solar photobioreactor for cultivation of microalgae under supra-high irradiance: Basic design and performance. J. Appl. Phycol. 2003, 15, 239–248. [Google Scholar] [CrossRef]
- Slegers, P.M. Scenario Studies for Algae Production. Ph.D. Thesis, Wageningen University, Wageningen, The Netherlands, 2014. [Google Scholar]
- Nielsen, K.F.; Mogensen, J.M.; Johansen, M.; Larsen, T.O.; Frisvad, J.C. Review of secondary metabolites and mycotoxins from the Aspergillus niger group. Anal. Bioanal. Chem. 2009, 395, 1225–1242. [Google Scholar] [CrossRef]
- Alwakeel, S.S. Indoor fungal and bacterial contaminations on household environment in Riyadh, Saudi Arabia. Saudi J. Biol. Sci. 2008, 15, 113–119. [Google Scholar]
- Bayram, Ö.; Krappmann, S.; Ni, M.; Bok, J.W.; Helmstaedt, K.; Valerius, O.; Braus-Stromeyer, S.; Kwon, N.-J.; Keller, N.P.; Yu, J.-H.; et al. VelB/VeA/LaeA complex coordinates light signal with fungal development and secondary metabolism. Science 2008, 320, 1504–1506. [Google Scholar] [CrossRef]
Figure 1.
Simulation chambers used in this study. (a) Schematic of the control chamber (no PBR), the partial PBR chamber (PBR on one side) and the PBR chamber (U-shaped PBR surrounding the test space), each with a USB data logger and five Petri dishes in the test space. (b) Control, partial PBR and PBR chambers at the test site under the shade net.
Figure 1.
Simulation chambers used in this study. (a) Schematic of the control chamber (no PBR), the partial PBR chamber (PBR on one side) and the PBR chamber (U-shaped PBR surrounding the test space), each with a USB data logger and five Petri dishes in the test space. (b) Control, partial PBR and PBR chambers at the test site under the shade net.
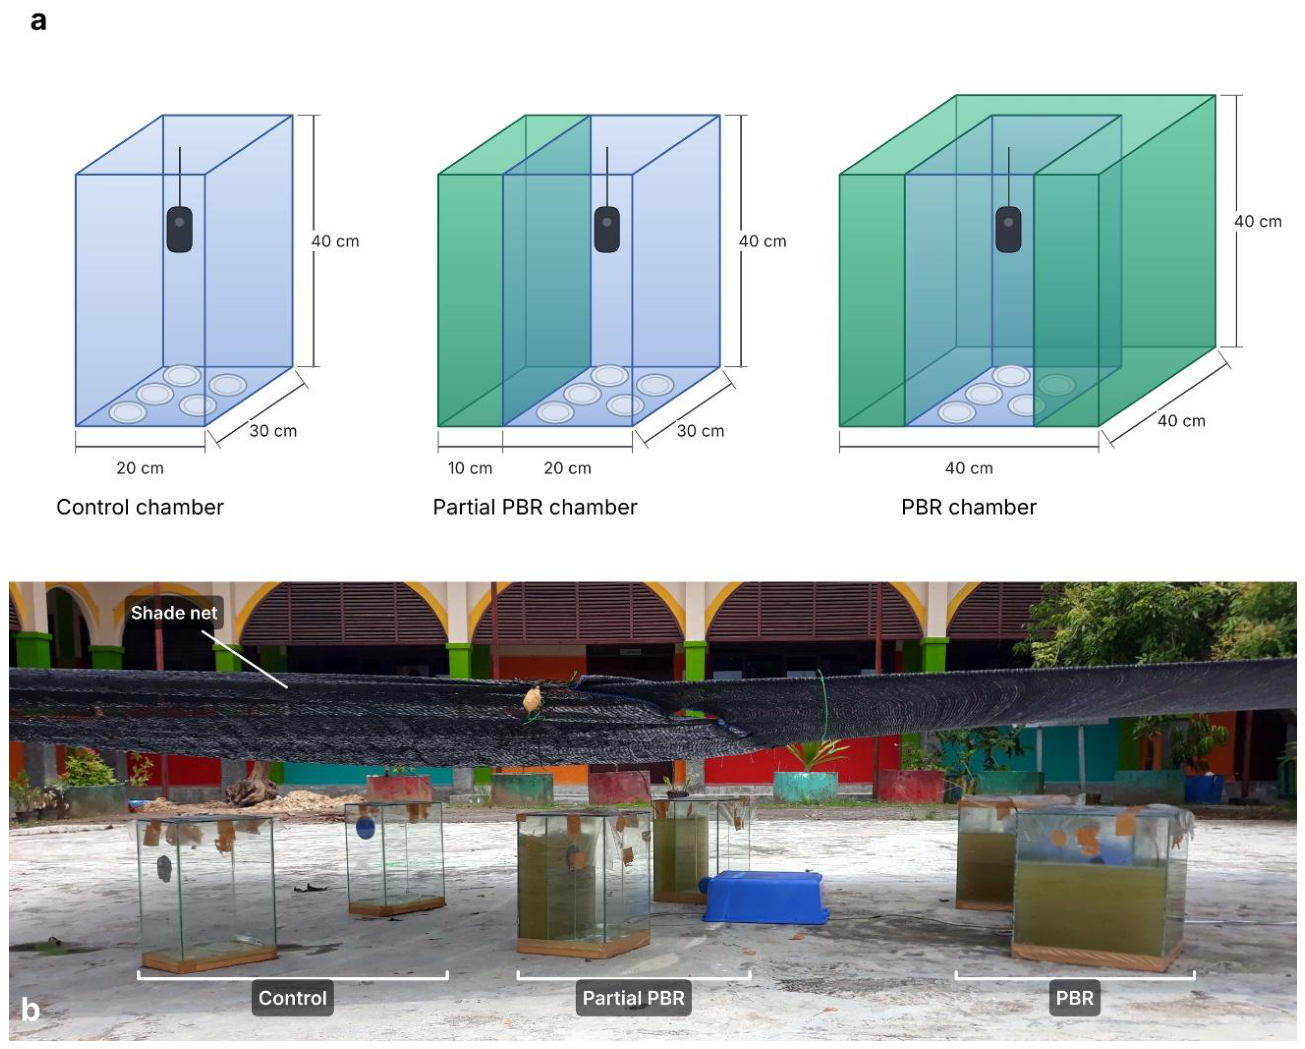
Figure 2.
Temperature (°C) and humidity (% RH) in the control (light blue), partial PBR (medium blue, dashed) and PBR (dark blue) chambers: (a) temperature and (b) humidity by time of day (mean ± SD of 8 days, shown as shaded bands); (c) time per day with humidity ≥ 80% RH, ≥ 90% RH and temperature above 40 °C.
Figure 2.
Temperature (°C) and humidity (% RH) in the control (light blue), partial PBR (medium blue, dashed) and PBR (dark blue) chambers: (a) temperature and (b) humidity by time of day (mean ± SD of 8 days, shown as shaded bands); (c) time per day with humidity ≥ 80% RH, ≥ 90% RH and temperature above 40 °C.
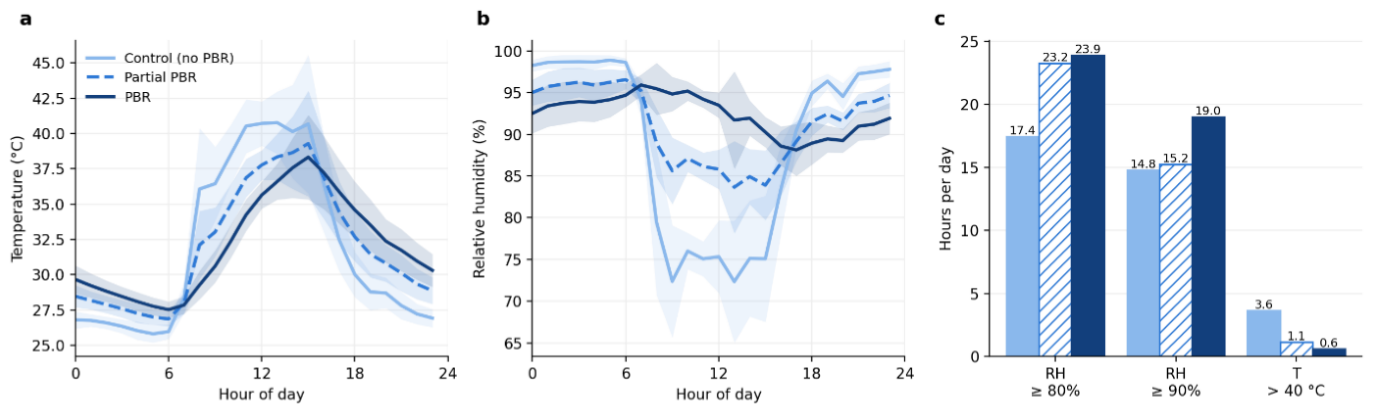
Figure 3.
(a) Light intensity at 12:00 outdoors and inside the control and PBR chambers (points, individual days and chambers; bars, medians). (b) Algae cell density in the two PBR chambers increased throughout the experiment, indicating successful culture growth in the photobioreactor.
Figure 3.
(a) Light intensity at 12:00 outdoors and inside the control and PBR chambers (points, individual days and chambers; bars, medians). (b) Algae cell density in the two PBR chambers increased throughout the experiment, indicating successful culture growth in the photobioreactor.
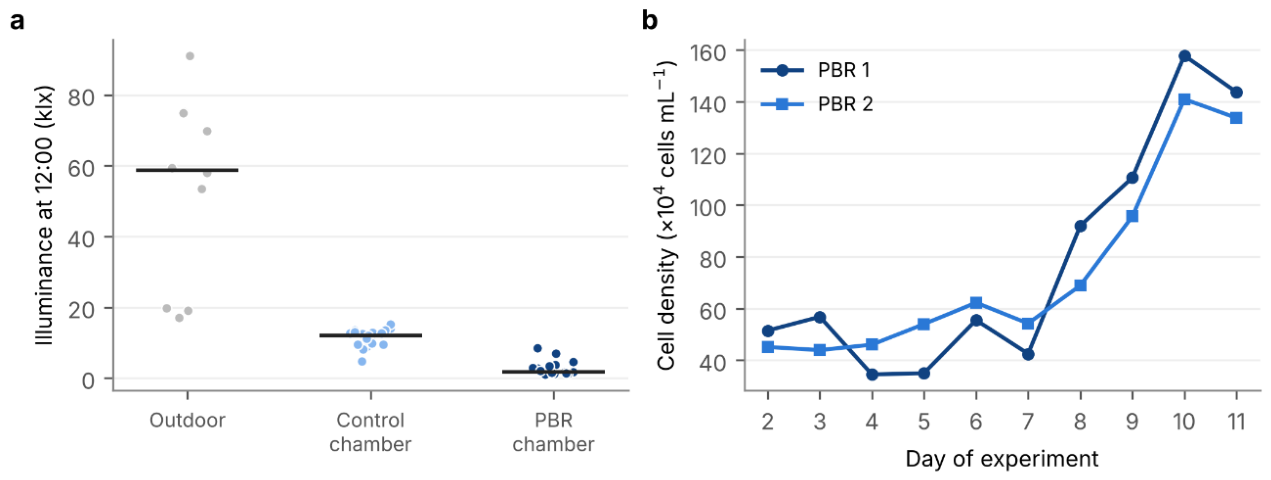
Figure 4.
Growth of Aspergillus niger and A. fumigatus in the control, partial PBR and PBR chambers. (a) Example plates on day 8, selected to illustrate the difference between treatments: A. niger N2 (PBR; final colony area 12.7 cm2), N15 (partial PBR; 8.3 cm2) and N5 (control; 4.0 cm2); A. fumigatus F15 (PBR; 12.3 cm2), F9 (partial PBR; 10.0 cm2) and F6 (control; 5.8 cm2). (b,c) Colony area of A. niger (b) and A. fumigatus (c) over 8 days of exposure (mean ± SE of five plates per treatment). (d,e) Final colony area (mean of days 6–8) of each plate of A. niger (d) and A. fumigatus (e); bars, treatment means.
Figure 4.
Growth of Aspergillus niger and A. fumigatus in the control, partial PBR and PBR chambers. (a) Example plates on day 8, selected to illustrate the difference between treatments: A. niger N2 (PBR; final colony area 12.7 cm2), N15 (partial PBR; 8.3 cm2) and N5 (control; 4.0 cm2); A. fumigatus F15 (PBR; 12.3 cm2), F9 (partial PBR; 10.0 cm2) and F6 (control; 5.8 cm2). (b,c) Colony area of A. niger (b) and A. fumigatus (c) over 8 days of exposure (mean ± SE of five plates per treatment). (d,e) Final colony area (mean of days 6–8) of each plate of A. niger (d) and A. fumigatus (e); bars, treatment means.
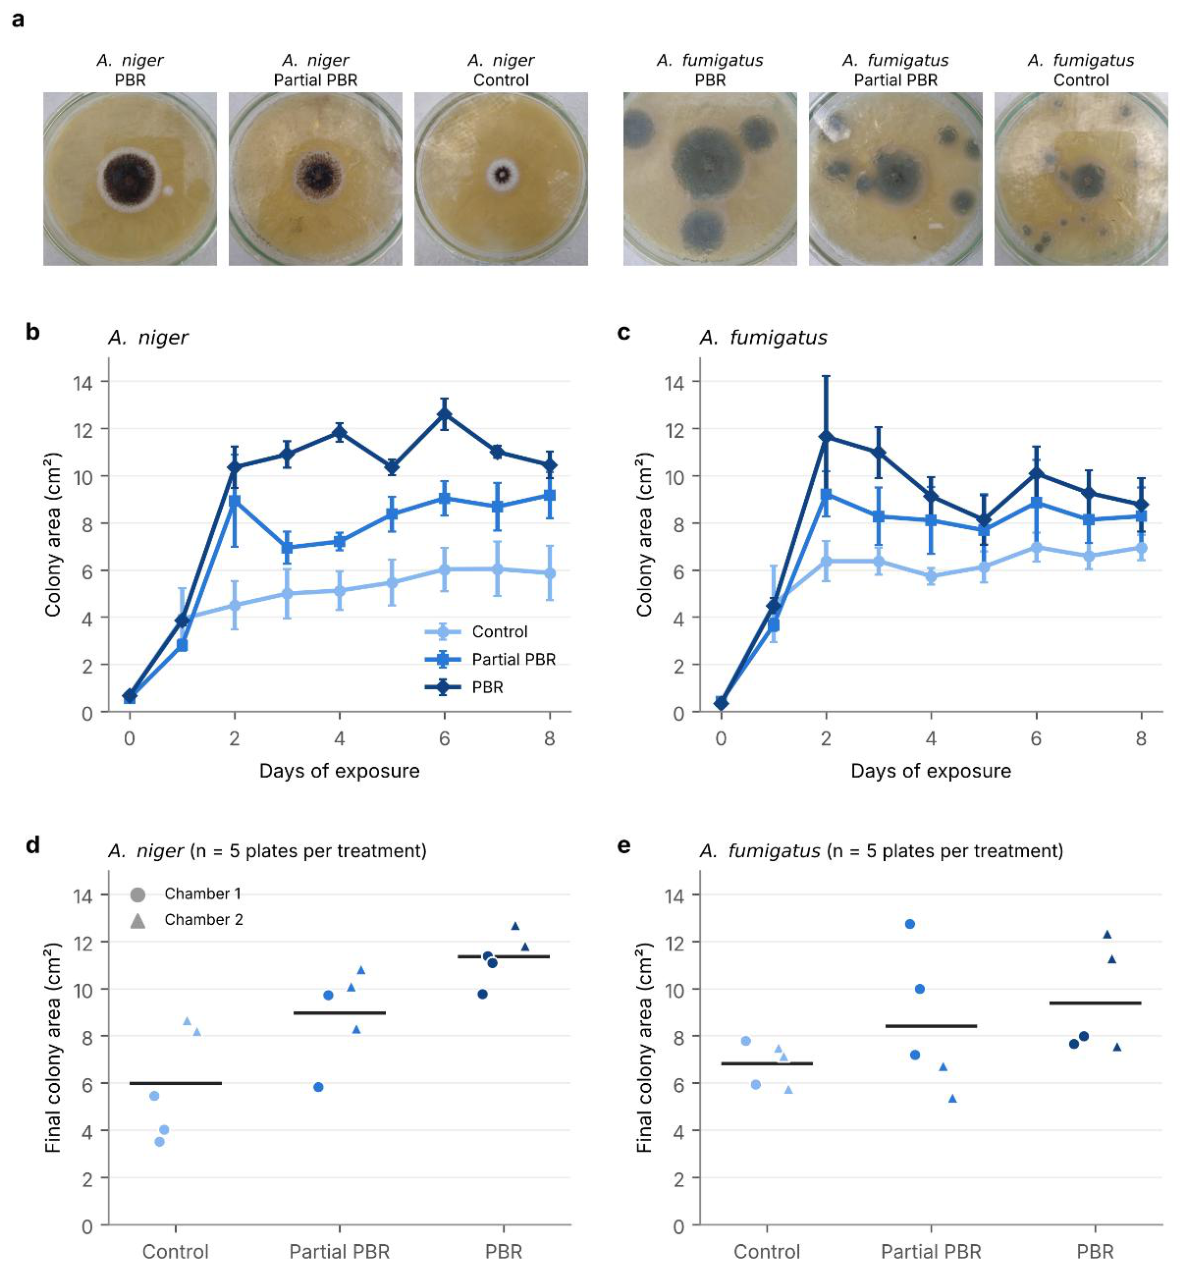

Table 1.
Daily microclimate in the control, partial PBR and PBR chambers. Within a row, values sharing a superscript letter do not differ significantly (Friedman test followed by pairwise Wilcoxon signed-rank tests paired by day, Holm-adjusted, α = 0.05); letters are assigned in descending order of the mean. Hours per day were computed from 1-min logger readings; time rows show means only.
Table 1.
Daily microclimate in the control, partial PBR and PBR chambers. Within a row, values sharing a superscript letter do not differ significantly (Friedman test followed by pairwise Wilcoxon signed-rank tests paired by day, Holm-adjusted, α = 0.05); letters are assigned in descending order of the mean. Hours per day were computed from 1-min logger readings; time rows show means only.
| Daily value | Control | Partial PBR | PBR |
|---|---|---|---|
| Mean temperature (°C) | 31.8 ± 1.0 ᵃ | 31.9 ± 0.9 ᵃ | 32.0 ± 0.8 ᵃ |
| Maximum temperature (°C) | 44.6 ± 3.7 ᵃ | 41.2 ± 3.3 ᵇ | 39.2 ± 2.8 ᶜ |
| Minimum temperature (°C) | 25.5 ± 0.4 ᶜ | 26.5 ± 0.5 ᵇ | 27.4 ± 0.5 ᵃ |
| Temperature range (°C) | 19.1 ± 3.8 ᵃ | 14.7 ± 3.5 ᵇ | 11.8 ± 3.0 ᶜ |
| Mean humidity (% RH) | 89.1 ± 1.4 ᶜ | 91.1 ± 1.3 ᵇ | 92.4 ± 1.3 ᵃ |
| Minimum humidity (% RH) | 54.0 ± 5.5 ᵇ | 74.3 ± 5.2 ᵃ | 77.0 ± 7.4 ᵃ |
| Maximum humidity (% RH) | 99.5 ± 0.4 ᵃ | 98.6 ± 1.1 ᵇ | 97.2 ± 1.2 ᶜ |
| Time with ≥ 80% RH (h day−1) | 17.4 ᶜ | 23.2 ᵇ | 23.9 ᵃ |
| Time with ≥ 90% RH (h day⁻¹) | 14.8 ᵃ | 15.2 ᵃ | 19.0 ᵃ |
| Time above 40 °C (h day−1) | 3.6 ᵃ | 1.1 ᵇ | 0.6 ᵇ |
Table 2.
Final colony size (mean of days 6–8) of A. niger and A. fumigatus in the control, partial PBR and PBR chambers (mean ± SD, n = 5 plates per treatment). Within each row, values that share a letter do not differ significantly (linear mixed model with chamber as a random effect; pairwise comparisons with Holm correction, α = 0.05). p trend: linear trend across control → partial PBR → PBR.
Table 2.
Final colony size (mean of days 6–8) of A. niger and A. fumigatus in the control, partial PBR and PBR chambers (mean ± SD, n = 5 plates per treatment). Within each row, values that share a letter do not differ significantly (linear mixed model with chamber as a random effect; pairwise comparisons with Holm correction, α = 0.05). p trend: linear trend across control → partial PBR → PBR.
| Species and variable | Control | Partial PBR | PBR | p trend |
|---|---|---|---|---|
| A. niger, area (cm2) | 5.98 ± 2.36 ᵃ | 8.96 ± 1.97 ᵃᵇ | 11.35 ± 1.08 ᵇ | 0.002 |
| A. niger, diameter (cm) | 2.66 ± 0.52 ᵃ | 3.29 ± 0.38 ᵃᵇ | 3.72 ± 0.16 ᵇ | 0.004 |
| A. fumigatus, area (cm2) | 6.83 ± 0.93 ᵃ | 8.41 ± 2.95 ᵃ | 9.37 ± 2.27 ᵃ | 0.146 |
| A. fumigatus, diameter (cm) | 2.92 ± 0.22 ᵃ | 3.17 ± 0.54 ᵃ | 3.37 ± 0.39 ᵃ | 0.140 |
Disclaimer/Publisher’s Note: The statements, opinions and data contained in all publications are solely those of the individual author(s) and contributor(s) and not of MDPI and/or the editor(s). MDPI and/or the editor(s) disclaim responsibility for any injury to people or property resulting from any ideas, methods, instructions or products referred to in the content. |
© 2026 by the authors. Licensee MDPI, Basel, Switzerland. This article is an open access article distributed under the terms and conditions of the Creative Commons Attribution (CC BY) license.
Copyright: This open access article is published under a Creative Commons CC BY 4.0 license, which permit the free download, distribution, and reuse, provided that the author and preprint are cited in any reuse.