

Submitted:
19 October 2026
Posted:
20 October 2026
You are already at the latest version
Abstract
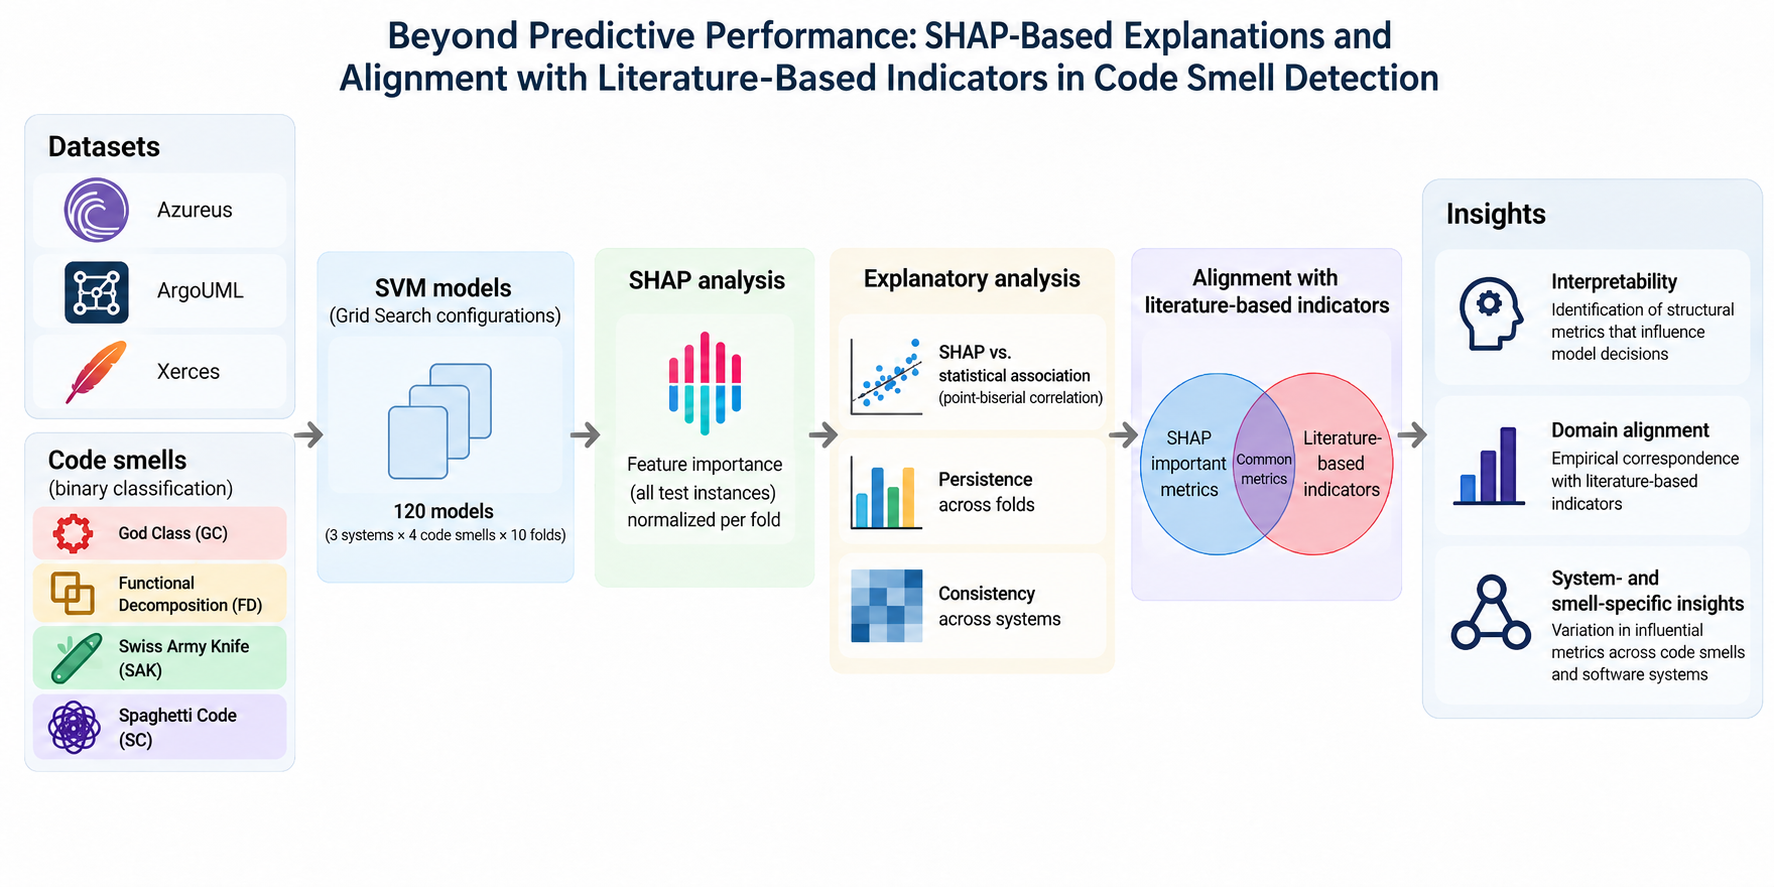
Machine learning-based code smell detection relies on structural metrics, but predictive performance alone does not establish whether the information used by classifiers corresponds to the characteristics reported in the literature. This study examines the explanatory behavior of Support Vector Machine (SVM) models by integrating SHAP-based feature importance, point-biserial associations, and literature-based code smell indicators. The analysis reconstructs 120 SVM models across three open-source Java systems and four code smells, using ten folds per system–smell combination. Feature importance, persistence across folds, and consistency across software systems are examined alongside SHAP–correlation concordance, indicator coverage, and directional compatibility. The results show that influential metrics vary across code smells and software systems, while high average importance does not necessarily imply persistence across folds. Agreement between SHAP-based rankings and statistical associations is partial. Indicator coverage and directional compatibility provide distinct forms of evidence, and some literature-based operationalizations cannot be evaluated using the available metrics. A complementary sensitivity analysis shows high agreement among repeated SHAP realizations under the tested conditions. These findings indicate that explanatory relevance depends on the experimental context and that model contributions, statistical associations, and literature-based indicators provide complementary evidence for interpreting code smell predictions.
Keywords:
code smell detection
; explainable artificial intelligence
; SHAP
; software metrics
; machine learning
; support vector machines
; model interpretability
; software quality
1. Introduction
A code smell is an observable symptom in source code that may indicate a deeper structural problem [1]. Although it does not necessarily correspond to a software fault, the presence of code smells has been associated with increased defect proneness and reduced maintainability [2]. Code smells may persist during software evolution when they are not removed through refactoring [3]. These effects motivate the development of automated techniques capable of identifying code smells consistently and at scale.
Automated detection requires software entities to be represented through measurable information. Software metrics are widely used for this purpose because they characterize structural properties such as size, complexity, coupling, cohesion, and inheritance [4]. However, code smell operationalization is not uniform across studies, as detection approaches may rely on different metrics and threshold values [5]. This variability is further affected by subjectivity in smell interpretation and limited agreement among detectors [6]. Consequently, the metric space available to a detector may not fully capture the characteristics associated with a particular smell.
Machine learning has extended metric-based detection by learning relationships between software characteristics and smell labels from labeled examples rather than relying exclusively on predefined rules and thresholds [6,7]. Nevertheless, the resulting models remain constrained by the information encoded in their input variables. When the available metrics do not capture all the characteristics associated with a smell, a classifier may rely on alternative structural signals to discriminate the observed labels. Thus, predictive performance alone does not reveal which structural properties actually support the model’s decisions or whether they correspond to those used to characterize the smell.
Explainable Artificial Intelligence (XAI) provides mechanisms for examining the information underlying predictive decisions. SHapley Additive exPlanations (SHAP) assigns feature-level contributions based on Shapley values, enabling model behavior to be examined at both local and aggregated levels [8]. Previous studies have applied explainability techniques to software quality tasks, including the analysis of code smell prioritization in relation to developers’ expectations [9,10] and the evaluation of explanation quality in automated issue classification [11]. However, identifying influential features does not establish whether they correspond to the structural indicators used to characterize a particular code smell.
Model-based importance and statistical association provide complementary perspectives. Point-biserial correlation characterizes the marginal association between a software metric and a binary smell label, whereas SHAP reflects the contribution of that metric within a multivariate decision function. Consequently, metrics with strong associations with the target are not necessarily those that contribute most strongly to model predictions. Moreover, neither perspective alone determines whether the information used by the model corresponds to the indicators through which the smell has been characterized in previous studies. The relationship among metric–label association, model explanation, and literature-based smell indicators therefore remains insufficiently characterized.
The aim of this study is to determine whether the structural metrics that support SVM-based code smell predictions provide explanatory evidence consistent with metric–label associations and with the indicators used to characterize the corresponding smells in the literature. Accordingly, the study addresses the following research questions:
- RQ1. Which structural metrics contribute most to SVM-based code smell predictions, and how persistent are these contributions across folds and systems?
- RQ2. To what extent do SHAP-based feature importance rankings agree with rankings derived from point-biserial associations?
- RQ3. To what extent do the structural metrics supporting SVM predictions align with the indicators and expected directions reported in the literature for each code smell?
The study contributes a fold- and system-level analysis of SVM explanations, a quantitative comparison between SHAP-based importance and metric–label association, and a literature-grounded assessment of the correspondence between influential metrics and reported code smell indicators. Together, these analyses provide empirical evidence for examining predictive effectiveness and conceptual correspondence as complementary dimensions of metric-based code smell detection.
The results show that statistical association, model-based importance, and correspondence with literature-based indicators provide related but non-equivalent evidence. The degree of agreement among these perspectives varies across code smells and software systems, indicating that strong predictive performance does not necessarily imply an equivalent degree of correspondence with the structural indicators reported in the literature.
2. Background and Related Work
2.1. Metric-Based Code Smell Detection and Operationalization
Software metrics provide a quantitative representation of source-code properties and have been widely used for automated code smell detection. Common measures include Weighted Methods per Class (WMC), Depth of Inheritance Tree (DIT), Number of Children (NOC), Coupling Between Objects (CBO), Response for a Class (RFC), Lack of Cohesion of Methods (LCOM), Lines of Code (LOC), cyclomatic complexity, and Number of Methods (NOM) [4]. These metrics capture structural dimensions related to size, complexity, inheritance, coupling, and cohesion. The range of metrics considered in the literature is nevertheless extensive; more than 290 different measures have been identified across code smell detection studies, although LOC, WMC, DIT, LCOM, NOC, cyclomatic complexity, and NOM are among the most frequently used [12].
Metric-based detection approaches operationalize code smell descriptions by expressing their symptoms through measurable source-code properties. Marinescu proposed detection rules based on combinations of metrics and conditions [13], while DECOR formalized code smell specifications by mapping higher-level symptoms to measurable properties and detection rules [14]. In these approaches, the detection decision generally depends on the combination of several characteristics rather than on a single metric.
The criteria used for this operationalization are not uniform across studies. Different approaches may employ different metrics, combinations, and threshold values for the same smell [5]. Thresholds may be adopted from previous studies or established empirically for the systems under analysis, while some tools rely on predefined criteria that cannot be adapted to a particular context [15]. Automated detectors such as iPlasma [16], JDeodorant [17], PMD [18], and DECOR [14] also differ in the properties and mechanisms used to identify smells. Comparative evaluations have consequently reported variations in precision, recall, and agreement among detectors applied to the same software systems [19].
This variability is particularly relevant when indicators reported in the literature are compared with the metrics available in a specific experimental setting. Metrics with different names may represent equivalent or closely related properties, whereas similarly named metrics may differ in their formal definition or measurement level. Correspondence should therefore be established from metric definitions and granularity rather than from terminology alone. More broadly, previous work on antipattern operationalization has emphasized that observable structural indicators provide approximations of the underlying design concepts rather than complete representations [20]. Consequently, when a property involved in a smell characterization is absent from the available metric space, its contribution cannot be evaluated directly.
2.2. Machine Learning for Code Smell Detection
Machine learning changes the mechanism through which metric information is converted into a detection decision. Rather than relying exclusively on predefined rules and thresholds, supervised approaches train classifiers from labeled examples to infer relationships between software characteristics and the presence of a smell [6]. Software metrics remain a common input representation, while the decision boundary is learned from the observed data.
A broad range of supervised algorithms has been evaluated for code smell detection. Comparative studies have considered Decision Trees, Random Forest, Naive Bayes, Support Vector Machines (SVM), Multilayer Perceptrons, and boosting-based methods [21,22]. Other investigations have extended these comparisons to larger classifier sets and ensemble configurations [23,24]. Systematic reviews likewise report considerable diversity in the algorithms, datasets, feature-selection procedures, and experimental settings used for supervised code smell detection [6,7].
SVM-based models have been repeatedly investigated for this task [25,26,27], including implementations such as SMO [28,29,30] and LibSVM [30,31]. Their application to metric-based detection allows nonlinear relationships among structural characteristics to be incorporated into the classification decision. However, the resulting behavior remains dependent on both the available feature representation and the model configuration.
Our previous study examined the influence of hyperparameter optimization on SVM-based detection of four code smells across Azureus, ArgoUML, and Xerces [32]. In addition to predictive evaluation, point-biserial correlation was used to examine the association between individual structural metrics and binary smell labels. This analysis characterized marginal metric–label relationships, but it did not determine how individual metrics contribute within the multivariate decision function of the trained models. The present study builds on that distinction by incorporating model-level explanatory evidence.
2.3. Explainability in Software Analytics
Explainable Artificial Intelligence complements predictive evaluation by providing information about the features that contribute to model decisions. SHapley Additive exPlanations (SHAP) assigns feature-level contributions based on Shapley values and supports both local explanations and their aggregation into broader patterns of model behavior [8].
This distinction between local and aggregated explanations is relevant to code smell detection. A metric that strongly influences a particular prediction may not be consistently important across experimental partitions or software projects. Conversely, a metric with moderate average importance may recur among the most influential features across multiple folds. Examining both contribution magnitude and persistence can therefore provide complementary evidence about the structural information used by a detector.
Explainability has also been investigated in code smell prioritization, particularly regarding the correspondence between SHAP-based explanations and developers’ expectations. An empirical study examined the coverage of these expectations by influential features, showing that the number of features required varied across code smells [9]. A subsequent replication study investigated the effects of feature selection on model behavior and its agreement with developers’ comments, finding that models based on code metrics can achieve greater agreement under appropriate feature selection strategies [10]. Although both studies address prioritization rather than detection, they provide evidence that feature importance and correspondence with domain expectations require separate examination.
The quality of SHAP and LIME explanations has also been examined in automated bug and non-bug issue classification. An evaluation of 3,090 issues considered the relevance, ambiguity, contextuality, and interpretive value of the explanations. Both methods generally produced meaningful explanations, although SHAP achieved higher qualitative ratings, particularly regarding ambiguity and contextuality. Limited agreement among evaluators further highlighted the subjective nature of explanation quality assessment [11].
The reliability of model explanations has been examined in software defect prediction. Shin et al. [33] reported inconsistencies in LIME and BreakDown explanations across different prediction settings. Yu et al. [34] evaluated a formal explanation approach against model-agnostic methods, including SHAP and LIME, identifying differences in correctness and robustness. These findings highlight the need to examine explanation reliability as a distinct consideration from feature importance.
Previous research therefore provides complementary perspectives on metric-based code smell detection. Rule-based approaches establish relationships between smell descriptions and measurable source-code characteristics [13,14], while machine learning studies examine how these characteristics can be used to discriminate labeled instances [6,7]. Explainability studies further examine feature contributions, explanation quality, reliability, and correspondence with domain expectations [9,11,33,34]. However, the relationship among literature-based operationalization, metric–label association, and model explanation remains insufficiently characterized. In particular, it remains unclear whether influential metrics persist across folds and software systems, whether their SHAP-based importance agrees with their marginal association with smell labels, and whether they correspond to the indicators and expected directions reported for individual code smells.
3. Materials and Methods
3.1. Study Design
This study extends our previous investigation of hyperparameter optimization and metric correlation for code smell detection [32] by examining the explanatory behavior of SVM-based detectors. The models were reconstructed using the fold-specific Grid Search configurations from the previous study, which achieved the highest overall accuracy across the three systems while maintaining competitive F1-scores. No further hyperparameter optimization or model selection was performed.
The empirical setting comprises three Java systems—Azureus, ArgoUML, and Xerces—and four code smells: God Class (GC), Functional Decomposition (FD), Swiss Army Knife (SAK), and Spaghetti Code (SC). The ten original folds were retained for each system–smell combination, resulting in 120 SVM models. Within each fold, Training01 and Training02 were combined for model fitting, whereas the corresponding Test partition remained independent for predictive verification and SHAP-based analysis.
Figure 1 summarizes the study workflow, which integrates SHAP-based feature attributions, point-biserial correlations between structural metrics and smell labels, and literature-based indicators. This analysis examines metric importance, persistence across folds, and cross-system consistency; compares SHAP-based rankings with statistical associations; and evaluates their correspondence with indicators and expected directions reported in previous code smell operationalizations.
These analyses address the three research questions. RQ1 examines which structural metrics contribute most to the SVM decisions, their persistence across folds, and their consistency across projects. RQ2 examines the agreement between SHAP-based importance rankings and rankings derived from point-biserial associations. RQ3 examines whether the structural evidence provided by the models corresponds with the indicators and expected directions reported in previous code smell operationalizations.
3.2. Experimental Setting and Model Basis
The analysis uses Azureus v2.3.0.6, ArgoUML v0.19.8, and Xerces v2.7.0 from the Ptidej benchmark [25], together with the original experimental partitions used in our previous study [32]. Although God Class is identified as BLOB in the source files, the abbreviation GC is used throughout this paper.
Each instance is represented by the same 50 class-level structural metrics available in Ptidej, covering properties related to size, complexity, coupling, cohesion, inheritance, methods, and attributes. The original folds were preserved without resampling or repartitioning.
Values encoded as ? or NaN were treated as missing. For each fold, median imputation and standardization were fitted on the combined Training partition and subsequently applied to Test.
The SVM associated with each fold was reconstructed using the configuration selected in the previous study. The purpose of this step was solely to recover the predictive models required for the new explanatory analysis. Each reconstruction was verified by checking the expected Training and Test sizes and requiring an exact match of the complete Test confusion matrix with the corresponding reference result. Only models satisfying these checks were subsequently explained using SHAP.
3.3. SHAP-Based Explanatory Analysis
SHapley Additive exPlanations (SHAP) was used to quantify the contribution of the structural metrics to the SVM predictions [8]. Explanations were computed on SVC.decision_function, allowing both the magnitude and sign of each feature attribution to be retained.
For each fold, the SHAP background was obtained exclusively from the preprocessed Training partition. Up to 50 observations were selected using reproducible class-stratified sampling; when no more than 50 Training observations were available, the complete partition was used. An independent masker and the permutation explainer were applied. With input metrics, the explanation budget corresponded to three permutation cycles:
All instances in the corresponding Test partition were explained, and numerical additivity was verified for the resulting local explanations.
For metric j in fold f, SHAP importance was summarized as the mean absolute attribution across the Test instances:
Because independently reconstructed SVMs may produce decision scores on different numerical scales, importance was normalized within each fold:
For each system–smell combination, global importance was obtained by averaging the normalized importance values across the ten folds. Persistence was measured as the proportion of folds in which a metric belonged to the fold-level Top-5, whereas cross-system consistency was examined from the recurrence of metrics among the system-level global Top-5 for the same smell.
3.4. SHAP–Correlation Concordance Analysis
Point-biserial correlation was independently computed from the Training partition of each fold to quantify the marginal association between each structural metric and the binary smell label. The absolute correlation magnitude, , was used to establish the association ranking, whereas the original sign was retained for the directional analysis described in Section 3.6. Metrics without sufficient within-fold variation were considered non-evaluable for correlation ranking.
Following previous work on Top-k SHAP feature identification and comparison [35,36], was adopted as a fixed operational cutoff. The fifth position was not interpreted as a threshold of feature relevance.
Agreement between the SHAP and point-biserial rankings was assessed within each fold using three complementary measures. Overlap@5 measures the proportion of common metrics among the two Top-5 sets:
Jaccard@5 measures their intersection relative to their union:
Spearman’s rank correlation was additionally used to characterize agreement across all metrics with valid positions in both rankings. The fold-level concordance measures were summarized using medians and interquartile ranges for each system–smell combination.
3.5. Literature-Based Operationalizations and Metric Mapping
To provide an external reference for RQ3, literature-based operationalizations for the four code smells considered in this study were identified from previous research [4,37,38]. The resulting set includes 16 operationalizations for GC, one for FD, two for SC, and two for SAK, as summarized in Table 1. The labels shown in the table are used only to reference individual operationalizations in the subsequent analysis.
The structural indicators contained in these operationalizations were then compared with the 50 metrics available in Ptidej. This mapping was based on the definition, measurement level, and structural property represented by each metric. The objective was not to reproduce the original detection rules or their numerical thresholds, but to determine which literature-based concepts could be examined using the metric space available to the SVM models.
Four types of correspondence were distinguished:
- direct, when the literature indicator and the Ptidej metric represent the same property at an equivalent measurement level;
- approximate, when a related metric is available but differences in definition, aggregation, or granularity prevent treating the two measures as equivalent;
- unavailable, when the literature indicator represents a measurable property that is not represented in the available Ptidej metric space; and
- not applicable, when the literature element is a reference value or comparison criterion rather than an independently measurable structural property.
The resulting mapping is reported in Table 2.
When a literature indicator was associated with more than one Ptidej metric, it was treated as a single conceptual indicator. For example, LCOM contributes only once to an operationalization even though it is represented approximately by LCOM1, LCOM2, and LCOM5. An indicator was considered represented among the most influential metrics when at least one of its mapped Ptidej metrics belonged to the global Top-5 for the corresponding system and smell.
For an operationalization , coverage was defined as
Only direct and approximate correspondences were considered evaluable. Unavailable and not-applicable elements were excluded from the denominator. If an operationalization contained no evaluable indicator, its coverage was treated as not evaluable rather than as zero.
This measure therefore quantifies whether the structural concepts reported in the literature are represented among the metrics receiving the highest SHAP importance. It does not assess whether the complete original detection rule or its numerical thresholds are satisfied.
3.6. Directional Alignment Analysis
RQ3 also examines whether the model evidence associated with the mapped metrics is compatible with the direction expressed by the corresponding literature-based indicators. The analysis was restricted to direct or approximate correspondences for which an expected direction could be derived from the source operationalization.
Expected directions were represented as higher, lower, or equals 1. For higher and lower expectations, directional compatibility was evaluated within each Test partition using Spearman’s rank correlation between the observed metric values and their signed SHAP attributions. Positive coefficients were compatible with a higher expectation and negative coefficients with a lower expectation.
Conditions specifying were evaluated by comparing Test instances satisfying with those satisfying using a two-sided Mann–Whitney U test. The corresponding rank-biserial correlation was calculated as
where and denote the number of instances in the two groups. A positive effect was considered compatible with the expected condition.
When one literature indicator mapped to several Ptidej metrics, each metric–direction relationship was evaluated separately. If the same empirical comparison occurred in multiple operationalizations, it was tested only once within each system–smell–fold combination.
Directional compatibility and statistical significance were treated separately. The p-values from the unique directional tests were adjusted within each system–smell–fold combination using the Benjamini–Hochberg procedure. Results with in the expected direction were considered significant support, whereas significant effects in the opposite direction were considered opposition.
3.7. SHAP Sensitivity Analysis
A complementary sensitivity analysis examined the dependence of the SHAP rankings on the stochastic components of the permutation-based explanation procedure. Fold 1 was pre-specified for each of the 12 system–smell combinations.
For each selected model, three reproducible SHAP realizations were obtained by varying the stratified Training background and permutation process while keeping the SVM, Test partition, feature space, and explanation budget fixed. Pairwise ranking agreement was assessed using Spearman’s rank correlation, Overlap@5, and Jaccard@5. These additional realizations were analyzed separately from the primary SHAP estimates.
3.8. Statistical Analysis and Reproducibility
All analyses were first performed independently at the system–smell–fold level and subsequently aggregated. Point-biserial associations were computed from Training data, whereas SHAP explanations and directional analyses used the corresponding independent Test partitions.
For the point-biserial analysis, p-values were adjusted within each fold using the Benjamini–Hochberg procedure. Directional-test p-values were adjusted across the unique empirical comparisons within each system–smell–fold combination. An adjusted significance threshold of was used.
The model configurations, feature schemas, reconstruction checks, SHAP outputs, and fold-level results were recorded programmatically. The implementation used SHAP version 0.52.0, with reproducible seeds for background sampling and permutation-based explanation procedures.
4. Results
All 120 system–smell–fold model reconstructions satisfied the predictive-equivalence controls, including agreement in the expected Training and Test sizes and an exact match of the corresponding confusion matrices. SHAP explanations were subsequently obtained for all 4,281 Test instances, yielding 214,050 instance–feature attributions across the 50 structural metrics.
Table 3 presents the overall predictive performance of the SVM configurations selected through Grid Search, as reported in our previous study [32]. Grid Search achieved the highest overall accuracy across the three software systems in the original comparative evaluation, providing the predictive baseline for the present SHAP analysis.
The following subsections present the results according to the three research questions, followed by the complementary SHAP sensitivity analysis.
4.1. RQ1: SHAP-Based Feature Importance, Persistence, and Cross-System Consistency
Figure 2 summarizes the global normalized SHAP importance of the structural metrics across the 12 system–smell combinations. The resulting rankings varied both across smells and across projects within the same smell. Moreover, the metric with the highest mean importance was not necessarily the metric that appeared most persistently among the fold-level Top-5 features.
The Top-10 selection in Figure 2 is used only to provide a broader visualization of the global importance patterns. All persistence, cross-system consistency, and set-based concordance analyses use the predefined Top-5 cutoff.
To complement the metric-level analysis, Figure 3 reorganizes the SHAP evidence according to the conceptual categories represented by the structural metrics. The resulting distribution shows that the influential metrics were not concentrated in a single structural dimension across the four code smells. GC combined relevant metrics associated mainly with inheritance, polymorphism, and specialization and with size and structure. FD showed a stronger presence of metrics related to cohesion and internal interaction, together with encapsulation and interface properties. For SAK, influential metrics were distributed primarily across cohesion and internal interaction, inheritance-related properties, and coupling and dependencies. SC exhibited contributions from several categories, particularly coupling and dependencies, size and structure, and complexity. These differences provide a category-level view of the smell-specific structural information reflected in the model explanations.
For GC, NADExtended and NMDExtended exhibited the clearest cross-system consistency, as both belonged to the global Top-5 in Azureus, ArgoUML, and Xerces. NADExtended ranked first in ArgoUML, third in Azureus, and second in Xerces, whereas NMDExtended ranked third, second, and first, respectively. Their fold-level persistence also differed among projects. NADExtended appeared in the Top-5 in 70% of ArgoUML folds, 80% of Azureus folds, and 40% of Xerces folds; the corresponding frequencies for NMDExtended were 40%, 70%, and 100%.
Azureus–GC illustrates the distinction between mean importance and persistence. NOD obtained the highest mean normalized SHAP importance for this combination (), but it appeared among the fold-level Top-5 in only 30% of the folds and had a median rank of 33.5. In contrast, NMDExtended and NADExtended had lower mean normalized importance values ( and , respectively) but considerably higher Top-5 frequencies. The large mean importance assigned to NOD was therefore concentrated in a limited subset of folds.
For FD, CAM was the only metric included in the global Top-5 of all three projects, ranking third in ArgoUML, second in Azureus, and third in Xerces. DAM and cohesionAttributes occurred in the global Top-5 of both ArgoUML and Azureus. The highest mean normalized importance was assigned to different metrics in each system: MOA in ArgoUML (), ICHClass in Azureus (), and connectivity in Xerces (). However, MOA and ICHClass occurred among the fold-level Top-5 in only one of the ten folds of their respective projects.
SAK exhibited the lowest cross-system recurrence. No metric belonged to the global Top-5 in all three projects. NOC, NOTI, CAM, and cohesionAttributes each occurred in the global Top-5 of two projects. Within-system persistence also varied. For example, CIS, ranked second for Xerces–SAK, appeared in the fold-level Top-5 in 70% of the folds, whereas several of the globally highest-ranked metrics for ArgoUML showed substantially lower fold-level frequencies.
For SC, RFC was the only metric included in the global Top-5 of all three projects. Its fold-level Top-5 frequency was 90% in ArgoUML, 70% in Azureus, and 30% in Xerces. LOC was shared by Azureus and Xerces, with Top-5 frequencies of 100% and 70%, respectively, whereas LCOM5 was shared by ArgoUML and Xerces. Azureus–SC showed particularly persistent contributions from LOC and WMC, both of which occurred among the five highest-ranked metrics in all ten folds and reached mean normalized importance values of and , respectively.
Figure 4 shows the fold-level persistence of the globally relevant metrics for each smell.
Cross-system consistency was limited and differed across smells. For GC, NADExtended and NMDExtended belonged to the global Top-5 in all three projects. For FD and SC, only CAM and RFC, respectively, were shared by all three projects, whereas SAK had no metric common to the global Top-5 of all projects. Table 4 reports the complete system-level Top-5 membership patterns and the corresponding global SHAP ranks.
4.2. RQ2: Agreement Between SHAP Importance and Point-Biserial Association
Figure 5 summarizes the fold-level concordance between SHAP-based importance rankings and rankings derived from the absolute point-biserial association. Agreement was partial and varied across both smells and projects.
Across the 30 folds associated with each smell, GC obtained a median Overlap@5 of , a median Jaccard@5 of , and a median Spearman coefficient of (IQR –). SC showed the largest Top-5 overlap, with a median Overlap@5 of and a median Jaccard@5 of ; its median Spearman coefficient was (IQR –).
Lower concordance was observed for FD and SAK. FD produced median values of , , and (IQR –) for Overlap@5, Jaccard@5, and Spearman, respectively. The corresponding SAK values were , , and (IQR –).
At the system–smell level, Azureus–SC exhibited the highest median Top-5 agreement, with Overlap@5 and Jaccard@5 . ArgoUML–GC showed the highest median agreement across the broader rankings, with a Spearman coefficient of , despite a lower median Overlap@5 of . Thus, agreement within the Top-5 and agreement across the complete ranking did not necessarily vary together.
All 30 GC folds and all 30 SC folds produced non-negative Spearman coefficients. FD contained five folds with negative coefficients and SAK contained six. Spearman concordance remained evaluable for all 120 system–smell–fold combinations.
Table 5 provides the corresponding system–smell summaries.
Overall, the observed concordance was partial rather than complete: metrics with strong marginal associations with the smell label were not necessarily the metrics receiving the largest SHAP attributions from the multivariate SVM models.
4.3. RQ3: Alignment with Literature-Based Indicators
RQ3 examines two complementary aspects of alignment with literature-based operationalizations. The first considers whether evaluable literature indicators are represented among the globally most influential SHAP metrics. The second examines whether the model-based behavior of mapped metrics is compatible with the expected direction of the corresponding literature indicators.
4.3.1. Operationalization Coverage
Figure 6 reports the Top-5 coverage of the literature-based operationalizations. Coverage varied markedly across smells and projects.
For GC, none of the 16 operationalizations contained an evaluable indicator represented in the global Top-5 of Azureus or ArgoUML. In Xerces, six operationalizations showed non-zero coverage: GC-OP01 (), GC-OP05 (), GC-OP06 (), GC-OP10 (), GC-OP11 (), and GC-OP14 (). In these cases, the covered literature indicator was represented through NAD.
For FD, FD-OP01 contained three evaluable indicators. One was represented among the global Top-5 in Azureus and ArgoUML, resulting in a coverage of in both projects. In both cases, the mapped metric was DAM. No mapped FD indicator occurred in the Xerces global Top-5.
SC showed stronger but system-dependent coverage. SC-OP01 reached coverage in Azureus and Xerces through LOC, whereas no corresponding indicator occurred in the ArgoUML global Top-5. SC-OP02 reached complete coverage () in Azureus, where both LOC and McCabe belonged to the global Top-5. Coverage was in Xerces and in ArgoUML.
The two SAK operationalizations were not evaluable for Top-5 coverage because their literature indicators were unavailable in the Ptidej metric space. They are therefore represented as NE rather than zero.
4.3.2. Directional Alignment
The directional analysis produced a different pattern from Top-5 coverage. Figure 7 reports the mean fold-level directional compatibility for each evaluable literature indicator and its expected direction across the three projects.
GC showed generally high directional compatibility despite its limited Top-5 coverage. NMD and NOM were compatible with the expected higher direction in all 30 folds. CLOC, NAD, NOF, VG, and WMC were compatible in 29 of 30 folds. The expected lower direction for TCC, approximately represented by cohesionAttributes, was compatible in 25 of 30 folds.
Not all GC indicators followed the same pattern. The expected higher direction for DIT was compatible in 14 of 30 folds, with system-level compatibility rates of , , and for Azureus, ArgoUML, and Xerces, respectively. The expected higher direction for DCC was compatible in 23 folds, with system-level rates of , , and .
The inferential results were consistent with these differences. At the mapped-metric level, NMD received significant support for the expected direction in all 30 folds, while NOM, NAD, and WMC received significant support in 29. The mappings associated with CLOC and VG received significant support in 28 and 27 folds, respectively, and cohesionAttributes received significant support in 23. In contrast, DIT received significant support in nine folds and significant opposition in 13, while DCC received significant support in 22 and significant opposition in seven.
For FD, NPRIVFIELD, approximately represented by DAM, showed the strongest directional compatibility, with system-level rates of , , and , corresponding to 26 of 30 compatible folds. The condition was compatible in 21 folds, whereas the expected lower direction for NMD was compatible in only 10. Significant support was observed in 18 folds for the DAM mapping, with one fold showing significant opposition. The condition received significant support in nine folds and significant opposition in two, whereas the lower expectation for NMD received significant support in four folds and significant opposition in 13.
For SC, the expected higher directions for LOC and LOC_METHOD were compatible in all folds of all three projects. CYCLO, approximately represented by McCabe, was compatible in 29 of 30 folds. In contrast, the condition was compatible in only 12 folds, with system-level rates of , , and for Azureus, ArgoUML, and Xerces, respectively. The LOC-based empirical contrast received significant support in 27 folds, whereas the McCabe mapping received significant support in 24, with no significant opposition for either. The condition received significant support in eight folds and significant opposition in 16.
Directional analysis was not available for SAK because its literature indicators could not be mapped to evaluable Ptidej metrics.
Table 6 complements the indicator-level view in Figure 7 by aggregating directional compatibility at the operationalization level and presenting it together with Top-5 coverage. Each system cell reports Top-5 coverage / mean directional compatibility.
Taken together, the two RQ3 analyses reveal that Top-5 coverage and directional compatibility capture different aspects of alignment with the literature. GC provides the clearest example: most operationalizations had no mapped indicator among the global Top-5 in Azureus and ArgoUML, although several evaluable indicators showed high directional compatibility with the literature-based expectations. Conversely, the results for indicators such as GC–DIT and SC–DIT show that the availability of a structural correspondence does not necessarily imply directional agreement with the corresponding literature expectation.
4.4. SHAP Sensitivity Analysis
As a complementary check, the sensitivity analysis showed high agreement among the repeated SHAP realizations. Across the 36 pairwise comparisons, the median Spearman rank correlation was , with a minimum of , and the median Overlap@5 was . Twenty-eight comparisons preserved all five Top-5 metrics, six shared four of the five metrics, and two shared three.
These results indicate that, for the pre-specified folds examined, the SHAP rankings were not strongly dependent on the tested background and permutation realizations. Because the analysis was restricted to fold 1 of each system–smell combination, it is interpreted only as a sensitivity check of the approximation procedure and not as evidence of persistence across the ten experimental folds.
5. Discussion
The results show that explaining metric-based code smell classifiers requires considering several complementary forms of evidence rather than relying exclusively on global feature importance. Across the four code smells and three projects, SHAP importance, persistence across folds, cross-system consistency, marginal statistical association, and alignment with literature-based indicators did not always coincide. This distinction is important because each analysis characterizes a different aspect of the information captured by the models.
For RQ1, the SHAP results indicate that the structural metrics contributing most strongly to the SVM predictions depend on both the code smell and the system. Only a small number of metrics remained in the global Top-5 across all three projects for a given smell, and SAK presented no metric shared by all three system-level Top-5 sets. The category-level analysis further indicates that this variation is not restricted to individual metrics: the structural dimensions represented by the most relevant features also differed across smells. GC emphasized inheritance-related and size-related properties, FD showed a stronger presence of cohesion-related metrics, SAK combined cohesion, inheritance, and coupling properties, and SC drew relevant information from coupling, size, and complexity metrics. This pattern reinforces the interpretation that the models did not rely on a single structural dimension to characterize all four smells. Furthermore, high mean SHAP importance did not necessarily imply persistence across folds. The Azureus–GC case illustrates this difference particularly clearly: NOD obtained the largest mean normalized importance, although its Top-5 occurrence was concentrated in only a limited subset of folds. These findings show that mean importance, persistence, and cross-system consistency represent different properties of model behavior.
Previous research on machine learning-based code smell detection has investigated the use of structural metrics and different classification approaches to identify code smells. Comparative studies and systematic reviews have documented variations in the models, feature sets, and evaluation procedures employed for this task [6,7]. The present findings extend this perspective by showing that the structural metrics receiving the highest explanatory importance are not necessarily consistent across the evaluated software systems. Furthermore, the differences between mean importance and fold-level persistence indicate that identifying influential metrics within a particular model does not establish their stability across experimental partitions. These results emphasize the need to distinguish predictive effectiveness from the consistency of the structural information underlying model decisions.
The variability of explanations has also been examined in software defect prediction. Shin et al. [33] reported that LIME and BreakDown explanations differed across prediction settings, while Yu et al. [34] identified limitations in the robustness and formal correctness of model-agnostic explanations. Unlike these studies, the present analysis examines the recurrence of influential SHAP features across folds and their consistency across software systems. These analyses characterize complementary aspects of explanatory behavior without establishing formal guarantees of robustness or correctness.
A metric can be highly influential on average without contributing recurrently across folds, and a recurrent metric within one software system does not necessarily occupy the same position in other systems. Consequently, global importance rankings should be interpreted together with their behavior across folds and software systems rather than as system-independent characterizations of a code smell.
RQ2 provides a second qualification to the interpretation of feature relevance. The agreement between SHAP importance and point-biserial association was partial, with stronger concordance for some smells and projects than for others. This result is consistent with the different information represented by the two approaches. Point-biserial correlation evaluates the marginal relationship between an individual metric and the smell label, whereas SHAP attributes importance within the context of the trained multivariate model. A metric may therefore show a comparatively strong association with the target without becoming one of the main contributors to the model predictions, while another metric may receive substantial SHAP importance despite a more moderate marginal association. The observed disagreement should therefore not be interpreted as a contradiction between the two analyses. Instead, it demonstrates that statistical association and model contribution provide complementary views of structural relevance and should not be used interchangeably.
Previous research provides different perspectives on the interpretation of structural metrics in software quality models. Our earlier study examined point-biserial associations between structural metrics and code smell labels, characterizing individual metric–label relationships without determining their contributions to multivariate predictions [32]. Research on explainable software analytics has also evaluated SHAP and LIME explanations in relation to human expectations, showing that explanation quality involves considerations beyond predictive performance [11]. The present results extend these perspectives by showing that SHAP-based importance rankings and marginal statistical associations exhibit only partial agreement. This comparison evaluates the correspondence between two quantitative measures of feature relevance rather than the plausibility of individual explanations.
RQ3 extends the analysis by comparing model-based evidence with structural indicators reported in previous code smell operationalizations. The results show that Top-5 coverage and directional compatibility capture distinct forms of alignment. Coverage evaluates whether literature-based indicators are represented among the globally most influential model features, whereas directional compatibility evaluates whether the behavior of the corresponding mapped metrics follows the direction expected in the literature. The GC results make this distinction especially visible: several operationalizations exhibited little or no Top-5 coverage in Azureus and ArgoUML even though many of their evaluable indicators showed high directional compatibility. Thus, agreement with a literature-based structural expectation does not require the corresponding metric to be among the most influential features of the classifier.
The distinction between feature importance and conceptual correspondence is also relevant to previous research on explainable code smell prioritization. Huang et al. [9] examined the coverage of developers’ expectations by SHAP-based explanations, finding that the number of influential features required varied according to the characteristics of the smell. In a subsequent replication study, Huang et al. [10] found that feature selection affected the agreement between model behavior and developers’ comments. These studies evaluated explanations against developers’ expectations, whereas the present study examines correspondence with indicators derived from published code smell operationalizations. Accordingly, Top-5 coverage and directional compatibility provide evidence of alignment with literature-based indicators but do not establish agreement with developers’ perceptions.
The directional results also show that the existence of an evaluable metric correspondence does not guarantee empirical agreement with the literature. Most of the examined indicators displayed comparatively high directional compatibility, but indicators such as DIT produced a more heterogeneous pattern. The inferential analysis reinforces this distinction by separating descriptive compatibility from statistically supported evidence. Several mappings with high directional compatibility also received significant support in many folds, whereas other indicators exhibited both significant support and significant opposition across partitions. These cases suggest that some literature-based expectations are more dependent on the empirical context represented by the system and data partition. Accordingly, directional correspondence should be interpreted as evidence of alignment under the examined conditions rather than as a validation or rejection of the original operationalization.
The SAK results highlight a different issue. Its two literature-based operationalizations could not be evaluated because their indicators had no direct or approximate correspondence with the metrics available in Ptidej. Their NE status therefore represents neither zero coverage nor directional disagreement. Instead, it identifies a limitation of the available metric representation for establishing the intended comparison. This distinction is important when explanations derived from predictive models are contrasted with external domain knowledge because absence of an evaluable representation and absence of empirical alignment are fundamentally different outcomes.
Taken together, the three research questions support a multi-layered interpretation of metric-based code smell detection. SHAP identifies which structural metrics contribute most strongly to model predictions; fold-level persistence characterizes how recurrent these contributions are across experimental partitions; cross-system consistency examines whether highly ranked metrics recur across the analyzed software projects; point-biserial correlation provides an independent view of marginal feature–label association; and literature alignment evaluates whether the resulting evidence corresponds to previously reported structural indicators and expected directions. No single source of evidence provides a complete characterization. Their combination makes it possible to distinguish between metrics that are influential, persistent, recurrent across projects, statistically associated with the target, and consistent with domain expectations.
These complementary forms of evidence are particularly relevant when model explanations are used to examine the structural characteristics associated with code smells. A highly ranked SHAP feature should not automatically be interpreted as a universal indicator of the corresponding smell, just as a metric appearing in a literature-based operationalization should not be expected to dominate every predictive model. The contribution of the study therefore lies not in proposing a universal metric set, but in providing a traceable analysis of how structural software information is reflected in the decisions of the examined SVM models and how this evidence relates to statistical associations and prior knowledge. This perspective extends the evaluation beyond predictive performance by making explicit where different sources of evidence converge, where they diverge, and where comparison is not possible because the required structural information is unavailable in the metric space.
Finally, the complementary sensitivity analysis showed high agreement among repeated SHAP realizations, indicating that the principal feature rankings were not strongly affected by the tested background and permutation realizations. This finding can be considered in relation to previous research on explanation reliability. Shin et al. [33] reported variability in LIME and BreakDown explanations across defect prediction settings, while Yu et al. [34] examined robustness and formal correctness as properties of explanation quality.
The present analysis addresses a narrower question by assessing agreement among repeated SHAP realizations for fixed SVM models. Because it was restricted to one pre-specified fold for each system–smell combination, the findings provide evidence about the sensitivity of the SHAP approximation procedure under the evaluated conditions, rather than robustness across model configurations or formal correctness. They also do not establish persistence across data partitions, which was examined separately through the ten-fold analysis in RQ1.
6. Conclusions
This study investigated the explanatory behavior of metric-based SVM models for code smell detection beyond predictive performance. Using SHAP explanations for four code smells across three software projects, the analysis examined feature importance, persistence across folds, cross-system consistency, agreement with point-biserial associations, and alignment with literature-based structural indicators. The results show that these forms of evidence are related but not interchangeable and that interpreting model behavior requires considering them jointly.
The SHAP analysis showed that the structural metrics contributing most strongly to model predictions varied across both code smells and projects. High average importance did not necessarily imply persistence across folds, and metrics that were recurrent within one system were not always consistently highly ranked across the other projects. The comparison with point-biserial association further demonstrated that marginal statistical relationships with the smell label do not necessarily coincide with the contributions assigned by a multivariate predictive model. These findings emphasize that feature importance should not be interpreted as a single, context-independent property of a structural metric.
The comparison with literature-based operationalizations provided an additional perspective on the explanatory evidence. Top-5 coverage and directional compatibility captured different forms of alignment: a literature indicator could behave in the expected direction without being among the most influential model features, while the existence of an evaluable metric correspondence did not guarantee directional agreement. The inferential analysis further distinguished descriptive compatibility from statistically supported agreement or opposition. In addition, the non-evaluable SAK operationalizations demonstrated the importance of separating absence of empirical alignment from absence of an appropriate representation in the available metric space.
Overall, the study contributes a traceable interpretation of how structural software information is reflected in the decisions of code smell classifiers and how this evidence relates to statistical associations and prior knowledge. Rather than identifying a universal set of structural metrics, the results show that explanatory relevance depends on the smell, system, data partition, and form of evidence considered. The complementary SHAP sensitivity analysis also indicated that the principal feature rankings were not strongly affected by the tested approximation settings, supporting their use in the comparative analyses performed in this study.
Future work should examine whether these patterns persist across additional software projects, code smells, metric sets, and predictive models. Extending the analysis to richer structural or source-code representations would also help determine whether the observed differences between model contribution, statistical association, and literature-based expectations are specific to the metric space considered here or remain present under alternative representations.
Funding
This research was funded by Universidad Politécnica Salesiana grant number 042-002-2026-03-10.
Institutional Review Board Statement
Not applicable.
Informed Consent Statement
Not applicable.
Data Availability Statement
The dataset analyzed in this study is publicly available from the Ptidej replication repository. The source code, experimental notebook, and processed results supporting the reported findings are publicly available in the Ptidej Code Smell SHAP Analysis repository.
Conflicts of Interest
The authors declare no conflicts of interest.
Abbreviations
The following abbreviations are used in this manuscript:
| GC | God Class |
| FD | Functional Decomposition |
| SAK | Swiss Army Knife |
| SC | Spaghetti Code |
| SHAP | SHapley Additive exPlanations |
| XAI | Explainable Artificial Intelligence |
References
- Fowler, M. Refactoring: Improving the Design of Existing Code, 2 ed.; Addison-Wesley Professional: Boston, MA, USA, 2018. [Google Scholar]
- Bán, D.; Ferenc, R. Recognizing Antipatterns and Analyzing Their Effects on Software Maintainability. In Proceedings of the Computational Science and Its Applications – ICCSA 2014; Murgante, B., Misra, S., Rocha, A.M.A.C., Torre, C., Rocha, J.G., Falcão, M.I., Taniar, D., Apduhan, B.O., Gervasi, O., Eds.; Cham, 2014; pp. 337–352. [Google Scholar]
- Tufano, M.; Palomba, F.; Bavota, G.; Oliveto, R.; Di Penta, M.; De Lucia, A.; Poshyvanyk, D. When and Why Your Code Starts to Smell Bad. Proc. 2015 IEEE/ACM 37th IEEE Int. Conf. Softw. Eng. 2015, Vol. 1, 403–414. [Google Scholar] [CrossRef]
- Malhotra, R.; Jain, B.; Kessentini, M. Examining deep learning’s capability to spot code smells: a systematic literature review. Clust. Comput.-THE J. Netw. Softw. TOOLS Appl. 2023, 26, 3473–3501. [Google Scholar] [CrossRef]
- Thakur, P.S.; Chouhan, S.S.; Rathore, S.S.; Parmar, J. Systematic literature review on software code smell detection approaches. J. Syst. Softw. 2026, 235, 112784. [Google Scholar] [CrossRef]
- Azeem, M.I.; Palomba, F.; Shi, L.; Wang, Q. Machine learning techniques for code smell detection: A systematic literature review and meta-analysis. Inf. Softw. Technol. 2019, 108, 115–138. [Google Scholar] [CrossRef]
- Zhang, Y.; Ge, C.; Liu, H.; Zheng, K. Code Smell Detection Based on Supervised Learning Models: A Survey. Neurocomputing 2024, 565, 127014. [Google Scholar] [CrossRef]
- Lundberg, S.M.; Lee, S.I. A Unified Approach to Interpreting Model Predictions. Proc. Adv. Neural Inf. Process. Syst. 2017, Vol. 30, 4765–4774. [Google Scholar]
- Huang, Z.; Yu, H.; Fan, G.; Shao, Z.; Li, M.; Liang, Y. Aligning XAI Explanations with Software Developers’ Expectations: A Case Study with Code Smell Prioritization. Expert Syst. With Appl. 2024, 238, 121640. [Google Scholar] [CrossRef]
- Huang, Z.; Yu, H.; Fan, G.; Shao, Z.; Zhou, Z.; Li, M. On the effectiveness of developer features in code smell prioritization: A replication study. J. Syst. Softw. 2024, 210. [Google Scholar] [CrossRef]
- Schulte, L.; Ledel, B.; Herbold, S. Studying the Explanations for the Automated Prediction of Bug and Non-Bug Issues Using LIME and SHAP. Empir. Softw. Eng. 2024, 29, 93. [Google Scholar] [CrossRef]
- Yadav, P.S.; Rao, R.S.; Mishra, A.; Gupta, M. Machine Learning-Based Methods for Code Smell Detection: A Survey. Appl. Sci.-BASEL 2024, 14. [Google Scholar] [CrossRef]
- Marinescu, R. Detection strategies: Metrics-based rules for detecting design flaws. IEEE Int. Conf. Softw. Maint. ICSM 2004, 350–359. [CrossRef]
- Moha, N.; Guéhéneuc, Y.G.; Duchien, L.; Le Meur, A.F. DECOR: A method for the specification and detection of code and design smells. IEEE Trans. Softw. Eng. 2010, 36, 20–36. [Google Scholar] [CrossRef]
- Fernandes, E.; Oliveira, J.; Vale, G.; Paiva, T.; Figueiredo, E. A review-based comparative study of bad smell detection tools. In ACM International Conference Proceeding Series; STRING:PUBLICATION: PAGEGROUP, 01-03- June 2016; p. 2016. [Google Scholar] [CrossRef]
- Marinescu, C.; Marinescu, R.; Mihancea, P.; Ratiu, D.; Wettel, R. iPlasma: An Integrated Platform for Quality Assessment of Object-Oriented Design. In Proceedings of the Proceedings of ICSM, 7 2005; pp. 77–80. [Google Scholar]
- Tsantalis, N.; Chaikalis, T.; Chatzigeorgiou, A. JDeodorant: Identification and removal of type-checking bad smells. Proc. Eur. Conf. Softw. Maint. Reengineering CSMR 2008, 329–331. [CrossRef]
- PMD. PMD: An Extensible Cross-Language Static Code Analyzer. Available online: https://pmd.github.io/ (accessed on 2026-08-27).
- Alodibat, S.; Azzeh, M. A Systematic Review on Code Smell Detection Approaches in Open Source Projects. In SOFTWARE-PRACTICE & EXPERIENCE; 2026. [Google Scholar] [CrossRef]
- Mosquera, M. Operationalizing Software Antipatterns for Automated Detection Using Structural Metrics and Supervised Learning. Congr. Ibero-Am. Em Eng. De Softw. (CIbSE) 2026, 357–364. [Google Scholar] [CrossRef]
- Arcelli Fontana, F.; Mäntylä, M.V.; Zanoni, M.; Marino, A. Comparing and Experimenting Machine Learning Techniques for Code Smell Detection. Empir. Softw. Eng. 2016, 21, 1143–1191. [Google Scholar] [CrossRef]
- Mhawish, M.Y.; Gupta, M. Predicting Code Smells and Analysis of Predictions: Using Machine Learning Techniques and Software Metrics. J. Comput. Sci. Technol. 2020, 35, 1428–1445. [Google Scholar] [CrossRef]
- Alazba, A.; Aljamaan, H. Code Smell Detection Using Feature Selection and Stacking Ensemble: An Empirical Investigation. Inf. Softw. Technol. 2021, 138, 106648. [Google Scholar] [CrossRef]
- Rao, R.S.; Dewangan, S.; Mishra, A.; Gupta, M. A Study of Dealing Class Imbalance Problem with Machine Learning Methods for Code Smell Severity Detection Using PCA-Based Feature Selection Technique. Sci. Rep. 2023, 13, 16245. [Google Scholar] [CrossRef] [PubMed]
- Maiga, A.; Ali, N.; Bhattacharya, N.; Sabane, A.; Guéhéneuc, Y.G.; Aimeur, E. SMURF: A SVM-Based Incremental Anti-Pattern Detection Approach. In Proceedings of the 2012 19th Working Conference on Reverse Engineering, 2012; pp. 466–475. [Google Scholar]
- Özkalkan, Z.; Aydin, K.; Tetik, H.Y.; Belen Sağlam, R. Automatic Detection of Feature Envy Using Machine Learning Techniques. 2018. [CrossRef]
- Maiga, A.; Ali, N.; Bhattacharya, N.; Sabané, A.; Guéhéneuc, Y.G.; Antoniol, G.; Aimeur, E. Support Vector Machines for Anti-Pattern Detection. In Proceedings of the Proceedings of the IEEE/ACM International Conference on Automated Software Engineering, 2012; pp. 278–281. [Google Scholar]
- Hozano, M.; Antunes, N.; Fonseca, B.; Costa, E. Evaluating the Accuracy of Machine Learning Algorithms on Detecting Code Smells for Different Developers. In Proceedings of the Proceedings of the International Conference on Enterprise Information Systems, Porto, Portugal, 2017; Vol. 2, pp. 474–482. [Google Scholar]
- Guggulothu, T.; Moiz, S.A. Detection of Shotgun Surgery and Message Chain Code Smells Using Machine Learning Techniques. Int. J. Rough. Sets Data Anal. 2019, 6, 34–50. [Google Scholar] [CrossRef]
- Di Nucci, D.; Palomba, F.; Tamburri, D.A.; Serebrenik, A.; De Lucia, A. Detecting Code Smells Using Machine Learning Techniques: Are We There Yet? In Proceedings of the 2018 IEEE 25th International Conference on Software Analysis, Evolution and Reengineering (SANER), 2018; pp. 612–621. [Google Scholar]
- Shen, L.; Liu, W.; Chen, X.; Gu, Q.; Liu, X. Improving Machine Learning-Based Code Smell Detection via Hyper-Parameter Optimization. In Proceedings of the Proceedings of the Asia-Pacific Software Engineering Conference, 2020; pp. 276–285. [Google Scholar] [CrossRef]
- Mosquera, M.; Bojorque, R.; Flores, P. Understanding Code Smell Detection Through Hyperparameter Optimization and Metric Correlation Analysis. IEEE Access 2025, 13, 217750–217768. [Google Scholar] [CrossRef]
- Shin, J.; Aleithan, R.; Nam, J.; Wang, J.; Wang, S. Explainable Software Defect Prediction: Are We There Yet? 2021. [Google Scholar] [CrossRef]
- Yu, J.; Fu, M.; Ignatiev, A.; Tantithamthavorn, C.; Stuckey, P. A Formal Explainer for Just-In-Time Defect Predictions. In ACM Transactions on Software Engineering and Methodology; ACM: WGROUP:STRING, 2024; p. 33. [Google Scholar] [CrossRef]
- Chabrier, L.; Crombach, A.; Peignier, S.; Rigotti, C. Effective Pruning for Top-k Feature Search on the Basis of SHAP Values. IEEE Access 2024, 12, 163079–163092. [Google Scholar] [CrossRef] [PubMed]
- Kariyappa, S.; Tsepenekas, L.; Lécué, F.; Magazzeni, D. SHAP@k: Efficient and Probably Approximately Correct (PAC) Identification of Top-K Features. Proc. AAAI Conf. Artif. Intell. 2024, 38, 13068–13075. [Google Scholar] [CrossRef]
- Kovačević, A.; Slivka, J.; Vidaković, D.; Grujić, K.G.; Luburić, N.; Prokić, S.; Sladić, G. Automatic detection of Long Method and God Class code smells through neural source code embeddings. Expert Syst. With Appl. 2022, 204, 117607. [Google Scholar] [CrossRef]
- Moha, N.; Guéhéneuc, Y.G.; Le Meur, A.F.; Duchien, L.; Tiberghien, A. From a domain analysis to the specification and detection of code and design smells. Form. Asp. Comput. 2009, 22:3 22, 345–361. [Google Scholar] [CrossRef]
- Trifu, A.; Marinescu, R. Diagnosing design problems in object oriented systems. Proceedings - Working Conference on Reverse Engineering, WCRE; 2005; 2005, pp. 155–164. [Google Scholar] [CrossRef]
- Schumacher, J.; Zazworka, N.; Shull, F.; Seaman, C.; Shaw, M. Building empirical support for automated code smell detection. In ESEM 2010 - Proceedings of the 2010 ACM-IEEE International Symposium on Empirical Software Engineering and Measurement; ACM: WGROUP:STRING, 2010. [Google Scholar] [CrossRef]
- Macia, I.; Garcia, J.; Popescu, D.; Garcia, A.; Medvidovic, N.; Von Staa, A. Are automatically-detected code anomalies relevant to architectural modularity? An exploratory analysis of evolving systems. In AOSD’12 - Proceedings of the 11th Annual International Conference on Aspect Oriented Software Development; STRING:BOOK: CTYPE, 2012; pp. 167–178. [Google Scholar] [CrossRef]
- Kiefer, C.; Bernstein, A.; Tappolet, J. Mining software repositories with iSPARQL and a software evolution ontology. Proceedings - ICSE 2007 Workshops: Fourth International Workshop on Mining Software Repositories, MSR 2007; 2007. [Google Scholar] [CrossRef]
- Fard, A.M.; Mesbah, A. JSNOSE: Detecting javascript code smells. IEEE 13th International Working Conference on Source Code Analysis and Manipulation, SCAM, 2013 2013; pp. 116–125. [Google Scholar] [CrossRef]
- Olbrich, S.; Cruzes, D.S.; Basili, V.; Zazworka, N. The Evolution and Impact of Code Smells: A Case Study of Two Open Source Systems. [CrossRef]
- Rasool, G.; Arshad, Z. A Lightweight Approach for Detection of Code Smells. Arab. J. Sci. Eng. 2016, 42:2 42, 483–506. [Google Scholar] [CrossRef]
- Kaur, S.; Maini, R. Analysis of various software metrics used to detect bad smells. Int. J. Eng. Sci. (IJES) 2016, 5, 14–20. [Google Scholar]
- Lerthathairat, P.; Prompoon, N. An approach for source code classification to enhance maintainability. In Proceedings of the 2011 8th International Joint Conference on Computer Science and Software Engineering, JCSSE 2011; 2011; pp. 319–324. [Google Scholar] [CrossRef]
- Souza, P.P.; Ferreira, K.A.; Sousa, B.L.; Bigonha, M.A. Applying sofware metric thresholds for detection of bad smells. ACM International Conference Proceeding Series 2017, Part F130660; STRING:ARTICLE/CHAPTER: PAGE. [CrossRef]
- Li, W.; Shatnawi, R. An empirical study of the bad smells and class error probability in the post-release object-oriented system evolution. J. Syst. Softw. 2007, 80, 1120–1128. [Google Scholar] [CrossRef]
- Arcoverde, R.; Macia, I.; Garcia, A.; Von Staa, A. Automatically detecting architecturally-relevant code anomalies. 2012 Third International Workshop on Recommendation Systems for Software Engineering (RSSE), 2012; pp. 90–91. [Google Scholar] [CrossRef]
- Danphitsanuphan, P.; Suwantada, T. Code Smell Detecting Tool and Code Smell-Structure Bug Relationship. In Proceedings of the Proceedings of the Spring World Congress on Engineering and Technology, Xi’an, China, 2012; pp. 1–5. [Google Scholar]
- Liu, H.; Ma, Z.; Shao, W.; Niu, Z. Schedule of bad smell detection and resolution: A new way to save effort. IEEE Trans. Softw. Eng. 2012, 38, 220–235. [Google Scholar] [CrossRef]
- Fourati, R.; Bouassida, N.; Abdallah, H.B. A metric-based approach for anti-pattern detection in UML designs. Stud. Comput. Intell. 2011, 364, 17–33. [Google Scholar] [CrossRef]
Figure 1.
Methodological workflow integrating SHAP-based explanations, statistical associations, and literature-based indicators.
Figure 1.
Methodological workflow integrating SHAP-based explanations, statistical associations, and literature-based indicators.
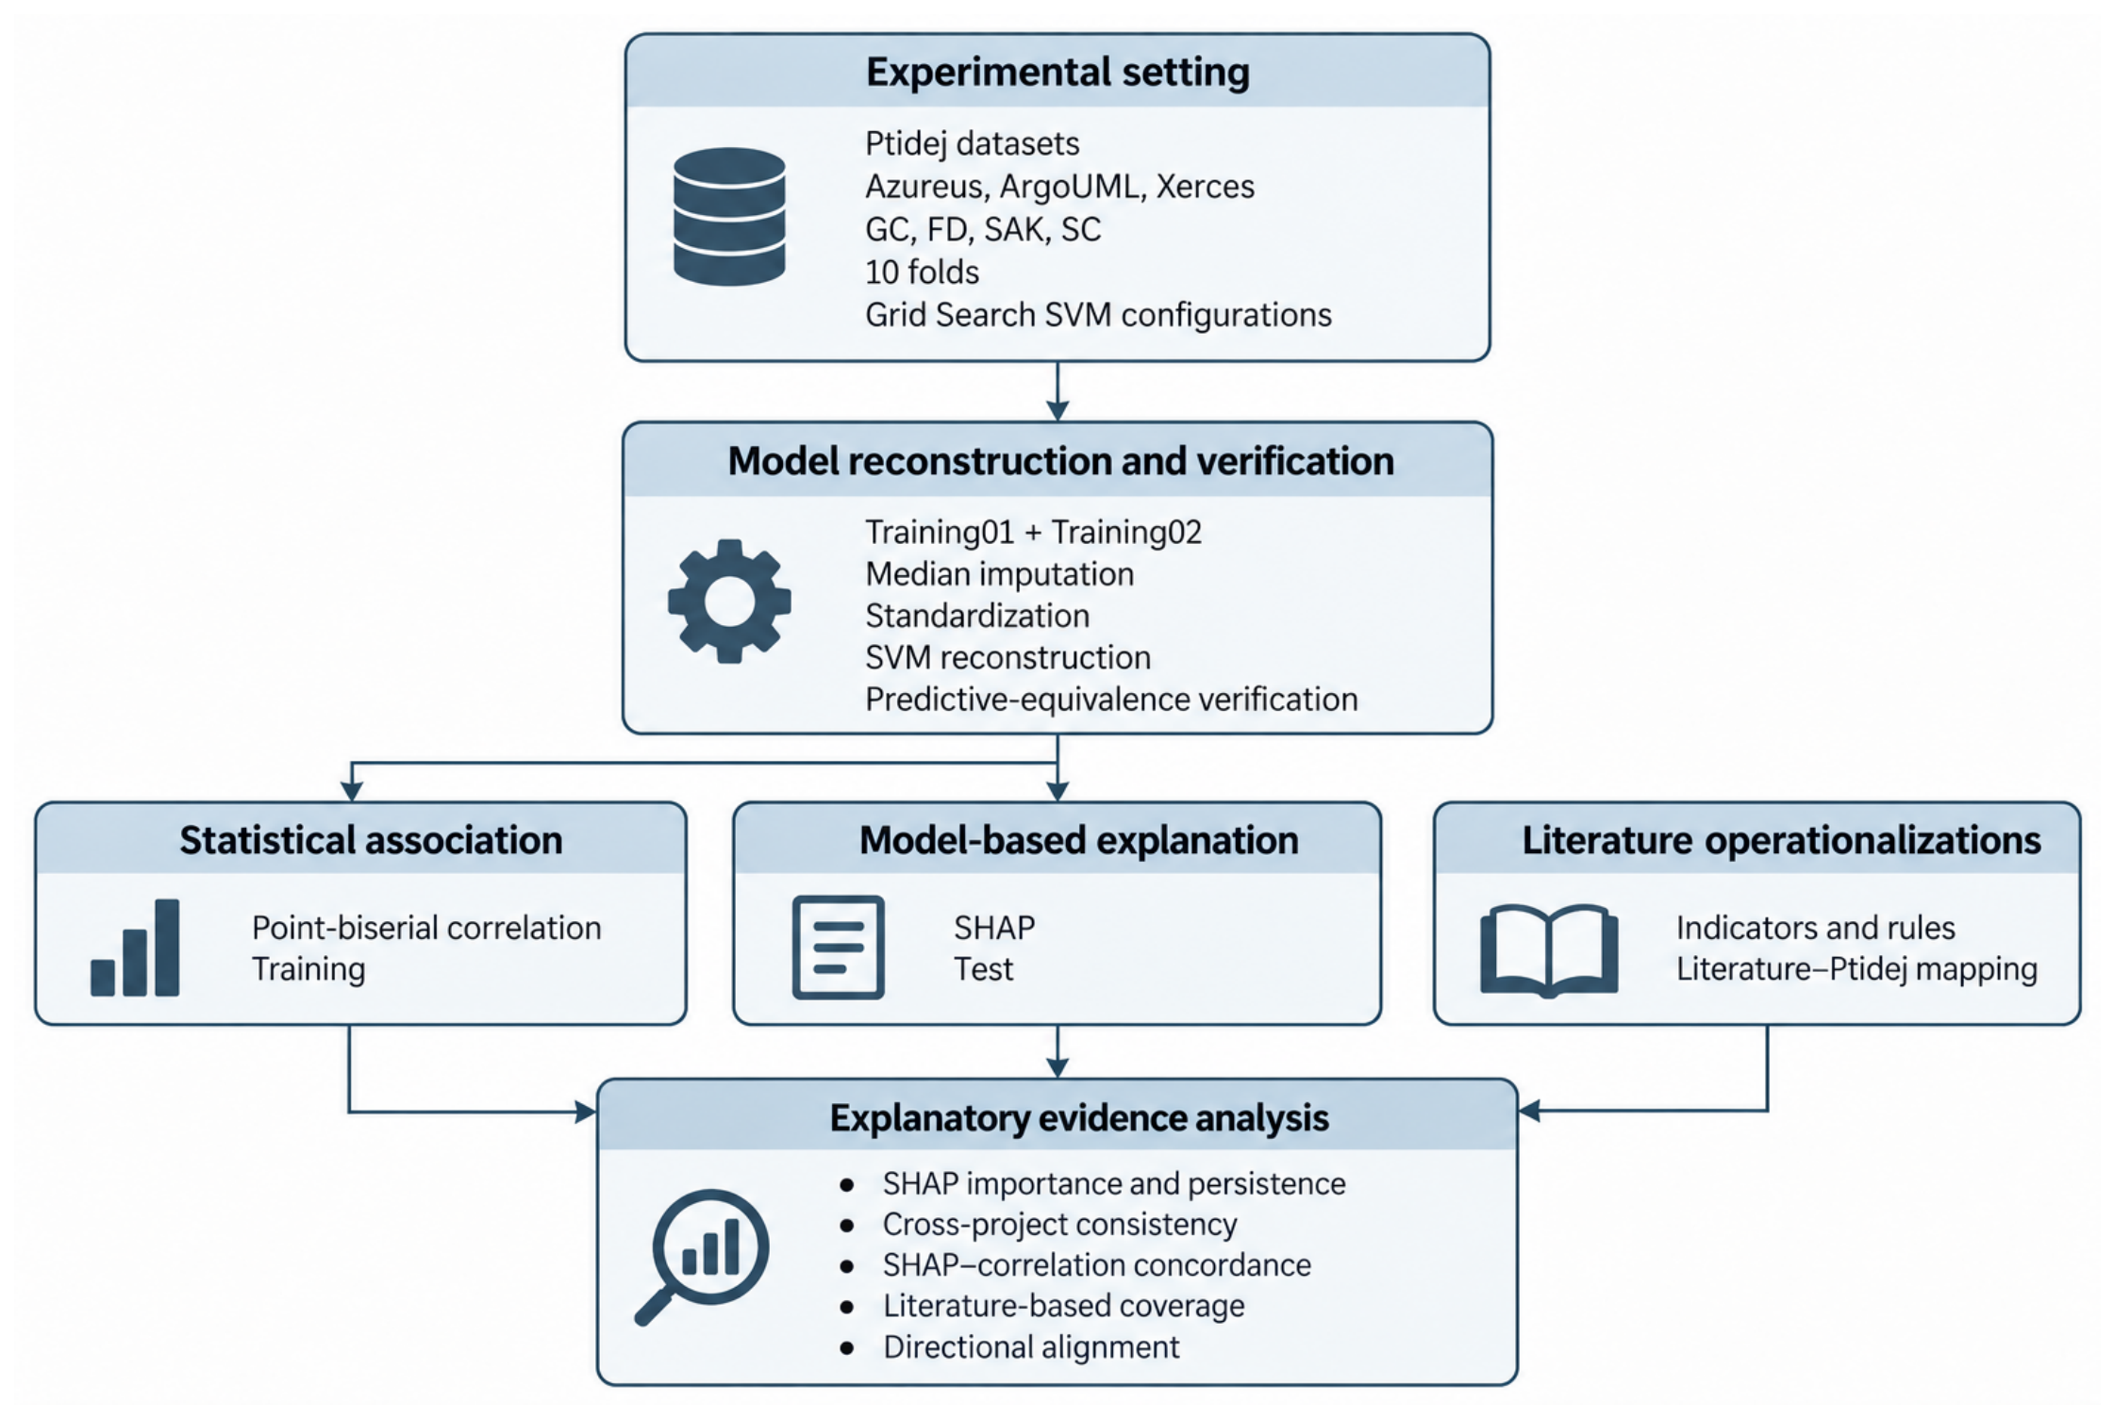
Figure 2.
Global normalized SHAP importance across projects and code smells. Rows contain the union of metrics ranked within the global Top-10 in at least one system–smell combination. Each cell reports the mean fold-normalized absolute SHAP importance.
Figure 2.
Global normalized SHAP importance across projects and code smells. Rows contain the union of metrics ranked within the global Top-10 in at least one system–smell combination. Each cell reports the mean fold-normalized absolute SHAP importance.
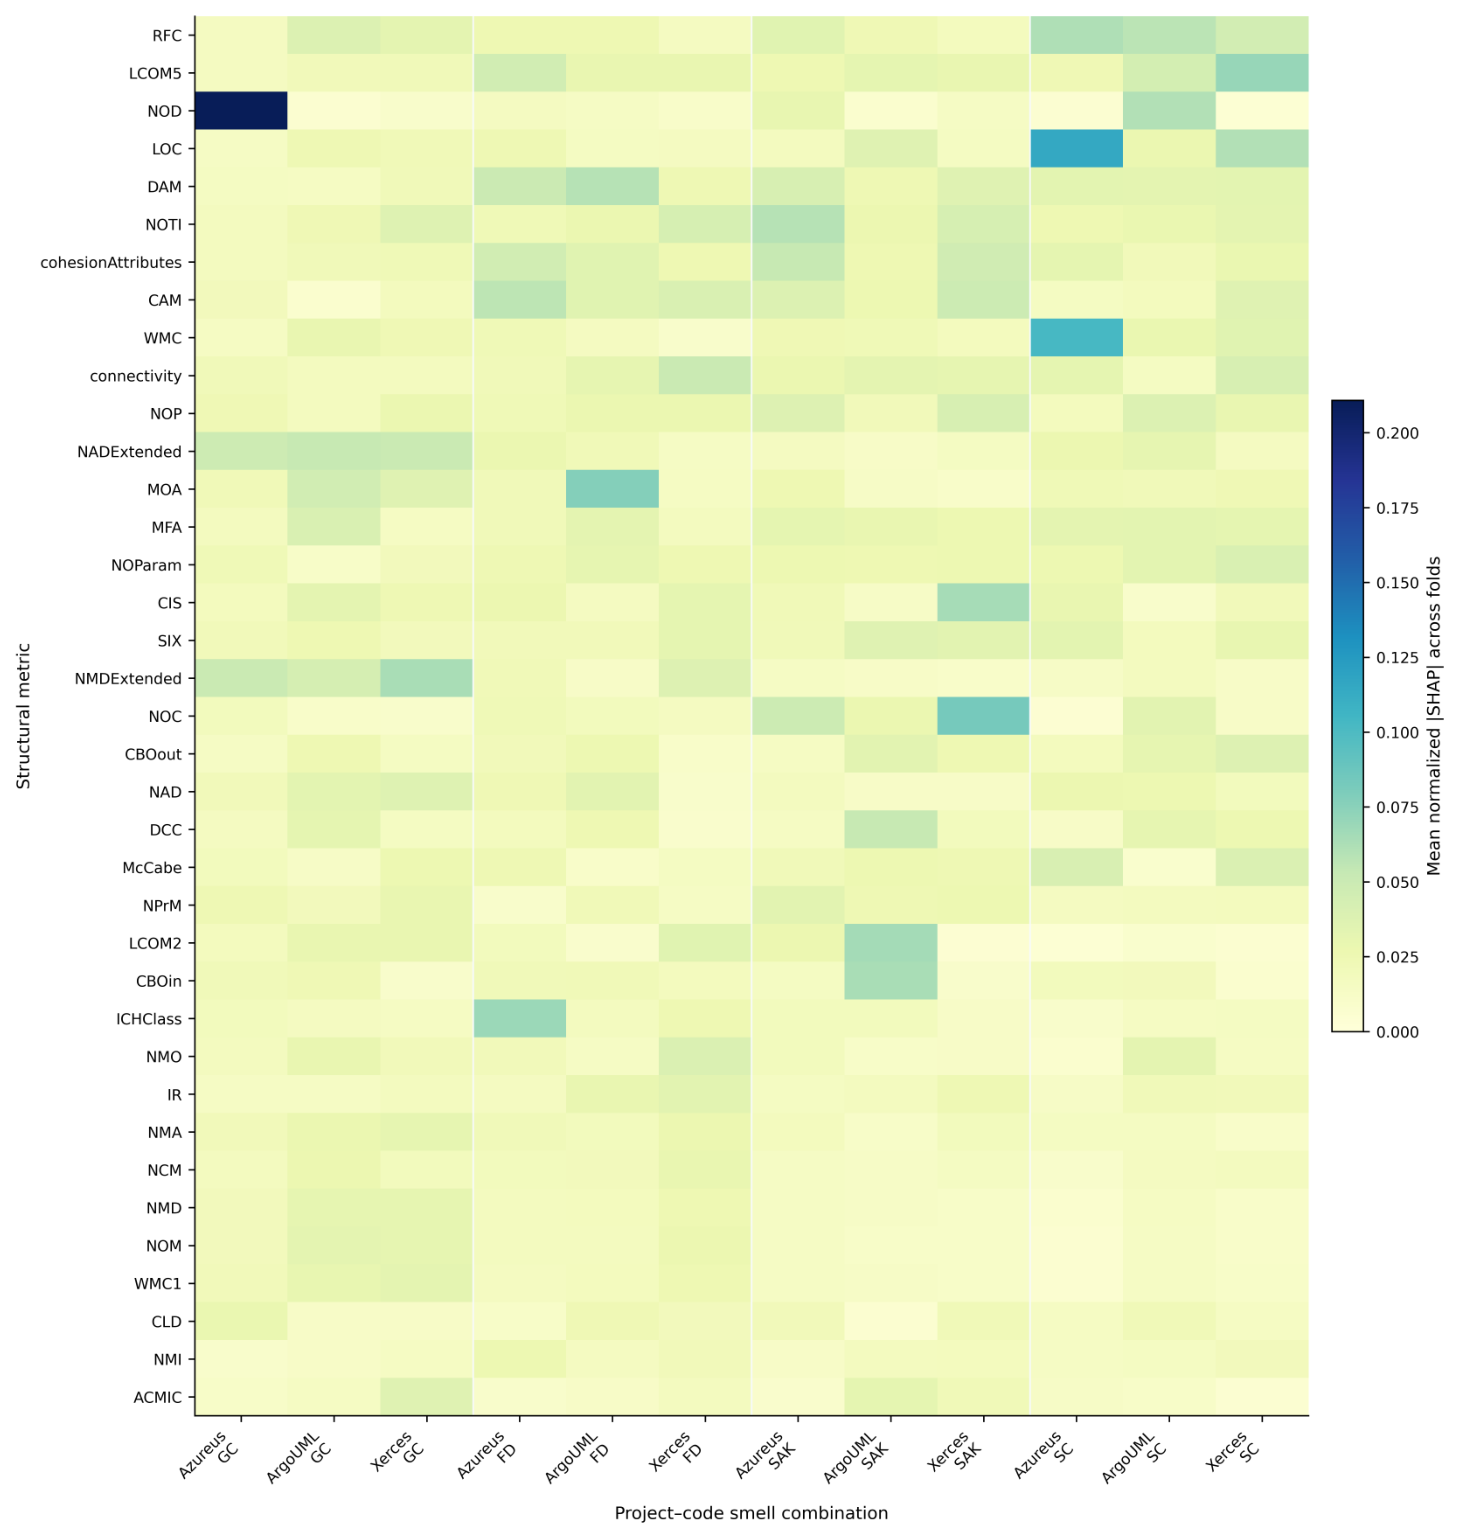
Figure 3.
SHAP importance of structural metrics grouped according to the software property they represent and the evaluated code smell. Color intensity indicates mean normalized SHAP importance, while bubble size represents the number of systems in which each metric belongs to the global Top-5 for the corresponding code smell.
Figure 3.
SHAP importance of structural metrics grouped according to the software property they represent and the evaluated code smell. Color intensity indicates mean normalized SHAP importance, while bubble size represents the number of systems in which each metric belongs to the global Top-5 for the corresponding code smell.
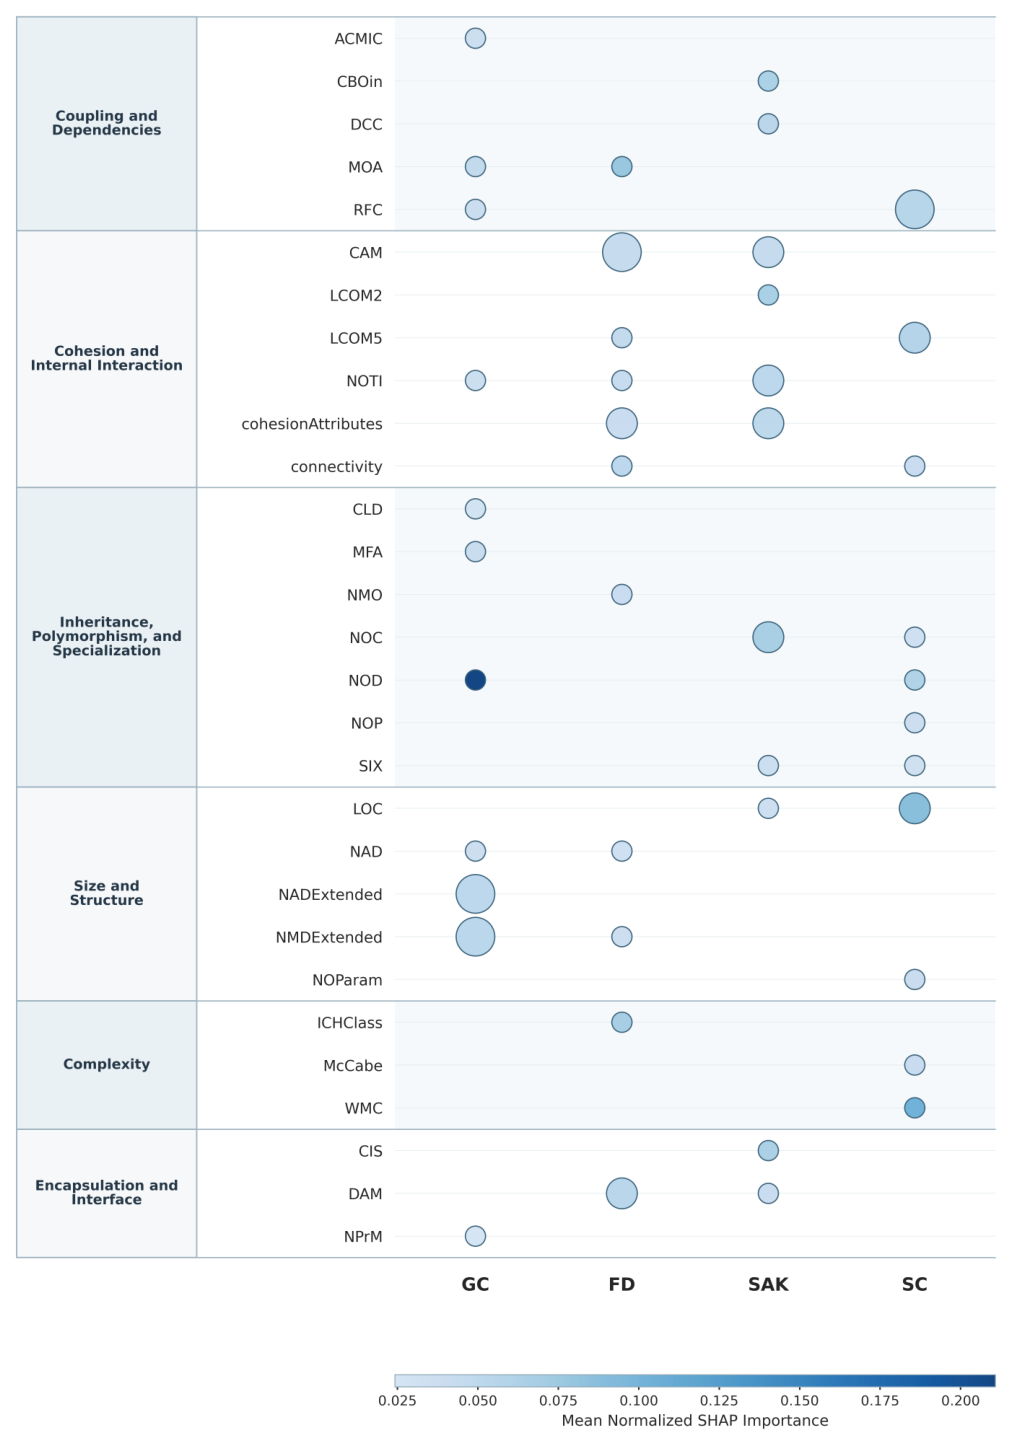
Figure 4.
Persistence of globally relevant SHAP metrics across folds. Each panel reports the fraction of folds in which a metric belongs to the fold-level Top-5 for (a) GC, (b) FD, (c) SAK, and (d) SC.
Figure 4.
Persistence of globally relevant SHAP metrics across folds. Each panel reports the fraction of folds in which a metric belongs to the fold-level Top-5 for (a) GC, (b) FD, (c) SAK, and (d) SC.
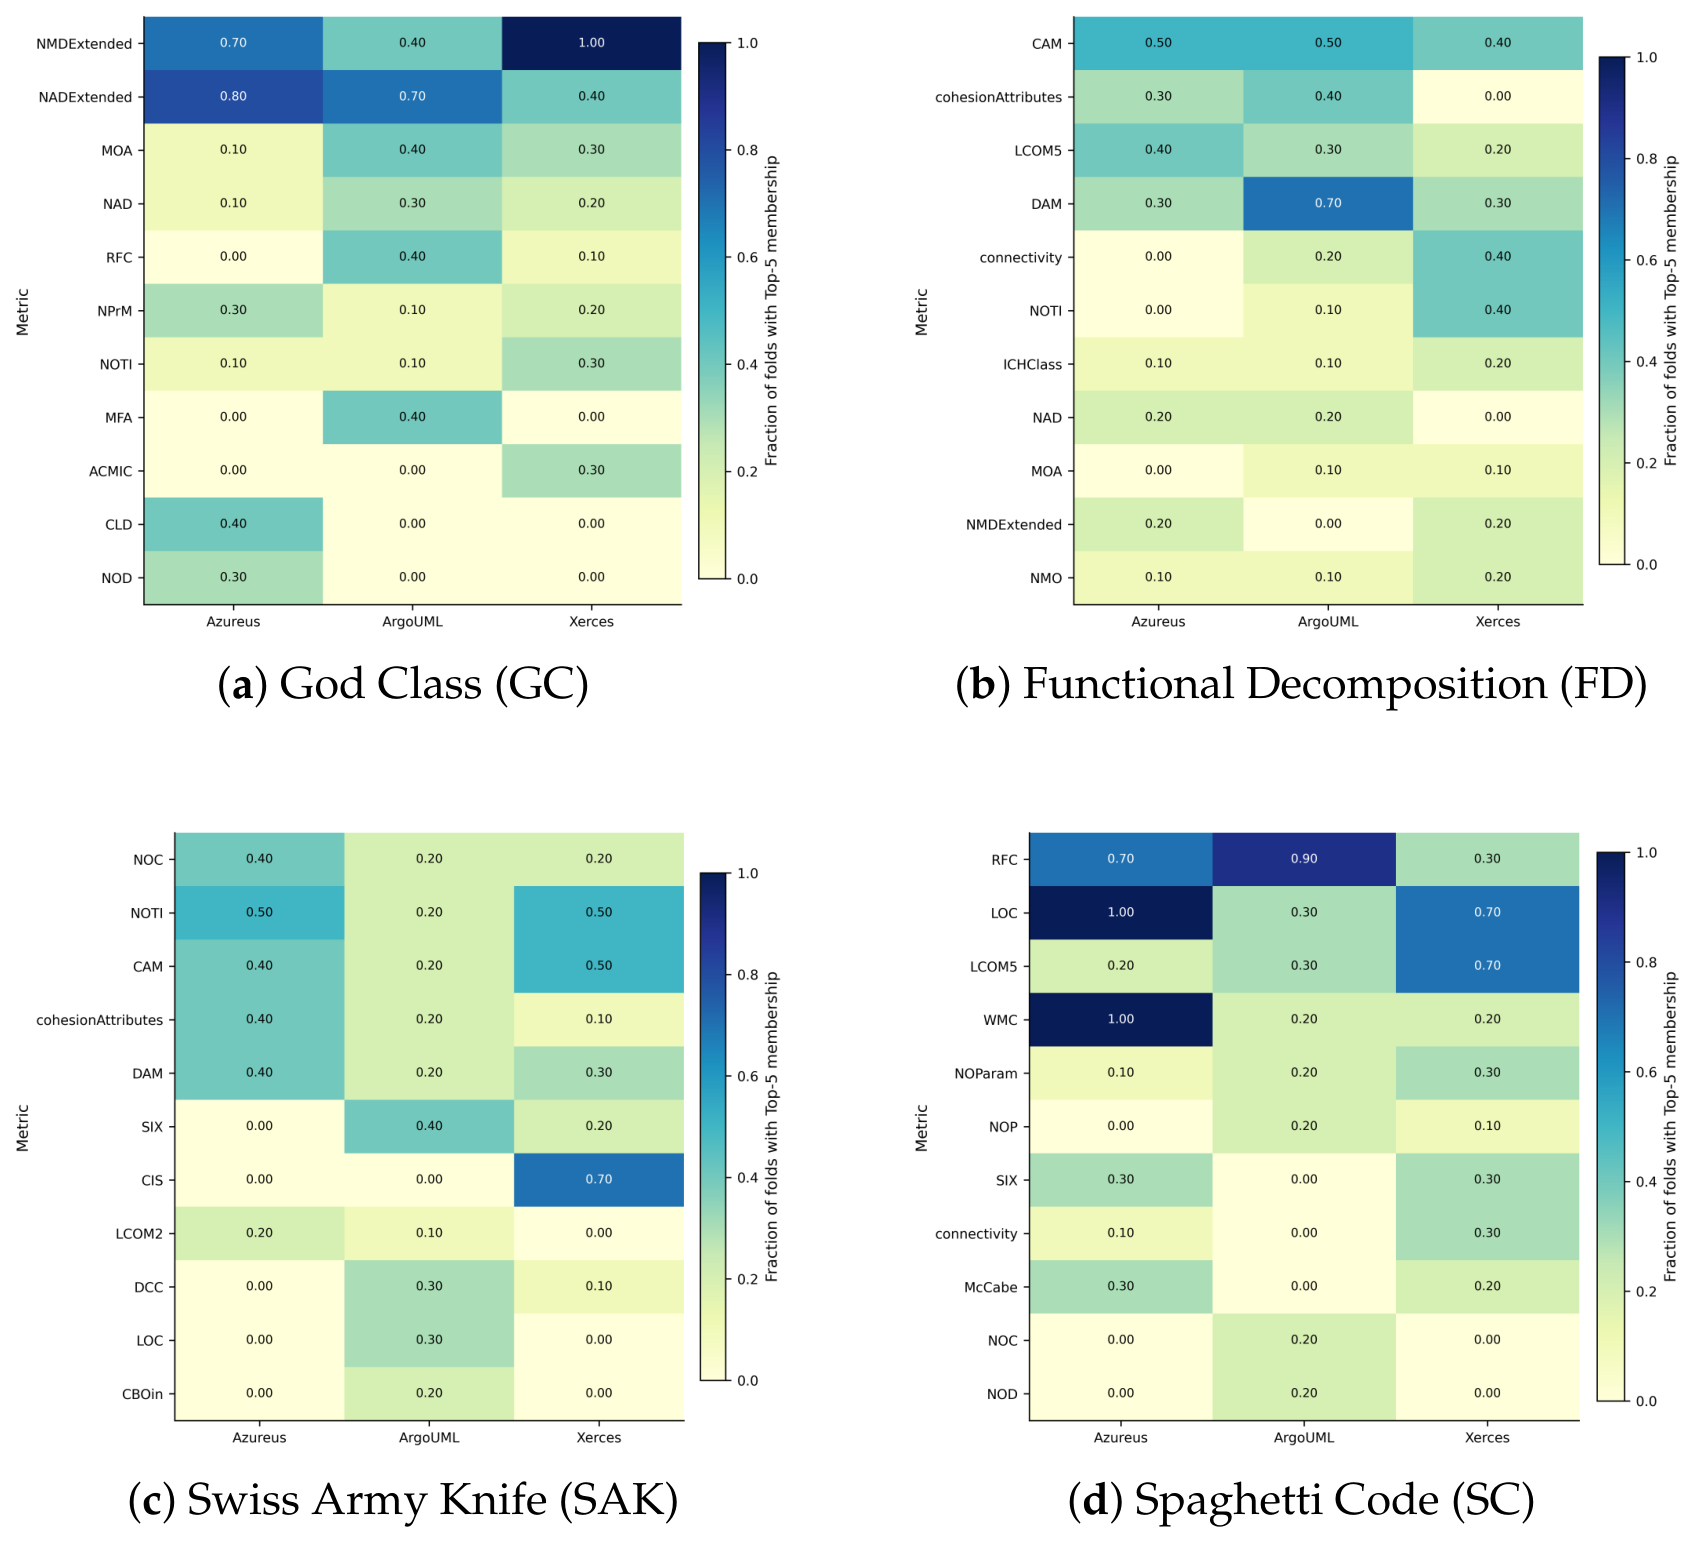
Figure 5.
Concordance between SHAP-based feature rankings and rankings derived from point-biserial associations. Points denote fold medians and horizontal intervals denote Q1–Q3 for (a) Overlap@5, (b) Jaccard@5, and (c) Spearman rank correlation.
Figure 5.
Concordance between SHAP-based feature rankings and rankings derived from point-biserial associations. Points denote fold medians and horizontal intervals denote Q1–Q3 for (a) Overlap@5, (b) Jaccard@5, and (c) Spearman rank correlation.
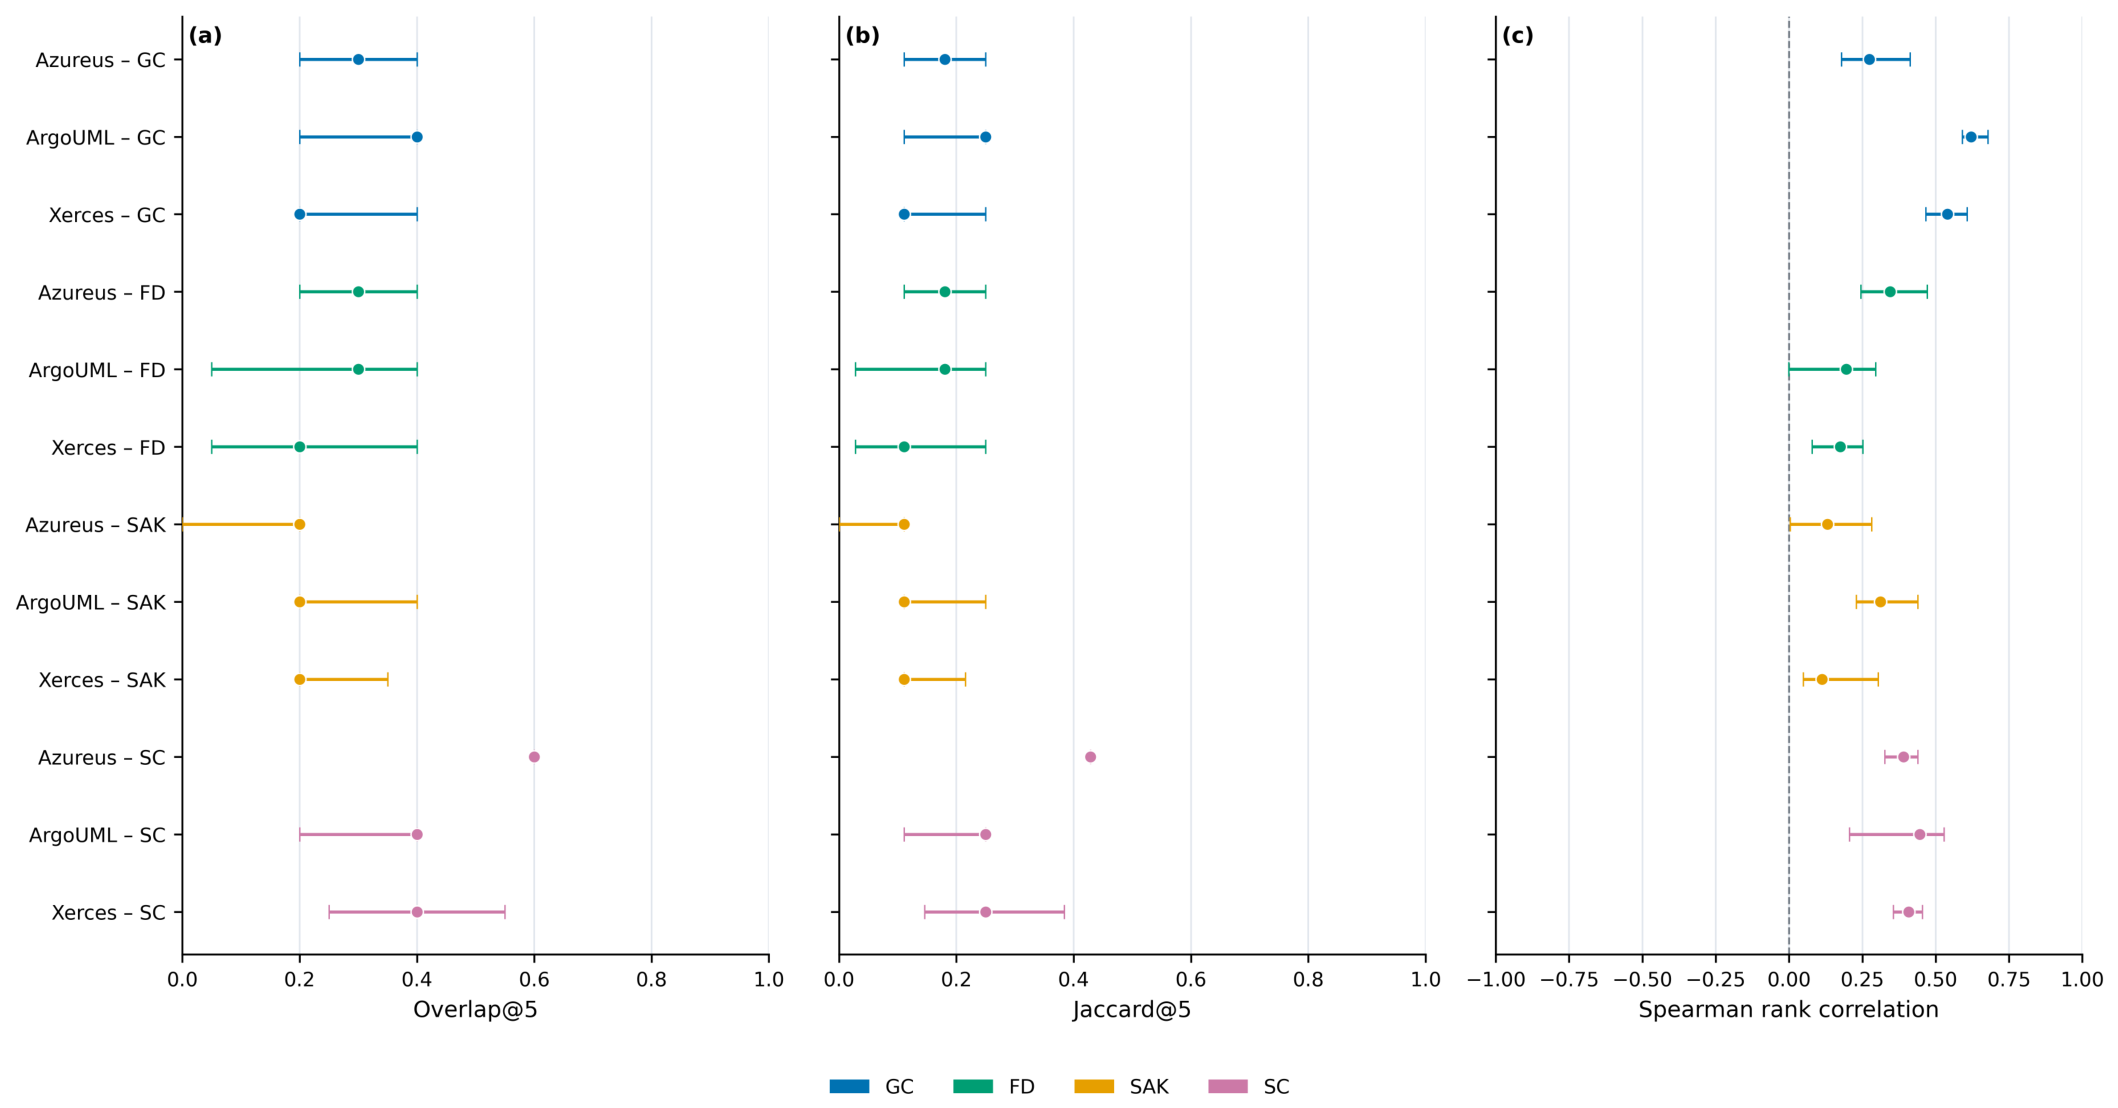
Figure 6.
Coverage of literature-based operationalizations by global Top-5 SHAP metrics. Each cell reports the proportion of evaluable indicators represented among the global Top-5 metrics for the corresponding system. A value of 0.00 indicates an evaluable operationalization for which no mapped indicator belongs to the Top-5; NE denotes an operationalization without an evaluable Ptidej correspondence.
Figure 6.
Coverage of literature-based operationalizations by global Top-5 SHAP metrics. Each cell reports the proportion of evaluable indicators represented among the global Top-5 metrics for the corresponding system. A value of 0.00 indicates an evaluable operationalization for which no mapped indicator belongs to the Top-5; NE denotes an operationalization without an evaluable Ptidej correspondence.
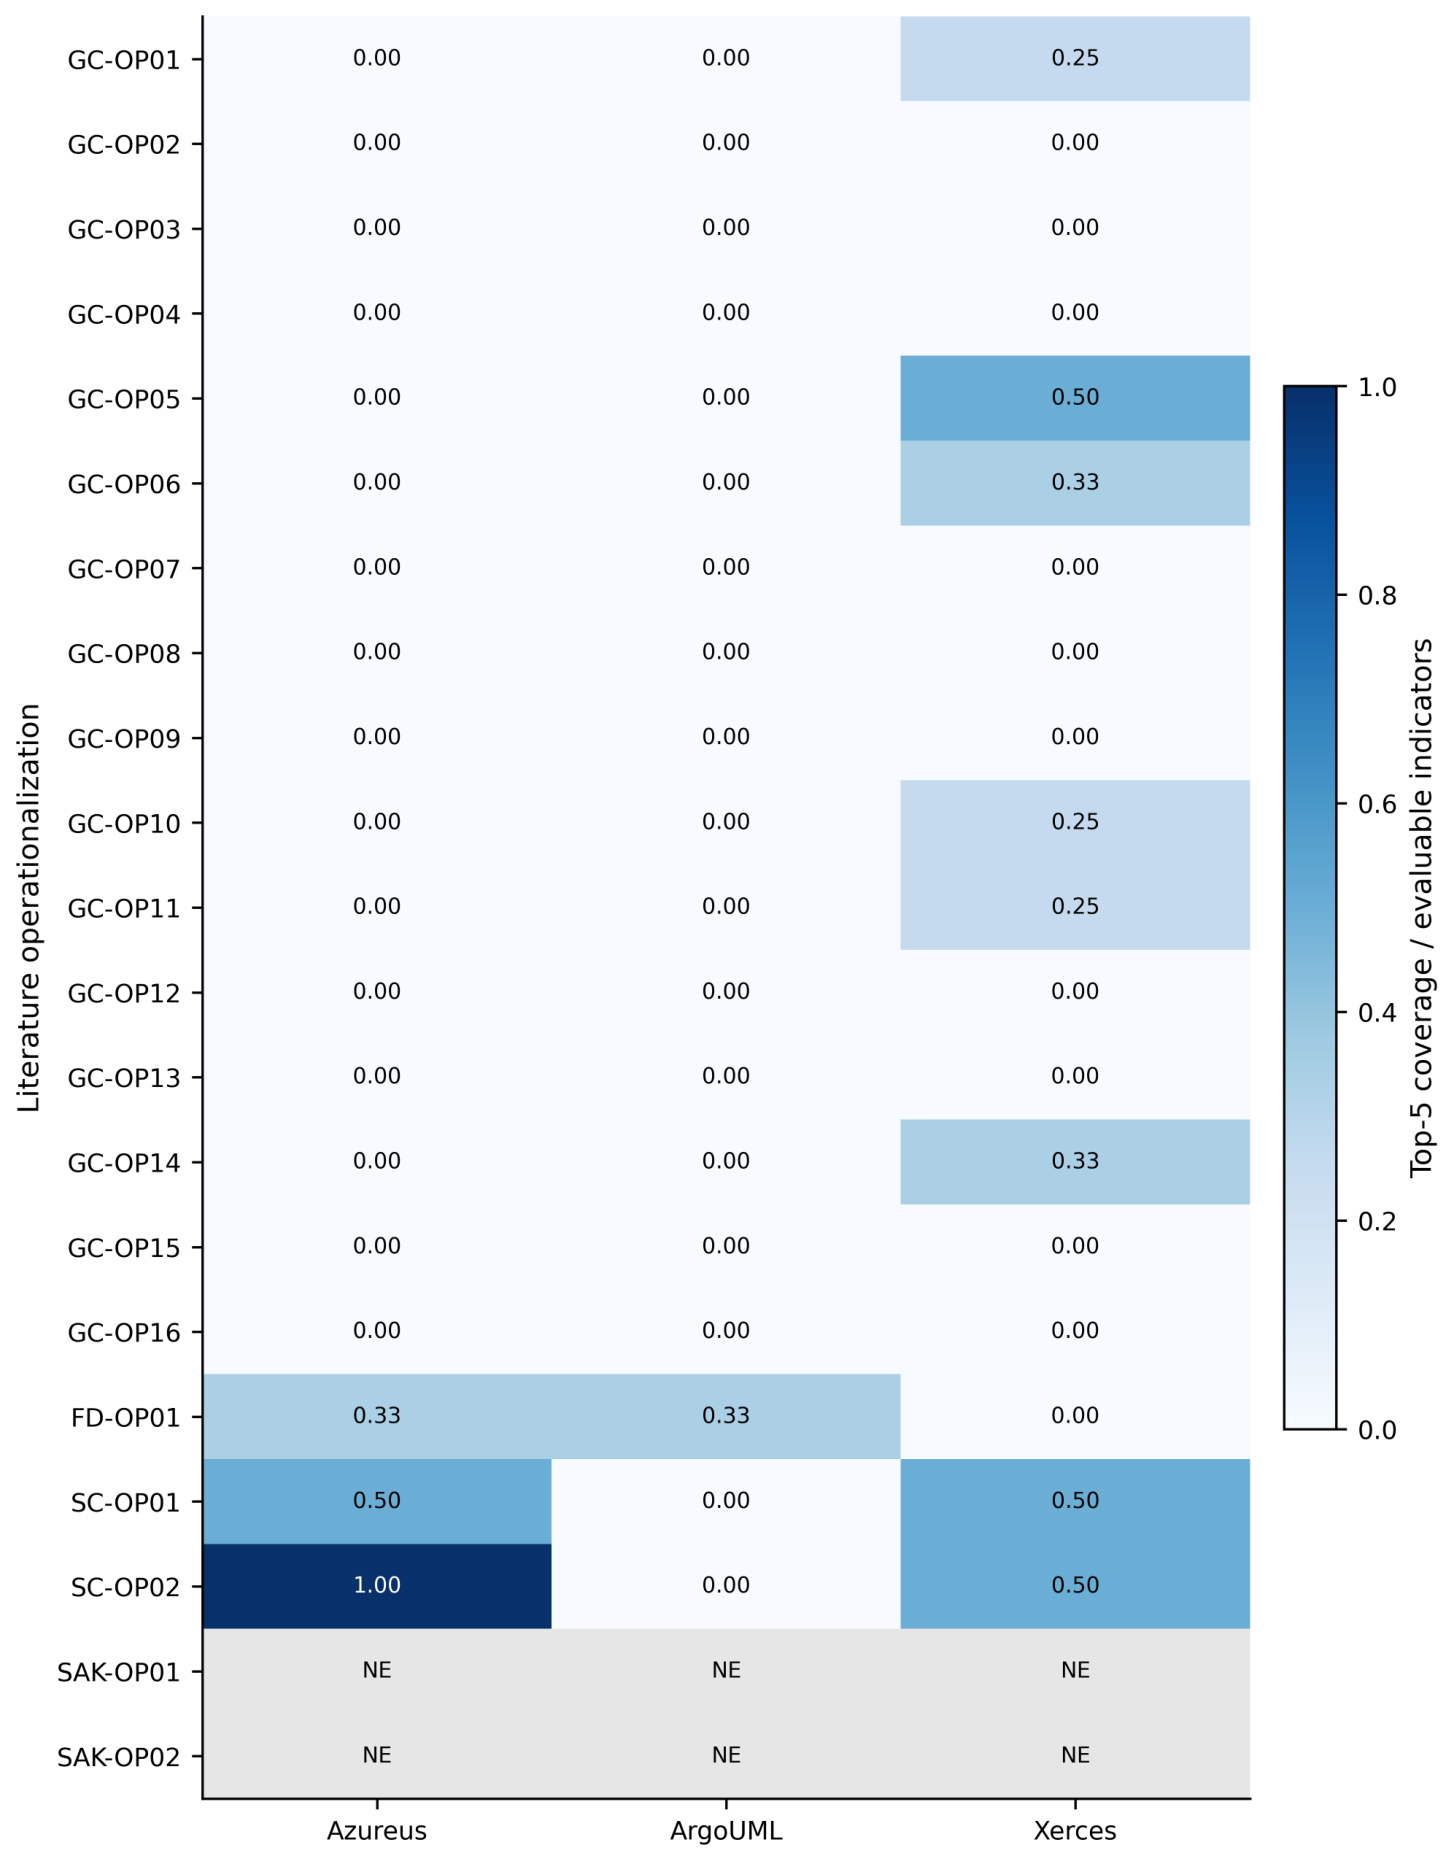
Figure 7.
Directional compatibility between model evidence and literature-based indicators. Rows identify the code smell, literature indicator, and expected direction. Each cell reports the mean fold-level directional compatibility for the corresponding system.
Figure 7.
Directional compatibility between model evidence and literature-based indicators. Rows identify the code smell, literature indicator, and expected direction. Each cell reports the mean fold-level directional compatibility for the corresponding system.
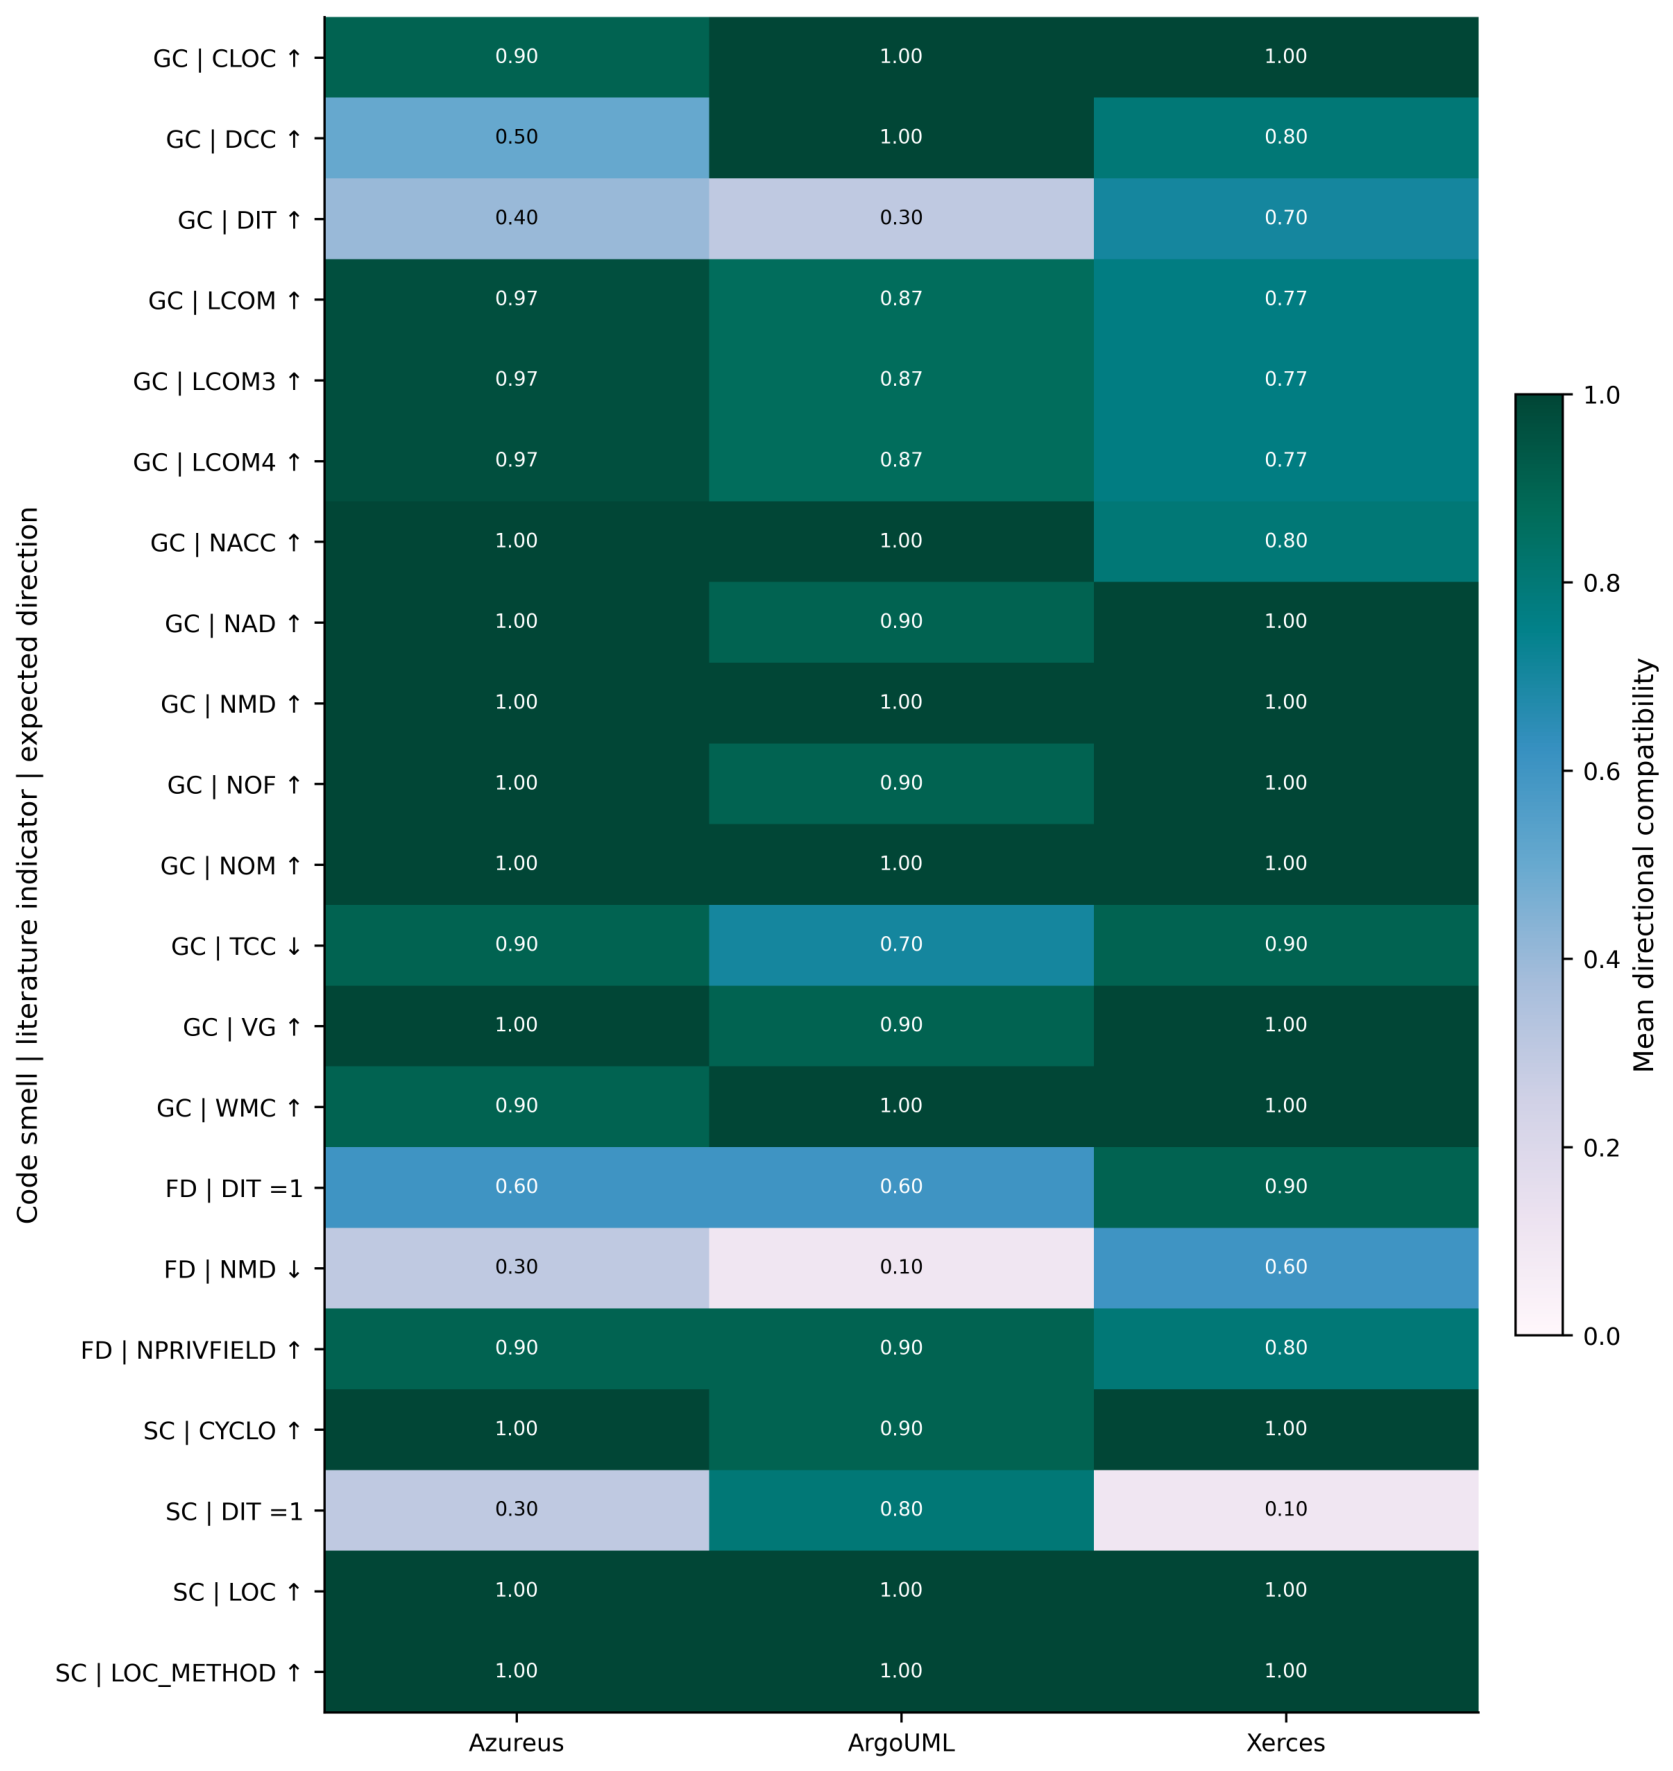

Table 1.
Literature-based operationalizations considered for the selected code smells.
| Code smell | Literature-based operationalization | Study |
|---|---|---|
| GC | GC-OP01. LCOM VERY_HIGH, NMD+NAD VERY_HIGH, NACC VERY_HIGH, LexicClassName, LexicMethodName | [14] |
| GC-OP02. ATFD>2 & WMC≥47 & TCC<0.33 | [39] | |
| GC-OP03. ATFD>5 & WMC≥47 & TCC<0.33 | [40] | |
| GC-OP04. WMC≥47 & TCC<0.3 & ATFD>5 | [41] | |
| GC-OP05. NOM>15 | NOF>15 | [42] | |
| GC-OP06. CLOC>750 | NOM+NOF>20 | [43] | |
| GC-OP07. WMC≥47 & TCC<1/3 & ATFD>5 | [44] | |
| GC-OP08. CLOC≥CLOCV | NOM≥NOMV | [45] | |
| GC-OP09. (CLOC>300 & NLM>5) | DIT>5 | DCC>10 | [46] | |
| GC-OP10. LCOM3>0.8 | LCOM4>1.0 | NOF>20 | NOM>20 | [47] | |
| GC-OP11. LCOM≥Bad & WMC≥Bad & NOF≥Bad & NOM≥Bad | [48] | |
| GC-OP12. (ATFD is in top 20%) & (ATFD>4) & (WMC>20) & (TCC<33%) | [49] | |
| GC-OP13. (CLOC>150) | (NOM>15) | (NCC>3) | [50] | |
| GC-OP14. NOM>20 | NOF>9 | CLOC>750 | [51] | |
| GC-OP15. CLOC>100 | VG>20 | [52] | |
| GC-OP16. ATFD>3 | WMC>Threshold | TCC<0.33 | [13] | |
| FD | FD-OP01. NPRIVFIELD HIGH, NMD VERY_LOW, LexicClassName, DIT=1, NO_POLYMORPHISM | [14] |
| SC | SC-OP01. LOC_METHOD VERY_HIGH, NMNOPARAM VERY_HIGH, USE_GLOBAL_VARIABLE, NO_POLYMORPHISM, DIT=1, LexicClassName | [14] |
| SC-OP02. CYCLO>high, LOC>high | [4] | |
| SAK | SAK-OP01. NINTERF VERY_HIGH | [14] |
| SAK-OP02. NII high | [53] |
Table 2.
Correspondence between literature-based indicators and the structural metrics available in Ptidej.
Table 2.
Correspondence between literature-based indicators and the structural metrics available in Ptidej.
| Literature indicator | Ptidej metric | Correspondence |
|---|---|---|
| LCOM | LCOM1, LCOM2, LCOM5 | Approximate. Ptidej provides several LCOM variants. |
| NMD | NMD | Direct. |
| NAD | NAD | Direct. |
| NACC | CIS | Approximate. NACC counts accessor methods, whereas CIS counts public methods. |
| LexicClassName | – | Unavailable. |
| LexicMethodName | – | Unavailable. |
| ATFD | – | Unavailable. |
| WMC | WMC | Direct. |
| TCC | cohesionAttributes | Approximate. TCC is based on the proportion of method pairs connected through common attributes, whereas cohesionAttributes measures the proportion of class fields used by the declared methods. |
| NOM | NOM | Direct. |
| NOF | NAD | Direct. |
| CLOC | LOC | Approximate. Ptidej LOC is measured at class level. |
| CLOCV | – | Not applicable. It is a comparison value for CLOC rather than an independently measured structural indicator. |
| NOMV | – | Not applicable. It is a comparison value for NOM rather than an independently measured structural indicator. |
| NLM | – | Unavailable. |
| DIT | DIT | Direct. |
| DCC | DCC | Direct. |
| LCOM3 | LCOM1, LCOM2, LCOM5 | Approximate. Ptidej provides other LCOM variants. |
| LCOM4 | LCOM1, LCOM2, LCOM5 | Approximate. Ptidej provides other LCOM variants. |
| NCC | – | Unavailable. |
| VG | McCabe | Direct. |
| NPRIVFIELD | DAM | Approximate. DAM represents the proportion of private and protected fields relative to the total number of fields. |
| NO_POLYMORPHISM | – | Unavailable. |
| LOC_METHOD | LOC | Approximate. Ptidej LOC is measured at class level rather than at method level. |
| NMNOPARAM | – | Unavailable. |
| USE_GLOBAL_VARIABLE | – | Unavailable. |
| CYCLO | McCabe | Approximate. The Ptidej metric aggregates the complexity of the operations belonging to the entity. |
| LOC | LOC | Direct. |
| NINTERF | – | Unavailable. |
| NII | – | Unavailable. |
Table 3.
Overall predictive performance of the Grid Search SVM configurations reported in the previous study [32].
Table 3.
Overall predictive performance of the Grid Search SVM configurations reported in the previous study [32].
| System | Accuracy | Precision | Recall | F1-score |
|---|---|---|---|---|
| Azureus | 0.816 | 0.794 | 0.855 | 0.826 |
| ArgoUML | 0.773 | 0.774 | 0.785 | 0.777 |
| Xerces | 0.851 | 0.822 | 0.898 | 0.857 |
Table 4.
Cross-system consistency of global Top-5 SHAP metrics. Values indicate the global SHAP rank within each system; “–” indicates that the metric was not included in the corresponding system-level Top-5.
Table 4.
Cross-system consistency of global Top-5 SHAP metrics. Values indicate the global SHAP rank within each system; “–” indicates that the metric was not included in the corresponding system-level Top-5.
| Code smell | Metric | Azureus | ArgoUML | Xerces |
|---|---|---|---|---|
| GC | NADExtended | 3 | 1 | 2 |
| NMDExtended | 2 | 3 | 1 | |
| NOD | 1 | – | – | |
| MOA | – | 2 | – | |
| NAD | – | – | 3 | |
| CLD | 4 | – | – | |
| MFA | – | 4 | – | |
| NOTI | – | – | 4 | |
| ACMIC | – | – | 5 | |
| NPrM | 5 | – | – | |
| RFC | – | 5 | – | |
| FD | CAM | 2 | 3 | 3 |
| DAM | 3 | 2 | – | |
| cohesionAttributes | 4 | 4 | – | |
| ICHClass | 1 | – | – | |
| MOA | – | 1 | – | |
| connectivity | – | – | 1 | |
| NOTI | – | – | 2 | |
| NMO | – | – | 4 | |
| LCOM5 | 5 | – | – | |
| NAD | – | 5 | – | |
| NMDExtended | – | – | 5 | |
| SAK | NOC | 3 | – | 1 |
| NOTI | 1 | – | 5 | |
| cohesionAttributes | 2 | – | 4 | |
| CAM | 5 | – | 3 | |
| LCOM2 | – | 1 | – | |
| CBOin | – | 2 | – | |
| CIS | – | – | 2 | |
| DCC | – | 3 | – | |
| DAM | 4 | – | – | |
| SIX | – | 4 | – | |
| LOC | – | 5 | – | |
| SC | RFC | 3 | 2 | 3 |
| LOC | 1 | – | 2 | |
| LCOM5 | – | 3 | 1 | |
| NOD | – | 1 | – | |
| WMC | 2 | – | – | |
| McCabe | 4 | – | – | |
| NOP | – | 4 | – | |
| connectivity | – | – | 4 | |
| NOC | – | 5 | – | |
| NOParam | – | – | 5 | |
| SIX | 5 | – | – |
Table 5.
Fold-level SHAP–correlation concordance by system and code smell. Values are reported as median [Q1, Q3] across the ten folds.
Table 5.
Fold-level SHAP–correlation concordance by system and code smell. Values are reported as median [Q1, Q3] across the ten folds.
| System | Smell | Overlap@5 | Jaccard@5 | Spearman |
|---|---|---|---|---|
| ArgoUML | FD | 0.300 [0.050, 0.400] | 0.181 [0.028, 0.250] | 0.195 [-0.002, 0.295] |
| Azureus | FD | 0.300 [0.200, 0.400] | 0.181 [0.111, 0.250] | 0.344 [0.245, 0.471] |
| Xerces | FD | 0.200 [0.050, 0.400] | 0.111 [0.028, 0.250] | 0.175 [0.079, 0.252] |
| ArgoUML | GC | 0.400 [0.200, 0.400] | 0.250 [0.111, 0.250] | 0.621 [0.590, 0.678] |
| Azureus | GC | 0.300 [0.200, 0.400] | 0.181 [0.111, 0.250] | 0.274 [0.178, 0.413] |
| Xerces | GC | 0.200 [0.200, 0.400] | 0.111 [0.111, 0.250] | 0.540 [0.466, 0.607] |
| ArgoUML | SAK | 0.200 [0.200, 0.400] | 0.111 [0.111, 0.250] | 0.312 [0.229, 0.439] |
| Azureus | SAK | 0.200 [0.000, 0.200] | 0.111 [0.000, 0.111] | 0.130 [0.003, 0.282] |
| Xerces | SAK | 0.200 [0.200, 0.350] | 0.111 [0.111, 0.215] | 0.112 [0.048, 0.303] |
| ArgoUML | SC | 0.400 [0.200, 0.400] | 0.250 [0.111, 0.250] | 0.446 [0.206, 0.528] |
| Azureus | SC | 0.600 [0.600, 0.600] | 0.429 [0.429, 0.429] | 0.391 [0.326, 0.439] |
| Xerces | SC | 0.400 [0.250, 0.550] | 0.250 [0.146, 0.384] | 0.408 [0.355, 0.455] |
Table 6.
Literature-based operationalization coverage and directional compatibility. Each system cell reports Top-5 coverage / mean directional compatibility. NE indicates that the operationalization contained no indicators with a direct or approximate correspondence in the available Ptidej metric space and was therefore not evaluable.
Table 6.
Literature-based operationalization coverage and directional compatibility. Each system cell reports Top-5 coverage / mean directional compatibility. NE indicates that the operationalization contained no indicators with a direct or approximate correspondence in the available Ptidej metric space and was therefore not evaluable.
| Code smell | Operationalization | Azureus | ArgoUML | Xerces |
|---|---|---|---|---|
| GC | GC-OP01 | 0.00 / 0.99 | 0.00 / 0.94 | 0.25 / 0.89 |
| GC | GC-OP02 | 0.00 / 0.90 | 0.00 / 0.85 | 0.00 / 0.95 |
| GC | GC-OP03 | 0.00 / 0.90 | 0.00 / 0.85 | 0.00 / 0.95 |
| GC | GC-OP04 | 0.00 / 0.90 | 0.00 / 0.85 | 0.00 / 0.95 |
| GC | GC-OP05 | 0.00 / 1.00 | 0.00 / 0.95 | 0.50 / 1.00 |
| GC | GC-OP06 | 0.00 / 0.97 | 0.00 / 0.97 | 0.33 / 1.00 |
| GC | GC-OP07 | 0.00 / 0.90 | 0.00 / 0.85 | 0.00 / 0.95 |
| GC | GC-OP08 | 0.00 / 0.95 | 0.00 / 1.00 | 0.00 / 1.00 |
| GC | GC-OP09 | 0.00 / 0.60 | 0.00 / 0.77 | 0.00 / 0.83 |
| GC | GC-OP10 | 0.00 / 0.98 | 0.00 / 0.91 | 0.25 / 0.88 |
| GC | GC-OP11 | 0.00 / 0.97 | 0.00 / 0.94 | 0.25 / 0.94 |
| GC | GC-OP12 | 0.00 / 0.90 | 0.00 / 0.85 | 0.00 / 0.95 |
| GC | GC-OP13 | 0.00 / 0.95 | 0.00 / 1.00 | 0.00 / 1.00 |
| GC | GC-OP14 | 0.00 / 0.97 | 0.00 / 0.97 | 0.33 / 1.00 |
| GC | GC-OP15 | 0.00 / 0.95 | 0.00 / 0.95 | 0.00 / 1.00 |
| GC | GC-OP16 | 0.00 / 0.90 | 0.00 / 0.85 | 0.00 / 0.95 |
| FD | FD-OP01 | 0.33 / 0.60 | 0.33 / 0.53 | 0.00 / 0.77 |
| SC | SC-OP01 | 0.50 / 0.65 | 0.00 / 0.90 | 0.50 / 0.55 |
| SC | SC-OP02 | 1.00 / 1.00 | 0.00 / 0.95 | 0.50 / 1.00 |
| SAK | SAK-OP01 | NE | NE | NE |
| SAK | SAK-OP02 | NE | NE | NE |
Disclaimer/Publisher’s Note: The statements, opinions and data contained in all publications are solely those of the individual author(s) and contributor(s) and not of MDPI and/or the editor(s). MDPI and/or the editor(s) disclaim responsibility for any injury to people or property resulting from any ideas, methods, instructions or products referred to in the content. |
© 2026 by the authors. Licensee MDPI, Basel, Switzerland. This article is an open access article distributed under the terms and conditions of the Creative Commons Attribution (CC BY) license (http://creativecommons.org/licenses/by/4.0/).
Copyright: This open access article is published under a Creative Commons CC BY 4.0 license, which permit the free download, distribution, and reuse, provided that the author and preprint are cited in any reuse.