

Submitted:
18 October 2026
Posted:
20 October 2026
You are already at the latest version
Abstract
The "Mpemba effect" is the name given to the assertion that hot water may freeze faster than cool water. This counterintuitive statement seemingly breaches fundamental laws of physical chemistry; however, numerous experiments with classical and quantum systems have apparently confirmed it, sparking debate in prominent scientific journals. Here we report on water freezing experiments conducted under carefully controlled conditions; they show that the Mpemba effect in water freezing exists as a stochastic, that is, accidental, rather than deterministic phenomenon, which – as the theory shows – is due to the fundamental uncertainty in the onset time of a first-order phase transition (like freezing) close to the temperature of nucleation of this transition. This uncertainty results in a huge scattering of freezing onset times (both for initially cool and initially hot water), so that, close to the temperature of ice nucleation, initially hot water sometimes freezes faster and sometimes slower than initially cool water (whereas at lower temperatures, this almost never happens). We anticipate our assay to be a starting point for reconsidering the famous Mpemba paradox in freezing water and other systems undergoing first-order phase transitions.
Keywords:
Mpemba effect
; first-order phase transition
; water super-cooling
; ice nucleation
; ice-binding surfaces
; temperature
; single-event phenomenon
; accidental phenomenon
; freezing
; uncertainty in freezing time
1. Introduction
Nearly 60 years ago, the surprising claim that “the water that starts hotter may freeze first” was dubbed the Mpemba effect [1]; the classical Mpemba effect implies that, under certain conditions, any (or almost any) vial of hot water freezes before any (or almost any) vial of cool water. Similar counterintuitive phenomena, seemingly defying basic physics and chemistry, have since been observed in liquids, polymers, clathrate hydrates, colloids, and even quantum systems [2,3,4,5,6,7,8,9,10,11,12,13,14,15] and discussed in many theoretical studies [8,9,11,13,16,17,18,19,20,21,22,23,24,25,26,27,28,29,30,31,32,33]. This reflects burgeoning research on this effect, which is of interest to chemists in various areas, highlights that the underlying physicochemical mechanisms remain elusive [31], and that even the seemingly simple process of water freezing is not fully understood.
Our water freezing experiments demonstrate that the Mpemba effect in freezing occurs stochastically, accidentally, and only when the freezer temperature is very close to that of ice nucleation. As the theory shows, all this is due to the stochastic uncertainty in the timing of ice nucleation, this first-order phase transition, and does not require any hypothesis about any special freezing mechanism or “water memory”.
2. Results
2.1. Experiment
To clarify the basis of the in-water Mpemba paradox, we conducted experiments replicating previously reported studies on water freezing [1,2,3,4,7,15] under carefully controlled conditions (see Materials and Methods and Supplementary Materials 1).
Consistent with seminal studies [1,3], we focused [34] on the onset of freezing, rather than on the complete freezing of ice or the cooling of water to 0 °C. The latter is suggested by careful experiments on water cooling to 0 ℃ without freezing [4], which show that hot water does not cool faster than cold water. This allowed us to neglect water evaporation [35,36] (especially since in our, as well as in some other [1,2,3,4] experiments, the water samples were kept in closed vials), and convection [37,38] as causes of the Mpemba effect, and focus on the phase transition that apparently drives this effect in various systems, including milk [1], water [1,2,15], clathrate hydrates [5], and polymers [6].
Figure 1 shows the dynamics of cooling and freezing of water samples (placed in closed vials) at different thermostat temperatures Tth.
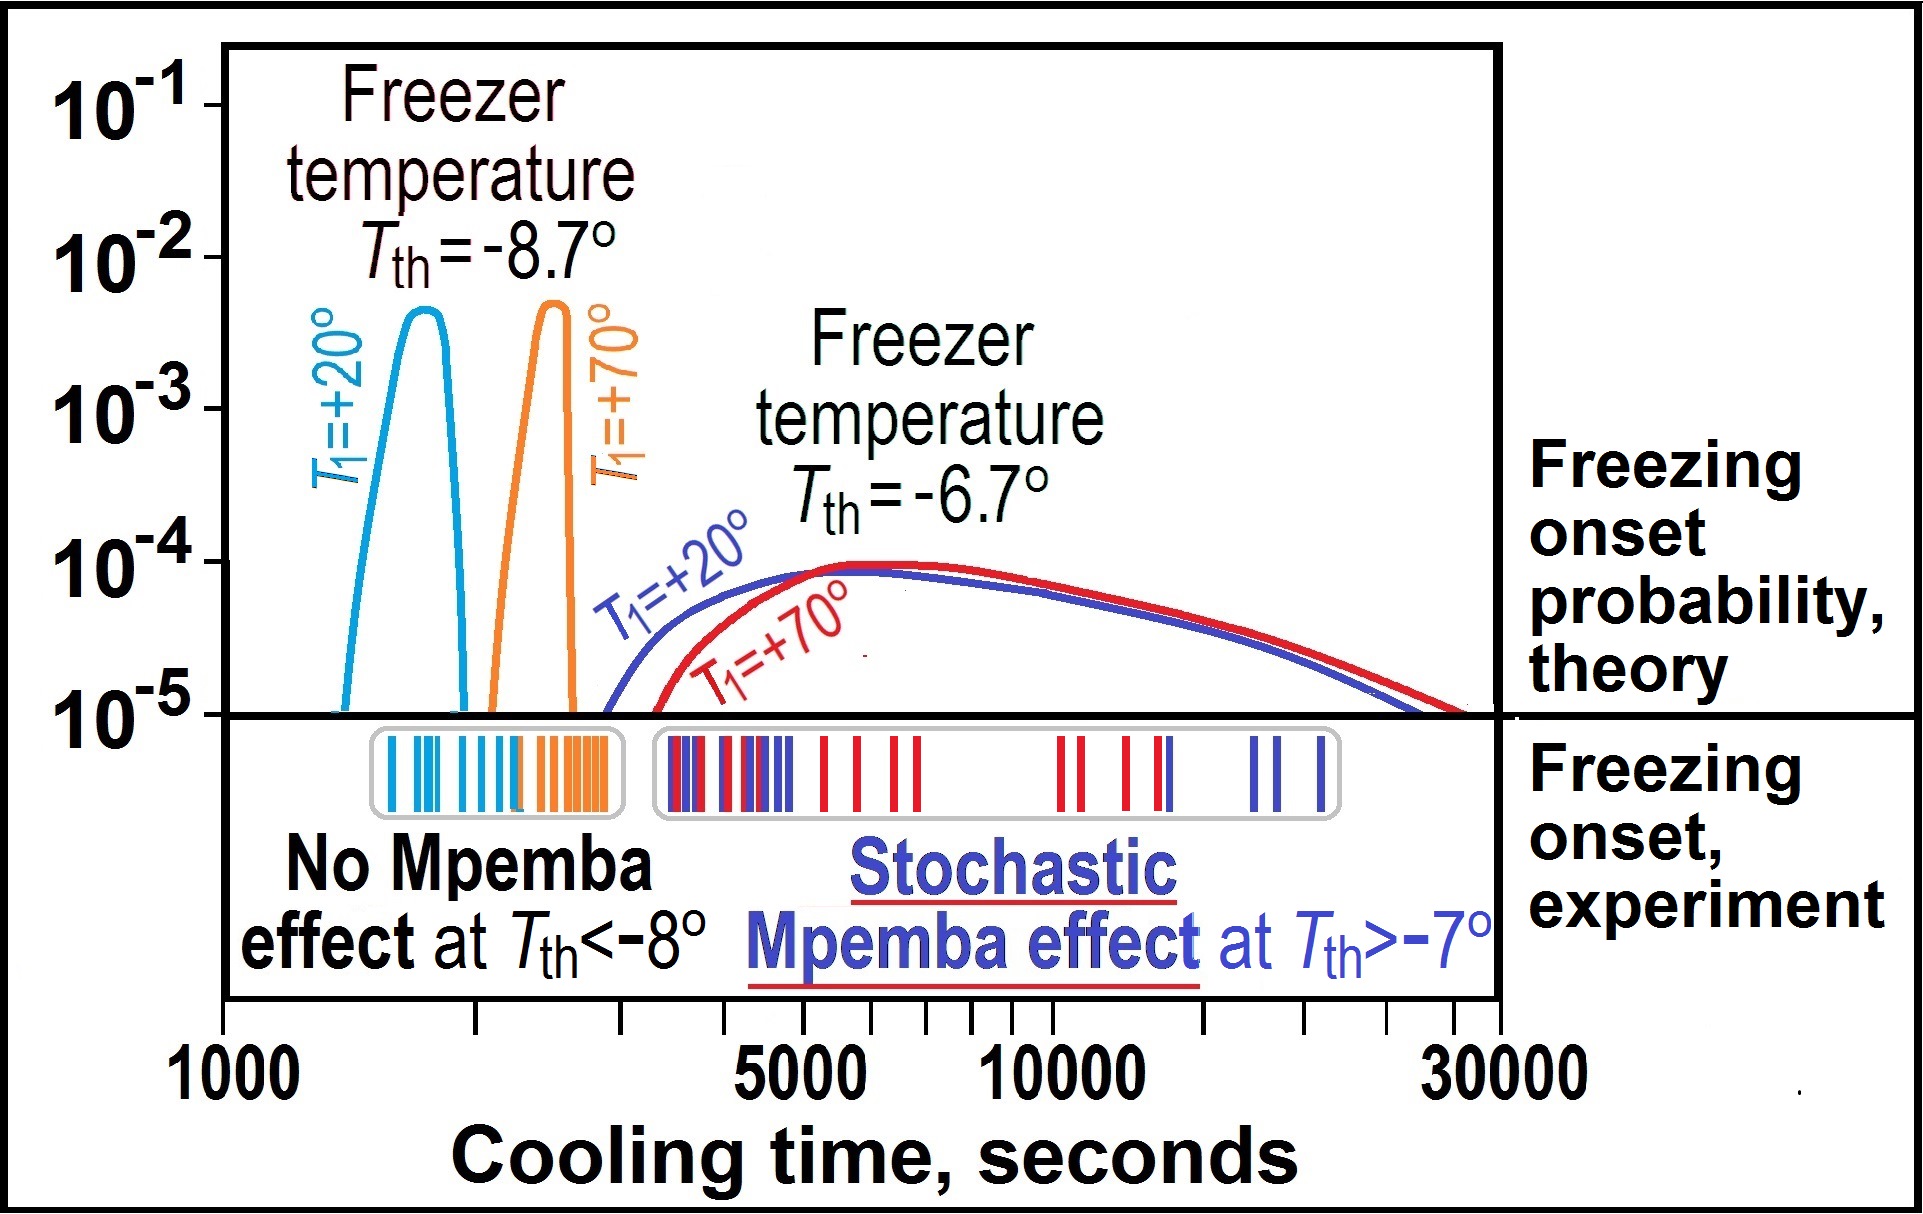
In each experiment, the four “cool” water samples started at +20 °C, and the four “hot” ones started at +70 °C; all of these were positioned in the freezer simultaneously. When cooling, all samples of the initially hot water reached 0 °C approximately 500 seconds later than all samples of the initially cool water (which agrees with Ref. 4); with further cooling at Tth>-7 °C, some samples of the initially hot water froze earlier, and some later, than the samples of the initially cool water, but at Tth<-8 °C all the samples of the initially hot water froze later than all the samples of the initially cool water.
The main panel of Figure 1a illustrates the full temperature evolution in one experiment with 8 water samples at a thermostat temperature Tth above -7 °C, while the main panel of Figure 1b illustrates the full temperature evolution at a thermostat temperature Tth below -8 °C. The insets in panels 1(a) and 1(b) show the low-temperature dynamics of the behavior of water samples in two other experiments (among many others; see Table 1a and Table 1b) conducted at thermostat temperatures above -7 °C (a) and below -8 °C (b).
Table 1a and 1b present detailed data on the cooling and freezing of all initially hot and cool water samples at different thermostat temperatures Tth.
At the freezer temperature Tth≥-7.2 °C (panel 1(a) and Table 1a), one can see a large variation in freezing onset times indicated by sharp temperature increases [39]. For the “initially cool” (+20 °C) and “initially hot” (+70 °C) water samples, the ranges of the onset times do overlap, so that at this relatively high Tth (-7.2 °C and higher) the Mpemba effect is observed, but it is stochastic– it is observed for some pairs of samples, but not for the others.
After each experiment (for Tth≥-7.2 °C, we conducted 9 experiments with 4 “initially hot” and 4 “ initially cool” water samples; see Table 1a) we did 16 comparisons of these 4 “hot” and 4 “cool” samples; the comparisons were not entirely independent, as we were dealing with only 8 independent figures; however, the ratio of the sums of the resulting figures—shown in the last two columns—provides a simple, general overview of the relationship between the “hot freezes before cool” and the “cool freezes before hot” cases. In total, we had 4×4×9 = 144 comparisons. The Mpemba effect (the “hot” sample freezes first) occurred in 39% of the cases. For example, the main panel of Figure 1a shows that “hot” samples 1h – 4h begin to freeze earlier than “cool” samples 1c, 3c, but later than the “cool” sample 2c.
Conversely, at Tth<-8 °C (panel 1(b) and Table 1b), one can see a small variation in freezing onset times. For the +20 °C and +70 °C samples, the onset times practically do not overlap, so that initially cool water virtually always (in 170 cases out of 176) freezes first (and below -10 °C, initially cool water always freezes first), so that at the low Tth (below -8 °C) the Mpemba effect is practically not observed. This is proved by 4×4×11 = 176 comparisons of 4 “initially hot” and 4 “ initially cool” water samples (the caveat made earlier—that these comparisons are not entirely independent—does not alter this general conclusion).
Thus, our water freezing experiments highlight (i) the stochastic nature of the onset of freezing, especially at Tth>-7 °C, and (ii) the significant role of the “not very cold” (-7.2 °C and higher) freezer temperature Tth in inducing this stochastic Mpemba effect.
Previous experimental papers have sometimes hinted at the stochastic, accidental nature of the Mpemba effect, using cautious phrases such as “the water that starts hotter may freeze first” [1] or “hot water may well begin to freeze quicker than cold” [13], but no comprehensive investigation into this critical aspect of the Mpemba effect related to ice nucleation has been reported.
Here, we will outline and try to explain the conditions under which the stochasticity in ice nucleation time sometimes leads to the observation of the Mpemba effect.
It should be noted that the statement about the stochasticity of the Mpemba effect applies only to events involving first-order phase transitions (see below). Systems without these transitions, such as colloids [8,11], some quantum [13,14,29,30,32] and mechanical [40,41] systems, can exhibit a deterministic rather than stochastic Mpemba effect.
2.2. Theory
The freezer temperature Tth impacts both freezing and cooling rates.
The latter, according to Newton’s law of thermal conductivity, can be described as
here,
dTt/dt = −(Tt − Tth);
is the thermal conductivity coefficient attributed to the surroundings of the water sample (having temperature Tt), and t is time. This equation implies that d[ln(Tt − Tth)] = −dt; so,
where T1 > Tth represents the temperature of the sample at the initial moment (t1=0) of the cooling. Thus, the time required for the sample to cool from T1 to Tt is
here, ~0.002 s−1 corresponds to cooling by a freezer set at Tth of about −5 − 15 ℃ (as in our experiments and in seminal works [1,2], where cooling from T1 ≈+80 ℃ to Tt ≈+20 ℃ took about 10 minutes).
Tt − Tth = (T1 − Tth)exp(−t),
This ~0.002 s−1 estimate will be used throughout our study for both “initially hot” and “initially cool” water samples without fitting to each cooling trace, since the exact value of
is not crucial for understanding the nature of the Mpemba effect.
The water freezing can start only when Tt becomes sufficiently [2,39,42] below T0≡273 oК, i.e., 0 ℃.
According to the conventional Gibbs transition state theory for first-order phase transitions [39,43,44,45] (like water freezing), the time of appearance of an ice nucleus (corresponding to the most unstable, i.e., transition state during ice formation) around one given H2O molecule in pure, still water can be estimated as
Here, is the free energy of the ice nucleus at temperature T<T0; kB is the Boltzmann constant; τ is the typical time for one H2O molecule to attach to ice. The value of τ is no less than τ0~10-12 s (the typical time [45] of thermal vibrations at 0 ℃); but, in fact, τ is estimated (see [45], chs. 3.2, 8.2) from the difference between the rates of H2O molecule attachment to and detachment from ice. The final estimate of τ also includes the “Zeldovich factor”, i.e., the number of steps spent to cross the top of the activating barrier, and the number of possible parallel nucleus growth pathways [42,46]. With only the dominant terms considered [42,45,46], τ~10-7 s at “normal” sub-zero temperatures (). This value of τ depends on temperature, but much less than , which rapidly tends toward infinity as the temperature T approaches 0 ℃ (so that the water freezing temperature must be strictly below 0 ℃ for kinetic reasons [39,42]).
The free energy is very large for a 3-dimensional (3D) ice nucleus in bulk water [42], where ice, for kinetic reasons, arises only below -35 ℃ [47].
However, the 2-dimensional (2D) ice nucleus on an ice-binding surface has a smaller ; thus, ice can arise [42] on an ice-binding border of water at negative temperatures closer to 0 ℃. Then can be estimated as [42,45], where Δμ(T) is the chemical potential of H2O in ice minus that in water (so that ∆μ(T0)=0, and ∆μ(T)<0 at T<T0, where , see [45], with data taken from [49]), and B2 is the additional free energy of an ice molecule at the ice/water interface; B3≈0.85 kBT0 for a 3D ice/water interface [49] (see also [45], with data from [48]); this estimate seems to remain more or less valid for the perimeter of a 2D ice layer (i.e., B2≈kBT0) [50]. With these ∆μ(T) and B2 estimates, and T<T0 (but close to T0), we have [42,46,50,51]
where T*≈400 ℃ at B2≈kBT0. This estimate captures the main: an enormous growth of when T approaches the ice-and-water coexistence temperature, 0 ℃.
Since at a given temperature T<T0, the time of appearance of an ice nucleus around one given on-border H2O molecule is determined by Eqs. (4), (5), the time of appearance of an ice nucleus around one of the N on-border H2O molecules existing on the surface of the vessel (where, in the absence of dust, ice can only appear at sub-zero temperatures) can be estimated as
With the number of on-border waters N ~ 1015 in a ~1 mL test tube (since a single water molecule with a diameter of ≈3 Å covers ≈10–15 cm2 of the test tube wall, and different water molecules can be roughly considered as independent potential nucleation sites), and (see above) τ~10-7 s approximately, one can see from this equation that the value of amounts—theoretically—to minutes at the water temperature T = T0 − 7 °C, days at T = T0 − 6 °C, and ages at T = T0 − 5 °C.
Thus, freezing of pure water is only possible at water temperatures T below Tfreeze≈−6 ℃. It is worth noting that changing the values of N and τ by an order of magnitude each leads to roughly the same estimates of (minutes - days - ages at ≈-7, ≈-6, ≈-5 °C) when the fitting parameter T* is varied by only 10%.
The probability of appearance of an ice nucleus around one given on-border H2O molecule during the above-specified time τ at temperature T<T0 is , while at T≥T0. Thus,
is the probability of the nucleus appearing around a given on-border H2O molecule during a short time dt, and is the probability that a nucleus does not appear during this time dt around this on-border water molecule. So, the value is the probability that, at T<T0, in a system of N on-border waters not a single nucleus arises during the time dt. Then is the probability that not a single nucleus arises in this system during the time interval dt1+…+dtm when all of temperatures T1,…,Tm are below T0.
A freezer set at Tth<T0 needs (see Eq. (3)) the time for cooling water from T1 to T0, only after which ice can arise. At time above t0 (when Tt falls below T0),
is the probability that no nucleus arises among N of on-border waters during time t0t* (note that , and tends to 0 at t* → ∞ when all of Tt<T0 at t0≤t≤t*). Then
is the probability that the first nucleus arises in the on-border water during the time interval t0?t* (and ). So, the probability of ice nucleation during the short time interval t*?(t*+dt*) is , which equals to . Thus,
is the momentary probability of ice nucleation at t* > t0 (note: =0, =1, while Eq. (3) gives the time t0 = tth(T1,T0) needed to cool water to the temperature T0, and the time needed to cool an ice-free water to the temperature ).
Figure 2 shows the computed cooling dynamics of water and computed probabilities of ice nucleation as functions of the cooling time t*. These computations use Eqs. (2, 10) with N=1015, τ=10-7 s, T* = 400 ℃, =0.002 s−1 for cooling from the initial temperatures T1=+20 ℃ (panels 2 (a, c)) and T1=+70 ℃ (panels 2 (b, d)) at various thermostat temperatures Tth.
Thus, as illustrated by Figure 2 (in accordance with Figure 1 and the Graphical Abstract) for both initial temperatures, the expected ranges of ice nucleation times are quite wide (>>1000 sec, see caps on the tops of peaks) and overlap at freezer temperatures above −7 oC, though at lower (below −8 oC and especially −10 oC) freezer temperatures, they are narrow (less than ≈500-second delay in the cooling of hot water) and do not overlap.
This theoretical result agrees with experimental observations across water samples cooled at different freezer temperatures (Figure 1a,b), supporting the conclusion that the “Mpemba effect” manifests itself—but only in a fraction of experiments—as a stochastic event, and only at relatively high freezer temperatures Tth above ≈−7 oC.
3. Discussion
(i) water (in a closed vial) freezes not at 0 ℃ but (for kinetic reasons [39,42,45,46,50,51]) only below ≈-6 ℃, i.e., in a super-cooled state [2,39], and even then, starts to freeze not immediately;
(ii) the typical time of the onset of water freezing at cooling is very large at Tth ≈ -6 ÷ -7℃ [2,39,45]; this time decreases significantly (approximately tenfold) with decreasing thermostat temperature Tth from -6.3 ÷ -6.9 to -8.6 ÷ -8.7 ℃, i.e., by only ≈ 2°; this accords to the above (Figure 2(c, d)) estimates;
(iii) at the freezer temperature Tth above -7.2 ℃, freezing occurs at water temperature Tfr that is only slightly, typically by ≲0.5 ℃, above this Tth, while at the lower temperature Tth, of -8 ÷ -12 °C, the freezing occurs at water temperature Tfr which is close to ≈-6.5 ℃, and thus noticeably, by about 2° ÷ 5°, above this low Tth;
(iv) at the thermostat temperature Tth ≈ -8.6 ℃ and below, the scattering of the freezing onset times is relatively small – for all samples of both initially cool and initially hot water this scattering is less than 500 seconds (that is, less than the typical delay in the cooling of initially hot water), but at the thermostat temperature Tth ≳ -7 ℃, there is a huge (~10000 seconds) scattering of freezing onset times both for initially cool and initially hot water (which is much beyond the typical ≈500 second delay in cooling of initially hot water), so that initially hot water sometimes freezes faster and sometimes slower than initially cool water; this also corresponds to what is seen in Figure 2.
To grasp why higher freezer temperatures Tth result in wider freezing time ranges, while lower Tth yield narrower freezing time scattering, we can find an approximate solution to Eq. (10) by simplifying the consideration of the cooling & freezing process by dividing it into two stages:
(a) cooling, when the temperature drops from T1 to Tfr, which takes time tc = tth(T1,Tfr), and
(b) freezing onset at the constant temperature Tfr < T0.
It should be noted that the purpose of this simplification is to provide a general understanding of the cooling & freezing process, rather than a precise description of its details. The approximation used is justified by the fact that the change in water temperature on the timescales at which ice formation begins is quite small (see Figure 2), and it allows for the use of deliberately approximate, rounded numerical parameters.
During cooling with a freezer set at the temperature Tth, the most probable ice-nucleation temperature Tfr(Tth) corresponds to the minimum (by Tfr) of the sum of the cooling time, tth(T1,Tfr), see Eq. (3), and the following (after reaching Tfr) mean freezing onset time . Denoting the constant, at Tt = Tfr = const, value as , we have – from Eq. (10) – , and
which drastically grows when Tfr approaches T0.
The minimum (by Tfr) of the sum = is achieved when
This solution has two regimes: (A) when , and (B) when , separated by a point where . At this point (marked by a green closed circle in Figure 3), , and .
The solution of Eq. (12) has two regimes:
(A) when ; this corresponds to the case where Tfr is very close to Tth, and the cooling & freezing time is determined primarily by the freezing onset time;
(B) when ; in this case Tfr is not close to Tth, and the cooling & freezing time is determined primarily by the cooling.
These regimes are separated by a point (marked by a circle) where . In this point, , and .
With the above values of N=1015, τ=10-7 s, and =0.002 s−1, T* = 400 ℃, one has Tth≈−7.16 ℃ and Tfr(Tth)≈−7.03 ℃ (see green line in Figure 3). With slightly, by 10%, different numerical parameters (=0.0022 s−1, T* = 360 ℃, while N, τ remain as specified above), we obtain Tth≈−6.45 ℃ and Tfr(Tth)≈−6.34 ℃ (see blue line in Figure 3). These resulting 10% changes in the values of Tth and Tfr have practically no effect—as we shall see below—on the explanation of why onset times and their variabilities are immense at higher freezer temperatures and comparatively small at lower temperatures; however, the freezing onset temperatures Tfr calculated with =0.0022 s−1, T* = 360 ℃ seem to be closer to the experimentally measured values (see Figure 1 and Footnotes 2 to both Tables). .
Having estimated the dependence of Tfr on Tth, we can find – from Eqs. (3), (11) – the estimate of tc(Tth), i.e., of the T1 → Tfr(Tth) cooling time, and the estimate of , i.e., of the mean time of the onset of the subsequent freezing at the freezer temperature Tth.
The total mean time ttot = of the cooling & freezing process (i.e., the average freezing onset time) is presented in Figure 4.
The value of tc depends on Tth only slightly, whereas the is strong. Therefore, a sharp rise in at Tth > −7 ℃ depends primarily on a sharp rise of the values (given by Eq. (11)) at higher Tth.
Since the value of Tfr(Tth) − T0 changes – in our experiments – by a factor of two only (-5 to -10 ℃ at the most), while the Tfr − Tth may vary by orders of magnitude (from ~0.01 ℃ (see lines in Figure 3 at Tth close to -6 ℃) to ~5 ℃ (see lines in Figure 3 at Tth close to -12 ℃)), Tfr − Tth has a much stronger impact, than T0 − Tfr, on the value of .
At , which is the case when Tth > −7 ℃, and then Tfr − Tth is very small (see Figure 3), exceeds and grows exponentially with increasing Tth and Tfr. This is the case (A), when the expected freezing onset time can be exponentially large.
On the contrary, in the case (B), when since Tfr − Tth is not as small (which happens when Tth < −7.2 ℃), , and then the expected freezing onset time is relatively small – less than the ~500-second delay in cooling the initially hot water.
Now we can estimate the variance of the expected time of the cooling & freezing process. As known, the expected root mean square deviation (RMSDX) of experimental X values from their mean 〈X〉 is , where 〈X2〉 is the mean square of X.
The mean square of the freezing onset time is
so that the expected variance of the experimental freezing times is
which is just equal (see Eq. (11)) to the mean freezing onset time – and both drastically grow when Tth (and hence, Tfr) is above −7.2 ℃, see Figure 5 (which, like Figure 4, demonstrates satisfactory agreement between the theoretical curves and the experimental points, especially at =0.0022 s−1, T* = 360 ℃, see panels 4(b), 5(b)). It should be noted that the fact that the standard deviation of the freezing onset time is equal to the mean freezing onset time is generally typical of the simplest Poisson process (when the expected number of events is zero, just like the number of nucleation events prior to a first-order phase transition).
At the same time, the expected variance of the cooling time tc(Tfr) is small, despite some (small, because ice-nucleating clusters of waters are large [45,50] around 0 ℃) stochastic deviations of local temperatures from the mean water temperature Tfr [52]. So, the variance of the cooling time tc can be neglected – unlike the variances in the freezing onset times tf that can be large and therefore significant.
Thus, the resulting estimate of the time of the whole cooling & freezing process is
where the exponential terms are dominating when Tth (and hence, Tfr(Tth)) is above −7 ℃.
4. Materials and Methods
In each of our many experiments, we used four “initially cool” and four “initially hot” water samples, all placed in the freezer simultaneously. This simultaneous study of water freezing in many vessels allowed us not only to compare freezing events occurring in vessels with different initial temperatures (which has typically been done in other studies of the Mpemba effect), but also to compare processes occurring in vessels with the same initial temperatures (which has not been done in other studies of the Mpemba effect).
The experiments were conducted in the basement of a separate building, where all vibration sources were turned off to prevent their impact on ice freezing. For cooling, a Tuvio FCS15HV1 chest freezer was used; its horizontal lid (see Supplementary Materials 1, Figure S1) minimizes temperature fluctuations at its opening, in contrast to freezers with a vertical door. This freezer allows one to set the temperature from +13 ℃ to −30 ℃ with an accuracy of about 1 ℃. We always used temperatures above −15 ℃ (this was the temperature at the chest freezer bottom). Except for the heat exchanger, the freezer was well insulated. To further stabilize the temperature, about 30 kg of frozen water in big plastic bottles and about 3.5 kg of frozen water in small plastic bottles was placed in the freezer.
To mitigate temperature fluctuations, we constructed an “inner chamber” within the freezer. This chamber is a foam plastic box (see Supplementary Materials 1, Figure S1 and Figure S2) that housed eleven small plastic bottles, each containing 310 mL of a 15% NaCl solution. Before each experiment, these bottles were pre-cooled to about −12 ℃. The gradual thawing of this salt water effectively stabilized the temperature inside the chamber, reducing its fluctuations to less than 0.5 ℃ a day, in contrast to the 2 ℃ fluctuations observed outside the chamber due to the compressor’s cycling.
We initiated each experiment only after the temperature Tth inside the inner chamber, monitored by a thermistor (i.e., a temperature-sensitive resistor connected by a long wire to an external digital thermometer), reached the desired point for this experiment. Within the inner chamber, lightweight wire stand (see Supplementary Materials 1, Figure S1 and Figure S2) was suspended using 18 thin, 100-cm-long wires. Nine thermistors, connected to external electronics, were affixed to the ends of these nine wire pairs. Eight of the thermistors were inserted into eight closed 2-mL test vials through holes in their lids. Each vial was thus suspended by a pair of wires, which minimized vibrations, with a thermistor positioned at the end of the wire pair. Water occupied 80%±1% of the vial volume, and the thermistor measured the temperature in the upper half of the liquid.
The assignment of the same physical vial to the hot/cool groups and to different positions was randomized between runs.
The vials and their contents were weighed with a precision of 10 mg. Four vials containing the initially hot water (+70 ℃) and four containing the initially cool water (+20 ℃) were arranged on the wire stand in an alternating pattern, separated by 4 cm. All vials were placed into the freezer simultaneously. The ninth thermistor was placed in the air between the salt water bottles and the test vials to monitor the ambient temperature.
For temperature measurements, we used nine MF59 100kΩ thermistors, each with a 1-meter-long wire. These thermistors were pre-calibrated using a digital thermometer with a resolution of 0.01 ℃ (LT-300, Termexlab.ru). Eight of these thermistors were used to monitor the water temperature within the test vials, while the ninth measured the air temperature inside the inner chamber containing the small bottles with salt semi-frozen water.
Additionally, we used pre-calibrated digital thermometers (of 0.1 ℃ resolution) with sensors at the ends of the 1-meter-long wires to monitor the temperature inside the inner chamber, the temperature of ambient air, and the temperature in the electrical heater used for preheating the “initially hot” water samples.
These two digital thermometers, DT1 and DT2, were used to monitor the temperature throughout the experiment, especially during the process of water freezing (when the temperature of the water/ice mixture is close to 0 ℃), and after the freezing has been completed (when the temperature of the formed ice approached the temperature inside the inner chamber). These data were used for the final calibration of all thermistors.
We used a custom-built data acquisition module that included a computer running specialized software, which sent 5V pulses sequentially to each of the nine thermistors via the LPT1 parallel port and a custom adapter (see Supplementary Materials 1, Figure S3). Digital voltage readings, representing the temperature, were collected from the Radio Shack 22-168A digital multimeter connected to the RS232 serial port. This multimeter measured the voltage across a single 100 kΩ resistor (shared by all thermistors and connected to ground), the current through which depended on the temperature of the thermistor.
Data regarding voltage and corresponding timestamps were recorded at 43-second intervals (see Supplementary Materials 1, Figure S4); thus, the uncertainty in time measurements was ±22 seconds. The collected voltage data were subsequently converted into temperature data (see Supplementary Materials 1, Figure S5). The maximum expected error in temperature measurements (including the thermistor calibration uncertainty) was ±0.5 ℃. This level of precision is adequate for the objectives of this study, as the temperature increase associated with the onset of freezing exceeds 5 ℃, and the point of our interest was the freezing onset time.
All experiments were conducted using distilled water from the Institute of Protein Research, Russian Academy of Sciences. Before each run, four closed vials were equilibrated at the ambient basement temperature (+15 ÷ +20 ℃), while four others were pre-heated to the temperature of ≈+70 ℃ using small custom-built electric ovens.
The interiors of the test vials and thermistors in the vials were lubricated with “Sylgard 184 silicone elastomer” (without the “Curing Agent”) to adsorb potential foreign ice nucleators from water and to smooth out any micro-roughness on the vial walls.
Upon placing the wire stand with vials into the freezer, a small temporary temperature increase was observed in the upper part of the chamber. However, the air temperature, as monitored by a digital thermometer and the intra-chamber thermistor, returned to the setpoint within 10 minutes—well before freezing onset.
5. Conclusions
We see that the Mpemba effect in water freezing (at least under the given conditions: closed vessels that prevent evaporation, suppress convection, and exclude the entry of alien crystallization centers in water) arises not from any special properties of pure water (as has been hypothesized in many papers on this topic), or of some in-water “motes” [39], but from the general uncertainty of the time of the onset of the first-order phase transition—an uncertainty that becomes especially significant at slightly sub-zero water temperatures.
This fundamental uncertainty (which does not allow one to precisely define the onset time) is well known [52] in the physics of first-order phase transitions, but – oddly enough – it has been never, to our best knowledge, considered in the context of the Mpemba effect in the freezing of liquids, even though it is precisely here that this uncertainty manifests itself perhaps most clearly.
It is this fundamental uncertainty in the freezing onset time (which has been mentioned, but not investigated, in [2,39,53,54]) that produces a kind of randomness in the occurrence of the Mpemba effect, and its poor reproducibility mentioned in many works – which, for many years, “continued to make the Mpemba effect as puzzling as ever” [54] and generated skepticism about its very existence [28].
The large variability in the onset times is due to the specific (Poisson) form of the time-dependent probability of the freezing transitions, . has its maximum at the first moment and then declines. This leads to substantial uncertainty in the onset timing and, at sufficiently high Tth, results in overlap of freezing times for samples with different initial temperatures, thus providing the stochastic Mpemba effect.
The observed stochasticity of the Mpemba effect in freezing of pure water does not exclude other factors [55] that may contribute to the freezing times, e.g., insufficiently clean liquid or vessel walls (we minimized these effects, see Materials and Methods), or ice-nucleating “motes” that can fall in open vials positioned in a freezer. Then, the Mpemba effect, not caused by the liquid itself, may result from some foreign ice nucleators penetrating into the initially hot water [15].
It is important to emphasize that the observed accidental origin of the Mpemba effect in pure water is limited to phenomena such as freezing, which involve first-order phase transitions.
The initiation of freezing is, in essence, a catastrophe [56], or “a single-event phenomenon”: the emergence of a single ice nucleus can trigger the freezing of the entire liquid in the test tube. Therefore, the significant uncertainty in the timing of a stochastic ice nucleation can occasionally demonstrate the Mpemba effect in some experiments. This occurs due to the overlap of broad ranges of ice initiation times for initially hot and initially cool samples. This overlap (see Figure 2c,d)) can mask the delay in cooling of the hotter water sample and leading to the wrong perception that “hot water [deterministically, always] freezes faster than cool water”, or, according to a modern, more general formulation of the Mpemba paradox, that “the state that is initially farthest from its equilibrium state attains the latter at the earliest time” [13].
We do not want to create the impression that our finding of the stochasticity of the Mpemba effect in freezing refutes the very existence of deterministic Mpemba effects altogether. Colloids [8,9,11], as well as simple mechanical systems [40,41], and specifically various oscillators (see Supplementary Materials 2 and [57,58]), exhibit a deterministic Mpemba effect, where “the state that is initially farthest from its equilibrium state (always) attains the latter at the earlier [57] (or at least the same [58]) time”, and where the origin and driving force of this effect (inertia—”kinetic memory”—and a sharper than quadratic increase in potential upon deviation from equilibrium) are clear (as we show in Supplementary Materials 2).
In essence, all discussions regarding the Mpemba effect in various systems boil down to attempts to identify a hidden, stable ordering parameter (or parameters)—e.g., currents—in addition to such familiar quantities as temperature, volume, and pressure—much like what has been done for the Kovacs effect [31,59,60,61]. This effect was observed when the polymer glass—having been brought into a non-equilibrium state, where its macroscopic thermodynamic parameters, nevertheless, coincide with their equilibrium values—continues to evolve and exhibits a temporal “hump” before transitioning to a fully equilibrium state.
The discussions regarding the Mpemba effect now apply particularly to anomalous relaxation behavior of open and isolated nonequilibrium quantum systems [62,63,64,65,66,67,68], whose “resource” is asymmetry - thermal or athermal deviation from symmetry or thermal equilibrium. Most of these studies employ a quantum - theoretic approach based on the resource theory of asymmetry and quantum relative entropy, and bear little relation to first-order thermodynamic phase transitions of the freezing type.
Ironically, the classic Mpemba effect, a phenomenon first found just in the freezing of water sixty years ago, proved to be only stochastic in this system, while other systems?lacking a first-order phase transition (colloids, quantum, etc.)?can exhibit a fully deterministic Mpemba effect.
Supplementary Materials
The following supporting information can be downloaded at the website of this paper posted on Preprints.org: Figure S1 – Experimental setup for water freezing experiments; Figure S2 – Wire stand with closed vials containing water samples and thermistors; Figure S3 – Scheme of the custom-built adapter; Figure S4 – Example of the program interface window used for data acquisition; Figure S5 – Example of the program output; Figure S6 – Potential energy for a system “ particle located between two other particles “ that exhibits a Mpemba-like effect in the absence of a phase transition.
Author Contributions
Conceptualization: AVF; Literature collection and analysis, AVF, AAK; Experiments: AAK; Theory: AVF; Funding acquisition: AVF. The manuscript was written through contributions of both authors. Both authors have read and agreed to the published version of the manuscript.
Funding
This research was partly funded by the Russian Science Foundation (grant # 25-14-00260) to AVF. The funder had no role in study design, data collection and analysis, decision to publish, or preparation of the manuscript.
Data Availability Statement
The original contributions presented in this study are included in the article. Further inquiries can be directed to AVF (theory) or AAK (experiments).
Addresses
AVF, <afinkel@vega.protres.ru>; AAK, <anklimov11@gmail.com>.
Acknowledgments
We are grateful to Bogdan S. Melnik for discussions and assistance in experimental and theoretical work and E. V. Serebrova for editing the manuscript.
Conflicts of Interest
The authors declare no conflicts of interest.
References
- Mpemba, E.B.; Osborne, D.G. Cool? Phys. Educ. 1969, 4, 172–175. [Google Scholar] [CrossRef]
- Auerbach, D. Supercooling and the Mpemba effect: when hot water freezes quicker than cold. Am. J. Phys. 1995, 63, 882–885. [Google Scholar] [CrossRef]
- Brownridge, J.D. When does hot water freeze faster than cold water? A search for the Mpemba effect. Am. J. Phys. 2011, 79, 78–83. [Google Scholar] [CrossRef]
- Burridge, H.C.; Linden, P.F. Questioning the Mpemba effect: Hot water does not cool more quickly than cold. Sci. Rep. 2016, 6, 37665. [Google Scholar] [CrossRef] [PubMed]
- Ahn, Y.-H.; Kang, H.; Koh, D.Y.; Lee, H. Experimental verifications of Mpemba-like behaviors of clathrate hydrates. Korean J. Chem. Eng. 2016, 33, 1903. [Google Scholar] [CrossRef]
- Hu, C.; Li, J.; Huang, S.; Li, H.; Luo, C.; Chen, J.; Jiang, S.; An, L. Conformation directed Mpemba effect on polylactide crystallization. Cryst. Growth Des. 2018, 18, 5757–5762. [Google Scholar] [CrossRef]
- Burridge, H.C.; Hallstadius, O. Observing the Mpemba effect with minimal bias and the value of the Mpemba effect to scientific outreach and engagement. Proc. R. Soc. A 2020, 476, 20190829. [Google Scholar] [CrossRef]
- Kumar, A.; Bechhoefer, J. Exponentially faster cooling in a colloidal system. Nature 2020, 584, 64–68. [Google Scholar] [CrossRef] [PubMed]
- Bechhoefer, J.; Kumar, A.; Chétrite, R. A fresh understanding of the Mpemba effect. Nat. Rev. Phys. 2021, 3, 534–535. [Google Scholar] [CrossRef]
- Holtzman, R.; Raz, O. Landau theory for the Mpemba effect through phase transitions. Commun. Phys. 2022, 5, 280. [Google Scholar] [CrossRef]
- Kumar, A.; Chétrite, R.; Bechhoefer, J. Anomalous heating in a colloidal system. Proc. Natl. Acad. Sci. USA 2022, 119, e2118484119. [Google Scholar] [CrossRef] [PubMed]
- Shapira, S.A.; Shapira, Y.; Markov, J.; Teza, G.; Akerman, N.; Raz, O.; Ozeri, R. Inverse Mpemba effect demonstrated on a single trapped ion qubit. Phys. Rev. Lett. 2024, 133, 010403. [Google Scholar] [CrossRef] [PubMed]
- Joshi, L.K.; Franke, J.; Rath, A.; Ares, F.; Murciano, S.; Kranzl, F.; Blatt, R.; Zoller, P.; Vermersch, B.; Calabrese, P.; Roos, C.F.; Joshi, M.K. Observing the quantum Mpemba effect in quantum simulations. Phys. Rev. Lett. 2024, 133, 010402. [Google Scholar] [CrossRef] [PubMed]
- Zhang, J.; Xia, G.; Wu, C.-W.; Chen, T.; Zhang, Q.; Xie, Y.; Su, W.-B.; Wu, W.; Qiu, C.-W.; Chen, P.-X.; Li, W.; Jing, H.; Zhou, Y.-L. Observation of quantum strong Mpemba effect. Nat. Commun. 2025, 6, 301. [Google Scholar] [CrossRef] [PubMed]
- Brownridge, J.D.; Zinet, M.; Sotta, P.; Ganachaud, F. Unraveling specific conditions for a repeatable Mpemba effect. J. Phys. Chem. B 2025, 129(51), 13277–13288. [Google Scholar] [CrossRef] [PubMed]
- Jeng, M. The Mpemba effect: When can hot water freeze faster than cold? Am. J. Phys. 2006, 74(6), 514–522. [Google Scholar] [CrossRef]
- Zhang, X.; Huang, Y.; Ma, Z.; Zhou, Y.; Zhou, J.; Zheng, W.; Jiang, Q.; Sun, C.Q. Hydrogen-bond memory and water-skin supersolidity resolving the Mpemba paradox. Phys. Chem. Chem. Phys. 2014, 16(42), 22995–23002. [Google Scholar] [CrossRef] [PubMed]
- Jin, J.; Goddard, W.A., III. Mechanisms underlying the Mpemba effect in water from molecular dynamics simulations. J. Phys. Chem. C 2015, 119(5), 2622–2629. [Google Scholar] [CrossRef]
- Tao, Y.; Wenli, Z.; Junteng, J.; Wei, L.; Cremer, D. Different ways of hydrogen bonding in water - why does warm water freeze faster than cold water? J. Chem. Theory Comput. 2017, 13(1), 55–76. [Google Scholar] [CrossRef] [PubMed]
- Lu, Z.; Raz, O. Nonequilibrium thermodynamics of the Markovian Mpemba effect and its inverse. Proc. Natl. Acad. Sci. USA 2017, 114(20), 5083–5088. [Google Scholar] [CrossRef] [PubMed]
- Lasanta, A.; Vega Reyes, F.; Prados, A.; Santos, A. When the hotter cools more quickly: Mpemba effect in granular fluids. Phys. Rev. Lett. 2017, 119(14), 148001. [Google Scholar] [CrossRef] [PubMed]
- Klich, I.; Raz, O.; Hirschberg, O.; Vucelja, M. Mpemba index and anomalous relaxation. Phys. Rev. X 2019, 9, 021060. [Google Scholar] [CrossRef]
- Baity-Jesi, M.; Calore, E.; Cruz, A.; Fernandez, L.A.; Gil-Narvión, J.M.; Gordillo-Guerrero, A.; Iñiguez, D.; Lasanta, A.; Maiorano, A.; Marinari, E.; Martin-Mayor, V.; Moreno-Gordo, J.; Sudupe, A.M.; Navarro, D.; Parisi, G.; Perez-Gaviro, S.; Ricci-Tersenghi, F.; Ruiz-Lorenzo, J.J.; Schifano, S.F.; Seoane, B.; Tarancón, A.; Tripiccione, R.; Yllanes, D. The Mpemba effect in spin glasses is a persistent memory effect. Proc. Natl. Acad. Sci. USA 2019, 116(31), 15350–15355. [Google Scholar] [CrossRef] [PubMed]
- González, R.G.; Khalil, N.; Garzó, V. Mpemba-like effect in driven binary mixtures. Phys. Fluids 2021, 33, 053301. [Google Scholar] [CrossRef]
- Elton, D.C.; Spencer, P.D. Pathological water science – four examples and what they have in common. In Water in Biomechanical and Related Systems. Biologically-Inspired Systems (Biologically Inspired Systems series,; Gadomski, A., Ed.; Springer Verlag GmbH: Hamburg, Germany, 2021; volume 17, pp. 155–169. [Google Scholar]
- Yang, Z.-Y.; Hou, J.-X. Mpemba effect of a mean-field system: The phase transition time. Phys. Rev. E 2022, 105, 014119. [Google Scholar] [CrossRef] [PubMed]
- Teza, G.; Yaacoby, R.; Raz, O. Relaxation shortcuts through boundary coupling. Phys. Rev. Lett. 2023, 131, 017101. [Google Scholar] [CrossRef] [PubMed]
- Bier, M. The rise and fall of the Mpemba effect. Skept. Inq. 2023, 47(4), 48–52. Available online: https://skepticalinquirer.org/2023/06/the-rise-and-fall-of-the-mpemba-effect/.
- Chatterjee, A.K.; Takada, S.; Hayakawa, H. Quantum Mpemba effect in a quantum dot with reservoirs. Phys. Rev. Lett. 2023, 131(8), 080402. [Google Scholar] [CrossRef] [PubMed]
- Wang, X.; Wang, J. Mpemba effects in nonequilibrium open quantum systems. Phys. Rev. Res. 2024, 6, 033330. [Google Scholar] [CrossRef]
- Santos, A. Mpemba meets Newton: Exploring the Mpemba and Kovacs effects in the time-delayed cooling law. Phys. Rev. E 2024, 109, 044149. [Google Scholar] [CrossRef] [PubMed]
- Turkeshi, X.; Calabrese, P.; De Luca, A. Quantum Mpemba effect in random circuits. Phys. Rev. Lett. 2025, 135, 040403. [Google Scholar] [CrossRef] [PubMed]
- Ghosh, S.; Pathak, P.; Chatterjee, S.; Das, S.K. Simulations of Mpemba effect in water and Lennard-Jones models. Commun. Phys. 2025, 8, 359. [Google Scholar] [CrossRef]
- Klimov, A.A.; Finkelstein, A.V. The Mpemba effect in pure water has a stochastic origin. Experimental and theoretical resolution of the paradox. arXiv [physics.chem-ph]. 2025, arXiv:2508.05607v1. [Google Scholar] [CrossRef]
- Vynnycky, M.; Mitchell, S. Evaporative cooling and the Mpemba effect. Heat Mass Transf. 2010, 46, 881–890. [Google Scholar] [CrossRef]
- Mirabedin, S.M.; Farhadi, F. Numerical investigation of solidification of single droplets with and without evaporation mechanism. Int. J. Refrig. 2017, 73, 219–225. [Google Scholar] [CrossRef]
- Vynnycky, M.; Maeno, N. Axisymmetric natural convection-driven evaporation of hot water and the Mpemba effect. Int. J. Heat Mass Transf. 2012, 55, 7297–7311. [Google Scholar] [CrossRef]
- Vynnycky, M.; Kimura, S. Can natural convection alone explain the Mpemba effect? Int.J. Heat Mass Transf. 2015, 80, 243–255. [Google Scholar] [CrossRef]
- Dorsey, N.E. The freezing of supercooled water. Trans. Am. Phil. Soc. 1948, 38, 247–328. [Google Scholar] [CrossRef] [PubMed]
- Finkelstein, A.V. Analogue of the Mpemba effect in classical mechanics. arXiv [physics.chem-ph. 2025, arXiv:2503.22387v1. [Google Scholar] [CrossRef]
- Finkelstein, A.V. A simple system demonstrating the Mpemba effect in classical mechanics. Phys. Sci. Biophys. J. 2025, 9(2), 000286. [Google Scholar] [CrossRef]
- Finkelstein, A.V.; Garbuzynskiy, S.O.; Melnik, B.S. How can ice emerge at 0 oC? Biomolecules 2022, 12, 981. [Google Scholar] [CrossRef] [PubMed]
- Eyring, H. The activated complex in chemical reactions. J. Chem. Phys. 1935, 3, 107−115. [Google Scholar] [CrossRef]
- Knorre, D.G.; Emanuel, N.M. The Course in Chemical Kinetics, chapters II, III, V (§§ 2, 3), 4th Russian ed.; Vysshaja Shkola: Moscow, USSR, 1984. [Google Scholar]
- Chernov, A.A. Modern crystallography III. Crystal growth; Berlin, Heidelberg, New York, Tokyo, 1984; pp. chapters 3–6, 8. [Google Scholar]
- Finkelstein, A.V.; Garbuzynskiy, S.O.; Melnik, B.S. Correction: Finkelstein et al. How can ice emerge at 0 oC? Biomolecules 2022, 12, 981. Biomolecules 2023, 13, 1687. [Google Scholar] [CrossRef] [PubMed]
- Koop, T.; Murray, B.J. A physically constrained classical description of the homogeneous nucleation of ice in water. J. Chem. Phys. 2016, 145, 211915. [Google Scholar] [CrossRef] [PubMed]
- Lide, D.R. CRC Handbook of Chemistry and Physics, 86th ed.; CRC Press: Boca Raton, USA, 2005; Volume Sections 2, p. 6. [Google Scholar]
- Hillig, W.B. Measurement of interfacial free energy for ice/water system. J. Cryst. Growth 1998, 183, 463–468. [Google Scholar] [CrossRef]
- Melnik, B.S.; Glukhova, K.A.; Sokolova (Voronova), E.A.; Balalaeva, I.V.; Garbuzynskiy, S.O.; Finkelstein, A.V. Physics of ice nucleation and antinucleation: Action of ice binding proteins. Biomolecules 2024, 14, 54. [Google Scholar] [CrossRef] [PubMed]
- Melnik, B.S.; Finkelstein, A.V. Physical basis of functioning of antifreeze protein. Mol. Biol. 2022, 56(2), 297–305. [Google Scholar] [CrossRef] [PubMed]
- Landau, L.D.; Lifshitz, E.M. Statistical Physics (Volume 5 of A Course of Theoretical Physics), 3rd ed.; Elsevier: Amsterdam, Netherlands, 1980; Volume §§ 114, p. 150, 153. [Google Scholar]
- Knight, C.A. The MPEMBA effect: The freezing times of hot and cold water. Am. J. Phys. 1996, 64(5), 524–524. [Google Scholar] [CrossRef]
- Ball, P. Does hot water freeze first? Phys. World 2006, 19(4), 19–21. Available online: https://physicsworld.com/a/does-hot-water-freeze-first/. [CrossRef]
- Savitsky, Z. Hot things can freeze faster than cool ones. Now, this paradox has gone quantum. Science 2026, 391(6792), 1310–1311. Available online: https://www.science.org/content/article/hot-things-can-freeze-faster-cool-ones-now-paradox-has-gone-quantum. [PubMed]
- Arnold, V.I. Catastrophe Theory, 3rd ed.; Springer-Verlag: Berlin, Heidelberg, Germany, 1992. [Google Scholar]
- Kovacic, I.; Brennan, M.J. The Duffing equation: Nonlinear oscillators and their behavior; John Wiley & Sons: Chichester, UK, 2011; Volume chapter 2. [Google Scholar] [CrossRef]
- Feynman, R.; Leighton, R.; Sands, M. The Feynman Lectures on Physics; Addison-Wesley Publishing Company, Inc.: Reading, MA, USA, 1963; vol. 1, p. chapter 21. [Google Scholar]
- Kovacs, A.J.; Stratton, R.A.; Ferry, J.D. Dynamic mechanical properties of polyvinyl acetate in shear in the glass transition temperature range. J. Phys. Chem. 1963, 67(1), 152–161. [Google Scholar] [CrossRef]
- Kovacs, A.J.; Aklonis, J.J.; Hutchinson, J.M.; Ramos, A.R. Isobaric volume and enthalpy recovery of glasses. II. A transparent multiparameter theory. J. Polym. Sci. Polym. Phys. Ed. 1979, 17(7), 1097–1162. [Google Scholar] [CrossRef]
- Lulli, M.; Lee, C.-S.; Deng, H.-Y.; Yip, C.-T.; Lam, C.-H. Spatial heterogeneities in structural temperature cause Kovacs’ expansion gap paradox in aging of glasses. Phys. Rev. Lett. 2020, 124(9), 095501. [Google Scholar] [CrossRef] [PubMed]
- Nava, A.; Egger, R. Mpemba effects in open nonequilibrium quantum systems. Phys. Rev. Lett. 2024, 133, 136302. [Google Scholar] [CrossRef] [PubMed]
- Ares, F.; Calabrese, P.; Murciano, S. The quantum Mpemba effects. Nat. Rev. Phys. 2025, 7, 451–460. [Google Scholar] [CrossRef]
- Nava, A.; Egger, R. Pontus-Mpemba effects. Phys. Rev. Lett. 2025, 135, 140404. [Google Scholar] [CrossRef] [PubMed]
- Summer, A.; Moroder, M.; Bettmann, L.P.; Turkeshi, X.; Marvian, I.; Goold, J. Resource-theoretical unification of Mpemba effects: Classical and quantum. Phys. Rev. X 2026, 16, 011065. [Google Scholar] [CrossRef]
- Teza, G.; Bechhoefer, J.; Lasanta, A.; Raz, O.; Vucelja, M. Speedups in nonequilibrium thermal relaxation: Mpemba and related effects. Phys. Rep. 2026, 1164, 1–97. [Google Scholar] [CrossRef]
- Beato, N.; Teza, G. Relaxation control of open quantum systems. Phys. Rev. Lett. 2026, 136, 070401. [Google Scholar] [CrossRef] [PubMed]
- Santos, A. The Mpemba effect in the Descartes protocol: a time-delayed Newton’s law of cooling approach. J. Phys. A Math. Theor. 2026, 59, 145201. [Google Scholar] [CrossRef]
Figure 1.
Dynamics of water cooling and freezing at thermostat temperatures Tth above -7 °C (a) and below -8 °C (b). In each experiment, the four “cool” water samples started at +20 °C (1c – 4c, thin blue lines), and the four “hot” ones started at +70 °C (1h – 4h, thin red dashed lines). Each line tracks the temperature evolution of one sample. Sharp temperature increases (marked by 1c – 4c, 1h – 4h) indicate the onset of freezing, causing a sharp release of latent heat of freezing [39]. Bold green lines represent the measured freezer temperatures Tth.
Figure 1.
Dynamics of water cooling and freezing at thermostat temperatures Tth above -7 °C (a) and below -8 °C (b). In each experiment, the four “cool” water samples started at +20 °C (1c – 4c, thin blue lines), and the four “hot” ones started at +70 °C (1h – 4h, thin red dashed lines). Each line tracks the temperature evolution of one sample. Sharp temperature increases (marked by 1c – 4c, 1h – 4h) indicate the onset of freezing, causing a sharp release of latent heat of freezing [39]. Bold green lines represent the measured freezer temperatures Tth.
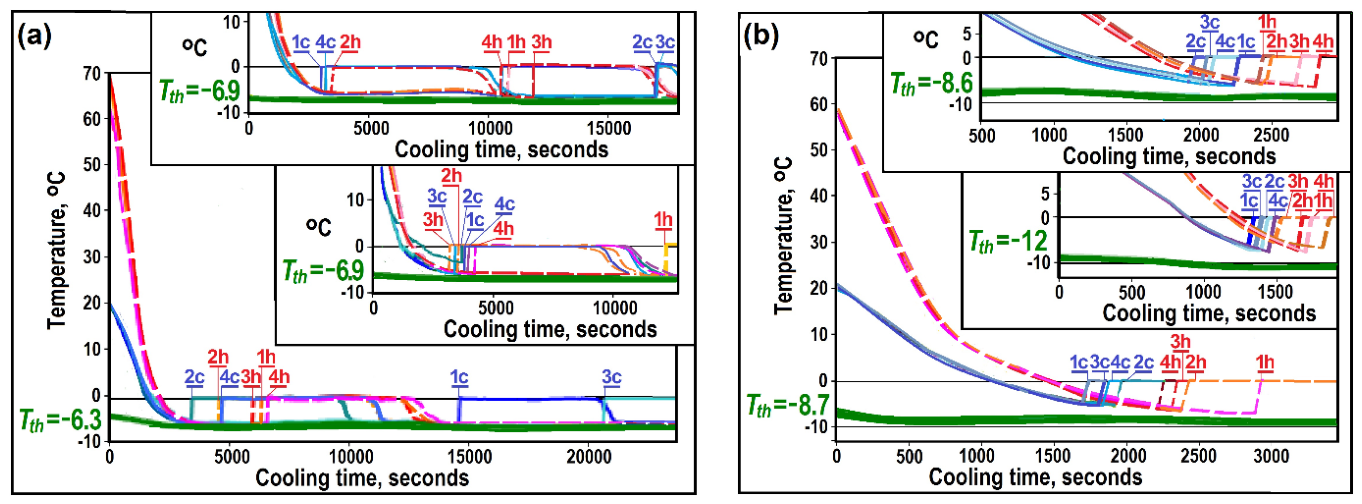
Figure 2.
Computed (see Eq. 2) Newtonian cooling dynamics of water in the absence of freezing (a, b) and computed (using Eq. 10) probabilities of ice nucleation (c, d) as functions of the cooling time at different freezer temperatures Tth. The cooling begins at initial temperatures T1 = +20 oC (a, c) and T1 = +70 oC (b, d). The only difference between freezing in (c) and (d) is the time delay of about 500 seconds, reflecting the additional time required to cool hot water from +70 oC to +20 oC. A comparison of the panels shows that the change in water temperature over the time scales required for ice nucleation is quite small.
Figure 2.
Computed (see Eq. 2) Newtonian cooling dynamics of water in the absence of freezing (a, b) and computed (using Eq. 10) probabilities of ice nucleation (c, d) as functions of the cooling time at different freezer temperatures Tth. The cooling begins at initial temperatures T1 = +20 oC (a, c) and T1 = +70 oC (b, d). The only difference between freezing in (c) and (d) is the time delay of about 500 seconds, reflecting the additional time required to cool hot water from +70 oC to +20 oC. A comparison of the panels shows that the change in water temperature over the time scales required for ice nucleation is quite small.
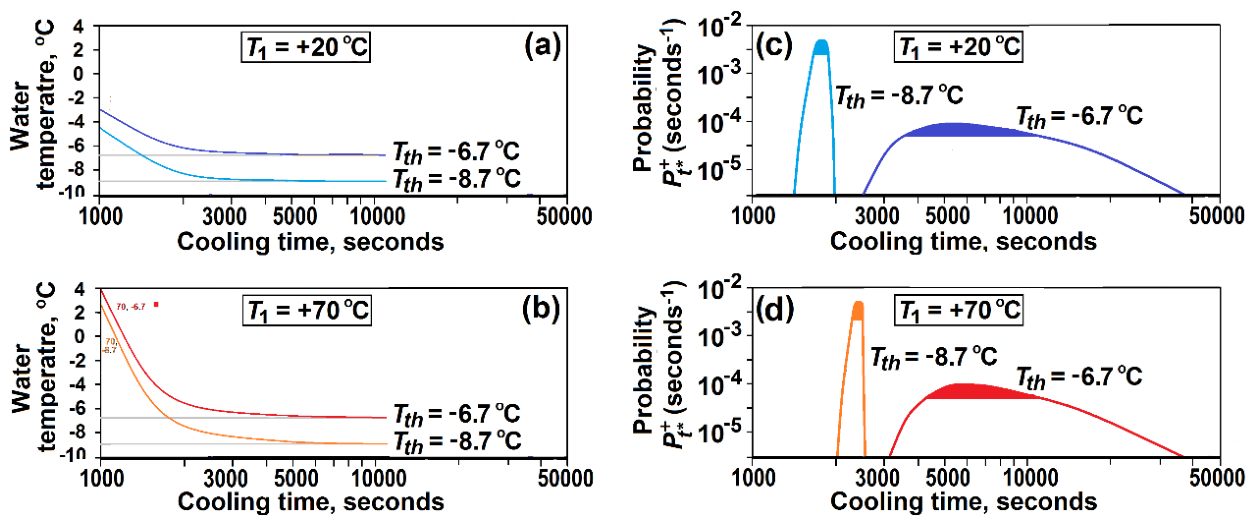
Figure 3.
Theoretically expected from Eq. (12) ice nucleation temperature Tfr as a function of the freezer temperature Tth. The calculations are done with N=1015, τ=10-7 s, =0.002 s−1, T* = 400 ℃ (green line), and N=1015, τ=10-7 s, =0.0022 s−1, T* = 360 ℃ (blue line). To the left of the circles, the values of Tfr differ significantly from the freezer temperatures Tth; to the right of these circles, the values of Tfr are very close to Tth.
Figure 3.
Theoretically expected from Eq. (12) ice nucleation temperature Tfr as a function of the freezer temperature Tth. The calculations are done with N=1015, τ=10-7 s, =0.002 s−1, T* = 400 ℃ (green line), and N=1015, τ=10-7 s, =0.0022 s−1, T* = 360 ℃ (blue line). To the left of the circles, the values of Tfr differ significantly from the freezer temperatures Tth; to the right of these circles, the values of Tfr are very close to Tth.
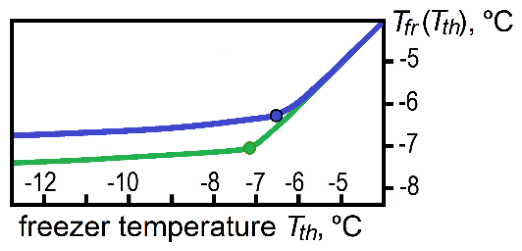
Figure 4.
Theoretically expected, from Eqs. (3), (11) (pink and light-blue curves for initially hot and cool water, respectively), and experimentally observed (red and blue open circles for initially hot and cool water, respectively; see Table 1a, 1b) average freezing onset times as a function of the freezer temperature Tth. Each of 20 experiments used 4 hot and 4 cool water samples. The y-axis is logarithmic. The calculations are made with N=1015, τ=10-7 s, and =0.002 s−1, T* = 400 ℃ (panel (a)), and N=1015, τ=10-7 s, and =0.0022 s−1, T* = 360 ℃ (panel (b)).
Figure 4.
Theoretically expected, from Eqs. (3), (11) (pink and light-blue curves for initially hot and cool water, respectively), and experimentally observed (red and blue open circles for initially hot and cool water, respectively; see Table 1a, 1b) average freezing onset times as a function of the freezer temperature Tth. Each of 20 experiments used 4 hot and 4 cool water samples. The y-axis is logarithmic. The calculations are made with N=1015, τ=10-7 s, and =0.002 s−1, T* = 400 ℃ (panel (a)), and N=1015, τ=10-7 s, and =0.0022 s−1, T* = 360 ℃ (panel (b)).

Figure 5.
Expected (from Eqs. (11, 14), brown curve) and experimentally observed (red and blue open circles for initially hot and cool water, respectively) root mean square deviations () of experimental freezing onset times from their average values as a function of the freezer temperature Tth. The green dashed line corresponds to a delay in the cooling of the initially hotter water. The region where the accidental Mpemba effect occurs is above this line. The y-axis is logarithmic. The calculations are made with N=1015, τ=10-7 s, and =0.002 s−1, T* = 400 ℃ (panel (a)), and N=1015, τ=10-7 s, and =0.0022 s−1, T* = 360 ℃ (panel (b)).
Figure 5.
Expected (from Eqs. (11, 14), brown curve) and experimentally observed (red and blue open circles for initially hot and cool water, respectively) root mean square deviations () of experimental freezing onset times from their average values as a function of the freezer temperature Tth. The green dashed line corresponds to a delay in the cooling of the initially hotter water. The region where the accidental Mpemba effect occurs is above this line. The y-axis is logarithmic. The calculations are made with N=1015, τ=10-7 s, and =0.002 s−1, T* = 400 ℃ (panel (a)), and N=1015, τ=10-7 s, and =0.0022 s−1, T* = 360 ℃ (panel (b)).
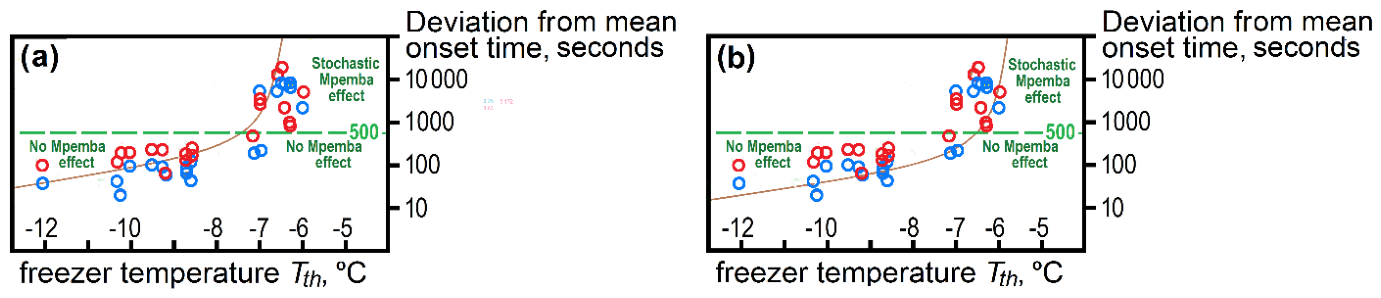

Table 1a.
Data on cooling and freezing1 at thermostat temperatures Tth of -7.2 °C and higher.
| Tth, °C |
〈thot-tcool〉delay at 0° C |
Initial- ly |
Time of the 1st freezing onset2 | Time of the 2nd freezing onset2 | Time of the 3rd freezing onset2 | Time of the 4th freezing onset2 |
Hot before cool |
Cool before hot |
| -6.3 ±0.1 |
456±98 | cool | 3453 | 4686 | 14673 | 21120 | 0; 1; 4; 4; 3 Σ: 9 (56%) |
1; 2; 2; 2; 4 Σ: 7 (44%) |
| hot | 4562 | 5980 | 6412 | 6658 | ||||
| -6.9 ±0.1 |
353±43 | cool | 2959 | 3243 | 17139 | 17262 | 0; 0; 4; 4; 3 Σ: 8 (50%) |
2; 2; 2; 2; 4 Σ: 8 (50%) |
| hot | 3576 | 10604 | 10974 | 11985 | ||||
| -6.9 ±0.1 |
356±123 | cool | 3453 | 3699 | 3835 | 12330 | 1; 2; 2; 4; 3 Σ: 9 (56%) |
0; 1; 3; 3; 4 Σ: 7 (44%) |
| hot | 3206 | 3576 | 3946 | 4229 | ||||
| -6.0 ±0.1 |
400±43 | cool | 4720 | 4914 | 5920 | 9671 | 0; 0; 1; 3; 3 Σ: 4 (25%) |
2; 3; 3; 4; 4 Σ: 12 (75%) |
| hot | 5766 | 6577 | 6693 | 18460 | ||||
| -6.2 ±0.1 |
520±33 | cool | 4345 | 5119 | 5378 | 5463 | 0; 0; 1; 1; 3 Σ: 2 (12%) |
2; 4; 4; 4; 4 Σ: 14 (88%) |
| hot | 5334 | 6409 | 7012 | 10046 | ||||
| -6.2 ±0.2 |
465±29 | cool | 4720 | 4914 | 5920 | 9671 | 0; 0; 1; 3; 3 Σ: 4 (25%) |
2; 3; 3; 4; 4 Σ: 12 (75%) |
| hot | 5766 | 6577 | 6693 | 11460 | ||||
| -6.5 ±0.2 |
364±103 | cool | 6240 | 14459 | 17170 | 22676 | 2; 3; 3; 3; 3 Σ: 11 (69%) |
0; 0; 1; 4; 4 Σ: 5 (31%) |
| hot | 5725 | 6155 | 8522 | 40535 | ||||
| -6.7 ±0.2 |
309±178 | cool | 4210 | 6532 | 8261 | 53906 | 0; 1; 2; 4; 3 Σ: 7 (44%) |
1; 2; 3; 3; 4 Σ: 9 (56%) |
| hot | 4913 | 6661 | 9759 | 50046 | ||||
| -7.2 ±0.2 |
399±76 | cool | 7827 | 8128 | 8300 | 8343 | 0; 0; 1; 1; 3 Σ: 2 (12%) |
2; 4; 4; 4; 4 Σ: 14 (88%) |
| hot | 8171 | 8472 | 8601 | 9634 | ||||
| Mean: 39% | Mean: 61% |
1 Numbers in lines 1–2, 3–4, and 5–6 of the Table correspond to Figure 1a. 2 Temperatures for the freezing onset (ice nucleation) in individual water samples are ≈-6.0 ±0.6 ºС. 3 The four integers in this line indicate the number of “hot” samples that begin to freeze before the “cool” samples corresponding to the 1st, 2nd, 3rd, and 4th freezing onset. 4 The four integers in this line indicate the number of “cool” samples that begin to freeze before the “hot” samples corresponding to the 1st, 2nd, 3rd, and 4th freezing onset.
Table 1b.
Data on cooling and freezing1 at thermostat temperatures Tth below -8 °C.
| Tth, °C |
〈thot-tcool〉delay at 0° C |
Initial- ly |
Time of the 1st freezing onset2 | Time of the 2nd freezing onset2 | Time of the 3rd freezing onset2 | Time of the 4th freezing onset2 |
Hot before cool |
Cool before hot |
| -8.6 ±0.1 |
532±58 | cool | 1922 | 2010 | 2064 | 2242 | 0; 0; 0; 0; 3 Σ: 0 (0%) |
4; 4; 4; 4; ; 4 Σ: 16 (100%) |
| hot | 2411 | 2463 | 2644 | 2778 | ||||
| -8.7 ±0.1 |
398±28 | cool | 1716 | 1828 | 1880 | 1942 | 0; 0; 0; 0; 3 Σ: 0 (0%) |
4; 4; 4; 4; 4 Σ: 16 (100%) |
| hot | 2221 | 2332 | 2410 | 2901 | ||||
| -12.0 ±0.1 |
432±24 | cool | 1276 | 1341 | 1420 | 1444 | 0; 0; 0; 0; 3 Σ: 0 (0%) |
4; 4; 4; 4; 4 Σ: 16 (100%) |
| hot | 1516 | 1618 | 1685 | 1784 | ||||
| -8.7 ±0.3 |
400±33 | cool | 1397 | 1397 | 1441 | 1441 | 0; 0; 0; 0; 3 Σ: 0 (0%) |
4; 4; 4; 4; ; 4 Σ: 16 (100%) |
| hot | 1527 | 1613 | 1914 | 1957 | ||||
| -8.7 ±0.2 |
520±73 | cool | 2135 | 2177 | 2221 | 2264 | 0; 0; 0; 0; 3 Σ: 0 (0%) |
4; 4; 4; 4; 4 Σ: 16 (100%) |
| hot | 2393 | 2522 | 2737 | 3168 | ||||
| -9.2 ±0.1 |
510±29 | cool | 1433 | 1476 | 1543 | 1606 | 0; 0; 0; 0; 3 Σ: 0 (0%) |
4; 4; 4; 4; ; 4 Σ: 16 (100%) |
| hot | 1735 | 1822 | 1864 | 1950s | ||||
| -9.2 ±0.3 |
314±53 | cool | 1849 | 1852 | 2011 | 2107 | 0; 0; 1; 2; 3 Σ: 3 (19%) |
2; 3; 4; 4; 4 Σ: 13 (81%) |
| hot | 1853 | 2017 | 2407 | 2493 | ||||
| -9.4 ±0.1 |
482±17 | cool | 1624 | 1667 | 1797 | 1926 | 0; 0; 0; 1; 3 Σ: 1 (6%) |
3; 4; 4; 4; 4 Σ: 15 (94%) |
| hot | 1883 | 1969 | 2443 | 2486 | ||||
| -9.9 ±0.1 |
420±23 | cool | 1892 | 1935 | 2063 | 2150 | 0; 0; 1; 1; 3 Σ: 2 (12%) |
2; 4; 4; 4; 4 Σ: 14 (88%) |
| hot | 1978 | 2193 | 2450 | 2536 | ||||
| -10.2 ±0.1 |
455±39 | cool | 1453 | 1495 | 1495 | 1581 | 0; 0; 0; 0; 3 Σ: 0 (0%) |
4; 4; 4; 4; ; 4 Σ: 16 (100%) |
| hot | 1624 | 1667 | 1753 | 1968 | ||||
| -10.2 ±0.2 |
564±53 | cool | 1666 | 1709 | 1709 | 1709 | 0; 0; 0; 0; 3 Σ: 0 (0%) |
4; 4; 4; 4; 4 Σ: 16 (100%) |
| hot | 1924 | 1924 | 2059 | 2183 | ||||
| Mean: 3% | Mean: 97% |
1 Numbers in lines 1–2, 3–4, and 5–6 of the Table correspond to Figure 1b. 2 Temperatures for the freezing onsets (ice nucleation) in individual water samples are ≈-6.1±0.5 ºС. 3 The four integers in this line indicate the number of “hot” samples that begin to freeze before the “cool” samples corresponding to the 1st, 2nd, 3rd, and 4th freezing onsets. 4 The four integers in this line indicate the number of “cool” samples that begin to freeze before the “hot” samples corresponding to the 1st, 2nd, 3rd, and 4th freezing onsets.
Disclaimer/Publisher’s Note: The statements, opinions and data contained in all publications are solely those of the individual author(s) and contributor(s) and not of MDPI and/or the editor(s). MDPI and/or the editor(s) disclaim responsibility for any injury to people or property resulting from any ideas, methods, instructions or products referred to in the content. |
© 2026 by the authors. Licensee MDPI, Basel, Switzerland. This article is an open access article distributed under the terms and conditions of the Creative Commons Attribution (CC BY) license.
Copyright: This open access article is published under a Creative Commons CC BY 4.0 license, which permit the free download, distribution, and reuse, provided that the author and preprint are cited in any reuse.