
Submitted:
16 October 2026
Posted:
20 October 2026
You are already at the latest version
Abstract
BACKGROUND/OBJECTIVES: Early identification of patients progressing toward brain death may reduce missed organ donation opportunities. We aimed to develop and internally validate an interpretable natural language processing (NLP) model using admission brain computed tomog-raphy (CT) reports. METHODS: This single-center retrospective cohort included 163 adults ad-mitted between 2011 and 2024 with acute neurological injury; 96 subsequently fulfilled brain death criteria and 67 did not. Predictors were derived exclusively from admission CT report text using rule-based preprocessing and term frequency–inverse document frequency word 1–3-gram features. Logistic regression, random forest, XGBoost, and support vector machine models were evaluated using repeated stratified 5-fold cross-validation with 20 repetitions. Vectorization, cal-ibration, model fitting, and threshold selection were restricted to training folds. A prespecified sensitivity target of at least 95% guided threshold selection. Interpretability was assessed using SHapley Additive exPlanations (SHAP). RESULTS: XGBoost achieved the highest discrimination, with a mean area under the receiver operating characteristic curve of 0.807 (95% confidence in-terval, 0.793–0.820) and a pooled out-of-fold value of 0.791. At the high-sensitivity operating point, mean sensitivity was 0.947 and specificity was 0.275. SHAP identified clinically plausible descriptors related to cerebral edema, mass effect, ventricular distortion, ischemic injury, and midline abnormalities. CONCLUSIONS: Admission CT reports contain prognostic information that can be extracted using NLP to support earlier identification of patients at risk of progression to brain death and potential organ donation. External multicenter validation is required before clinical implementation.
Keywords:
brain death
; organ donation
; natural language processing
; machine learning
; computed tomography
1. Introduction
The global shortage of organs for transplantation remains a pressing public health concern. The number of patients on waiting lists continues to far exceed the supply of available organs, particularly from deceased donors [1]. A key bottleneck in expanding the donor pool lies in the timely and accurate identification of patients progressing toward brain death—a process often hindered by manual observation, communication delays, and missed opportunities [2,3]. Previous research, including our earlier study Imaging Screening of Catastrophic Neurological Events Using a Software Tool: Preliminary Results [4], has demonstrated the potential of imaging-based early signaling. More recent advances highlight the effectiveness of machine learning (ML) algorithms and automated alert systems in analysing electronic health records to flag patients meeting specific clinical criteria for potential donation [5,6,7]. However, most existing approaches, including our prior work, primarily identify catastrophic neurological events after they have occurred rather than supporting earlier recognition of patients at high risk of progression toward brain death.
2. Materials and Methods
This was a single-centre retrospective cohort study including adult patients admitted to Hospital Prof. Doutor Fernando Fonseca between 2011 and 2024 with acute neurological events documented on admission brain CT scans. The study sample comprised a consecutive series of all patients meeting the predefined inclusion criteria during the study period. Accordingly, no formal a priori sample size calculation was performed. Two groups were defined: patients who were ultimately diagnosed with brain death (BD group) and patients admitted with severe acute neurological conditions requiring emergency neuroimaging but without subsequent clinical confirmation of brain death (NBD group). Only admission CT reports corresponding to the index neurological event were included. No missing-data imputation was performed. Analyses were conducted using the available data from eligible patients and their corresponding admission CT reports. No prespecified subgroup or model-fairness analyses were performed.
Radiology reports in PDF format were retrieved from the institutional imaging archive and linked to confirmed clinical outcomes. This study was reported in accordance with the STROBE [8] reporting guidelines and TRIPOD+AI [9] statement for prediction model studies using regression or machine-learning methods.
Ethical approval was obtained from the Institutional Review Board of Hospital Prof. Doutor Fernando Fonseca (Approval No. 084/2025). The requirement for informed consent was waived owing to the retrospective design, inclusion of deceased patients over an extended time frame, and use of de-identified data.
2.1. Data Extraction and Pre-Processing
Radiology reports were extracted from PDF files using PyMuPDF (version 1.23.6). All reports were processed through a predefined rule-based NLP pipeline before vectorisation.
The preprocessing pipeline included lowercasing, accent normalisation, punctuation removal, removal of numerical identifiers and repetitive administrative text, and standardisation of common Portuguese radiological expressions.
Administrative and non-informative expressions were removed using a fixed exclusion dictionary defined before model training. This dictionary included institutional headers, report metadata, page markers, referral phrases, and recurrent non-clinical boilerplate. No outcome labels were used during this step.
Negation handling was performed using predefined Portuguese rule-based patterns. Expressions indicating absence of a finding, such as “sem sinais de”, “não se observa”, “não há evidência de”, and related variants, were either removed or recoded to prevent isolated pathological terms from being incorrectly interpreted as positive findings. The negation rules were applied uniformly to all reports and remained unchanged throughout model development. The final preprocessing code and dictionaries were preserved as reproducible scripts to ensure that all transformations could be reapplied identically to future reports.
2.2. Feature Engineering and Vectorisation
After preprocessing, reports were transformed into TF-IDF features using word-level 1–3-grams over a prespecified curated Portuguese clinical vocabulary. The curated vocabulary was iteratively refined through clinical inspection of radiological terminology prior to model development and remained fixed throughout training and evaluation. To reduce sparsity and overfitting, minimum document frequency thresholds and feature-space restrictions were predefined before model training. The TF-IDF vectoriser was fitted exclusively within each training fold and subsequently applied unchanged to the corresponding validation fold to minimise information leakage.
2.3. Machine Learning Models
Four supervised learning algorithms were evaluated:
- Logistic Regression (scikit-learn), using L2 regularisation, max_iter = 1000, random_state = 42.
- Random Forest (scikit-learn), using default parameters unless otherwise specified, random_state = 42.
- XGBoost (XGBClassifier; xgboost ≥1.7), using use_label_encoder = False, eval_metric = "logloss", random_state = 42.
- Support Vector Machine (SVM), with probability estimates enabled for ROC analysis, random_state = 42.
Given the exploratory proof-of-concept nature of the study and the limited sample size, hyperparameter optimisation was intentionally restricted to reduce excessive model complexity and minimise overfitting risk.
2.4. Internal Validation and Model Evaluation
2.4.1. Internal Validation Strategy
To reduce dependence on a single random train-test partition and improve robustness in this relatively small single-centre cohort, model performance was evaluated using repeated stratified cross-validation.
The dataset was analysed using repeated 5-fold stratified cross-validation with 20 repetitions, generating 100 validation folds while preserving the proportion of BD and NBD cases across folds. All preprocessing and model-development steps requiring fitting—including TF-IDF vectorisation, probability calibration, threshold selection, and model training—were performed exclusively within each training fold and subsequently applied unchanged to the corresponding validation fold. This approach was used to minimise information leakage and provide more stable estimates of predictive performance.
2.4.2. Probability Calibration
Predicted probabilities were calibrated within the cross-validation framework using Platt (sigmoid) scaling. Calibration was performed only within the training portion of each fold using an internal 5-fold calibration procedure. Calibrated probabilities were subsequently applied to the unseen validation fold.
Calibration quality was assessed using Brier scores and reliability diagrams aggregated across validation folds.
2.4.3. Operating Threshold Selection
Because the intended role of the model was to support early recognition of patients at high risk of progression toward brain death, sensitivity was prioritised over specificity. A prespecified high-sensitivity constraint (Sensitivity ≥ 0.95) was therefore adopted during operating threshold selection.
Within each training fold, candidate probability thresholds were evaluated according to Youden’s J statistic under the predefined sensitivity constraint. Among thresholds satisfying the sensitivity criterion, the threshold maximising Youden’s J was selected. When multiple thresholds yielded equivalent sensitivity, the highest threshold was retained to maximise specificity and improve robustness.
The selected threshold was then applied unchanged to the corresponding held-out validation fold. Threshold distributions across repeated cross-validation folds were summarised descriptively, and the median threshold was reported as the final proposed operating point.
2.4.4. Performance Metrics
Model discrimination was assessed using receiver operating characteristic area under the curve (ROC-AUC). At the predefined operating threshold, sensitivity, specificity, positive predictive value (PPV), negative predictive value (NPV), accuracy, precision, recall, and F1-score were computed for each validation fold.
Final model performance was reported as mean values with standard deviations and 95% confidence intervals across repeated validation folds. Confidence intervals for proportions were computed using the Wilson method. Confusion matrices, ROC curves, and calibration plots were generated for descriptive visualisation of model behaviour.
2.4.5. Explainability Analysis
Model interpretability was explored using SHAP (SHapley Additive exPlanations). TreeExplainer was applied to the XGBoost model to estimate the contribution of individual radiological expressions to model output probabilities.
Global interpretability was assessed using mean absolute SHAP values across the curated vocabulary. For clarity and interpretability, only the highest-ranking features were displayed in the main figures, while lower-impact features contributed minimally to overall model behaviour. Representative case-level explanations were additionally generated for descriptive purposes.
2.4.6. Software and Computational Environment
All analyses were performed using Python version 3.12.8. Text extraction from PDF radiology reports was performed using PyMuPDF version 1.23.6. Machine-learning model development, repeated cross-validation, probability calibration, threshold selection, and performance evaluation were implemented using scikit-learn version 1.8.0 and XGBoost version 3.0.2. Model explainability analyses were performed using SHAP version 0.48.0. Data manipulation and numerical computations were performed using pandas version 3.0.6, NumPy version 2.5.3, and SciPy version 1.18.1. Visualisations were generated using Matplotlib version 3.10.9.
The complete analytical code, including preprocessing, feature extraction, model training, calibration, threshold selection, validation, and explainability procedures, will be made publicly available in a dedicated GitHub repository upon publication.
3. Results
3.1. Cohort Characteristics
A total of 163 admission brain CT reports were included in the analysis, comprising 96 patients who subsequently fulfilled brain death (BD) criteria and 67 patients with severe acute neurological injury who did not progress to brain death (non-brain death, NBD). Only the admission CT report corresponding to the index neurological event was analysed for each patient.
The NLP pipeline successfully processed all reports. Following preprocessing, including standardisation of radiological terminology, removal of non-clinical expressions and negation handling, reports were transformed into TF-IDF representations using a predefined curated Portuguese radiological vocabulary.
The distribution of report length and the changes in term-frequency patterns before and after preprocessing are illustrated in Figure 1.
3.2. Model Discrimination
Four supervised machine-learning algorithms were evaluated using repeated stratified 5-fold cross-validation with 20 repetitions, generating 100 independent validation folds.
XGBoost demonstrated the highest discriminative performance, with a mean ROC-AUC of 0.807 (95% CI 0.793–0.820) across repeated cross-validation folds (Table I).

Table 1.
Predictive performance of machine-learning models using repeated stratified cross-validation.
Table 1.
Predictive performance of machine-learning models using repeated stratified cross-validation.
| Model | ROC-AUC (95% CI) |
Accuracy (95% CI) | Sensitivity (95% CI) | Specificity (95% CI) | PPV (95% CI) |
NPV (95% CI) |
F1-score (95% CI) |
Brier score (95% CI) |
|---|---|---|---|---|---|---|---|---|
| Logistic Regression |
0.771 (0.755–0.787) |
0.684 (0.672–0.696) |
0.944 (0.932–0.956) |
0.310 (0.277–0.344) |
0.667 (0.657–0.677) |
0.835 (0.803–0.867) |
0.779 (0.772–0.787) |
0.188 (0.183–0.193) |
| Random Forest | 0.796 (0.781–0.811) |
0.676 (0.667–0.687) |
0.950 (0.939–0.961) |
0.285 (0.252–0.317) |
0.660 (0.651–0.669) |
0.847 (0.817–0.877) |
0.777 (0.771–0.782) |
0.183 (0.178–0.188) |
| SVM (RBF) | 0.756 (0.741–0.773) |
0.679 (0.669–0.690) |
0.948 (0.937–0.959) |
0.294 (0.264–0.325) |
0.662 (0.653–0.671) |
0.840 (0.810–0.871) |
0.777 (0.771–0.784) |
0.195 (0.191–0.200) |
| XGBoost | 0.807 (0.793–0.820) |
0.671 (0.660–0.683) |
0.947 (0.935–0.960) |
0.275 (0.241–0.310) |
0.657 (0.647–0.667) |
0.838 (0.806–0.871) |
0.773 (0.766–0.780) |
0.183 (0.178–0.187) |
Values represent mean performance across 100 validation folds generated through repeated stratified 5-fold cross-validation with 20 repetitions. Confidence intervals correspond to empirical 95% confidence intervals derived from fold-level estimates. ROC-AUC = Area Under the Receiver Operating Characteristic Curve; 95% CI – 95% Confidence Interval; PPV = Positive Predictive Value; NPV = Negative Predictive Value.
The pooled out-of-fold ROC curve yielded an ROC-AUC of 0.791 (Figure 2).
The relatively small differences observed between models suggest that the predictive signal was consistently captured across multiple modelling approaches and was not dependent on a single algorithmic framework.
3.3. Probability Calibration
Calibration analysis was performed using pooled out-of-fold predictions obtained during repeated cross-validation.
Overall, all evaluated models demonstrated reasonable agreement between predicted and observed probabilities across risk strata. Logistic Regression and XGBoost showed the closest agreement with the ideal calibration line throughout most of the prediction range, whereas Random Forest and Support Vector Machine exhibited slightly greater deviations at higher predicted probabilities (Figure 3).
These findings indicate that predicted probabilities remained clinically interpretable and suitable for risk stratification purposes.
3.4. Operating Threshold Selection
To prioritise early donor recognition and minimise missed cases, operating thresholds were selected within each training fold under a predefined sensitivity constraint of at least 95%.
Threshold selection demonstrated good stability across repeated cross-validation iterations (Figure 4). For XGBoost, the median selected threshold was 0.316, while the mean threshold across validation folds was 0.313.
The relatively narrow distribution of selected thresholds suggests that operating-point selection was robust and not excessively dependent on individual training subsets.
3.5. Classification Performance at the Prespecified Operating Point
Using the median threshold derived from repeated cross-validation, pooled out-of-fold predictions from the XGBoost model demonstrated high sensitivity while maintaining moderate specificity.The main methodological and performance characteristics of the final XGBoost model are summarised in Table II.
Table 2.
Final XGBoost model characteristics.
| PARAMETER | VALUE |
|---|---|
| Study population | 163 admission brain CT reports |
| Brain death cases | n =96 |
| Non-brain death controls | n = 67 |
| Feature extraction | TF-IDF vectorisation |
| Validation strategy | Repeated stratified 5-fold cross-validation × 20 repetitions |
| Total validation folds | 100 |
| Probability calibration | Platt (sigmoid) scaling |
| Threshold selection strategy | Maximum Youden’s J under Sensitivity ≥ 0.95 |
| Mean selected threshold | 0.313 |
| 95% CI threshold | 0.303–0.323 |
| Mean ROC-AUC | 0.807 |
| Mean sensitivity | 0.947 |
| Mean specificity | 0.275 |
| Mean PPV | 0.657 |
| Mean NPV | 0.838 |
| Mean F1-score | 0.773 |
| Mean Brier score | 0.183 |
Thresholds were selected independently within each training fold before application to the corresponding validation fold. Calibration and threshold optimisation were performed exclusively within training data to minimise information leakage. Performance estimates correspond to pooled repeated cross-validation results.
The aggregated confusion matrix derived from all out-of-fold predictions is presented in Figure 5.
Confusion matrix generated from pooled out-of-fold predictions obtained across repeated stratified cross-validation. Counts represent aggregated validation predictions rather than individual patients. The matrix illustrates the classification behaviour of the model at the predefined operating threshold.
Consistent with the predefined objective of maximising donor detection, false-negative classifications remained uncommon, whereas a larger number of false-positive alerts were accepted as a trade-off for preserving sensitivity.
This operating profile is aligned with the intended use of the model as an early screening tool, where failure to identify a potential donor may carry greater clinical consequences than unnecessary clinical review.
3.6. Explainability Analysis
Global interpretability was explored using SHAP (SHapley Additive exPlanations) applied to the final XGBoost model.
The most influential radiological expressions included (Figure 6):
- encefálico (encephalic)
- apagamento (effacement)
- ventricular (ventricular)
- efeito (mass effect)
- parênquima (parenchyma)
- frontal (frontal)
- isquémica (ischaemic)
- estruturas da linha média (midline structures)
- massa (mass lesion)
- circulação (circulation)
Features ranked according to mean absolute SHAP value. Higher values indicate greater contribution to model output magnitude.
Many of these descriptors correspond to recognised imaging manifestations of catastrophic neurological injury, cerebral oedema, intracranial hypertension and brain herniation syndromes.
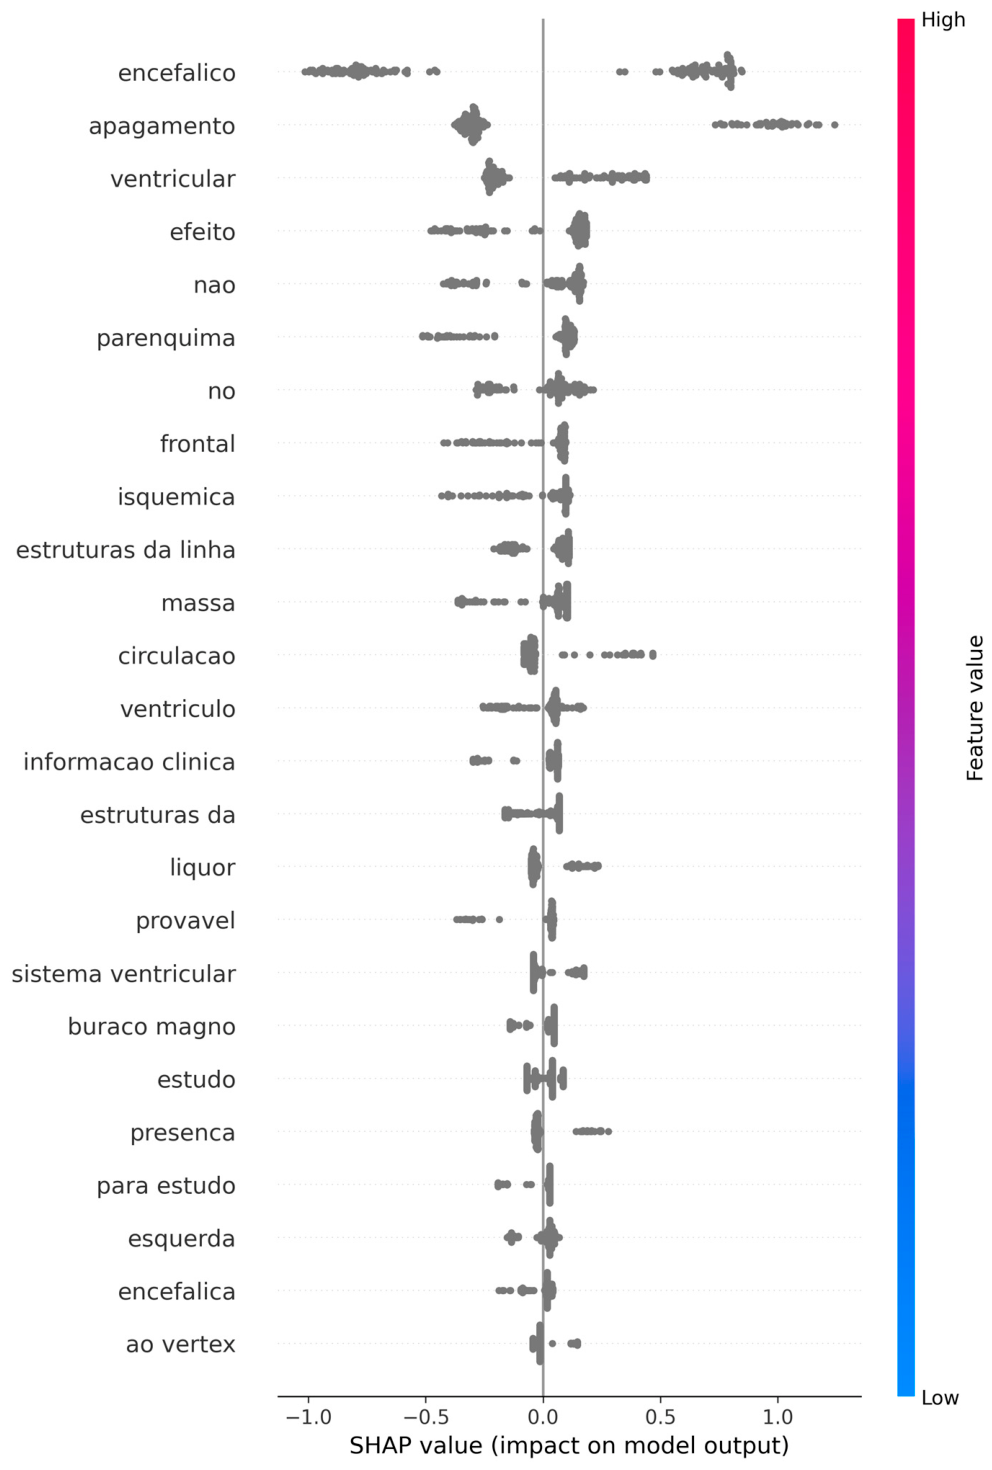
The SHAP summary plot further demonstrated biologically plausible directional effects. Terms describing extensive cerebral injury, ventricular distortion, loss of normal anatomical landmarks and mass effect generally increased the predicted probability of progression toward brain death, whereas their absence or lower expression contributed to lower predicted risk estimates (Figure 7).
Collectively, these findings support both the face validity and clinical interpretability of the proposed NLP framework.
4. Discussion
Authors should discuss the results and how they can be interpreted from the perspective of previous studies and of the working hypotheses. The findings and their implications should be discussed in the broadest context possible. Future research directions may also be highlighted. Predicting brain death (BD) is a crucial area of research with significant implications for optimising organ donation and patient management in intensive care units (ICUs) [10,11,12,13]. The scientific literature highlights a multifaceted approach to improving the early and accurate identification of patients likely to progress to BD, combining traditional clinical and radiological methods with advanced machine-learning techniques [14,15,16,17,18,19,20,21]. Developing computational tools capable of identifying potential donors remains a critical bottleneck in expanding the donor pool, as manual surveillance is inherently vulnerable to variability, communication delays and missed opportunities [4,7,22]. The overarching objective is to move beyond the recognition of catastrophic neurological events and towards the early prediction of progression to brain death itself. Nevertheless, publications addressing this specific challenge remain relatively scarce, with only a limited number of recent studies exploring automated donor-recognition strategies [23].
Several studies have underscored the importance of early clinical and radiological markers in predicting BD [15,19,21,24,25]. For example, Escudero et al. (2022) [26] identified multiple factors associated with early progression to BD, including a Glasgow Coma Scale (GCS) score below 5 at admission, midline shift, effacement of basal cisterns, effacement of cerebral sulci, obliteration of the suprasellar cistern and evidence of ependymal transudation. These variables provide important information regarding the severity of cerebral injury and the likelihood of irreversible neurological deterioration. Similarly, Galbois et al. (2013) [5] demonstrated that the number of abolished brainstem reflexes and the presence of the “swirl sign” on baseline CT imaging were strongly associated with progression towards BD in patients with spontaneous intracerebral haemorrhage. Their predictive scores achieved good sensitivity and specificity and highlighted the potential value of early radiological assessment for donor recognition.
Machine-learning approaches are increasingly emerging as powerful tools for improving prognostic accuracy in critical care settings. Sauthier et al. (2023) [7] developed a temporal machine-learning model for automated donor screening using routine clinical and laboratory time-series data. Their neural-network model achieved excellent discrimination and outperformed conventional logistic regression. Similarly, Yap et al. (2025) [27] demonstrated that an XGBoost model could accurately predict mortality following spontaneous intracerebral haemorrhage using routinely available clinical variables, outperforming established severity scores such as APACHE II and SOFA. In traumatic brain injury, machine-learning models have also shown promising performance for predicting radiological progression and clinical deterioration [25]. Furthermore, Itagaki et al. (2022) [6] developed an early BD prediction model for out-of-hospital cardiac arrest patients based on age, low-flow time, pH and aetiology of arrest, and subsequent studies have demonstrated that machine-learning approaches may further improve predictive performance in this setting [16,17,20,24].
Earlier work by Fernandes et al. (2015) [4] introduced a keyword-based natural language processing (NLP) tool for screening catastrophic neurological events in CT reports. That study achieved a sensitivity of 77% and a specificity of 66%, demonstrating both the feasibility of radiology-report screening and the limitations associated with manually curated keyword strategies. Unlike earlier approaches based on manually selected keywords or single train–test partitions, the present study incorporated several methodological safeguards intended to improve robustness and reduce optimism bias. These included repeated stratified cross-validation, fold-specific TF-IDF vectorisation, probability calibration performed exclusively within training folds and operating-threshold selection based solely on training data before application to independent validation folds. Collectively, these measures were designed to minimise information leakage and provide more realistic estimates of predictive performance within a relatively small single-centre cohort. Building upon that foundational work, the present study advances this concept by applying a calibrated NLP-based machine-learning framework to admission CT reports obtained between 2011 and 2024.
Among the evaluated algorithms, XGBoost achieved the highest discriminative performance, with a mean ROC-AUC of 0.807 (95% CI 0.793–0.820) across repeated cross-validation folds. The pooled out-of-fold ROC analysis yielded an ROC-AUC of 0.791, confirming consistent discrimination across repeated internal validation folds. Importantly, the model maintained a high-sensitivity operating profile following probability calibration and threshold optimisation.
The relatively small differences in performance between algorithms suggest that prognostic information was primarily embedded within the radiological text itself rather than being strongly dependent on model architecture.
These findings reinforce the concept that routinely generated radiology reports contain clinically meaningful prognostic information that can be leveraged for donor-recognition purposes without requiring additional data acquisition. Global explainability analysis using SHAP further supported the biological plausibility of the proposed framework. The most influential radiological expressions included encefálico (encephalic), apagamento (effacement), ventricular (ventricular), efeito (mass effect), parênquima (parenchyma), frontal (frontal), isquémica (ischaemic), estruturas da linha média (midline structures), massa (mass lesion), and circulação (circulation). Collectively, these descriptors correspond to recognised manifestations of severe cerebral injury, cerebral oedema, intracranial hypertension, mass effect and distortion of normal intracranial anatomy. The fact that the model relied predominantly on clinically interpretable radiological findings reduces concerns regarding purely statistical pattern recognition and strengthens confidence in the biological validity of the generated predictions.
Although rule-based preprocessing and negation handling were applied, a small number of residual linguistic tokens remained among lower-ranking SHAP features, reflecting the inherent variability of free-text radiology reporting.
These findings highlight the potential value of unstructured radiology text as an underused source of information for donor detection. Unlike many machine-learning systems requiring structured clinical databases or continuous physiological monitoring, CT reports are routinely generated in patients with severe neurological injury and are available early in the clinical pathway. Consequently, NLP-based screening systems may represent a pragmatic and scalable approach for supporting donor recognition in diverse healthcare environments. At the same time, the results emphasise the importance of standardised radiology reporting practices, as variability in terminology and reporting style may influence model performance and portability across institutions.
Despite the promising performance of the proposed framework, several limitations should be acknowledged. First, this was a single-centre retrospective study based on free-text radiology reports written in Portuguese. Consequently, model performance is influenced by local reporting practices, institutional workflows and linguistic conventions. Although this limits immediate generalisability, it also provided a controlled environment for developing and evaluating a proof-of-concept approach that may subsequently be adapted to other languages and institutions through retraining and standardised lexicons. Second, the relatively small sample size, reflecting the low incidence of brain death within individual centres, inevitably results in wider uncertainty around performance estimates than would be expected in larger multicentre cohorts. Nevertheless, the consistency of model performance across 100 independent validation folds generated through repeated cross-validation, together with stable calibration behaviour, supports the internal robustness of the proposed framework.
Clinical variables were not systematically incorporated into the present model. Although preliminary comparison suggested that reports assigned higher BD probabilities frequently corresponded to patients with lower GCS, more extensive herniation and severe supratentorial injury patterns, these observations were not formally analysed. Future studies should therefore explore the integration of structured clinical variables such as neurological examination findings, pupillary reactivity, intracranial pressure measurements and severity scores. Such multimodal approaches may enable more accurate prediction while facilitating direct comparison between radiological and clinical information sources.
Similarly, detailed temporal information regarding progression from the index CT examination to formal BD diagnosis was not consistently available. Most cases progressed to BD within clinically plausible timeframes consistent with previously published studies, but future datasets incorporating precise timestamps would permit the development of temporal prediction models capable of estimating not only the probability of progression but also the likely timing of neurological deterioration.
Future research should extend this text-based framework towards multimodal architectures integrating NLP-derived radiological features, structured clinical information and potentially image-based deep-learning approaches applied directly to CT data. Such integration could further improve predictive performance while maintaining interpretability through complementary explainability methods such as SHAP. Importantly, these systems should be viewed as decision-support tools rather than replacements for clinical judgement. Their role is to facilitate earlier recognition and prioritisation of potentially eligible donors while preserving clinician oversight throughout the donation pathway. As a proof-of-concept study, the present work provides a foundation for the future development of AI-assisted donor-recognition systems that may ultimately contribute to reducing missed donor opportunities and improving organ availability.
5. Conclusions
This study demonstrates that a natural language processing framework based exclusively on admission brain CT reports can support the early identification of patients at high risk of progression towards brain death. Using leakage-controlled validation procedures, probability calibration and repeated cross-validation, the proposed model achieved good discriminative performance, with a mean ROC-AUC of 0.807 (95% CI 0.793–0.820) across repeated cross-validation folds while maintaining a high-sensitivity operating profile appropriate for donor-screening applications. The results further demonstrate that clinically meaningful radiological descriptors embedded within routine free-text reports contain substantial prognostic information that can be automatically extracted and interpreted using machine-learning techniques. Importantly, explainability analyses confirmed that predictions were driven by recognised markers of severe neurological injury rather than opaque statistical artefacts.
Although external validation remains necessary before clinical implementation, this study supports the feasibility of NLP-assisted donor-recognition systems as a pragmatic adjunct to existing clinical workflows. Such tools may contribute to earlier identification of potential donors, improved situational awareness among transplant teams and ultimately a reduction in preventable missed donation opportunities, particularly in resource-constrained clinical environments.
Author Contributions
: Conceptualization, A.G. and A.P.F.; methodology, A.G. and A.P.F.; software, A.G.; validation, A.G., A.F., E.S. and A.P.F.; formal analysis, A.G.; investigation, A.P.F.; resources, A.P.F.; data curation, A.P.F.; writing—original draft preparation, A.G. and A.P.F.; writing—review and editing, A.G., A.F., E.S. and A.P.F.; visualization, A.G.; supervision, A.F. and A.P.F.; project administration, A.P.F.; funding acquisition, A.F., E.S.. All authors have read and agreed to the published version of the manuscript.
Funding
This research received no external funding. The article processing charge (APC) will be funded by TransplantHub® in the event of acceptance for publication.
Institutional Review Board Statement
The study was conducted in accordance with the Declaration of Helsinki and approved by the Institutional Review Board of Hospital Prof. Doutor Fernando Fonseca (Approval No. 084/2025).
Informed Consent Statement
Patient informed consent was waived due to the retrospective design of the study, the inclusion of deceased patients over an extended time-period, and the use of de-identified data.
Data Availability Statement
The clinical data supporting the findings of this study are not publicly available due to ethical and privacy restrictions. The analytical code used for data preprocessing, feature extraction, model development, validation, calibration, threshold selection, and explainability analyses will be made publicly available in a dedicated GitHub repository upon publication of the article.
Conflicts of Interest
The authors declare no conflicts of interest. The funders had no role in the design of the study; in the collection, analyses, or interpretation of data; in the writing of the manuscript; or in the decision to publish the results”.
Abbreviations
The following abbreviations are used in this manuscript:
| AI | Artificial Intelligence |
| APACHE II | Acute Physiology and Chronic Health Evaluation II |
| APC | Article Processing Charge |
| BD | Brain Death |
| CI | Confidence Interval |
| CT | Computed Tomography |
| GCS | Glasgow Coma Scale |
| ICU | Intensive Care Unit |
| ML | Machine Learning |
| NBD | Non-Brain Death |
| NLP | Natural Language Processing |
| NPV | Negative Predictive Value |
| Portable Document Format | |
| PPV | Positive Predictive Value |
| RBF | Radial Basis Function |
| ROC | Receiver Operating Characteristic |
| ROC-AUC | Area Under the Receiver Operating Characteristic Curve |
| SHAP | SHapley Additive exPlanations |
| SOFA | Sequential Organ Failure Assessment |
| STROBE | Strengthening the Reporting of Observational Studies in Epidemiology |
| SVM | Support Vector Machine |
| TF-IDF | Term Frequency-Inverse Document Frequency |
| TRIPOD+AI | Transparent Reporting of a Multivariable Prediction Model for Individual Prognosis or Diagnosis + Artificial Intelligence |
| XGBoost | Extreme Gradient Boosting |
References
- Organization WH. Global Observatory on Donation and Transplantation: Organ donation and transplantation activities, 2023. 2023. [Google Scholar]
- Ismail, A.J.B.; Ahmad, N.D.; Ching, C.S.; Lean, C.S.; Keong, T.T.B.; Zaini, M.I.; Kheng, C.P. Barriers to the identification of possible organ donors among brain-injured patients admitted to intensive care units. Korean J. Transplant. 2023, 37(2), 85–94. [Google Scholar] [CrossRef] [PubMed]
- Qu, Z.; Oedingen, C.; Bartling, T.; Beneke, J.; Zink, M.; Krauth, C.; Schrem, H. Systematic review on potential brain dead donor estimations and conversion rates to actually realized organ donations. Transpl. Rev. 2021, 35(4), 100638. [Google Scholar] [CrossRef] [PubMed]
- Fernandes, A.P.; Gomes, A.; Veiga, J.; Ermida, D.; Vardasca, T. Imaging screening of catastrophic neurological events using a software tool: preliminary results. Transpl. Proc. 2015, 47(4), 1001–4. [Google Scholar] [CrossRef] [PubMed]
- Galbois, A.; Boelle, P.Y.; Hainque, E.; et al. Prediction of evolution toward brain death upon admission to ICU in comatose patients with spontaneous intracerebral hemorrhage using simple signs. Transpl. Int. 2013, 26(5), 517–26. [Google Scholar] [CrossRef] [PubMed]
- Itagaki, Y.; Hayakawa, M.; Maekawa, K.; Kodate, A.; Moriki, K.; Takahashi, Y.; Sageshima, H. Early prediction model of brain death in out-of-hospital cardiac arrest patients: a single-center retrospective and internal validation analysis. BMC Emerg. Med. 2022, 22(1), 177. [Google Scholar] [CrossRef] [PubMed]
- Sauthier, N.; Bouchakri, R.; Carrier, F.M.; et al. Automated screening of potential organ donors using a temporal machine learning model. Sci. Rep. 2023, 13(1), 8459. [Google Scholar] [CrossRef] [PubMed]
- Vandenbroucke, J.P.; von Elm, E.; Altman, D.G.; et al. Strengthening the Reporting of Observational Studies in Epidemiology (STROBE): explanation and elaboration. PLoS Med. 2007, 4(10), e297. [Google Scholar] [CrossRef] [PubMed]
- Collins, G.S.; Moons, K.G.M.; Dhiman, P.; et al. TRIPOD+AI statement: updated guidance for reporting clinical prediction models that use regression or machine learning methods. BMJ. 2024, 385, e078378. [Google Scholar] [CrossRef] [PubMed]
- Agarwal, S.; Morris, N.; Der-Nigoghossian, C.; May, T.; Brodie, D. The Influence of Therapeutics on Prognostication After Cardiac Arrest. Curr. Treat. Options Neurol. 2019, 21(12), 60. [Google Scholar] [CrossRef] [PubMed]
- Bevers, M.B. Refining the continuum of neurologic prognosis - Predicting brain death after cardiac arrest. Resuscitation 2023, 192, 109990. [Google Scholar] [CrossRef] [PubMed]
- Busl, K.M.; Maciel, C.B. When the heart comes back but the brain is lost-are we ready to predict brain death after cardiac arrest? Resuscitation 2022, 179, 256–258. [Google Scholar] [CrossRef] [PubMed]
- Heppekcan, D.; Ekin, S.; Çivi, M.; Aydın Tok, D. Impact of Secondary Insults in Brain Death After Traumatic Brain Injury. Transpl. Proc. 2019, 51(7), 2186–2188. [Google Scholar] [CrossRef] [PubMed]
- Arsava, E.M.; Ayvacioglu Cagan, C.; Gumeler, E.; Parlak, S.; Oguz, K.K.; Topcuoglu, M.A. Comparison of early- and late-phase CT angiography findings in brain death. J. Neurol. 2022, 269(11), 5973–5980. [Google Scholar] [CrossRef] [PubMed]
- Çevikkalp, E.; Taşkapılıoğlu, M. Predictive Values of Hematological Parameters for Determining Imminent Brain Death: A Retrospective Study. Medicina 2023, 59(2). [Google Scholar] [CrossRef] [PubMed]
- Cour, M.; Turc, J.; Madelaine, T.; Argaud, L. Risk factors for progression toward brain death after out-of-hospital cardiac arrest. Ann. Intensive Care 2019, 9(1), 45. [Google Scholar] [CrossRef] [PubMed]
- Kitlen, E.; Kim, N.; Rubenstein, A.; et al. Development and validation of a novel score to predict brain death after out-of-hospital cardiac arrest. Resuscitation 2023, 192, 109955. [Google Scholar] [CrossRef] [PubMed]
- Lee, B.K.; Min, J.H.; Park, J.S.; Kang, C.; Lee, B.K. Early identified risk factors and their predictive performance of brain death in out-of-hospital cardiac arrest survivors. Am. J. Emerg. Med. 2022, 56, 117–123. [Google Scholar] [CrossRef] [PubMed]
- Maniakhina, L.E.; Muir, S.M.; Tackett, N.; Johnson, D.; Mentzer, C.J.; Mount, M.G. Significant Hypophosphatemia Is Predictive of Brain Death in Severe Traumatic Brain Injury. Am. Surg. 2023, 89(7), 3278–3280. [Google Scholar] [CrossRef] [PubMed]
- Song, H.; Oh, S.H.; Woo, H.R.; On Behalf Of Crown, I. Brain Death and Its Prediction in Out-of-Hospital Cardiac Arrest Patients Treated with Targeted Temperature Management. Diagnostics 2022, 12(5). [Google Scholar] [CrossRef] [PubMed]
- Stefani, M.A.; Modkovski, R.; Hansel, G.; et al. Elevated glutamate and lactate predict brain death after severe head trauma. Ann. Clin. Transl. Neurol. 2017, 4(6), 392–402. [Google Scholar] [CrossRef] [PubMed]
- Tommasino, N.; Forteza, D.; Godino, M.; Mizraji, R.; Álvarez, I. A Model to Predict Progression in Brain-Injured Patients. Transplant. Proc. 2014, 46(9), 2950–2952. [Google Scholar] [CrossRef] [PubMed]
- Schoene, D.; Freigang, N.; Trabitzsch, A.; et al. Identification of patients at high risk for brain death using an automated digital screening tool: a prospective diagnostic accuracy study. J. Neurol. 2023, 270(12), 5935–5944. [Google Scholar] [CrossRef] [PubMed]
- Sandroni, C.; D'Arrigo, S.; Cacciola, S.; et al. Prediction of poor neurological outcome in comatose survivors of cardiac arrest: a systematic review. Intensive Care Med. 2020, 46(10), 1803–1851. [Google Scholar] [CrossRef] [PubMed]
- Shafiei, M.; Sabouri, M.; Veshnavei, H.A.; Tehrani, D.S. Predictors of radiological contusion progression in traumatic brain injury. Int. J. Burn. Trauma. 2023, 13(2), 58–64. [Google Scholar]
- Escudero, D.; Astola, I.; Balboa, S.; et al. Clinico-radiological related to early brain death factors. Med. Intensiv. (Engl Ed) 2022, 46(1), 1–7. [Google Scholar] [CrossRef] [PubMed]
- Yap, X.V.; Tu, K.C.; Chen, N.C.; et al. Developing a high-performance AI model for spontaneous intracerebral hemorrhage mortality prediction using machine learning in ICU settings. BMC Med. Inf. Decis. Mak. 2025, 25(1), 149. [Google Scholar] [CrossRef] [PubMed]
Figure 1.
Dataset characteristics before and after preprocessing. (a–b) Distribution of word counts per report before and after preprocessing. (c–f) Word clouds for brain death (BD) and non–brain death (NBD) groups using raw and curated vocabularies. Word size reflects term frequency. Non-clinical and identifying terms were removed in the curated set.
Figure 1.
Dataset characteristics before and after preprocessing. (a–b) Distribution of word counts per report before and after preprocessing. (c–f) Word clouds for brain death (BD) and non–brain death (NBD) groups using raw and curated vocabularies. Word size reflects term frequency. Non-clinical and identifying terms were removed in the curated set.
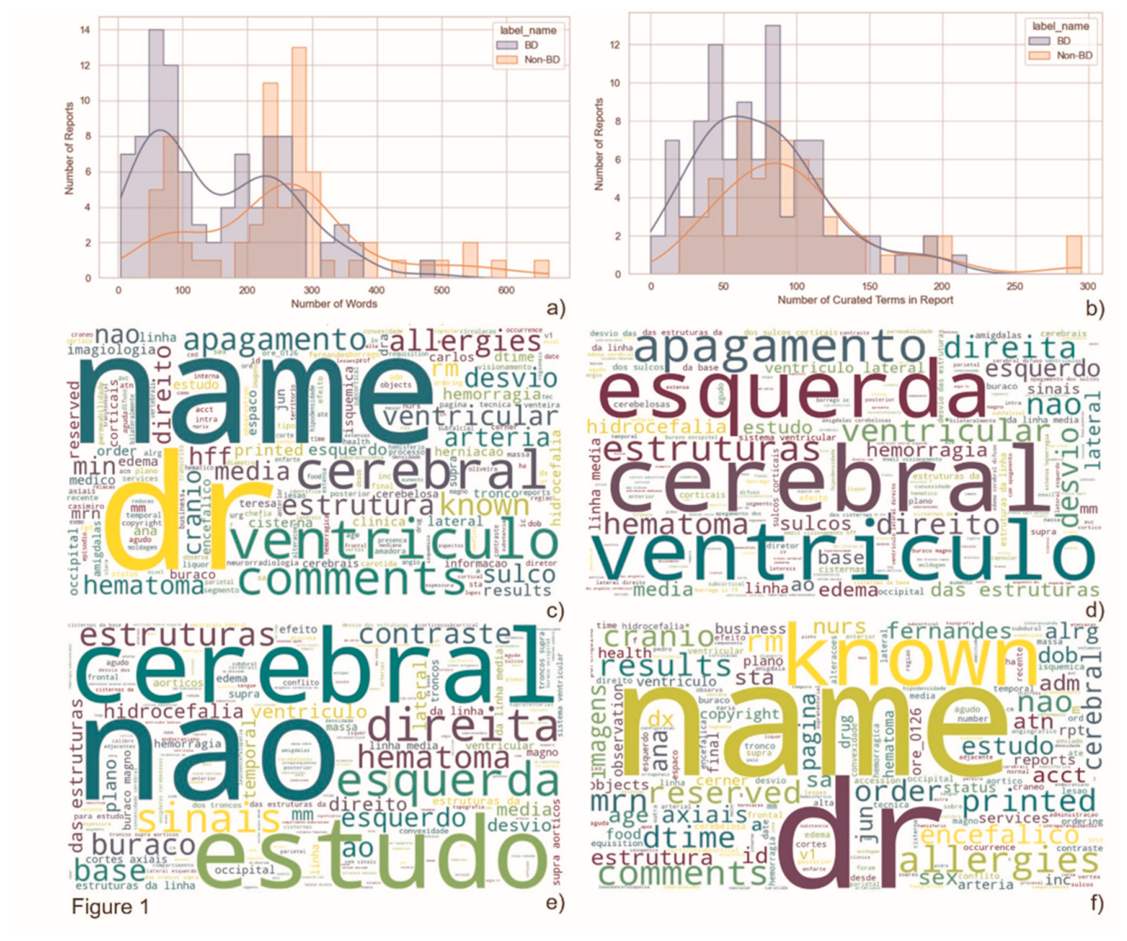
Figure 2.
Discriminative performance of machine-learning models using pooled out-of-fold predictions. Receiver operating characteristic (ROC) curves derived from pooled out-of-fold predictions obtained during repeated stratified 5-fold cross-validation with 20 repetitions. XGBoost achieved the highest pooled ROC-AUC (0.791), followed by Random Forest (0.785), Logistic Regression (0.764) and Support Vector Machine (0.750). Mean model performance and corresponding 95% confidence intervals across validation folds are presented in Table I. The dashed diagonal line represents random classification.
Figure 2.
Discriminative performance of machine-learning models using pooled out-of-fold predictions. Receiver operating characteristic (ROC) curves derived from pooled out-of-fold predictions obtained during repeated stratified 5-fold cross-validation with 20 repetitions. XGBoost achieved the highest pooled ROC-AUC (0.791), followed by Random Forest (0.785), Logistic Regression (0.764) and Support Vector Machine (0.750). Mean model performance and corresponding 95% confidence intervals across validation folds are presented in Table I. The dashed diagonal line represents random classification.
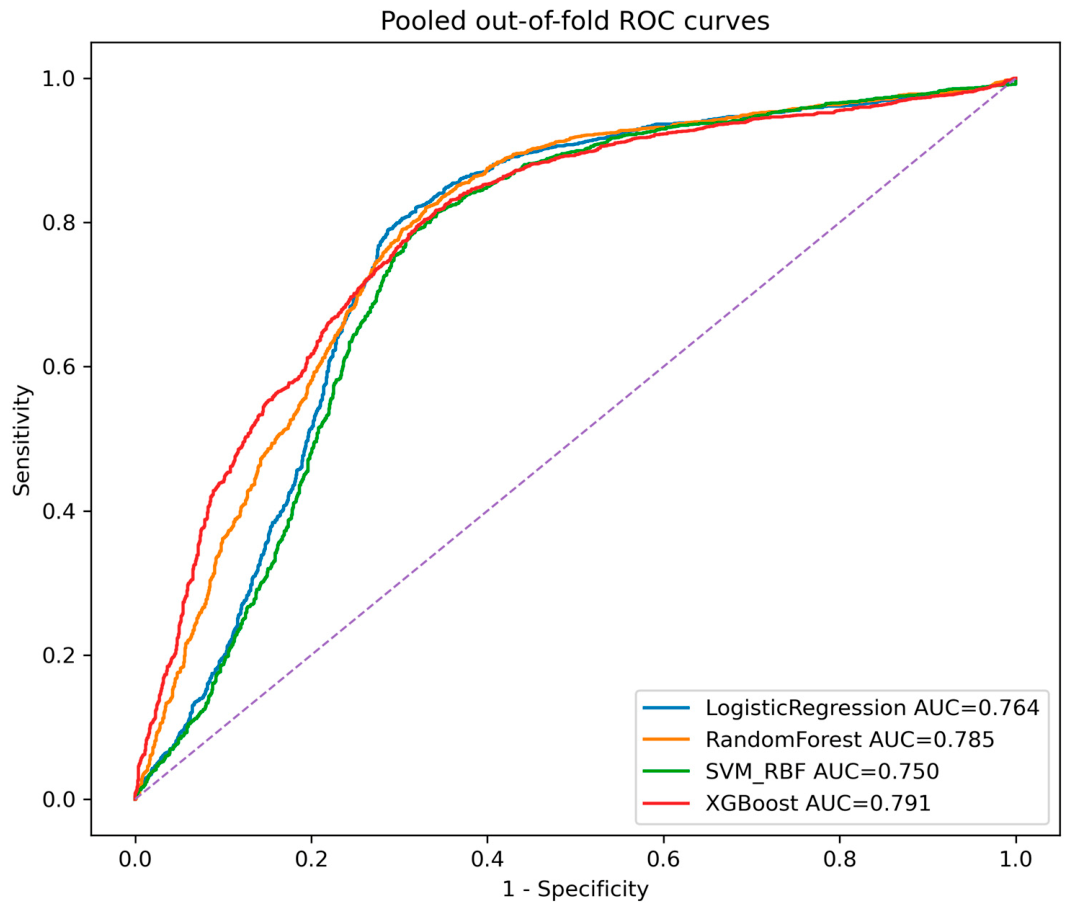
Figure 3.
Calibration performance using pooled out-of-fold predictions. Calibration curves comparing predicted probabilities with observed event frequencies across probability bins. The dashed diagonal line represents perfect calibration. Curves closer to the diagonal indicate better agreement between predicted and observed risk.
Figure 3.
Calibration performance using pooled out-of-fold predictions. Calibration curves comparing predicted probabilities with observed event frequencies across probability bins. The dashed diagonal line represents perfect calibration. Curves closer to the diagonal indicate better agreement between predicted and observed risk.
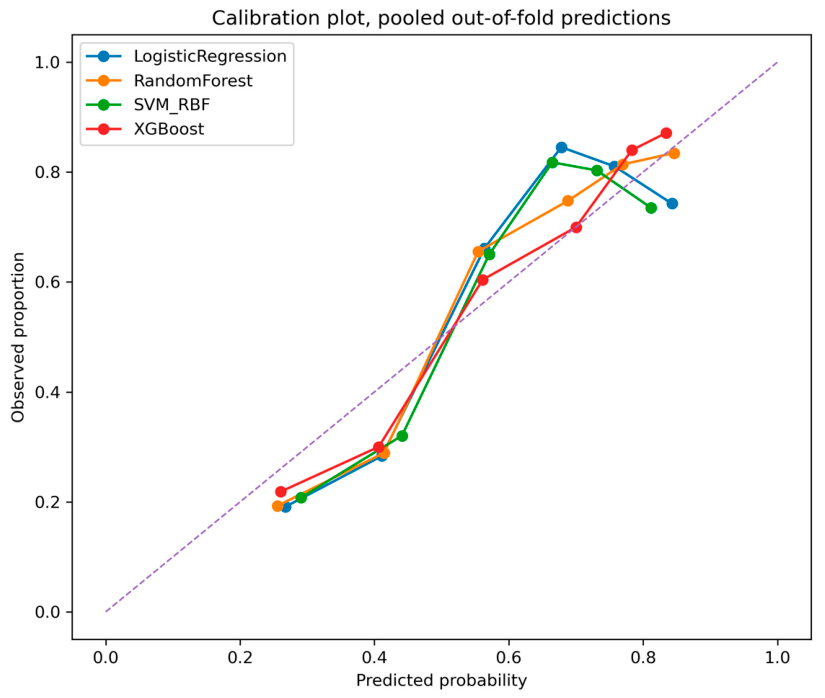
Figure 4.
Distribution of training-selected operating thresholds across repeated cross-validation iterations. Distribution of probability thresholds selected within training folds using Youden’s J statistic under the predefined sensitivity constraint (Sensitivity ≥ 0.95). Boxes represent interquartile ranges, horizontal lines indicate medians and triangles represent means.
Figure 4.
Distribution of training-selected operating thresholds across repeated cross-validation iterations. Distribution of probability thresholds selected within training folds using Youden’s J statistic under the predefined sensitivity constraint (Sensitivity ≥ 0.95). Boxes represent interquartile ranges, horizontal lines indicate medians and triangles represent means.
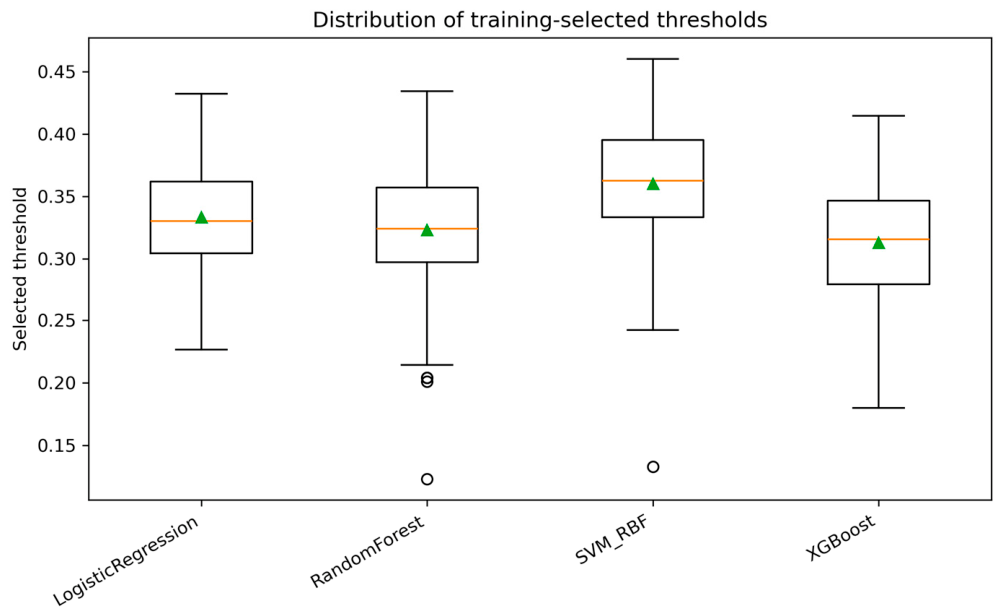
Figure 5.
Aggregated confusion matrix for XGBoost using pooled out-of-fold predictions.
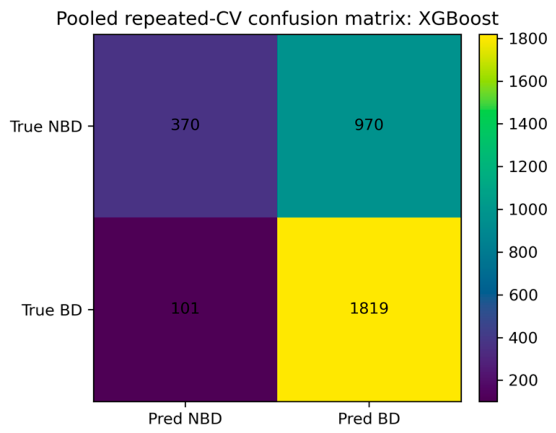
Figure 6.
Global feature importance derived from SHAP analysis.
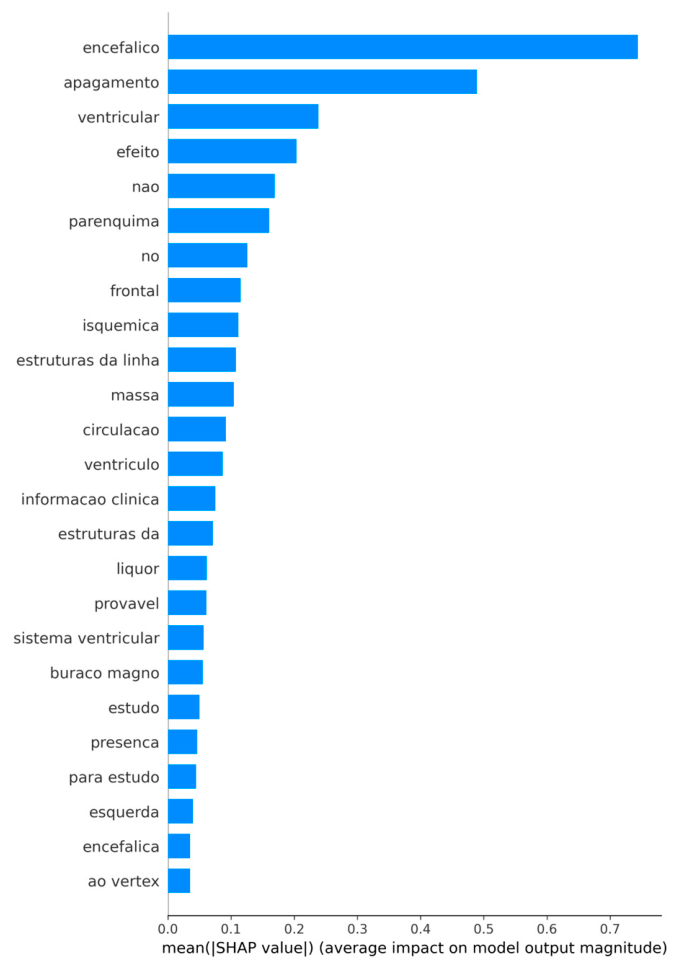
Figure 7.
SHAP summary plot of the final XGBoost model. Distribution of SHAP values for the most influential radiological expressions. Each point represents one CT report. Position on the horizontal axis indicates impact on model prediction. Features are ordered according to overall importance.
Figure 7.
SHAP summary plot of the final XGBoost model. Distribution of SHAP values for the most influential radiological expressions. Each point represents one CT report. Position on the horizontal axis indicates impact on model prediction. Features are ordered according to overall importance.
Disclaimer/Publisher’s Note: The statements, opinions and data contained in all publications are solely those of the individual author(s) and contributor(s) and not of MDPI and/or the editor(s). MDPI and/or the editor(s) disclaim responsibility for any injury to people or property resulting from any ideas, methods, instructions or products referred to in the content. |
© 2026 by the authors. Licensee MDPI, Basel, Switzerland. This article is an open access article distributed under the terms and conditions of the Creative Commons Attribution (CC BY) license.
Copyright: This open access article is published under a Creative Commons CC BY 4.0 license, which permit the free download, distribution, and reuse, provided that the author and preprint are cited in any reuse.