

Submitted:
17 October 2026
Posted:
19 October 2026
You are already at the latest version
Abstract
This paper presents two related benchmark studies of AI-enabled security for FR3 (7-24 GHz) ultra-massive MIMO (UM-MIMO) 6G IoT networks, addressing two different layers of the security stack. Study 1 evaluates machine learning approaches for network-layer intrusion detection using a telecom-relevant benchmark dataset (UNSW-NB15), cross-validating multiple classifiers and reporting a systematic literature synthesis, data-quality audit, and hyperparameter-tuned test-set performance comparison. Study 2 evaluates physical-layer angle-of-arrival (AoA) spoofing detection for FR3 UM-MIMO IoT authentication, benchmarking equal and adaptive snapshot-allocation policies for multi-device authentication under a shared sensing budget, validated against closed-form Cramer-Rao bound theory. Together, the two studies show that AI-enabled security benchmarking must be evaluated separately at each layer, network-layer intrusion detection depends primarily on model choice, hyperparameter tuning, and data-quality awareness, while physical-layer spoofing detection depends primarily on how a shared sensing budget is allocated across devices, indicating that a defence-in-depth FR3 UM-MIMO IoT security posture needs distinct, layer-appropriate AI benchmarking rather than a single unified approach.
Keywords:
internet of things
; intrusion detection system
; machine learning
; UNSW-NB15
; physical layer au-thentication
; angle of arrival
; spoofing detection
; FR3
; ultra-massive MIMO
; 6G
1. Introduction
This paper reports two complementary benchmark studies of security enabled by artificial intelligence (AI) in frequency range 3 (FR3) ultra-massive multiple-input multiple-output (UM-MIMO) sixth-generation (6G) Internet of Things (IoT) networks. The studies are combined because both quantify how well AI and machine learning (ML) methods defend the same class of deployment at two different layers: the network layer (Study 1) and the physical layer (Study 2).
Global IoT deployments now number in the tens of billions of connected endpoints. The telecommunications networks that carry their traffic, whether cellular, fixed broadband, or low-power wide-area access, have become a frontline target for network-borne attacks such as botnet recruitment, distributed denial-of-service (DDoS) campaigns, and reconnaissance probing. Because many IoT endpoints are resource-constrained and rarely patched, network-level intrusion detection, rather than endpoint hardening alone, has become a primary control for telecom operators and enterprise network administrators.
The transition to 6G systems sharpens these concerns. The ITU-R IMT-2030 framework identifies massive communication and integrated sensing and communication among the defining usage scenarios of 6G [1], and 6G visions anticipate very large antenna arrays and a convergence of communication with sensing [2]. Surveys of 6G-enabled IoT emphasize that very large numbers of resource-constrained devices will share this infrastructure [3], including in smart-city deployments that combine terrestrial and satellite connectivity [4], while 6G security roadmaps anticipate that AI and ML will act both as security enablers and as new attack surfaces [5]. The upper mid-band FR3 (7–24 GHz) is a leading candidate spectrum for this role: it offers wider bandwidths than sub-6 GHz bands and more favorable propagation than millimeter-wave (mmWave) bands, but realizing its capacity is expected to require large antenna arrays [6]. Security for FR3 UM-MIMO IoT networks must therefore be provided at two layers at once: in the network, where traffic from very many heterogeneous devices must be screened for attacks, and at the physical layer, where the base-station array itself can help verify which device is actually transmitting.
ML and deep learning (DL) methods have been widely proposed as a replacement for, or complement to, signature-based intrusion detection systems (IDS) because they can generalize to previously unseen attack variants. A large and rapidly growing body of survey literature covers this space; however, as Section 4.1 documents, recent reviews converge on a small set of unresolved gaps: dataset staleness and class imbalance, insufficient testing under IoT-representative hardware constraints, and inconsistent evaluation protocols across studies. A related, often overlooked issue is that many benchmark results in this literature are single-split point estimates without cross-validation or hyperparameter tuning, which limits confidence in the reported performance differences between methods.
Study 1 makes three contributions. First, it synthesizes findings from recent (2024–2026) peer-reviewed surveys and systematic reviews of ML/DL-based intrusion detection to characterize the current state of the field and its open gaps. Second, it presents an original empirical benchmark that addresses common methodological weaknesses in this literature: cross-validated performance with variance estimates, randomized hyperparameter search instead of default configurations, an explicit data-quality audit of the benchmark dataset, a reconciliation of two commonly used but rarely compared feature-importance methods, and a multi-class evaluation that exposes per-class performance hidden by aggregate binary metrics. Third, it discusses the scope of a general network-intrusion dataset (UNSW-NB15) for telecom-relevant conclusions. The dataset was generated with the IXIA PerfectStorm traffic generator to emulate realistic mixed-protocol network traffic and is not a telecom-carrier or cellular-access capture. Consistent with its dominant role in the surveyed literature, it is used here as an accessible and widely comparable benchmark for evaluating detection approaches whose computational trade-offs (accuracy versus training/inference cost) are relevant to telecom edge and gateway deployment, not as a claim of telecom-traffic fidelity.
Study 2 addresses a second, complementary security layer for the same class of FR3 UM-MIMO IoT deployment: physical-layer authentication via angle-of-arrival spoofing detection.
Wireless networks are open by construction, and traditional upper-layer authentication, which relies on cryptographic pre-shared secrets, faces growing key-management overhead in dense, dynamic IoT deployments. Physical-layer authentication (PLA) offers a complementary approach: it exploits properties of the wireless channel or of the antenna array itself, rather than a shared secret, to distinguish a legitimate transmitter from an impersonator [7]. Angle of arrival (AoA) is a particularly well-suited PLA feature for large-array systems: a verifier estimates the direction from which a signal arrived, compares it with the registered (enrolled) direction of the legitimate device, and rejects transmissions whose estimated angle deviates too far [8]. Because an impersonation attacker, by definition, transmits from a different physical location than the device it impersonates, AoA-PLA exploits geometry rather than a spoofable signal characteristic. Its detection reliability is governed by the Cramér–Rao bound (CRB) on AoA estimation variance, a closed-form, independently derivable quantity rather than an empirically tuned threshold [9].
FR3 (7–24 GHz) UM-MIMO base stations are relevant to this technique for a quantifiable reason. AoA estimation precision improves with array size (the CRB scales inversely with M(M−1)(2M−1) for an M-element array [10,11]), and FR3 is expected to require element counts well beyond the 256-element scale already used in fifth-generation New Radio (5G NR) to realize its capacity potential [6]. This extends the large-array gains established for massive MIMO [12,13] and offers correspondingly finer angular resolution than smaller arrays can achieve. It also raises a system-level question that has not been addressed in the single-device AoA-PLA literature: a base station authenticating many registered IoT devices cannot necessarily devote unlimited observation time (snapshots) to each device’s authentication, because snapshot-collection time is shared with, and traded off against, the same array’s communication and sensing duties (the same shared-resource structure addressed, for different purposes, in the authors’ companion studies). Given a limited per-cycle snapshot budget shared across many devices, how should it be allocated to best detect a spoofing attack against any one of them?
Study 2 builds an open simulation that combines the validated 256-element FR3 array model used in the authors’ companion studies with the closed-form AoA maximum-likelihood estimator and CRB from the PLA literature. The Monte Carlo simulation is first validated against the independently derived closed-form theory and then used to test this shared-budget allocation question. The result is a mechanistically diagnosed negative finding for the most natural adaptive approach. A policy that concentrates additional snapshots on devices whose brief preliminary observation appears suspicious performs substantially worse than simply splitting the budget equally across all devices. This is not because concentration is conceptually flawed, but because a short preliminary window is too noisy a signal to guide it reliably. We verify this by measuring how often the adaptive policy actually targets the true spoofed device, and we confirm it by showing that a longer, more reliable preliminary window recovers its performance.
The contributions of Study 2 are (1) an open multi-device AoA-PLA simulation for FR3 UM-MIMO, physically validated against independently derived closed-form CRB theory and released with full source code; (2) the identification and mechanistic diagnosis of a failure mode of adaptive snapshot allocation under a shared security budget; and (3) a controlled variant confirming the diagnosis by showing that the predicted fix (a more reliable preliminary signal) recovers the lost performance.
2. Related Work
Physical-layer security has a well-developed theoretical and practical literature, spanning secrecy-oriented multiuser and multi-antenna techniques [14] and authentication schemes that verify a transmitter from channel- or device-dependent features rather than from shared keys [15]. In massive MIMO, the large array makes passive eavesdropping comparatively difficult but leaves the system exposed to active attacks, most notably pilot contamination, in which an attacker transmits a legitimate user’s pilot to corrupt the base station’s channel estimate and redirect beamformed transmission [16,17]. Angle-based authentication is designed to counter this active-impersonation threat. Angle estimation itself rests on classical array-processing theory: parametric direction-of-arrival methods and their statistical performance limits are well characterized [18], and the maximum-likelihood direction-of-arrival estimator is asymptotically efficient, attaining the CRB as the number of snapshots grows [10].
AoA has been used as a physical-layer security feature since early work that exploited antenna-array phase information to improve wireless security in indoor Wi-Fi networks [19]. In massive MIMO, angle-based features have been used for spoofing detection under impersonation attacks [20], and channel-gain and phase-noise features have been exploited for PLA in the same array regime [21]. ML-based AoA-PLA has been studied for mmWave and massive MIMO systems: one study develops model-free, lightweight ML-based AoA-PLA and validates it on experimental outdoor massive MIMO data, showing effective impersonation resistance under realistic conditions [22]. A dedicated identity-spoofing detection scheme for IoT devices in mmWave massive MIMO 5G networks, which combines virtual-AoA features with ML, addresses the IoT deployment context that the multi-device scenario of Study 2 extends [23].
The theoretical foundation for the CRB validation in Study 2 (Section 5.2) is a recent closed-form analysis of AoA-PLA robustness under spoofing. That analysis derives the misspecified CRB and analytical spoofing-detection, false-alarm, and misdetection probabilities for a uniform linear array verifier, and confirms, consistent with the present findings, that larger arrays and more snapshots substantially improve spoofing-detection reliability [9]. Beyond angle-based features, massive MIMO PLA has also exploited large-scale fading and channel-hardening properties for downlink authentication against rogue base stations [24], indicating that AoA is one of several viable PLA feature families rather than the only option. The shared-budget allocation question of Study 2, however, applies specifically where a spatial (angle-resolving) verifier is used and, to our knowledge, has not been addressed in this broader PLA literature, which typically considers a single device authenticated in isolation rather than many devices contending for a shared observation budget. The benchmark structure of Study 2, which isolates the value of an adaptive resource-allocation signal by measuring its reliability and then confirms the diagnosis with a controlled variant, follows the design used for the wireless-power-transfer and opportunistic-sensing scheduling problems addressed in the authors’ companion studies, here applied to security rather than to energy or environmental sensing.
Related physical-layer authentication and pilot-spoofing detection literature includes channel-statistics-based pilot-spoofing detection and precoding countermeasures in massive MIMO, channel-estimation-based spoofing detection without prior knowledge of the attacker’s channel, cooperative-relay-assisted spoofing detection for massive MIMO mmWave systems, online ML-based PLA for mmWave MIMO, and a survey of ML-based PLA approaches [25,26,27,28,29].
The allocation question studied here is also related to the statistical literature on sequential and active hypothesis testing, in which a decision-maker chooses how many, or which, observations to collect before deciding. Wald’s sequential probability ratio test established how to decide between hypotheses using a data-dependent number of observations under specified error probabilities [30], and active sequential hypothesis testing formalizes the case in which the decision-maker also chooses which observations to take, with asymptotic optimality guarantees that hold only under specific conditions [31]. Study 2 examines a practical instance of this question in which the adaptation signal is a short, noisy preliminary measurement and the observation budget is shared across many devices.
The intrusion-detection evaluation sits within a closely related body of IoT and network security literature: systematic reviews of explainable DL-based intrusion detection for IoT networks [32], broader surveys of IDS for IoT [33], and methodological work on the UNSW-NB15 benchmark dataset, including its known class-overlap and imbalance issues [34] and dedicated visual and statistical analysis of the dataset [35]. The cross-validated benchmark of Study 1 is designed to complement, and be comparable with, this dataset-specific methodological literature. Beyond UNSW-NB15, several IoT-specific datasets have been released to address the limited IoT fidelity of general-purpose captures, including Bot-IoT, recorded on a realistic IoT botnet testbed [36]; the TON_IoT telemetry dataset of heterogeneous IoT and industrial IoT (IIoT) sensor data [37]; and CICIoT2023, generated on a topology of 105 real IoT devices [38]. Data-quality problems in IDS benchmarks are not new: an influential analysis of the KDD CUP 99 dataset found that roughly 78% of its training records and 75% of its test records were duplicates, which biased learners toward frequent records and inflated reported accuracy; this analysis motivated the de-duplicated NSL-KDD dataset [39]. The creators of UNSW-NB15 compared its feature distributions and complexity with those of KDD99 in their own statistical analysis [40].
Taken together, these literatures leave two gaps that this paper addresses. On the network side, ML-based intrusion detection results on UNSW-NB15 and related datasets are frequently reported as single-split point estimates with default hyperparameters, without an explicit audit of duplicate records or of per-class performance. This makes it difficult to judge whether reported differences between methods are real and whether they hold for minority attack types; Study 1 addresses this with a cross-validated, tuned benchmark accompanied by a data-quality audit and a multi-class evaluation. On the physical-layer side, angle-based authentication has been analyzed almost entirely for a single device authenticated in isolation, whereas an FR3 UM-MIMO base station must authenticate many registered devices from a shared, finite observation budget; Study 2 addresses how that budget should be allocated and why a natural adaptive policy fails.
Study 1: Network Intrusion Detection
3. Materials and Methods
3.1. Literature Review Protocol
A narrative synthesis was conducted of English-language, peer-reviewed survey and systematic-review articles on ML/DL-based intrusion detection for IoT networks published between 2024 and 2026, identified through web-based academic search. Sources included ScienceDirect, Wiley Online Library, Springer/Discover, PMC, and MDPI Algorithms and Sensors. Search terms combined “IoT,” “intrusion detection,” “machine learning,” “deep learning,” and “survey” or “systematic review.” Seven survey-level sources meeting these criteria, complemented by two peer-reviewed analyses specific to UNSW-NB15 [34,35], are synthesized in Section 4.1. This is a narrative review rather than a formal systematic review following the Preferred Reporting Items for Systematic Reviews and Meta-Analyses (PRISMA), and the source set should be treated as representative rather than exhaustive. Closely related benchmark and dataset literature includes the original CICIDS2017 dataset-construction study, large-scale DL-based IDS benchmarking across multiple datasets, deep-autoencoder-based network traffic anomaly detection, the peer-reviewed 5G-NIDD dataset descriptor built from a live 5G testbed, and supervised ML benchmarking on the 5G-NIDD dataset [41,42,43,44,45].
3.2. Dataset and Known Limitations
The empirical benchmark uses UNSW-NB15, a network traffic dataset created by the Australian Centre for Cyber Security with the IXIA PerfectStorm tool [40,46]. It comprises 175,341 labeled records with 45 raw attributes describing flow-level statistics (duration, protocol, byte/packet counts, time-to-live (TTL) values, jitter, connection-state counters, and related features). Records are labeled as benign or as one of nine attack categories (Analysis, Backdoor, DoS, Exploits, Fuzzers, Generic, Reconnaissance, Shellcode, Worms). UNSW-NB15 was selected because it remains among the most widely cited benchmarks in the surveyed literature and is publicly available under a permissive license, supporting reproducibility.
UNSW-NB15 has documented data-quality limitations that are relevant to interpreting benchmark results obtained on it. Independent visualization-based analyses have reported substantial class overlap and both between- and within-class imbalance in this dataset, concluding that these issues should be characterized before the dataset is used for classifier development [34,35]. The data-quality audit of Study 1 (Section 4.2) identified a further issue that, to our knowledge, has not been reported previously: 67,601 of 175,341 records (38.6%) are exact duplicates once the auto-incrementing record identifier field is excluded. This is consistent with, and adds a concrete quantitative figure to, the redundancy concerns raised in the wider IDS-dataset literature [33], and it echoes the much larger duplication previously documented in the KDD CUP 99 dataset [39].
3.3. Preprocessing
Records with missing values were removed (none were present in this dataset release). Categorical fields (protocol, service, connection state) were one-hot encoded. All numeric features were scaled to the [0,1] range by min–max normalization. The processed feature matrix was split into training (80%) and test (20%) partitions by stratified sampling on the binary label, preserving the class ratio in both partitions. Consistent with most of the surveyed literature, and to preserve comparability with previously reported benchmark figures on this dataset, the duplicate records identified in Section 3.2 were retained in the primary analysis. Their presence is treated as a data-quality finding to be reported and discussed (Section 4.2 and Section 7) rather than silently corrected, because removing them would make the headline numbers of Study 1 non-comparable with most prior work on this dataset, which neither reports nor controls for this issue.
3.4. Cross-Validation and Hyperparameter Tuning Protocol
To address the single-split, default-hyperparameter methodology common in the surveyed literature, model evaluation proceeded in three stages. First, all four classifiers were evaluated with default scikit-learn [47] hyperparameters using 10-fold stratified cross-validation, with the mean and standard deviation reported for accuracy, precision, recall, F1-score, and the area under the receiver operating characteristic curve (AUC) (Section 4.3). Second, the hyperparameters of each model were tuned by randomized search [48] (scikit-learn RandomizedSearchCV, 3-fold internal cross-validation, F1-score as the selection criterion); the selected (tuned) hyperparameter values are reported in Section 4.4. Third, each tuned model was retrained on the full 80% training partition and evaluated once on the held-out 20% test partition to produce the headline comparison reported in Section 4.4; this single hold-out evaluation matches the single-split protocol common in the surveyed literature and so preserves comparability with it.
Cross-validation and hyperparameter search were computationally demanding in the single-core evaluation environment described in Section 3.5; in particular, K-Nearest Neighbors has O(n) inference cost per query, which makes repeated 10-fold evaluation on the full 175,341-record dataset impractical within a reasonable time budget. For tractability, cross-validation and tuning (Section 4.3 and Section 4.4) were therefore performed on a stratified random subsample of 30,000 records (17.1% of the full dataset, class ratio preserved). The final test-set evaluation of the tuned models (Section 4.4) and the multi-class analysis (Section 4.7) use the complete dataset. This subsampling decision is itself a small illustration of the accuracy/compute trade-off discussed at the model level in Section 4.6: exhaustive evaluation protocols carry a real computational cost that shapes what is practical to report, including in this study.
Performance is reported with metrics suited to imbalanced data. Accuracy alone is misleading when classes are skewed, because a classifier can score highly by favoring the majority class [49]. Precision, recall, F1-score, and AUC are therefore reported alongside accuracy for the binary task, and per-class precision, recall, and F1-score, with macro- and support-weighted averages, are reported for the multi-class task. Recall is treated as the security-critical metric, since a false negative corresponds to an undetected intrusion. Two further design choices should be noted. First, no resampling (e.g., the synthetic minority oversampling technique, SMOTE [50]) or class weighting was applied, so the reported results reflect the native class distribution of the dataset; this makes the minority-class failures reported in Section 4.7 directly visible rather than partially masked. Second, the headline test-set figures (Section 4.4) come from a single evaluation on the held-out 20% test partition rather than from the cross-validation folds used to select hyperparameters, which limits the optimistic bias that arises when a tuned model is scored on the same folds used to select it [51]. Because the tuning subsample (Section 3.4) was drawn from the full dataset rather than strictly from the training partition, some residual optimism cannot be excluded. A fully nested design, in which the tuning subsample is drawn only from the training partition and model selection is repeated inside each outer cross-validation fold, would remove any residual optimism and is identified as a refinement for future work (Section 8).
3.5. Computational Environment
All experiments were run in a single-core containerized Linux environment (Intel Xeon processor, 2.10 GHz, 1 logical core, 4 GB RAM) using Python 3.12.3, scikit-learn 1.8.0, pandas 3.0.2, and NumPy 2.4.4. All reported training and inference times (Section 4.6) are wall-clock times in this single-core environment and should be interpreted as relative comparisons between the four methods studied, not as absolute or cross-study benchmarks; a production or multi-core environment would be expected to reduce absolute times, particularly for Random Forest, which parallelizes across trees.
3.6. Models Evaluated
Four supervised classifiers, chosen to span a range of computational profiles relevant to telecom deployment (from lightweight linear models to ensemble methods), were evaluated for binary (benign vs. attack) classification: Decision Tree, Random Forest [52], Logistic Regression, and K-Nearest Neighbors, all implemented in scikit-learn [47]. A tuned Random Forest was also evaluated on the multi-class (nine-attack-category) task (Section 4.7).
These models differ in ways that matter for deployment. A decision tree classifies a record with a single root-to-leaf traversal, which makes inference very cheap but leaves the model sensitive to the particular training sample. A Random Forest averages many decision trees, each grown on a bootstrap sample with a random subset of features considered at each split; this reduces variance and provides built-in impurity-based feature-importance estimates [52], at the cost of training and evaluating many trees. Logistic regression is a linear model whose inference is a single weighted sum followed by a logistic function, which makes it among the lightest of the four at inference time. K-Nearest Neighbors has negligible training cost but must compare each query with stored training records at inference time, so its inference cost grows with the size of the training set. Together, the four models span the range from lightweight linear models to ensemble and instance-based methods relevant to telecom edge and gateway hardware.
3.7. Generative AI Disclosure
Literature retrieval, statistical/ML analysis, figure generation, and manuscript drafting for this article were carried out with the assistance of an AI language model (Claude, Anthropic) under direct human supervision and iterative review, including a structured methodological review that informed the cross-validation, hyperparameter-tuning, data-quality-audit, and multi-class analyses reported in this article. All reported empirical results were computed by executing the described code on the cited public dataset. The authors were responsible for verifying, and take full responsibility for, the accuracy of all reported figures.
4. Results
4.1. Literature Synthesis: State of the Field and Identified Gaps
Across these nine sources (seven surveys and systematic reviews and two dataset-specific analyses), several converging themes emerge. Rahman, Shakil, and Mustakim [33] report that benchmark datasets commonly used for IoT IDS research suffer from significant class imbalance, were not originally designed to capture IoT-specific traffic characteristics, and in many cases are now dated relative to contemporary attack techniques. A related theme concerns deployability: Mallidi et al. [53] note that integrating ML/DL models into real IoT security systems remains constrained by resource-intensive architectures and a shortage of real-world testing on heterogeneous, low-power IoT hardware, and they call for lightweight detection frameworks capable of real-time adaptation.
A large-scale systematic review following the PRISMA methodology, covering 129 studies published in 2018–2025, examined the trade-offs between detection accuracy, computational overhead, and interpretability in explainable DL-based IDS for IoT and concluded that these trade-offs remain insufficiently characterized in the literature [32]. A separate PRISMA-based review of IoT DDoS detection research from 2019–2024 found that Decision Tree and Random Forest models combined with the Bot-IoT and TON_IoT datasets dominate the literature and routinely report median accuracies above 99%, while identifying dataset diversity, real-time implementation, and scalability as persistent open challenges [54].
Other recent surveys similarly emphasize the need for standardized evaluation metrics and comparability across studies [55]; the promise and current limitations of DL architectures for automatically learning hierarchical traffic representations [56]; and the applicability of ensemble, transfer, and federated learning to IoT security tasks beyond intrusion detection, including privacy and trust management, in a survey that explicitly notes that it does not conduct new empirical benchmarking [57]. Taken together, the reviewed literature converges on three gaps that motivate the empirical component of Study 1: (G1) dataset staleness/imbalance; (G2) insufficient evaluation under IoT-representative computational constraints; and (G3) inconsistent, non-standardized evaluation protocols that limit cross-study comparability, including, as this study adds, a frequent absence of cross-validation and hyperparameter tuning.
Table 1 situates the results of this study within the range reported elsewhere for UNSW-NB15 and related IoT benchmark datasets. The tuned Random Forest result obtained here (96.0% binary accuracy) is broadly consistent with, though somewhat below, the highest figures reported by studies that use additional techniques such as ensemble stacking or class-overlap correction [34] or that evaluate on different, less overlap-prone datasets [54]. This gap is discussed in Section 7 in light of the data-quality findings of this study (Section 4.2).
4.2. Data Quality Audit
Before modeling, the dataset was audited for missing values and duplication. No missing values were present. However, when the auto-incrementing record identifier field is excluded, 67,601 of the 175,341 records (38.6%) are exact duplicates of another row in the dataset. To our knowledge, this finding has not previously been reported in the peer-reviewed literature at this precision, although it is consistent with the broader class-overlap and redundancy concerns documented by independent visualization-based analyses of UNSW-NB15 [34,35]. As Figure 1 shows, the class distribution is highly imbalanced even before duplication is considered: the smallest attack categories, Worms and Shellcode, are represented by only 130 and 1,133 records, respectively, whereas Generic and Exploits attacks number in the tens of thousands. Figure 2 shows that the aggregate binary split is 68.1% attack traffic versus 31.9% benign traffic; it is skewed toward attack traffic because the dataset was purpose-built to include a wide range of attack scenarios rather than to reflect live network traffic proportions.
Correlation analysis (Figure 3) shows that TTL-based features (sttl, the strongest single correlate, and ct_state_ttl), destination load and mean packet size (dload, dmean), connection-count features (ct_dst_sport_ltm, ct_src_dport_ltm, ct_dst_src_ltm), and Transmission Control Protocol (TCP) window and sequence-number features (swin, dwin, stcpb, dtcpb) are the strongest linear correlates of the attack label. Section 4.5 examines whether this ranking agrees with that of a second, non-linear feature-importance method.
4.3. Baseline Cross-Validated Performance
Table 2 and Figure 4 report 10-fold stratified cross-validation results for all four classifiers with default hyperparameters, evaluated on a stratified 30,000-record subsample (Section 3.4). Reporting the standard deviation across folds, rather than a single-split point estimate, allows the apparent ranking of the models to be assessed against its own uncertainty.
With cross-validation variance made explicit, the advantage of Random Forest over Decision Tree in accuracy (1.5 percentage points) and F1-score (1.1 points) exceeded the combined standard deviations of both models and is therefore unlikely to be attributable to sampling noise alone. The recall advantage of Logistic Regression (0.9940 vs. 0.9757 for Random Forest) likewise lay outside the overlap of the two models’ standard deviations, supporting the conclusion in Section 4.4 that Logistic Regression is the strongest choice when minimizing false negatives is the priority.
4.4. Hyperparameter Tuning and Final Test-Set Performance
Randomized search (Section 3.4) identified the tuned configurations shown in Table 3, each selected by its 3-fold cross-validated F1-score on the 30,000-record subsample.
Each tuned model was retrained on the full 80% training partition (140,272 records) and evaluated once on the held-out 20% test partition (35,069 records); results are reported in Table 4.
Tuning changed the default-hyperparameter ranking in one notable respect: tuned K-Nearest Neighbors (distance-weighted, k = 15) improved substantially over its default configuration (test-set accuracy 0.9481 and AUC 0.9863, compared with 10-fold cross-validated means of 0.9319 and 0.9692 with default hyperparameters in Table 2), narrowing the gap to Random Forest. Random Forest retained the highest overall accuracy (95.99%), F1-score (0.9708), and AUC (0.9939). Logistic Regression, despite having the lowest accuracy of the four models (92.72%), retained the highest recall (98.87%); that is, it missed the fewest actual attacks, a property that may be preferable where false negatives (undetected intrusions) are costlier than false positives. The binary confusion matrix and Gini feature importances of the tuned Random Forest are shown in Figure 5 and Figure 6, respectively.
4.5. Feature Importance Reconciliation
Figure 3 (Pearson correlation) and Figure 6 (Random Forest Gini importance) rank features by two different criteria: linear, univariate association with the label versus non-linear, multivariate contribution to ensemble split quality. The Spearman rank correlation between the two rankings across all 38 numeric features was weak and not statistically significant at the 0.05 level (ρ = 0.28, p = 0.088; Figure 7). Only 5 of the top 12 features were shared between the two rankings (ct_state_ttl, dload, dmean, rate, and sttl). Seven features ranked highly under Pearson correlation but not under Gini importance (including connection-count features such as ct_dst_sport_ltm and TCP window/sequence features such as swin, dwin, stcpb, and dtcpb), whereas a different seven ranked highly under Gini importance but not under Pearson correlation (including sbytes, dbytes, sload, and tcprtt).
This divergence has a plausible explanation: Gini importance can credit a feature for its contribution within specific decision-tree splits conditioned on other features, whereas Pearson correlation measures only marginal, linear association. Features with strong non-linear or interaction effects (e.g., byte-count and load features) can therefore rank highly under one method and modestly under the other. The practical implication is that studies in the surveyed literature that report feature importance using only one method, which is the common case, may be reporting a method-dependent artifact rather than a method-agnostic property of the dataset; cross-method reconciliation of this kind is not standard practice in the reviewed literature. Impurity-based importance is also known to be biased toward features with many possible split points or different scales [59]; permutation-based importance [60] and Shapley-value attributions [61] offer alternatives that could test whether the divergence observed here persists under a less biased measure.
4.6. Computational Cost
Figure 8 reports the wall-clock training and inference times of the four tuned models in the single-core evaluation environment described in Section 3.5. Random Forest, despite its superior detection performance, required roughly 21× the training time of Logistic Regression and had measurably higher inference latency than either Logistic Regression or Decision Tree. Tuned K-Nearest Neighbors trained almost instantly (lazy learning) but incurred by far the highest inference cost of the four models, making it the least suitable for latency-sensitive, high-throughput deployment at telecom network scale despite its improved accuracy after tuning.
4.7. Multi-Class Performance and Class-Imbalance Effects
Binary classification, as reported in Section 4.3 and Section 4.4, treats all attack types as a single positive class and can obscure whether a model actually distinguishes between attack categories or has instead learned to separate a few dominant categories from benign traffic. To test this, the tuned Random Forest configuration (Table 3) was retrained for multi-class classification across the nine attack categories plus benign traffic, using the same 80/20 split.
The multi-class model achieved 83.0% overall accuracy, but this aggregate figure conceals sharply divergent per-class performance (Table 5 and Figure 9). The macro-averaged F1-score (0.58, unweighted across the ten classes) was substantially lower than the support-weighted average F1-score (0.81) because the model performed well on the numerically dominant classes (Generic: F1 = 0.99, n = 8,005; Normal: F1 = 0.94, n = 11,200) but poorly on several minority classes (DoS: F1 = 0.16, recall = 10%, n = 2,483; Backdoor: F1 = 0.22, n = 314; Analysis: F1 = 0.23, n = 422; Worms: F1 = 0.28, n = 28).
Notably, class support alone does not fully explain per-class performance: DoS, with 2,483 test examples (more than five times the support of Backdoor or Analysis), nonetheless had the lowest F1-score of any class (0.16). The confusion matrix (Figure 10) clarifies why: 87% of true DoS traffic was misclassified as Exploits, and large fractions of Analysis (68%), Backdoor (73%), and Worms (82%) traffic, as well as a smaller but notable share of Reconnaissance (24%) traffic, were also misclassified as Exploits. This pattern is consistent with the class-overlap phenomenon reported for UNSW-NB15 by Zoghi et al. [34,35]: several attack categories in this dataset are not well separated, linearly or even non-linearly, from the Exploits category in the feature space used here, and a classifier optimized for aggregate accuracy or binary detection will systematically default to the majority-adjacent class under ambiguity.
Study 2: Angle-of-Arrival Spoofing Detection
5. System Model and Methods
5.1. Array Model and AoA Signal Model
A 256-element uniform linear array (ULA) at 15 GHz in FR3 with half-wavelength element spacing matches the array configuration validated in the authors’ companion studies. A registered device at true angle θ transmits K known pilot snapshots. The received-signal model of the verifier, and the maximum-likelihood AoA estimator that minimizes the sum of squared residuals across snapshots, follow the closed-form signal model of a published AoA-PLA study [9], adapted here to the FR3 array configuration used throughout the authors’ companion studies. For an M-element ULA with half-wavelength spacing, the array response to a far-field source at angle θ is the steering vector a(θ) with elements exp(jπ(m−1)sinθ), m = 1, …, M [11]. With K snapshots of a known pilot, the maximum-likelihood estimate of θ minimizes the sum of squared residuals between the received snapshots and the modeled array response, and its variance approaches the CRB as the number of snapshots or the signal-to-noise ratio (SNR) grows [10,62]. Arrays of this size are the defining feature of massive and ultra-massive MIMO base stations [12,13,63], which already use multi-beam beamforming to serve many devices simultaneously [64]; the array used for multi-user beamforming is therefore also available, at the cost of dwell time, as an authentication sensor.
5.2. AoA Estimator Validation Against Closed-Form CRB
The maximum-likelihood AoA estimator (Section 5.1) is implemented as a coarse angular grid search followed by parabolic interpolation around the grid maximum. On inspection, an initial grid-only implementation was found to produce an empirical estimation variance of exactly zero at M = 256: the CRB-predicted precision (below 0.01° at typical operating points) was far finer than the grid spacing, so every noise realization mapped to the same nearest grid point. This implementation limitation, which is not a property of the underlying estimator, was identified and corrected before any benchmark result was generated. After this correction, the Monte Carlo simulation (200–300 trials per condition) was validated against the closed-form CRB [9] across seven SNR values (−20 to +10 dB) at K = 10 snapshots, and separately across combinations of K, SNR, and registered angle, with empirical-to-theoretical variance ratios of 0.94–1.07 throughout. This confirms that the simulated estimator is statistically efficient and matches independently derived theory.
5.3. Multi-Device Authentication Under a Shared Snapshot Budget
A total of N = 10 devices are registered at randomized angles within a 60° sector. In each authentication cycle, a total snapshot budget B is shared across all N devices, representing the real trade-off between array dwell time spent on authentication and that spent on communication and sensing duties. In spoofing trials, one randomly chosen device is impersonated by an attacker transmitting from a small angular offset from its registered angle (0.1°, only a few CRB standard deviations at the tested SNR and preliminary snapshot counts, chosen to create an uncertain detection regime rather than a trivially easy or trivially hopeless one); in false-alarm trials (20% of trials), no device is spoofed. Two snapshot-allocation policies are compared. Equal allocation splits B evenly across all N devices. Risk-adaptive allocation first spends a small fixed preliminary budget (min_k snapshots) on every device and then allocates the remaining budget preferentially to the devices whose preliminary test statistic (angular deviation from the registered angle) is largest, on the reasoning that confidently legitimate devices gain little detection benefit from further observation, whereas suspicious devices benefit most. Detection is declared correct if the device with the largest final test statistic is the device actually spoofed; a false alarm is declared if, in a no-spoofing trial, the test statistic of any device exceeds a fixed operational threshold (0.15°, calibrated to keep false alarms low under equal allocation at moderate-to-large budgets).
The spoofing model corresponds to the active-impersonation threat identified for massive MIMO, in which an attacker transmits the signals that the verifier expects from a legitimate device [16,17]. The attacker is assumed to know the legitimate device’s pilot but not to be co-located with it, so the only discriminating feature available to the verifier is the angle from which the pilot arrives. Results are aggregated over 150 trials per budget value and, for the targeting-accuracy measurement, over 100 spoofing trials at the representative operating point (Section 6.3). The simulation is deterministic given its random seed, and the complete code is provided as supplementary material so that every reported figure can be regenerated (see Data Availability Statement).
5.4. Generative AI Disclosure
Literature retrieval, the AoA estimator and CRB validation code, the multi-device scheduling simulation, the diagnostic investigation described in Section 6.3, figure generation, and manuscript drafting for this article were carried out with the assistance of an AI language model (Claude, Anthropic) under direct human supervision and iterative review. The coarse-grid estimator limitation described in Section 5.2 was identified and corrected before any benchmark result was generated. All reported quantitative results were computed by executing the described simulation code. The authors are responsible for verifying, and take full responsibility for, the accuracy of all reported figures, model assumptions, and citations.
6. Results
All results were obtained by running the code described in Section 5; no result was written before the corresponding code was executed.
6.1. Simulation Validated Against Closed-Form Theory
Figure 11 shows close agreement between the Monte Carlo simulation and the independently derived closed-form CRB across a 30 dB SNR range, with empirical-to-theoretical variance ratios of 0.94–1.07 across all tested (K, SNR, angle) combinations (Section 5.2). This confirms that the simulated AoA estimator is statistically efficient and consistent with published theory, rather than only internally self-consistent, before any scheduling comparison is drawn from it. This agreement is expected from estimation theory, since the maximum-likelihood direction-of-arrival estimator is asymptotically efficient [10,62].
6.2. Equal Allocation Substantially Outperforms Adaptive Allocation
Figure 12 shows a large, consistent gap in favor of the classical equal-allocation policy at every tested budget. At budget = 80 (K = 8 snapshots per device under equal allocation), equal allocation achieved 100% detection with 0% false alarms, whereas risk-adaptive allocation (preliminary window min_k = 2) achieved only 29.2% detection with an 86.7% false-alarm rate. The adaptive policy was thus worse on both axes simultaneously, rather than offering a detection–false-alarm trade-off in its favor. This pattern held across the full tested budget range (20–120): the adaptive policy never matched, let alone exceeded, the detection or false-alarm performance of equal allocation.
6.3. Mechanism: A Short Preliminary Window Is an Unreliable Allocation Signal
Direct measurement resolves this apparent contradiction, namely that a policy designed to concentrate observation on the most suspicious device performs worse than ignoring risk information entirely. Across 100 spoofing trials at budget = 80, the device receiving the most snapshots under adaptive allocation was the true spoofed device in only 13% of trials, barely above the 10% chance level for ten devices. At the tested SNR (−20 dB), the two-snapshot preliminary window is simply too noisy relative to the underlying CRB (a standard deviation of approximately 0.039° at K = 2, less than half of, but of the same order as, the 0.1° spoof offset itself) to reliably identify the suspicious device. In effect, the adaptive policy concentrates snapshots on the basis of noise rather than signal. This both wastes budget that could have gone to the true spoofed device (reducing detection) and gives an arbitrary, randomly selected legitimate device extra opportunities to cross the false-alarm threshold by chance (inflating false alarms), an effect akin to multiple comparisons.
Figure 13 confirms this diagnosis. As the preliminary round size increased from 2 to 6 snapshots per device, targeting accuracy rose from near chance (7.5%; the separate 100-trial measurement reported above gave 13%, which is consistent within Monte Carlo sampling variability at these trial counts) to near certainty (93.3%), and the detection rate rose almost in lockstep, from 29.2% to 94.2%, closely approaching the reference performance of equal allocation. This shows that the failure of the adaptive policy at short preliminary windows is a signal-reliability problem, not a flaw in the concept of risk-adaptive allocation: given a sufficiently reliable preliminary signal, the same allocation logic performs competitively. A preliminary round of min_k = 8 snapshots (not shown in Figure 13) exhausts the entire budget of 80 with N = 10 devices, so the adaptive policy degenerates to equal allocation by construction. This degenerate case was excluded from Figure 13 as uninformative, because once no discretionary budget remains, the targeting-accuracy metric becomes an artifact of tie-breaking rather than a meaningful measurement.
7. Joint Discussion
The empirical results both corroborate and substantially refine the gaps identified in the literature synthesis. Cross-validation (Section 4.3) confirmed that the advantage of Random Forest over Decision Tree, and the recall advantage of Logistic Regression, are unlikely to be artifacts of a single favorable train/test split, addressing a weakness (single-split reporting) common in the surveyed literature. Hyperparameter tuning (Section 4.4) showed that this ranking is not fixed: K-Nearest Neighbors with default hyperparameters underperformed its tuned counterpart by a meaningful margin, illustrating that benchmark comparisons using default configurations, as in most of the surveyed literature, may understate the true competitiveness of simpler methods.
The data-quality audit (Section 4.2) and multi-class analysis (Section 4.7) together provide a more concerning and, we believe, more useful finding than the binary accuracy figures alone. The substantial duplication in this dataset (38.6% of records) and its severe class overlap between minority attack categories and Exploits (Figure 10) mean that a headline binary accuracy of 96% coexists with a multi-class model that fails to usefully detect DoS, Backdoor, Analysis, or Worms traffic as distinct categories. Any telecom or IoT security deployment relying on a model validated only by aggregate binary accuracy on this dataset would have no visibility into this failure mode. This is a quantitative illustration of gap G1 (dataset staleness/imbalance), and it extends that gap: the problem is not simply that some classes have few examples, but that these classes are not well separated from a specific majority class in the available feature space, a distinction the aggregate accuracy metric cannot reveal.
The weak agreement between the Pearson-correlation and Gini-importance feature rankings (Section 4.5, ρ = 0.28) bears on gap G3 (inconsistent evaluation protocols): several studies in the surveyed literature report a single feature-importance ranking as though it were a stable property of the dataset. The reconciliation performed here suggests that such single-method rankings are, at least in part, artifacts of the ranking method itself, and that studies drawing operational conclusions from a single importance method (e.g., proposing reduced feature sets for lightweight IDS) should validate those conclusions against at least one alternative method.
Regarding computational cost (Section 4.6), the roughly 21× training-time gap between Random Forest and Logistic Regression, and the comparatively very high inference latency of K-Nearest Neighbors, provide quantitative support for gap G2: without further optimization (e.g., pruning, quantization, ball-tree/KD-tree indexing, or model distillation), high-accuracy ensemble and instance-based methods impose training and inference costs that may be difficult to justify on telecom-edge or IoT gateway hardware with limited compute and power budgets. These timings are specific to the single-core environment described in Section 3.5 and should be read as relative comparisons rather than absolute benchmarks.
Finally, the related-work comparison (Table 1) shows that the tuned Random Forest result of this study (96.0% binary accuracy) lies within, but not at the top of, the range reported elsewhere for UNSW-NB15. Studies reporting higher figures typically employ techniques not used here, such as explicit class-overlap correction, ensemble stacking across multiple algorithm families, or engineered/selected feature subsets, and the more conservative preprocessing of this study (Section 3.3: duplicates retained, no overlap correction) plausibly accounts for some of this gap. This is treated as a limitation (Section 8) rather than as a discrepancy to be resolved, since the retained duplicates and uncorrected overlap are the data-quality properties this study aims to expose rather than optimize away.
The Study 2 discussion below addresses the allocation trade-off specific to physical-layer spoofing detection. Taken together, the two studies indicate that AI-enabled security benchmarking cannot be reduced to a single cross-layer metric: network-layer intrusion detection is governed by model and data-quality choices, whereas physical-layer authentication is governed by how a shared, finite sensing budget is allocated. A defense-in-depth FR3 UM-MIMO IoT deployment needs both, each evaluated on its own terms.
The finding of Study 2 is a quantifiable instance of a security-relevant caution: an adaptive resource-allocation policy is only as trustworthy as the signal it adapts to, and a plausible risk-based heuristic can be counterproductive, rather than merely suboptimal, if that signal is unreliable. This matters more in a security context than in a pure efficiency context, because the failure mode identified here (near-chance targeting, inflated false alarms) is the kind of behavior a sophisticated adversary could potentially exploit, for example by deliberately triggering ambiguous preliminary readings on other devices to draw authentication resources away from the actual attack. The simulation was not designed to test this resource-exhaustion-style vulnerability, but the diagnosed mechanism makes it plausible and worth investigating in future work.
The practical recommendation from this result is straightforward and, in a security context, conservative by design: a base station sharing a limited authentication snapshot budget across many registered devices should default to equal allocation unless it has validated confidence that its risk-adaptive trigger signal is reliable at the operating SNR and preliminary-window length in use. As Section 6.3 shows, such confidence can be established before deployment by measuring targeting accuracy against known ground truth in controlled testing. This result extends to a security domain a pattern observed in the authors’ companion studies: a fair, uninformed baseline is frequently a strong, difficult-to-beat policy for resource-allocation problems in which the reliability of the informing signal cannot be taken for granted.
Both studies have practical implications beyond their specific benchmark settings. For network operators and IoT platform providers, Study 1 indicates that model selection for gateway- or edge-deployed intrusion detection should weigh recall and inference cost alongside accuracy. The favorable recall-per-unit-compute trade-off of Logistic Regression makes it a candidate first-stage filter on constrained hardware, with heavier ensemble models reserved for aggregation points where compute is available, and any model intended to distinguish between attack types should be validated per class rather than on aggregate binary accuracy. The data-quality audit also has a procedural implication for dataset curators and benchmark users: duplicate-record checks and per-class reporting are inexpensive and should precede model comparison. For FR3 UM-MIMO base-station designers, Study 2 indicates that angle-based authentication can reuse the array already deployed for multi-user beamforming, requiring dwell time rather than additional hardware, and that this dwell time should by default be allocated equally across devices unless the reliability of an adaptive trigger has been validated at the operating SNR. Because the two mechanisms operate at different layers and fail in different ways, they are complementary components of a defense-in-depth architecture for 6G IoT rather than alternatives: network-layer detection screens traffic regardless of its origin, whereas physical-layer authentication verifies the origin of a transmission before its traffic is trusted.
8. Limitations and Future Research Directions
Study 1 has several limitations. First, the empirical benchmark uses a single dataset (UNSW-NB15); although widely cited, it is a general network-intrusion dataset generated by a traffic emulator rather than collected from live telecom or IoT device traffic, and the results should not be assumed to transfer directly to IoT-native traffic distributions (Section 1). Second, cross-validation and hyperparameter tuning (Section 4.3 and Section 4.4) were performed on a 30,000-record stratified subsample for computational tractability (Section 3.4); although the final test-set evaluation (Table 4) and multi-class analysis (Section 4.7) use the full dataset, the optimal hyperparameters might differ slightly if tuning were performed on the full 175,341-record dataset. Third, duplicate records (Section 4.2) were retained rather than removed to preserve comparability with prior literature; a sensitivity analysis with duplicates removed was not performed in this study and is identified as a direct next step. Fourth, DL architectures (e.g., convolutional neural networks, long short-term memory networks, and autoencoders), which are prominent in the surveyed literature, were outside the scope of Study 1. Fifth, the literature synthesis in Section 4.1 is narrative rather than a formal PRISMA systematic review and should be read as representative, rather than exhaustive, of the current literature. Sixth, the reported computational-cost figures are specific to a single-core evaluation environment (Section 3.5) and are not directly comparable to multi-core or production benchmarks reported elsewhere.
Study 2 also has limitations. First, the signal model (Section 5.1) assumes a narrowband, far-field, line-of-sight (LoS) channel with known channel-state information, following the closed-form theory against which it is validated [9]. Multipath, near-field effects (increasingly relevant at FR3 array scales, as noted in the authors’ companion studies), and unknown channel gain were not modeled; they would be expected to degrade absolute detection performance for both policies, although the qualitative finding (adaptive allocation requires a reliable trigger signal) is a property of the resource-allocation structure and is not specific to the LoS assumption. Second, the spoofing model (Section 5.3) uses a single-antenna attacker at a fixed angular offset; a multi-antenna, precoding-capable adversary, as analyzed in the theoretical literature on which this work builds [9], could in principle craft a spoofed signal that is harder to distinguish from the legitimate device, and testing this stronger adversary model is a priority for future work. Third, the false-alarm threshold (Section 5.3) is a single fixed operational value rather than one calibrated per device and per allocation via the closed-form threshold formula available in the cited theory [9]; a properly calibrated, budget-aware threshold might narrow, but, given the targeting-accuracy mechanism identified in Section 6.3, would not eliminate the gap between the policies. Fourth, the shared-budget scenario assumes that all N devices require authentication within the same cycle; a more realistic deployment with staggered authentication timing across devices was not modeled. Fifth, no hardware or over-the-air implementation is reported; Study 2 is a simulation-based benchmark validated against closed-form theory rather than physical measurements, and the absolute detection and false-alarm figures should be interpreted as illustrating the comparative and mechanistic findings rather than as validated operational targets for a specific deployed system.
Beyond the next steps identified above, several broader research directions follow from this work. For network-layer detection, the most direct extension is cross-dataset validation on IoT-native datasets such as Bot-IoT, TON_IoT, and CICIoT2023 [36,37,38] and on the cellular 5G-NIDD dataset [44], to test whether the per-class failure modes identified here persist beyond UNSW-NB15. This should be combined with a duplicate-removed sensitivity analysis, a fully nested validation design in which tuning is confined strictly to training data [51], and an evaluation of resampling and cost-sensitive learning for minority attack classes [49,50]. Feature-importance conclusions should be re-examined with permutation-based [60] and Shapley-value [61] methods, which avoid the known biases of impurity-based importance [59]. For physical-layer authentication, the priorities are multipath and near-field channel models appropriate to large FR3 apertures, multi-antenna and precoding-capable adversaries [9], and allocation rules grounded in sequential and active hypothesis testing [30,31], which could replace the heuristic risk-adaptive policy with one whose reliability requirements are explicit. Finally, over-the-air validation on an FR3 testbed and joint operation of the two mechanisms, in which physical-layer authentication outcomes inform network-layer detection and vice versa, would test the defense-in-depth architecture motivated by this paper.
9. Conclusions
Study 1 Conclusion: Study 1 synthesized recent (2024–2026) survey-level literature on ML-based intrusion detection and complemented it with a cross-validated, hyperparameter-tuned empirical benchmark of four supervised classifiers on the UNSW-NB15 dataset, together with a data-quality audit, a multi-class evaluation, and a cross-method feature-importance reconciliation not typically reported in this literature. The tuned Random Forest delivered the best overall binary detection performance (96.0% accuracy, F1 = 0.971, AUC = 0.994), and cross-validation confirmed that this advantage is unlikely to be due to chance. Logistic Regression offered the best recall-per-unit-compute trade-off, and tuned K-Nearest Neighbors, despite the highest inference latency of the four methods, was competitive in accuracy after tuning. Two findings substantially qualify the headline binary results. First, 38.6% of the dataset’s records are exact duplicates once the record identifier is excluded. Second, multi-class evaluation shows that several minority attack categories are systematically misclassified as the majority Exploits category, a failure invisible to aggregate binary accuracy; the most striking case is DoS, with only 10% recall despite 2,483 test examples. A reconciliation of two feature-importance methods found only weak rank agreement (ρ = 0.28), indicating that the single-method feature-importance claims common in this literature warrant caution. Future work should prioritize IoT-native, telecom-representative traffic datasets with balanced and well-separated attack categories, systematic evaluation of model performance under representative edge-hardware compute budgets, and community adoption of shared, standardized, cross-validated evaluation protocols with multi-class and data-quality reporting as the default rather than the exception.
Study 2 Conclusion: Study 2 built an open simulation of AoA-based PLA for FR3 UM-MIMO IoT networks. The Monte Carlo AoA estimator of a 256-element array was validated against independently derived closed-form CRB theory before testing how a shared, limited authentication snapshot budget should be allocated across many registered devices to detect a spoofing attack. A classical policy that splits the budget equally across all devices substantially outperformed an adaptive policy that concentrates snapshots on devices whose brief preliminary observation appears suspicious: at a representative operating point, equal allocation achieved perfect detection with zero false alarms, compared with 29% detection and an 87% false-alarm rate for the adaptive policy. Direct measurement showed that this was not a conceptual flaw in adaptive allocation but a signal-reliability problem: the short preliminary window identified the true spoofed device only marginally above chance, and lengthening it recovered adaptive performance monotonically, confirming the mechanism. These findings extend to a security domain a pattern observed in the authors’ companion studies, namely that fair, uninformed resource allocation is a strong baseline that adaptive concentration struggles to beat without a demonstrably reliable trigger signal. They also identify a concrete, testable design requirement for future AI-driven physical-layer security systems: the reliability of any adaptive trigger signal should be validated against known ground truth before it is trusted to concentrate limited security resources.
Author Contributions
Conceptualization, M.A. and S.C.E.; methodology, M.A. and F.E.; software, M.A.; validation, L.D.A., F.E., C.O.N. and S.T.U.; formal analysis, M.A., M.U.H. and F.E.; investigation, C.O.N., Z.A. and L.D.A.; resources, S.T.U., M.E., E.I. and S.A.; data curation, M.A.; writing—original draft preparation, M.A.; writing—review and editing, L.D.A., F.E., M.U.H., C.O.N., Z.A., I.U.N., S.C.E., M.A. and S.T.U.; visualization, M.A.; supervision, S.C.E.; project administration, S.C.E. All authors have read and agreed to the published version of the manuscript.
Funding
This research received no external funding.
Institutional Review Board Statement
Not applicable. Neither study involved humans or animals: Study 1 used a publicly available, pre-anonymized network traffic dataset (UNSW-NB15), and Study 2 used only data synthetically generated from the physically validated models described in Section 5, with no field data collection.
Informed Consent Statement
Not applicable.
Data Availability Statement
For Study 1, the UNSW-NB15 dataset analyzed is publicly available via the UCI Machine Learning Repository (https://doi.org/10.24432/C5RC8J) and the UNSW Canberra Cyber Range and IoT Labs. The complete analysis pipeline (preprocessing, 10-fold cross-validation, randomized hyperparameter search, duplicate-record audit, multi-class evaluation, and figure generation) is provided as supplementary code accompanying this submission. For Study 2, the AoA estimation, CRB validation, and multi-device scheduling simulation code, together with the full benchmark results underlying every number in the Results section, are provided as supplementary material accompanying this submission; the results can be regenerated in full from the released code, which is deterministic given a random seed. The code will be deposited in a public repository (e.g., Zenodo) with a permanent DOI upon publication.
Acknowledgments
The authors have reviewed and edited the output and take full responsibility for the content of this publication. A coarse-grid AoA estimator limitation that initially produced an uninformative (exactly zero) empirical estimation variance was identified and corrected before any benchmark result was generated (Section 5.2); it is disclosed in the paper rather than left undocumented.
Conflicts of Interest
The authors declare no conflicts of interest.
References
- ITU-R. Recommendation ITU-R M.2160-0: Framework and Overall Objectives of the Future Development of IMT for 2030 and Beyond; ITU: Geneva, Switzerland, 2023; Available online: https://www.itu.int/rec/R-REC-M.2160-0-202311-I/en (accessed on 29 September 2026).
- Saad, W.; Bennis, M.; Chen, M. A vision of 6G wireless systems: Applications, trends, technologies, and open research problems. IEEE Netw. 2020, 34, 134–142. [Google Scholar] [CrossRef]
- Nguyen, D.C.; Ding, M.; Pathirana, P.N.; Seneviratne, A.; Li, J.; Niyato, D.; Dobre, O.; Poor, H.V. 6G Internet of Things: A Comprehensive Survey. IEEE Internet Things J. 2022, 9, 359–383. [Google Scholar] [CrossRef]
- Uko, M.; Ekpo, S.; Enahoro, S.; Elias, F. Performance Optimization of 5G-Satellite Integrated Networks for IoT Applications in Smart Cities: A Two-Ray Propagation Model Approach. Smart Cities 2024, 7, 3895–3913. [Google Scholar] [CrossRef]
- Porambage, P.; Gür, G.; Moya Osorio, D.P.; Liyanage, M.; Gurtov, A.; Ylianttila, M. The Roadmap to 6G Security and Privacy. IEEE Open J. Commun. Soc. 2021, 2, 1094–1122. [Google Scholar] [CrossRef]
- Kang, S.; Mezzavilla, M.; Rangan, S.; Madanayake, A.; Venkatakrishnan, S.B.; Hellbourg, G.; Ghosh, M.; Rahmani, H.; Dhananjay, A. Cellular wireless networks in the upper mid-band. IEEE Open J. Commun. Soc. 2024, 5, 2058–2075. [Google Scholar] [CrossRef]
- Mitev, M.; Pham, T.M.; Chorti, A.; Barreto, A.N.; Fettweis, G. Physical Layer Security—From Theory to Practice. IEEE BITS Inf. Theory Mag. 2023, 3, 67–79. [Google Scholar] [CrossRef]
- Pham, T.M.; Senigagliesi, L.; Baldi, M.; Schaefer, R.F.; Fettweis, G.P.; Chorti, A. Leveraging Angle of Arrival Estimation against Impersonation Attacks in Physical Layer Authentication. IEEE Trans. Inf. Forensics Secur. 2026, 21, 3226–3239. [Google Scholar] [CrossRef]
- Skaperas, S.; Chorti, A. On the Robustness of AoA as an Authentication Feature Under Spoofing: Fundamental Limits from Misspecified Cramér–Rao Theory. arXiv 2026, arXiv:2603.21219. [Google Scholar]
- Stoica, P.; Nehorai, A. MUSIC, maximum likelihood, and Cramér–Rao bound. IEEE Trans. Acoust. Speech Signal Process. 1989, 37, 720–741. [Google Scholar] [CrossRef]
- Van Trees, H.L. Optimum Array Processing: Part IV of Detection, Estimation, and Modulation Theory; Wiley-Interscience: New York, NY, USA, 2002. [Google Scholar] [CrossRef]
- Marzetta, T.L. Noncooperative cellular wireless with unlimited numbers of base station antennas. IEEE Trans. Wirel. Commun. 2010, 9, 3590–3600. [Google Scholar] [CrossRef]
- Rusek, F.; Persson, D.; Lau, B.K.; Larsson, E.G.; Marzetta, T.L.; Edfors, O.; Tufvesson, F. Scaling up MIMO: Opportunities and challenges with very large arrays. IEEE Signal Process. Mag. 2013, 30, 40–60. [Google Scholar] [CrossRef]
- Mukherjee, A.; Fakoorian, S.A.A.; Huang, J.; Swindlehurst, A.L. Principles of physical layer security in multiuser wireless networks: A survey. IEEE Commun. Surv. Tutor. 2014, 16, 1550–1573. [Google Scholar] [CrossRef]
- Xie, N.; Li, Z.; Tan, H. A survey of physical-layer authentication in wireless communications. IEEE Commun. Surv. Tutor. 2021, 23, 282–310. [Google Scholar] [CrossRef]
- Zhou, X.; Maham, B.; Hjørungnes, A. Pilot contamination for active eavesdropping. IEEE Trans. Wirel. Commun. 2012, 11, 903–907. [Google Scholar] [CrossRef]
- Kapetanovic, D.; Zheng, G.; Rusek, F. Physical layer security for massive MIMO: An overview on passive eavesdropping and active attacks. IEEE Commun. Mag. 2015, 53, 21–27. [Google Scholar] [CrossRef]
- Krim, H.; Viberg, M. Two decades of array signal processing research: The parametric approach. IEEE Signal Process. Mag. 1996, 13, 67–94. [Google Scholar] [CrossRef]
- Xiong, J.; Jamieson, K. SecureAngle: Improving Wireless Security Using Angle-of-Arrival Information. In Proceedings of the 9th ACM SIGCOMM Workshop on Hot Topics in Networks (HotNets-IX), Monterey, CA, USA, 20–21 October 2010. [Google Scholar] [CrossRef]
- Srinivasan, M.; Senigagliesi, L.; Chen, H.; Chorti, A.; Baldi, M.; Wymeersch, H. AoA-Based Physical Layer Authentication in Analog Arrays under Impersonation Attacks. In Proceedings of the 2024 IEEE 25th International Workshop on Signal Processing Advances in Wireless Communications (SPAWC), Lucca, Italy, 10–13 September 2024; pp. 496–500. [Google Scholar] [CrossRef]
- Zhang, P.; Liu, J.; Shen, Y.; Jiang, X. Exploiting Channel Gain and Phase Noise for PHY-Layer Authentication in Massive MIMO Systems. IEEE Trans. Inf. Forensics Secur. 2021, 16, 4265–4279. [Google Scholar] [CrossRef]
- Pham, T.M.; Senigagliesi, L.; Baldi, M.; Fettweis, G.P.; Chorti, A. Machine Learning-Based Robust Physical Layer Authentication Using Angle of Arrival Estimation. In Proceedings of the 2023 IEEE Global Communications Conference (GLOBECOM), Kuala Lumpur, Malaysia, 4–8 December 2023; pp. 13–18. [Google Scholar] [CrossRef]
- Wang, N.; Jiao, L.; Wang, P.; Dabaghchian, M.; Zeng, K. Efficient Identity Spoofing Attack Detection for IoT in mm-Wave and Massive MIMO 5G Communication. In Proceedings of the 2018 IEEE Global Communications Conference (GLOBECOM), Abu Dhabi, United Arab Emirates, 9–13 December 2018; pp. 1–6. [Google Scholar] [CrossRef]
- Lu, C.; Tao, L.; Xu, W. Physical Layer Authentication for the Downlink of Massive MIMO Systems. AEU Int. J. Electron. Commun. 2025, 190, 155646. [Google Scholar] [CrossRef]
- Xu, W.; Yuan, C.; Xu, S.; Ngo, H.Q.; Xiang, W. On Pilot Spoofing Attack in Massive MIMO Systems: Detection and Countermeasure. IEEE Trans. Inf. Forensics Secur. 2021, 16, 1396–1409. [Google Scholar] [CrossRef]
- Xu, S.; Xu, W.; Gan, H.; Li, B. Detection of Pilot Spoofing Attack in Massive MIMO Systems Based on Channel Estimation. Signal Process. 2020, 169, 107411. [Google Scholar] [CrossRef]
- Wang, S.; Fu, X.; Ruby, R.; Li, Z. Pilot Spoofing Detection for Massive MIMO mmWave Communication Systems with a Cooperative Relay. Comput. Commun. 2023, 202, 33–41. [Google Scholar] [CrossRef]
- Liu, Y.; Zhang, P.; Shen, Y.; Peng, L.; Jiang, X. Online Machine Learning-Based Physical Layer Authentication for MmWave MIMO Systems. Ad. Hoc Netw. 2022, 131, 102864. [Google Scholar] [CrossRef]
- Alhoraibi, L.; Alghazzawi, D.; Alhebshi, R.; Rabie, O.B.J. Physical Layer Authentication in Wireless Networks-Based Machine Learning Approaches. Sensors 2023, 23, 1814. [Google Scholar] [CrossRef]
- Wald, A. Sequential tests of statistical hypotheses. Ann. Math. Stat. 1945, 16, 117–186. [Google Scholar] [CrossRef]
- Naghshvar, M.; Javidi, T. Active sequential hypothesis testing. Ann. Stat. 2013, 41, 2703–2738. [Google Scholar] [CrossRef]
- Ogunseyi, T.B.; Thiyagarajan, G.; He, H.; Bist, V.; Du, Z. Performance Analysis of Explainable Deep Learning-Based Intrusion Detection Systems for IoT Networks: A Systematic Review. Sensors 2026, 26, 363. [Google Scholar] [CrossRef]
- Rahman, M.M.; Shakil, S.A.; Mustakim, M.R. A Survey on Intrusion Detection System in IoT Networks. Cyber Secur. Appl. 2025, 3, 100082. [Google Scholar] [CrossRef]
- Zoghi, Z.; Serpen, G. Building an Intrusion Detection System on UNSW-NB15: Reducing the Margin of Error to Deal with Data Overlap and Imbalance. Concurr. Comput. Pract. Exp. 2024, 36, e8242. [Google Scholar] [CrossRef]
- Zoghi, Z.; Serpen, G. UNSW-NB15 Computer Security Dataset: Analysis through Visualization. Secur. Priv. 2024, 7, e331. [Google Scholar] [CrossRef]
- Koroniotis, N.; Moustafa, N.; Sitnikova, E.; Turnbull, B. Towards the development of realistic botnet dataset in the Internet of Things for network forensic analytics: Bot-IoT dataset. Future Gener. Comput. Syst. 2019, 100, 779–796. [Google Scholar] [CrossRef]
- Alsaedi, A.; Moustafa, N.; Tari, Z.; Mahmood, A.; Anwar, A. TON_IoT Telemetry Dataset: A New Generation Dataset of IoT and IIoT for Data-Driven Intrusion Detection Systems. IEEE Access 2020, 8, 165130–165150. [Google Scholar] [CrossRef]
- Neto, E.C.P.; Dadkhah, S.; Ferreira, R.; Zohourian, A.; Lu, R.; Ghorbani, A.A. CICIoT2023: A Real-Time Dataset and Benchmark for Large-Scale Attacks in IoT Environment. Sensors 2023, 23, 5941. [Google Scholar] [CrossRef]
- Tavallaee, M.; Bagheri, E.; Lu, W.; Ghorbani, A.A. A detailed analysis of the KDD CUP 99 data set. In Proceedings of the 2009 IEEE Symposium on Computational Intelligence for Security and Defense Applications (CISDA), Ottawa, ON, Canada, 8–10 July 2009; pp. 1–6. [Google Scholar] [CrossRef]
- Moustafa, N.; Slay, J. The evaluation of Network Anomaly Detection Systems: Statistical analysis of the UNSW-NB15 data set and the comparison with the KDD99 data set. Inf. Secur. J. Glob. Perspect. 2016, 25, 18–31. [Google Scholar] [CrossRef]
- Sharafaldin, I.; Lashkari, A.H.; Ghorbani, A.A. Toward Generating a New Intrusion Detection Dataset and Intrusion Traffic Characterization. In Proceedings of the 4th International Conference on Information Systems Security and Privacy (ICISSP 2018), Funchal, Portugal, 22–24 January 2018; pp. 108–116. [Google Scholar] [CrossRef]
- Vinayakumar, R.; Alazab, M.; Soman, K.P.; Poornachandran, P.; Al-Nemrat, A.; Venkatraman, S. Deep Learning Approach for Intelligent Intrusion Detection System. IEEE Access 2019, 7, 41525–41550. [Google Scholar] [CrossRef]
- Fotiadou, K.; Velivassaki, T.-H.; Voulkidis, A.; Skias, D.; Tsekeridou, S.; Zahariadis, T. Network Traffic Anomaly Detection via Deep Learning. Information 2021, 12, 215. [Google Scholar] [CrossRef]
- Siriwardhana, Y.; Samarakoon, S.; Porambage, P.; Liyanage, M.; Chang, S.-Y.; Kim, J.; Kim, J.; Ylianttila, M. Descriptor: 5G Wireless Network Intrusion Detection Dataset (5G-NIDD). IEEE Data Descr. 2025, 2, 11098458. [Google Scholar] [CrossRef]
- Lassoued, N.; Filali, I.; Ejbali, R. Supervised Machine Learning-Based Intrusion Detection for 5G Networks: Evaluation on the 5G-NIDD Dataset. Computers 2026, 15, 362. [Google Scholar] [CrossRef]
- Moustafa, N.; Slay, J. UNSW-NB15: A Comprehensive Data Set for Network Intrusion Detection Systems (UNSW-NB15 Network Data Set). In Proceedings of the 2015 Military Communications and Information Systems Conference (MilCIS), Canberra, Australia, 10–12 November 2015; pp. 1–6. [Google Scholar] [CrossRef]
- Pedregosa, F.; Varoquaux, G.; Gramfort, A.; Michel, V.; Thirion, B.; Grisel, O.; Blondel, M.; Prettenhofer, P.; Weiss, R.; Dubourg, V.; Vanderplas, J.; Passos, A.; Cournapeau, D.; Brucher, M.; Perrot, M.; Duchesnay, É. Scikit-learn: Machine Learning in Python. J. Mach. Learn. Res. 2011, 12, 2825–2830. Available online: https://jmlr.org/papers/v12/pedregosa11a.html (accessed on 29 September 2026).
- Bergstra, J.; Bengio, Y. Random Search for Hyper-Parameter Optimization. J. Mach. Learn. Res. 2012, 13, 281–305. Available online: https://jmlr.org/papers/v13/bergstra12a.html (accessed on 29 September 2026).
- He, H.; Garcia, E.A. Learning from Imbalanced Data. IEEE Trans. Knowl. Data Eng. 2009, 21, 1263–1284. [Google Scholar] [CrossRef]
- Chawla, N.V.; Bowyer, K.W.; Hall, L.O.; Kegelmeyer, W.P. SMOTE: Synthetic Minority Over-sampling Technique. J. Artif. Intell. Res. 2002, 16, 321–357. [Google Scholar] [CrossRef]
- Varma, S.; Simon, R. Bias in error estimation when using cross-validation for model selection. BMC Bioinform. 2006, 7, 91. [Google Scholar] [CrossRef]
- Breiman, L. Random Forests. Mach. Learn. 2001, 45, 5–32. [Google Scholar] [CrossRef]
- Mallidi, S.K.R.; Ramisetty, R.R. Optimizing Intrusion Detection for IoT: A Systematic Review of Machine Learning and Deep Learning Approaches with Feature Selection and Data Balancing. WIREs Data Min. Knowl. Discov. 2025, 15, e70008. [Google Scholar] [CrossRef]
- Bankó, M.B.; Dyszewski, S.; Králová, M.; Limpek, M.B.; Papaioannou, M.; Choudhary, G.; Dragoni, N. Advancements in Machine Learning-Based Intrusion Detection in IoT: Research Trends and Challenges. Algorithms 2025, 18, 209. [Google Scholar] [CrossRef]
- Hozouri, A.; Mirzaei, A.; Effatparvar, M. A Comprehensive Survey on Intrusion Detection Systems with Advances in Machine Learning, Deep Learning and Emerging Cybersecurity Challenges. Discov. Artif. Intell. 2025, 5, 314. [Google Scholar] [CrossRef]
- Al-Haija, Q.A.; Droos, A. A Comprehensive Survey on Deep Learning-Based Intrusion Detection Systems in Internet of Things (IoT). Expert Syst. 2025, 42, e13726. [Google Scholar] [CrossRef]
- Alfahaid, A.; Alalwany, E.; Almars, A.M.; Alharbi, F.; Atlam, E.; Mahgoub, I. Machine Learning-Based Security Solutions for IoT Networks: A Comprehensive Survey. Sensors 2025, 25, 3341. [Google Scholar] [CrossRef]
- Faker, O.; Dogdu, E. Intrusion Detection Using Big Data and Deep Learning Techniques. In Proceedings of the 2019 ACM Southeast Conference (ACMSE 2019), Kennesaw, GA, USA, 18–20 April 2019; pp. 86–93. [Google Scholar] [CrossRef]
- Strobl, C.; Boulesteix, A.-L.; Zeileis, A.; Hothorn, T. Bias in random forest variable importance measures: Illustrations, sources and a solution. BMC Bioinform. 2007, 8, 25. [Google Scholar] [CrossRef]
- Altmann, A.; Toloşi, L.; Sander, O.; Lengauer, T. Permutation importance: A corrected feature importance measure. Bioinformatics 2010, 26, 1340–1347. [Google Scholar] [CrossRef]
- Lundberg, S.M.; Lee, S.-I. A Unified Approach to Interpreting Model Predictions. In Proceedings of the 31st Conference on Neural Information Processing Systems (NIPS 2017), Long Beach, CA, USA, 4–9 December 2017; pp. 4765–4774. Available online: https://proceedings.neurips.cc/paper_files/paper/2017/file/8a20a8621978632d76c43dfd28b67767-Paper.pdf (accessed on 29 September 2026).
- Kay, S.M. Fundamentals of Statistical Signal Processing: Estimation Theory; Prentice Hall: Englewood Cliffs, NJ, USA, 1993. [Google Scholar]
- Björnson, E.; Hoydis, J.; Sanguinetti, L. Massive MIMO networks: Spectral, energy, and hardware efficiency. Found. Trends Signal Process. 2017, 11, 154–655. [Google Scholar] [CrossRef]
- Enahoro, S.; Ekpo, S.C.; Ji, H.; Chow, K.K.; Karimian, N.; Uko, M.; Elias, F.; Unnikrishnan, R.; Olasunkanmi, N.K.; Alabi, S. Multi-Beam Beamforming in 5G Massive MIMO Networks: Normalization Techniques and Algorithmic Performance Evaluation. IEEE Access 2025, 13, 191707–191726. [Google Scholar] [CrossRef]
Figure 1.
Distribution of UNSW-NB15 traffic records by category, showing severe class imbalance across the nine attack types and benign traffic.
Figure 1.
Distribution of UNSW-NB15 traffic records by category, showing severe class imbalance across the nine attack types and benign traffic.
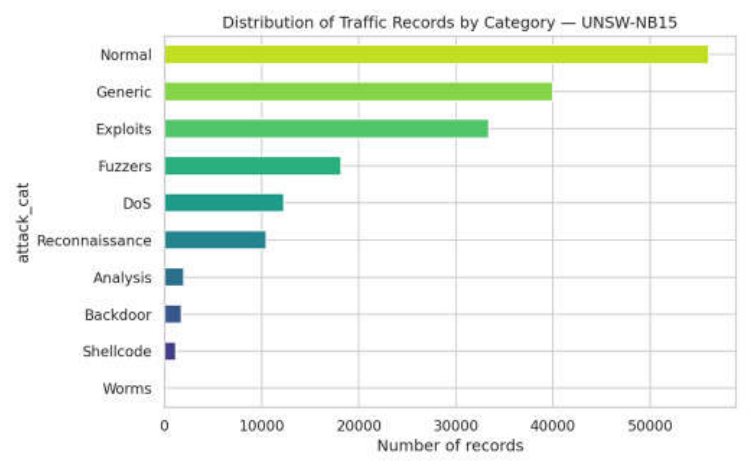
Figure 2.
Binary composition of the dataset: benign versus attack traffic.
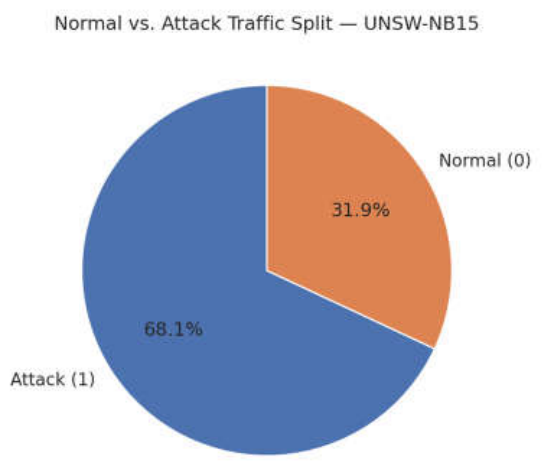
Figure 3.
Top twelve numeric features ranked by absolute Pearson correlation with the binary attack label.
Figure 3.
Top twelve numeric features ranked by absolute Pearson correlation with the binary attack label.
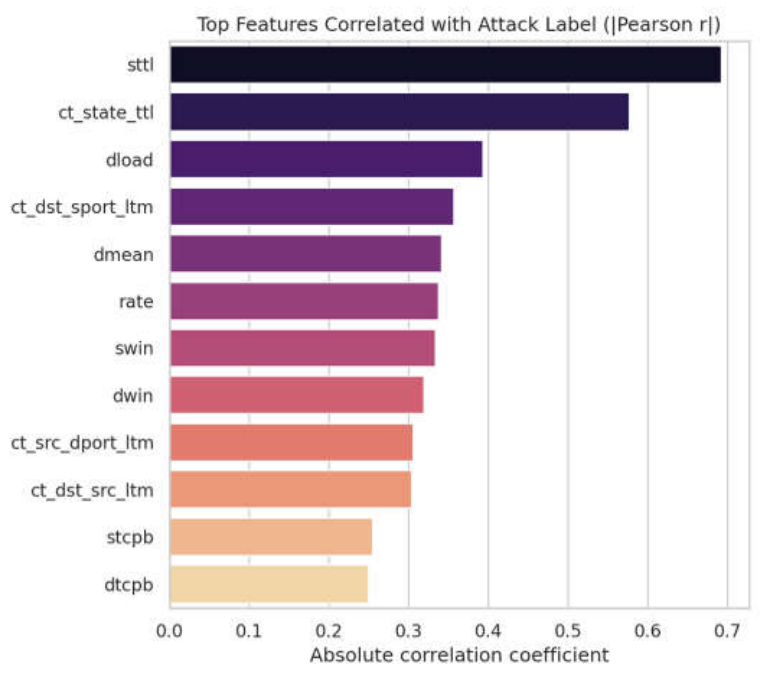
Figure 4.
10-fold stratified cross-validation performance (mean ± standard deviation error bars) of the four models with default hyperparameters.
Figure 4.
10-fold stratified cross-validation performance (mean ± standard deviation error bars) of the four models with default hyperparameters.
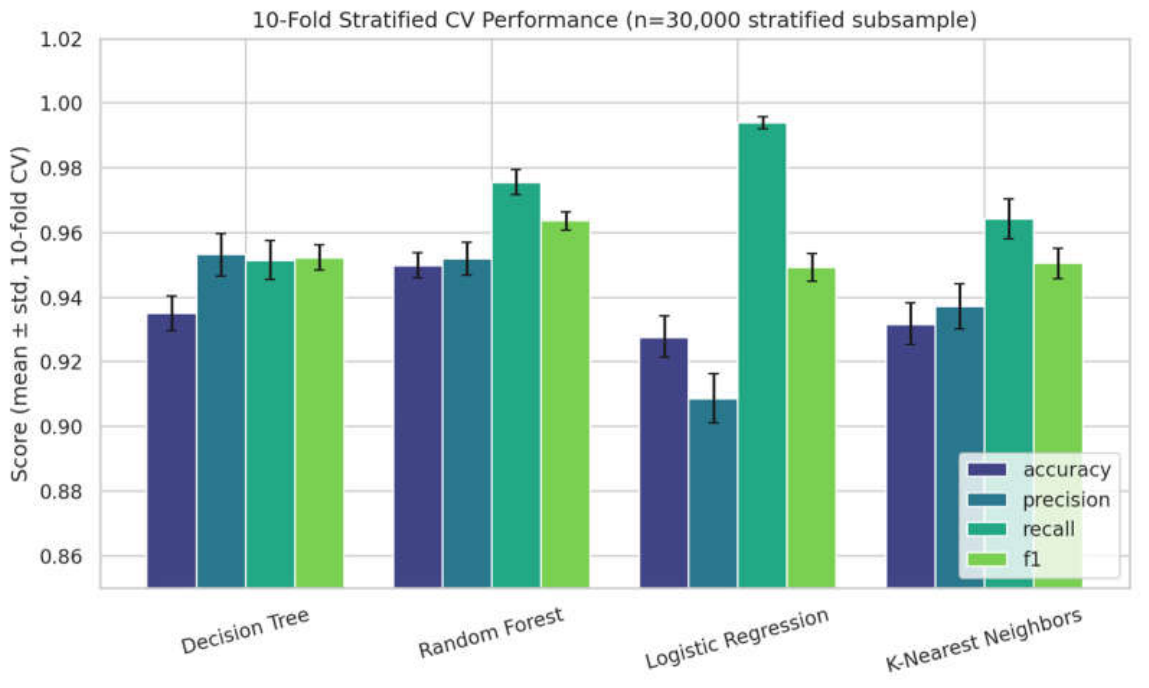
Figure 5.
Confusion matrix for the tuned Random Forest classifier on the binary test partition.
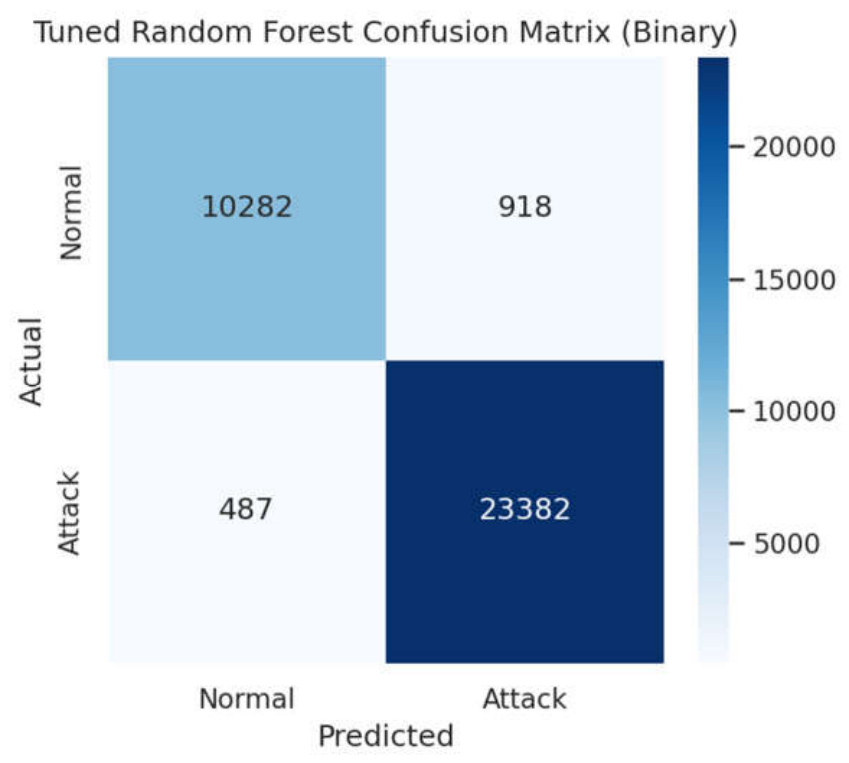
Figure 6.
Gini-based feature importances of the tuned Random Forest (top twelve features).
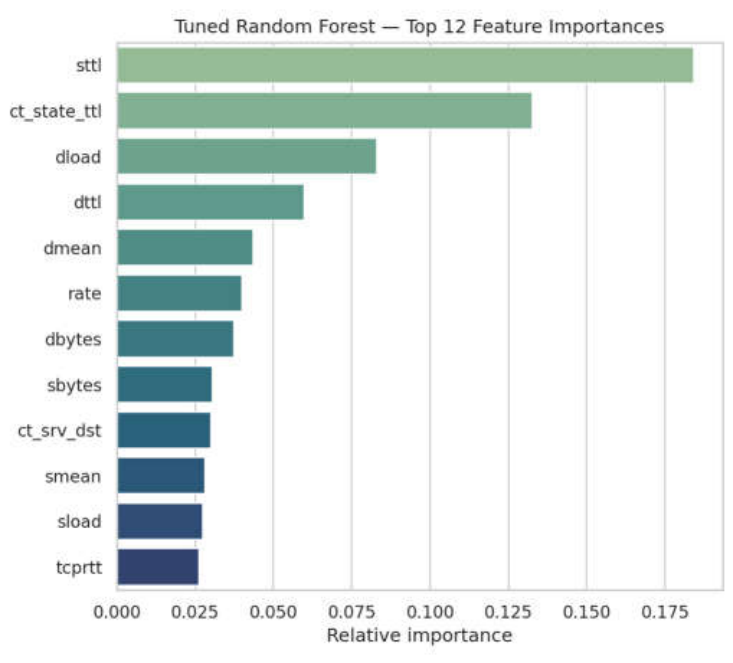
Figure 7.
Reconciliation of feature-importance rankings: Random Forest Gini importance plotted against absolute Pearson correlation for all 38 numeric features (Spearman ρ = 0.28).
Figure 7.
Reconciliation of feature-importance rankings: Random Forest Gini importance plotted against absolute Pearson correlation for all 38 numeric features (Spearman ρ = 0.28).
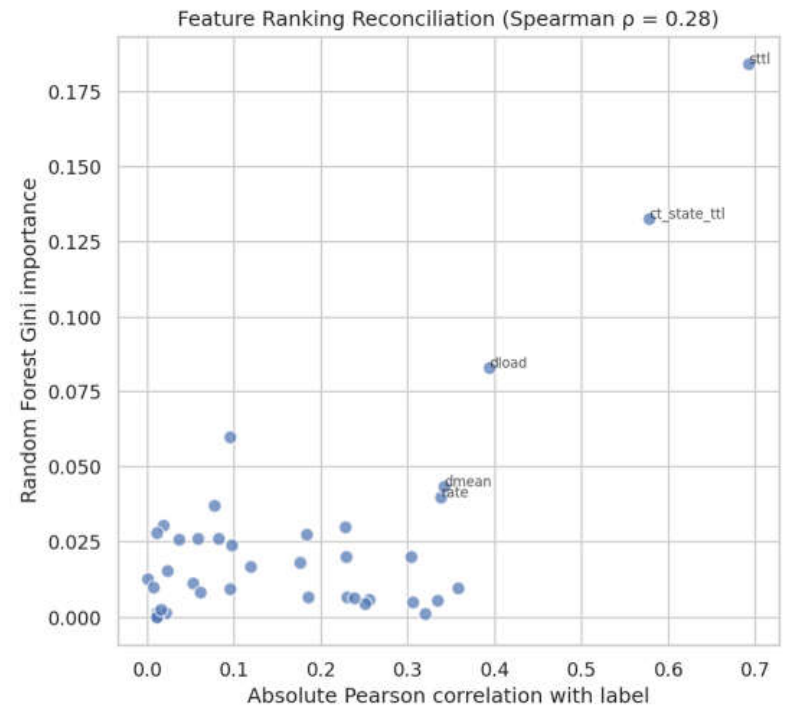
Figure 8.
Training and inference wall-clock time per tuned model (log scale), used as a proxy for deployability on constrained telecom/IoT edge hardware.
Figure 8.
Training and inference wall-clock time per tuned model (log scale), used as a proxy for deployability on constrained telecom/IoT edge hardware.
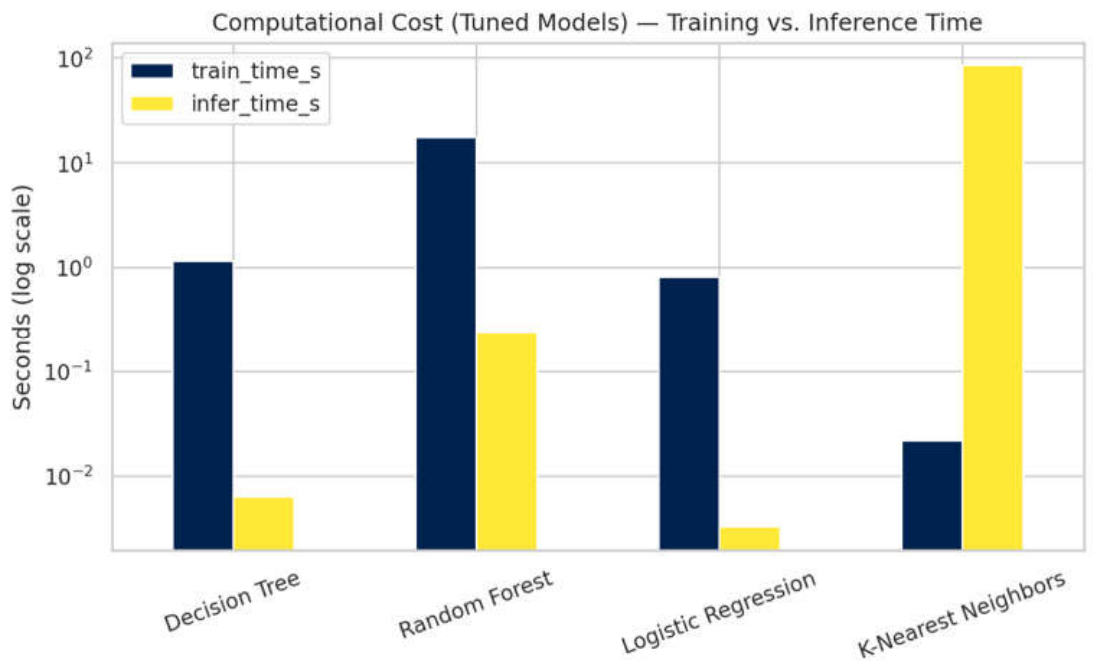
Figure 9.
Per-class F1-score versus class support for the tuned multi-class Random Forest. Support size alone does not fully predict F1-score: DoS (n = 2,483) performs worse than Backdoor and Analysis, which have far fewer training examples.
Figure 9.
Per-class F1-score versus class support for the tuned multi-class Random Forest. Support size alone does not fully predict F1-score: DoS (n = 2,483) performs worse than Backdoor and Analysis, which have far fewer training examples.
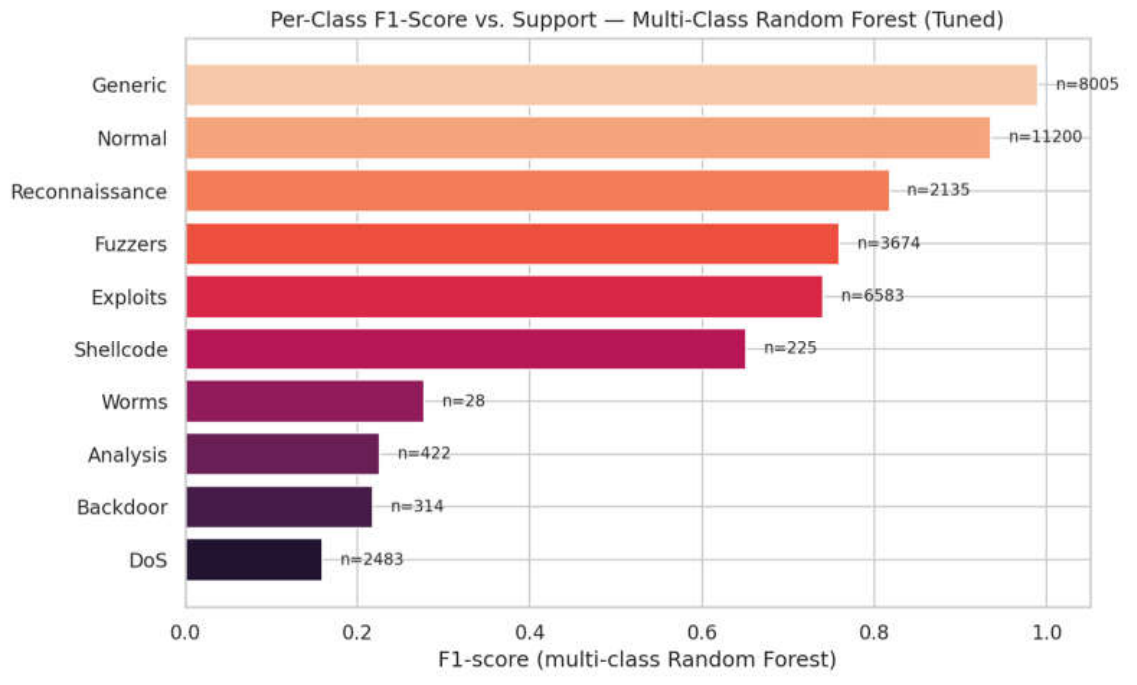
Figure 10.
Multi-class confusion matrix (row-normalized), tuned Random Forest. Values show the proportion of each true class (rows) predicted as each class (columns); several minority classes are predominantly misclassified as Exploits.
Figure 10.
Multi-class confusion matrix (row-normalized), tuned Random Forest. Values show the proportion of each true class (rows) predicted as each class (columns); several minority classes are predominantly misclassified as Exploits.
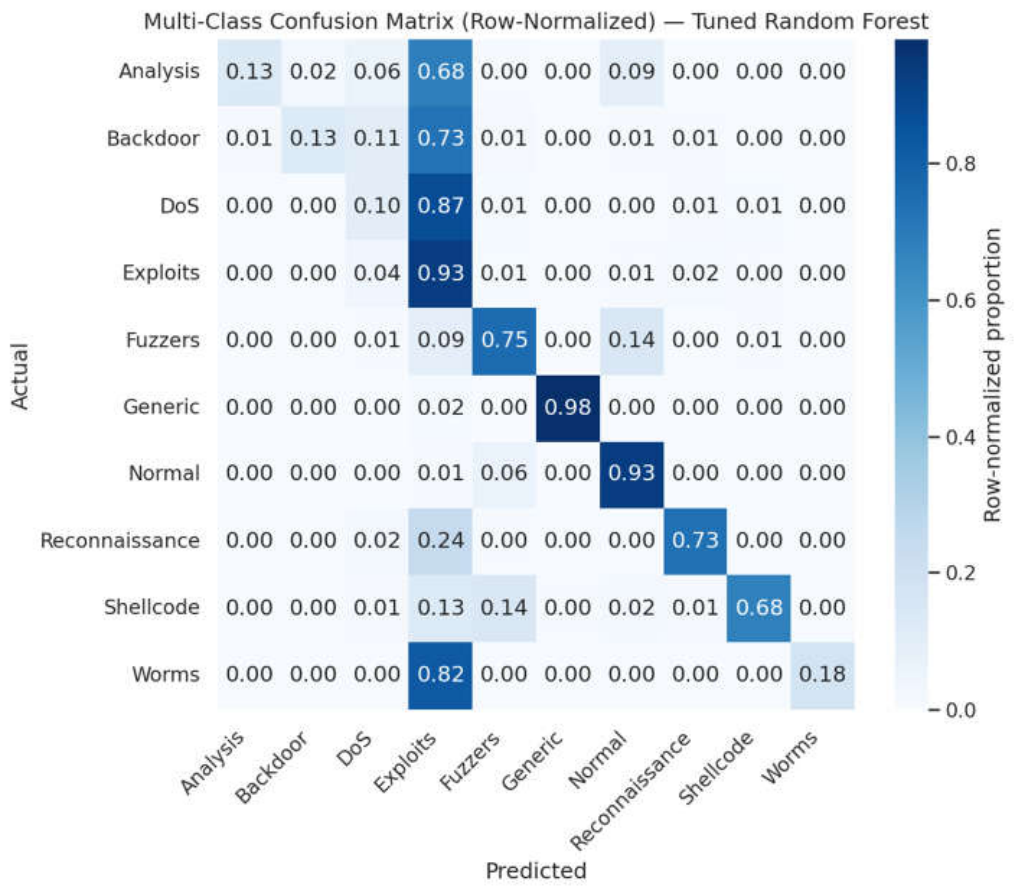
Figure 11.
Monte Carlo AoA estimation standard deviation versus SNR, validated against the closed-form CRB; M = 256, K = 10 snapshots, 200 trials per point.
Figure 11.
Monte Carlo AoA estimation standard deviation versus SNR, validated against the closed-form CRB; M = 256, K = 10 snapshots, 200 trials per point.
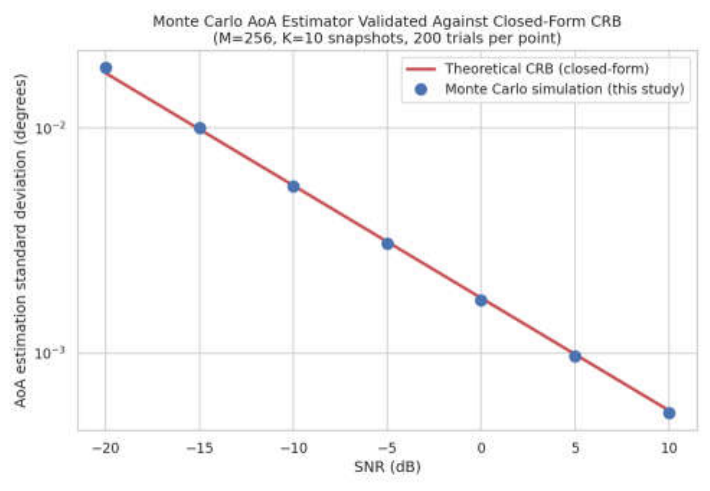
Figure 12.
Spoofing detection rate and false-alarm rate versus total shared snapshot budget for equal and risk-adaptive allocation; 150 trials per budget, N = 10 devices, SNR = −20 dB, spoof offset = 0.1°.
Figure 12.
Spoofing detection rate and false-alarm rate versus total shared snapshot budget for equal and risk-adaptive allocation; 150 trials per budget, N = 10 devices, SNR = −20 dB, spoof offset = 0.1°.
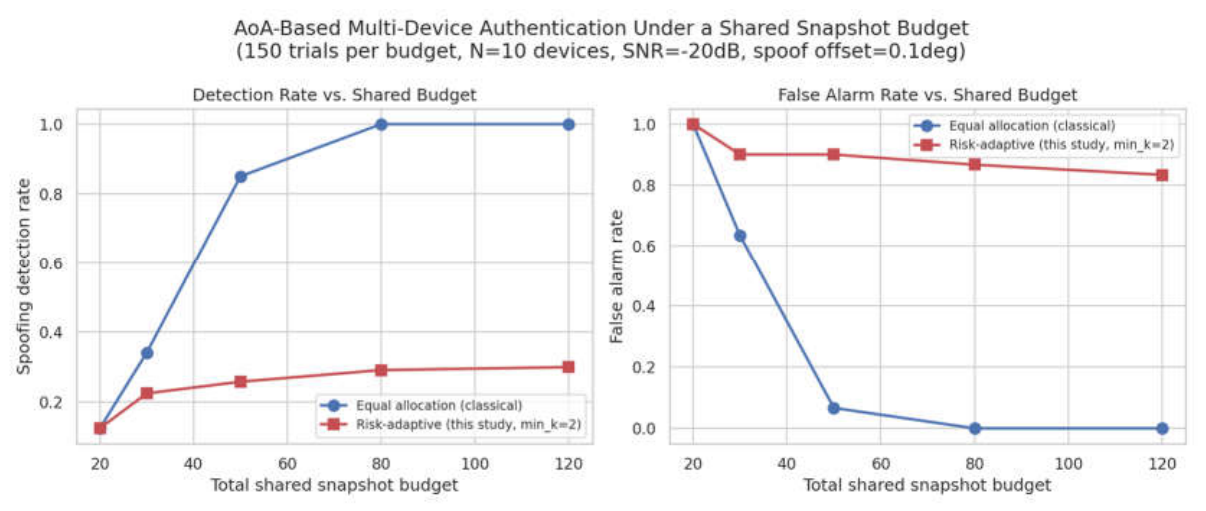
Figure 13.
Adaptive-policy detection rate and true-spoofer targeting accuracy versus preliminary-round size, confirming the diagnosed mechanism; N = 10 devices, total budget = 80, SNR = −20 dB.
Figure 13.
Adaptive-policy detection rate and true-spoofer targeting accuracy versus preliminary-round size, confirming the diagnosed mechanism; N = 10 devices, total budget = 80, SNR = −20 dB.
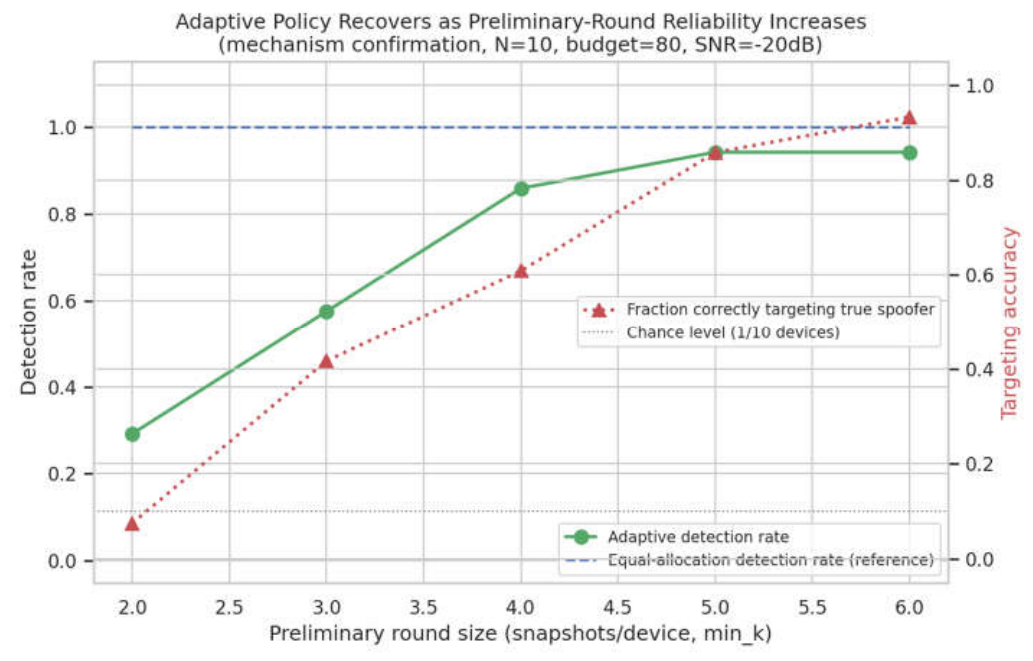

Table 1.
Comparison of the tuned Random Forest results of this study with representative prior studies reporting binary and/or multi-class accuracy on the UNSW-NB15 dataset. Figures are as reported in the cited sources and were obtained under differing preprocessing, feature-selection, and evaluation protocols (see Section 7); direct ranking across rows should therefore be treated with caution.
Table 1.
Comparison of the tuned Random Forest results of this study with representative prior studies reporting binary and/or multi-class accuracy on the UNSW-NB15 dataset. Figures are as reported in the cited sources and were obtained under differing preprocessing, feature-selection, and evaluation protocols (see Section 7); direct ranking across rows should therefore be treated with caution.
| Study | Method | Task | Reported Accuracy | Year |
|---|---|---|---|---|
| This study | Random Forest (tuned) | Binary | 96.0% | 2026 |
| This study | Random Forest (tuned) | Multi-class | 83.0% (macro F1 = 0.58) | 2026 |
| Zoghi et al. [34] | BB + XGBoost + RF ensemble | Binary | 97.80% | 2024 |
| Zoghi et al. [34] | BB + XGBoost + RF ensemble | Multi-class | up to 99.73% (best classes) | 2024 |
| Faker & Dogdu [58] | Random Forest | Binary | 98.85% | 2019 |
| Bankó et al. [54] | Decision Tree / Random Forest (BoT-IoT, TON_IoT datasets) | Binary | median >99% | 2025 |
Table 2.
10-fold stratified cross-validation results (mean ± standard deviation across folds) with default hyperparameters; n = 30,000 stratified subsample.
Table 2.
10-fold stratified cross-validation results (mean ± standard deviation across folds) with default hyperparameters; n = 30,000 stratified subsample.
| Model | Accuracy | Precision | Recall | F1-Score | AUC |
|---|---|---|---|---|---|
| Decision Tree | 0.9353 ± 0.0053 | 0.9533 ± 0.0065 | 0.9517 ± 0.0061 | 0.9525 ± 0.0039 | 0.9266 ± 0.0069 |
| Random Forest | 0.9500 ± 0.0038 | 0.9521 ± 0.0050 | 0.9757 ± 0.0039 | 0.9637 ± 0.0027 | 0.9909 ± 0.0016 |
| Logistic Regression | 0.9279 ± 0.0065 | 0.9087 ± 0.0076 | 0.9940 ± 0.0019 | 0.9494 ± 0.0044 | 0.9589 ± 0.0044 |
| K-Nearest Neighbors | 0.9319 ± 0.0066 | 0.9374 ± 0.0070 | 0.9644 ± 0.0062 | 0.9507 ± 0.0047 | 0.9692 ± 0.0049 |
Table 3.
Tuned hyperparameters selected by randomized search (F1-score, 3-fold internal cross-validation).
Table 3.
Tuned hyperparameters selected by randomized search (F1-score, 3-fold internal cross-validation).
| Model | Tuned Hyperparameters | CV F1-Score |
|---|---|---|
| Decision Tree | max_depth=10, min_samples_split=2, min_samples_leaf=2 | 0.9541 |
| Random Forest | n_estimators=100, max_depth=20, min_samples_split=2, min_samples_leaf=1 | 0.9639 |
| Logistic Regression | C=1, penalty=L2, solver=lbfgs | 0.9494 |
| K-Nearest Neighbors | n_neighbors=15, weights=distance, p=1 (Manhattan) | 0.9558 |
Table 4.
Binary classification performance of four tuned ML models on the UNSW-NB15 test partition (20% hold-out, stratified, full dataset).
Table 4.
Binary classification performance of four tuned ML models on the UNSW-NB15 test partition (20% hold-out, stratified, full dataset).
| Model | Accuracy | Precision | Recall | F1-Score | AUC |
|---|---|---|---|---|---|
| Decision Tree | 0.9413 | 0.9636 | 0.9496 | 0.9566 | 0.9884 |
| Random Forest | 0.9599 | 0.9622 | 0.9796 | 0.9708 | 0.9939 |
| Logistic Regression | 0.9272 | 0.9118 | 0.9887 | 0.9487 | 0.9619 |
| K-Nearest Neighbors | 0.9481 | 0.9520 | 0.9728 | 0.9623 | 0.9863 |
Table 5.
Per-class precision, recall, F1-score, and support for the tuned multi-class Random Forest classifier (test partition, n = 35,069).
Table 5.
Per-class precision, recall, F1-score, and support for the tuned multi-class Random Forest classifier (test partition, n = 35,069).
| Class | Precision | Recall | F1-Score | Support |
|---|---|---|---|---|
| Analysis | 0.75 | 0.13 | 0.23 | 422 |
| Backdoor | 0.75 | 0.13 | 0.22 | 314 |
| DoS | 0.39 | 0.10 | 0.16 | 2483 |
| Exploits | 0.62 | 0.93 | 0.74 | 6583 |
| Fuzzers | 0.76 | 0.75 | 0.76 | 3674 |
| Generic | 1.00 | 0.98 | 0.99 | 8005 |
| Normal | 0.94 | 0.93 | 0.94 | 11200 |
| Reconnaissance | 0.92 | 0.73 | 0.82 | 2135 |
| Shellcode | 0.63 | 0.68 | 0.65 | 225 |
| Worms | 0.62 | 0.18 | 0.28 | 28 |
| Macro average | 0.74 | 0.55 | 0.58 | 35069 |
| Weighted average | 0.83 | 0.83 | 0.81 | 35069 |
Disclaimer/Publisher’s Note: The statements, opinions and data contained in all publications are solely those of the individual author(s) and contributor(s) and not of MDPI and/or the editor(s). MDPI and/or the editor(s) disclaim responsibility for any injury to people or property resulting from any ideas, methods, instructions or products referred to in the content. |
© 2026 by the authors. Licensee MDPI, Basel, Switzerland. This article is an open access article distributed under the terms and conditions of the Creative Commons Attribution (CC BY) license.
Copyright: This open access article is published under a Creative Commons CC BY 4.0 license, which permit the free download, distribution, and reuse, provided that the author and preprint are cited in any reuse.