

Submitted:
17 October 2026
Posted:
19 October 2026
You are already at the latest version
Abstract
Recent cell and animal studies have suggested that procyanidin C1 (PCC1) has potential for targeting senescent cells, but its effects in humans remain unclear. This retrospective study analyzed existing records from 32 participants aged 46–78 years during four rounds of oral supplementation with a PCC1-containing supplement. We assembled results for more than 100 circulating proteins in plasma before supplementation,after the first round and after all four rounds. We used multiple protein-based approaches to jointly assess age-associated and immune-health-associated features. Six primary directional scores were constructed from published evidence: a 12-protein combination with concordant age associations across studies, a 19-protein combination based on age associations in healthy populations, the OrganAge local score (97 proteins), the ipfP3GPT local score (77 proteins), the 58-protein core immune age-direction score, and the 19-protein Immune Health Metric (IHM)-associated protein-direction score. The data showed that multiple chemokines and soluble receptors were below baseline in most participants after four rounds of LB-150 supplementation.A small number of protein factors nevertheless remained above baseline. For individual markers within this subset, subsequent follow-up showed group-level values close to baseline, while changes at later time points remain to be observed. Across the six primary protein scores, both median scores and most participants'scores indicated shifts toward protein paterns associated with younger age or beter immune health in the higher and lower cumulative-intake groups. Relative to baseline, the group medians of the 58-protein core immune age-direction score and the 19-protein IHM-associated protein-direction score indicated older-age-associated and poorer-immune-health-associated features, respectively, after the first round. After all four rounds, the corresponding medians indicated features associated with younger age and beter immune health. This patern of group medians was observed under both cumulative-intake regimens and in the age subgroups within the higher cumulative-intake group. By examining protein-age associations and immune-health-associated features, this study identified human protein changes after oral intake of a PCC1-containing supplement. The findings suggest immunomodulatory potential for PCC1 and provide human observations that connect with existing senescent-cell research and inform further investigation of immune health and modulation of the circulating immune microenvironment.
Keywords:
procyanidin C1
; immunosenescence
; circulating microenvironment
; protein age-direction scores
; geriatric medicine
; retrospective longitudinal study
Introduction
Immunosenescence encompasses changes in immune-cell composition, chronic inflammation and tissue homeostasis, as well as a reduced ability to resist infection. Animal studies have shown that aged immune cells can promote aging in other organs. Depletion of myeloid-biased hematopoietic stem cells can increase the proportions of naive T cells and mature B cells and reduce some circulating inflammatory proteins [1,2]. Circulating chemokines, cytokines and soluble receptors connect immune cells with other tissues. Human studies have also linked these protein features to age, immune state, frailty and health risks [3,4]. Interventions targeting immunosenescence therefore warrant atention to both immune-cell function and the circulating signaling environment, providing a rationale for investigating oral interventions suitable for continued use.
Basic research on PCC1 provides a basis for examining its effects on immune cells and their signaling environment. PCC1, a procyanidin trimer, has been investigated for its effects on senescent-cell-related processes and inflammatory secretion, with subsequent work extending to the hematopoietic immune system and tumor immune microenvironment [5,6,7]. Recent cell and animal studies have also examined its effects on retinal aging, pulmonary and renal fibrosis, skin matrix changes and vascular inflammation [8,9,10,11,12]. Experiments in human lens cells directly assessed changes in inflammatory protein secretion [13]. Together, these studies across different tissues broaden the translational questions surrounding PCC1 beyond cell clearance alone to the tissue signaling environment shaped by immune, endothelial and stromal cells.
The effects of PCC1 on immune state may depend on the cellular context. Cell studies have reported effects on macrophage responses under inflammatory stimulation and on immune activation under other conditions [14,15]. Its biological activity should therefore not be reduced to generalized suppression or generalized enhancement. Microbiota-transfer and metabolite experiments in models of intestinal inflammation further suggest that some effects may involve interactions between the microbiota and the host barrier [16]. Repeated sampling is particularly relevant to this context dependence. Early responses may differ from the state observed after the final round, and proteins involved in chemotaxis, inflammation and repair may follow different temporal paterns. Incorporating time into human observations can translate these basic research findings into more specific mechanistic questions.
An oral PCC1 trial with skin endpoints has been registered [17], but human evidence systematically connecting oral intake, circulating protein changes and immune-age-associated features remains limited. This study retrospectively analyzed existing records from 32 middle-aged and older participants during four rounds of oral supplementation. We compared third-party laboratory results for more than 100 circulating proteins in plasma to identify candidate markers and informative observation windows for further investigation. We combined multiple protein-based approaches using published age associations, model weights and immune-health-associated protein features to assess protein-age and immune-health paterns jointly [18,19,20,21,22,23]. Here, “circulating microenvironment remodeling” describes changes in the measured combinations of immune-communication proteins and their temporal paterns. We examined whether these changes collectively provide signals associated with immune rejuvenation.
Results
1. Changes in Circulating Proteins
The more than 100 plasma protein measures analyzed here came from available testing records for 32 participants, including 11 aged ≥65 years. The higher and lower cumulative-intake groups comprised 14 and 18 participants, respectively, with demographic characteristics provided in Supplementary Table S1. The records showed that approximately 2 days after completion of the four intake rounds (B3, approximately 48 days after baseline), signals for several chemokines and soluble TNF receptors were below baseline. After adjustment for assay batch differences using cross-batch reference samples, hereafter termed bridging, CCL11, sTNFR1 and sTNFR2 decreased in 32/32 participants. CCL14 and CCL18 each decreased in 29/32 participants, CCL15 in 27/32 and CCL2/MCP-1 in 28/32. These proteins also retained an overall downward direction without batch adjustment. Relative signal changes converted from the median paired log2 change were approximately _69.6%, _52.0%, _54.1%, _31.5% and _32.6% for CCL11, CCL14, CCL15, CCL18 and CCL2, respectively. IGFBP-4 decreased in 22/32 participants, with a relative signal change of approximately _21.0% (Fig. 1). Because chemokines participate in immune-cell recruitment and soluble receptors in signaling regulation, these shared changes provide a direct observational basis for examining the circulating immune environment.
Although some proteins showed declining readouts, low signals limited interpretation of the magnitude of change. Targeted IL-8 and NGAL readouts decreased in 30/31 and 26/31 participants, respectively. Some low IL-8 values at B3 were below the lower end of the linear range stated in the assay instructions, which was provisionally used as a conditional measurement threshold in this analysis. The low-end quantification range for NGAL had not been verified. These counts therefore describe the direction of reported readouts, and both the direction and magnitude of changes at low signal levels require interpretation in light of measurement uncertainty. Array IL-1β signals decreased in 31/32 participants, but only 4/32 had baseline and B3 signals that were both above background and met strict criteria for measurement range, repeatability and other readout conditions. IL-7 and MIF also had low-signal limitations. Three-visit trajectories for representative proteins and individual profiles for all measured targets show the variation in direction and readout quality across measurements (Supplementary Figure S2–S4). These profiles provide the protein-level context for the age-association and immune-health analyses below.
At B3, approximately 2 days after the final intake round ended, circulating protein readouts did not all change in the same direction. In contrast to the chemokine and receptor decreases above, GDF-15 and suPAR increased in 21/32 and 26/31 participants, respectively. The baseline-to-B3 changes in bridge- adjusted GDF-15 array readouts and suPAR values reported by the local laboratory were approximately +17.8% and +17.1%, respectively. IL-6 increased in 27/32 participants after array bridging, with a change of approximately +26.8%, and in 24/31 participants in targeted testing on another platform, with a change of approximately +34.1%. These percentages were all obtained by back-transforming the median individual log2(B3/B1) change and represent changes in the corresponding platform readouts. Array readouts were fluorescence signals. For array IL-6, only 3/32 participants met the strict endpoint readout criteria, so the reported magnitude must be interpreted in light of low-signal limitations.
Follow-up data after B3 are still being collected and are therefore not presented in full in this manuscript. Available follow-up results showed that IL-6 readouts declined from B3, with group-level values close to baseline. B4 was a separate follow-up approximately 16 days after the final intake round ended. Among the same 28 participants with targeted measurements at B1, B3 and B4, median IL-6 values were 1.390, 2.450 and 1.445 pg/mL, respectively, and mean values were 1.787, 2.664 and 1.758 pg/mL. From B3 to B4, IL-6 decreased in 21 participants and increased in 7. Relative to baseline, B4 values were lower in 15 and higher in 13. IL-8 showed some rebound from B3 but remained below baseline in most participants, while NGAL and lipoprotein-associated phospholipase A2 (Lp-PLA2) readouts were also predominantly below baseline. At B4, the median CRP value was 1.45 mg/L, higher than the baseline value of 0.73 mg/L in the same 28 participants but below the 5 mg/L upper reference limit stated in the assay report. When baseline readouts are near the lower end of an assay’s quantification range, small differences above or below baseline at follow-up are difficult to determine accurately. These follow-up observations are limited to individual markers with corresponding available records. B4 changes in GDF-15 and suPAR are not included in the results presented here.
2. Protein Age Directions
2.1. Selection of Age-Associated Proteins and Construction of Protein Combinations
To assess whether protein changes in this cohort aligned with characteristics associated with younger individuals, we used individual protein–age associations from published population studies by Tanaka, Lehallier and Oh et al. [18,19,20]. We first selected proteins that were significantly associated with age in the same direction in both Tanaka et al.’s chronic-disease-adjusted analysis and the study by Lehallier et al. [18,19]. We then retained targets that could be unambiguously matched to the collected testing records and met the readout conditions in at least 80% of participants in each of the three sampling batches, yielding a 12-protein combination. Separately, we used the individual protein–age associations reported for healthy participants in the study by Oh et al. [20] and applied the same local analyte-matching and readout criteria to construct a 19-protein combination. Selection did not depend on whether post- supplementation changes in this cohort pointed in a younger-age-associated direction. The 12-protein combination included CCL11, CCL14, IGFBP-3, IL-1ra, sTNFR1 and sTNFR2, among others. The 19- protein healthy-population age-associated combination additionally included IGFBP-4, CCL15, CCL18 and osteopontin. The two combinations shared 11 proteins and emphasized cross-study directional concordance and healthy-population age associations, respectively. Full membership and selection criteria are provided in Supplementary Methods section 3.1. This was a retrospective measurability screen using the complete available dataset. Score calculation and the scope of interpretation are described in Methods section 3.1 and Supplementary Methods sections 3.1–3.2.
2.2. Results for the Two Age-Associated Protein Combinations
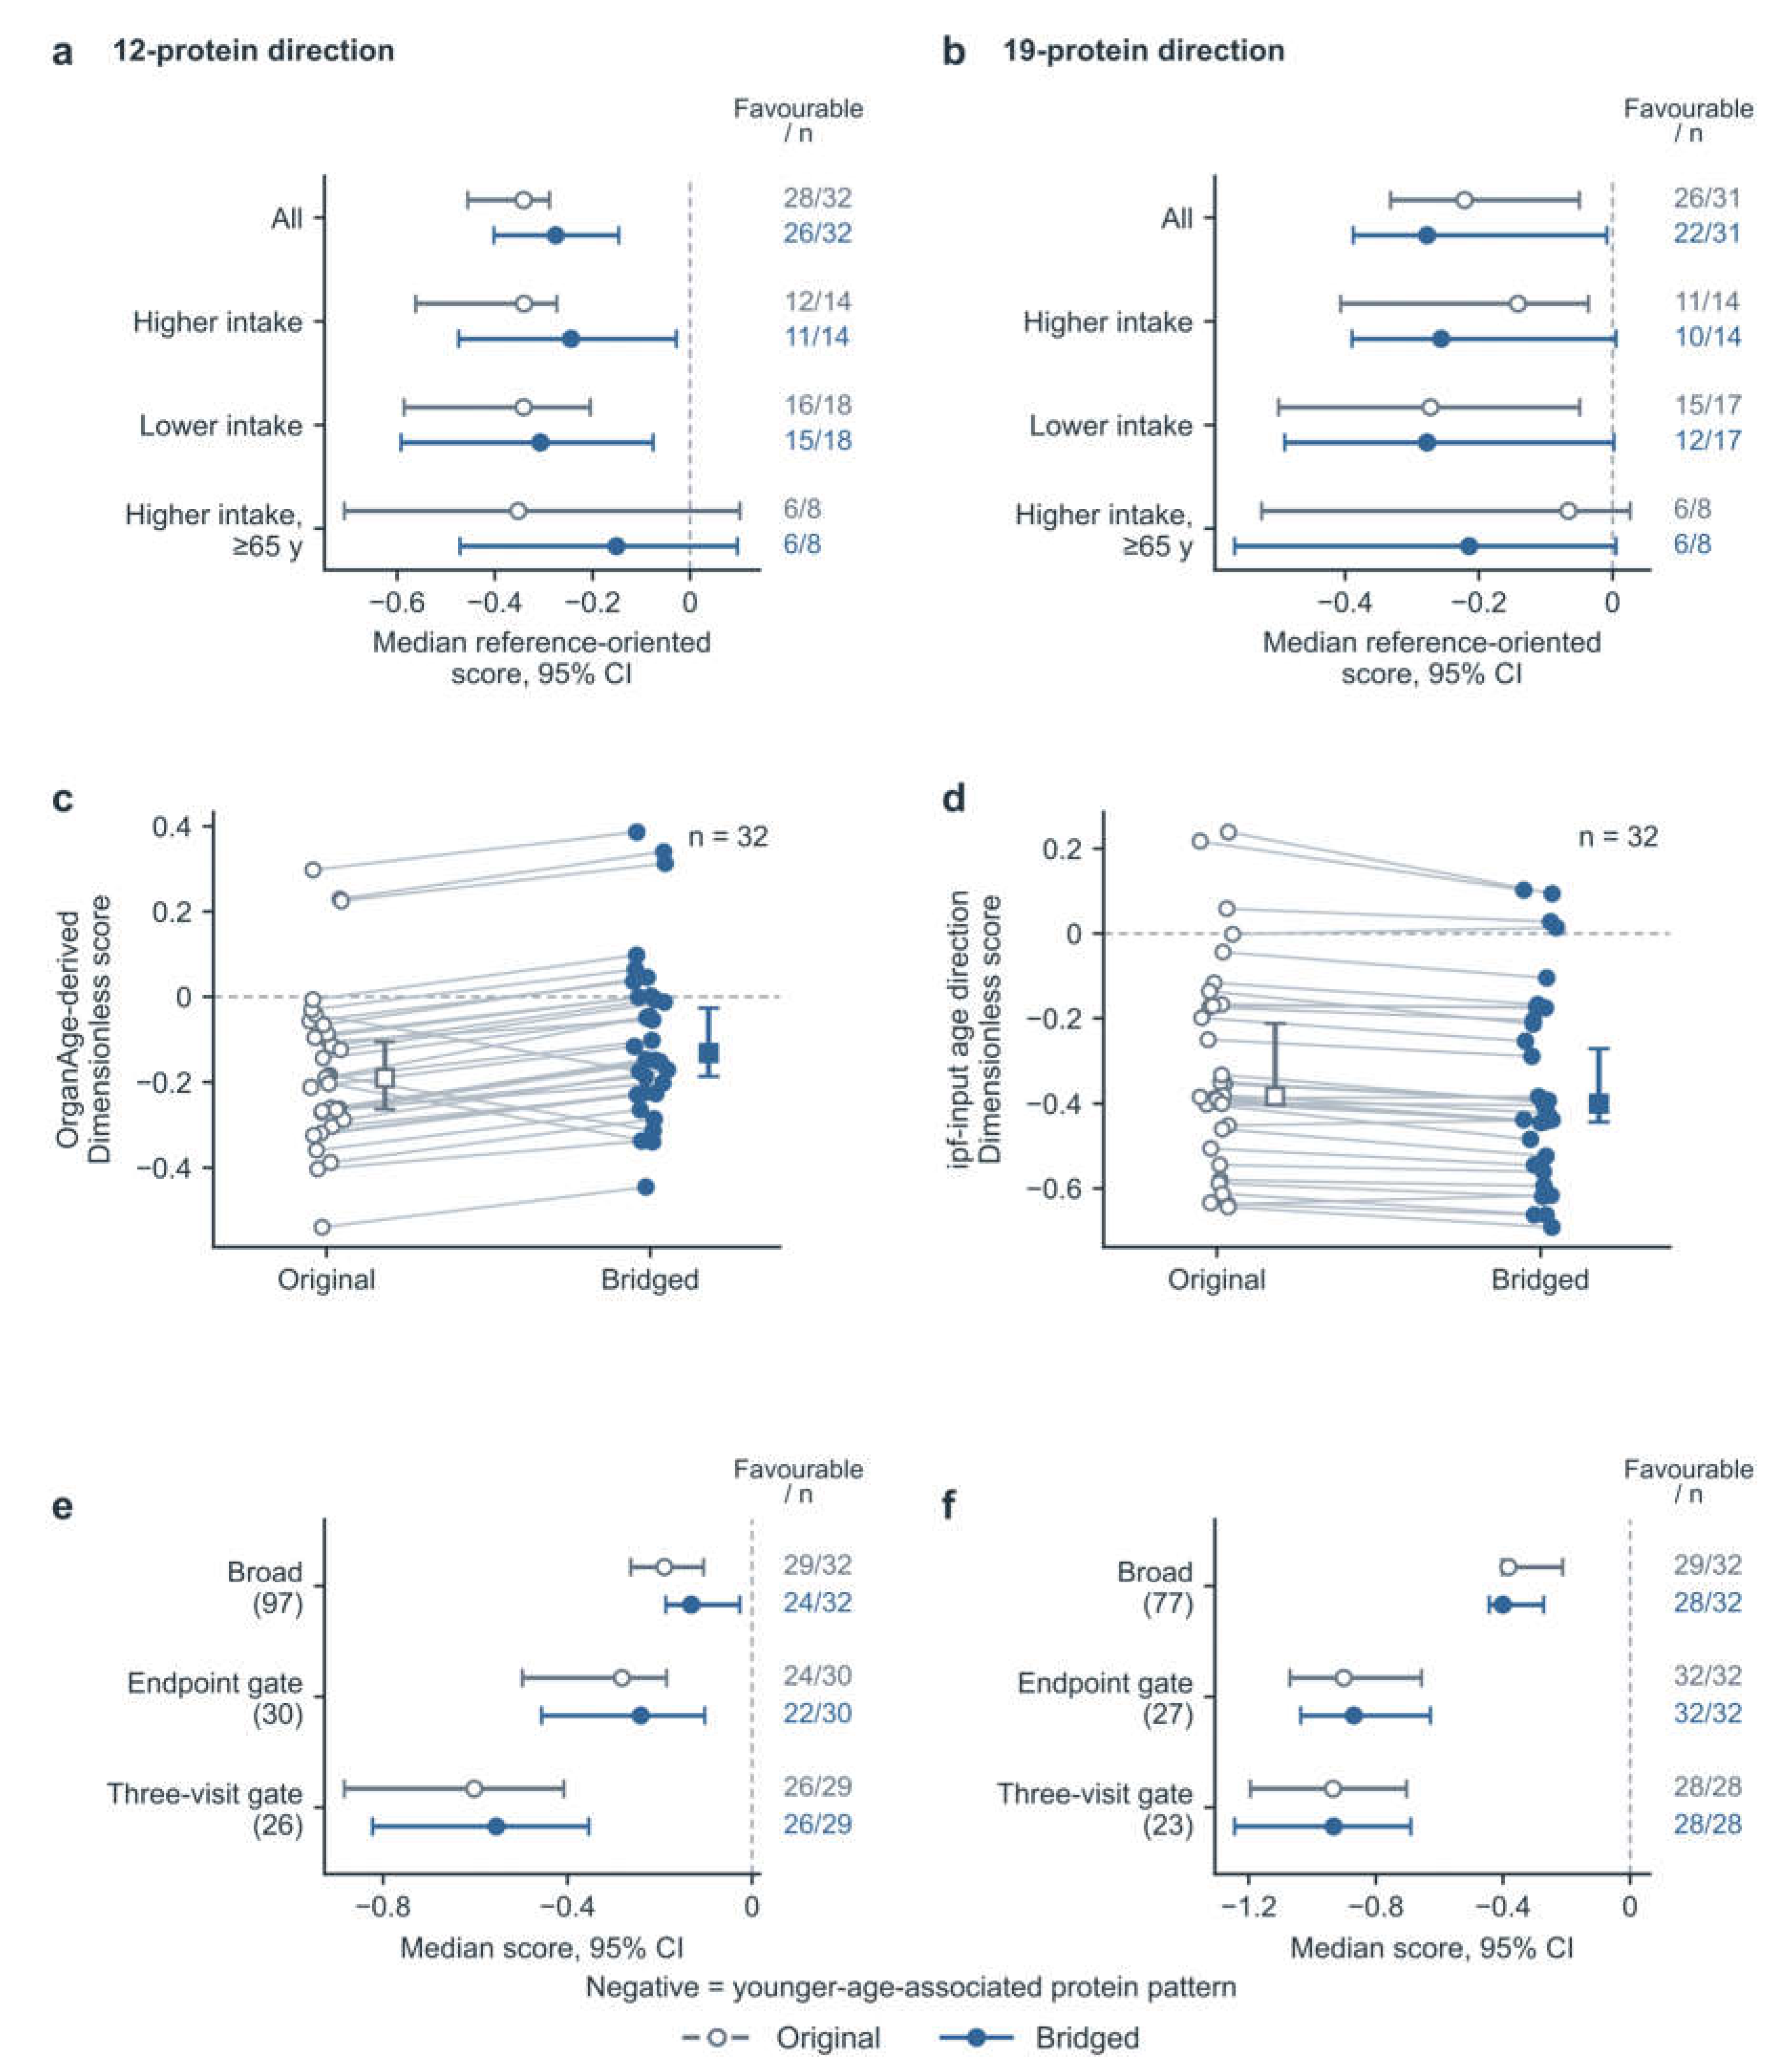
For the comparison between B3, approximately 2 days after the final intake round ended, and the pre- supplementation baseline, the 12-protein combination was evaluable in 32 participants. Of these participants, 26 showed a younger-age-associated direction, and the median score for all 32 was −0.275. The 19-protein healthy-population age-associated combination was evaluable in 31 participants. Of these participants, 22 showed a younger-age-associated direction, and the median score for all 31 was −0.277. A score using the complete combination could not be calculated for 1 participant because the B3 osteopontin readout was zero. Median scores for both combinations were negative in both the higher and lower cumulative-intake groups. In the subgroup aged ≥65 years within the higher cumulative-intake group, 6/8 participants showed a younger-age-associated direction with each combination, although the 95% intervals were wide and included zero (Figure 2a,b). In the overall analysis without stratification by age or cumulative-intake regimen, median scores for both the 12- and 19-protein combinations pointed in a younger-age-associated direction.
Separating proteins by positive and negative age associations reported in the literature showed that the overall negative scores of the 12- and 19-protein combinations were driven primarily by decreases in age- increasing proteins. The 3 and 5 age-decreasing proteins in the respective combinations did not show younger-age-associated changes to the same extent in this cohort. Results stratified by these two classes of proteins, whose levels increase or decrease with age in the published studies, are provided in
Supplementary Methods section 4.1. The two combinations therefore summarize the overall age- association direction of their constituent proteins and should not be interpreted as coordinated restoration of every class of age-related characteristics. This decomposition also provided a basis for extending the protein coverage and examining the immune-focused combination.
2.3. Two Scoring Approaches with Broader Protein Coverage
To broaden the assessment, we used public coefficients from Goeminne et al.’s first-generation Conventional whole-proteome age model in OrganAge, which had 2,315 nonzero inputs in its first fold [21]. For non-Olink protein data, the authors provided a scaling procedure: appropriately transform the measurements, standardize each protein using its local standard deviation, and multiply by the corresponding original Olink standard deviation. We used this procedure to construct a local weighted change score from 97 matching measurements, hereafter termed the OrganAge local score. For longitudinal comparisons, each protein’s standardization scale was fixed to its baseline variability. With a common reference, fixed centering terms and the intercept cancel in each participant’s paired difference. This score uses the original model’s conditional predictive weights rather than individual protein–age correlation coefficients and describes changes in the weighted contributions of the measured subset (Methods section 3.2 and Supplementary Methods section 3.3).
A second expanded analysis used the 2,923-input list of the ipfP3GPT plasma network developed by Galkin et al. to define the candidate protein range [22]. Age-association directions were obtained from the single-protein analyses reported by Tanaka, Lehallier and Oh et al. and integrated according to statistical support and significant directional conflicts [18,19,20,24,25]. Applying the local measurability criteria and the requirement for a calculable baseline scale yielded a 77-protein combination. Directions for 73 proteins were integrated from these studies, while 4 supplementary measurements used Tanaka et al.’s chronic-disease-adjusted associations [18]. The input list defined the candidate range, and published population associations supplied the directions. The equally weighted mean of each participant’s signed standardized changes defined the local directional score constructed for this study, hereafter termed the ipfP3GPT local score. This calculation did not use the original neural network or its age-prediction weights. The ipfP3GPT local score and the OrganAge local score therefore provide perspectives based on individual protein associations and joint-model weights, respectively (Methods section 3.3 and Supplementary Methods section 3.4).
The OrganAge local score and the ipfP3GPT local score pointed in a younger-age-associated direction in 24/32 and 28/32 participants, with medians of −0.132 and −0.400, respectively (Figure 2c,d).
Figure 2e,f further compares the broad-coverage, strict-endpoint and strict-three-visit analyses. All values reported here are bridge-adjusted B3-versus-baseline results. Retaining only proteins that met the prespecified strict readout conditions at both baseline and B3 left 30 proteins in the OrganAge local score. Of the evaluable participants, 22/30 showed a younger-age-associated direction, with a median of −0.241 (95% interval: −0.456 to −0.103). The ipfP3GPT local score retained 27 proteins, with a younger-age- associated direction in 32/32 evaluable participants and a median of −0.869 (95% interval: −1.036 to −0.628). Requiring the strict readout conditions at all three sampling visits, B1, B2 and B3, retained 26 and 23 proteins in the two scores, respectively. Younger-age-associated directions were observed in 26/29 and 28/28 evaluable participants, with medians of −0.554 (95% interval: −0.822 to −0.354) and −0.933 (95% interval: −1.244 to −0.690), respectively. In the corresponding unbridged analyses, median scores were also negative under both strict filtering conditions (Figure 2e,f). Protein membership and the number of evaluable participants differed across filtering conditions. In the overall analyses, both protein age- direction scores remained predominantly oriented toward younger-age-associated characteristics after strict readout filtering.
2.4. Dependence on Key Proteins and Sensitivity Analyses
The OrganAge local score used in this study covered only approximately 4.77% of the original complete model’s absolute standardized weight. To examine whether individual proteins within this limited input set dominated the score direction, we compared results after removing each protein in turn. In the bridge-adjusted overall analysis, only removal of CCL11 among the 97 proteins changed the median OrganAge local score from negative to positive. All median ipfP3GPT local scores remained negative after removal of individual proteins (Supplementary Information section 5). CCL11 was below baseline in all 32 participants and contributed substantially to the younger-age-associated direction of the OrganAge local score. Removing CCL11 changed the bridge-adjusted overall median from −0.132 to +0.027, a value close to zero that crossed into the positive range. This contribution depends on the observed change in this cohort and its scoring weight, rather than indicating that CCL11 has the largest original model weight. By contrast, removing CCL11 from the ipfP3GPT local score changed the overall median from −0.400 to −0.342, retaining a younger-age-associated direction (Supplementary Figure S5a,c).
Readout-quality filtering also changed the direction of the median ipfP3GPT local score in the subgroup aged ≥65 years within the higher cumulative-intake group. Excluding the 16 proteins whose bridging- reference readouts exceeded the highest standard-curve point left 61 proteins in the ipfP3GPT local score. The excluded proteins included CCL15, CCL18, GDF-15, sTNFR1 and sTNFR2. All 8 participants aged ≥65 years in the higher cumulative-intake group remained evaluable, but the median score changed from −0.319 to +0.080, and the number with a younger-age-associated direction decreased from 8/8 to 1/8 (Supplementary Figure S5d). This filtering concerned the readout range of the bridging-reference samples and did not mean that all participant readouts for the corresponding proteins exceeded the upper standard-curve limit.
Figure 1.
| Changes in circulating proteins. a, Original and bridged median changes in 118 proteins. Each point represents one protein, and blue points indicate proteins for which at least 26/32 participants met the readout criteria at both endpoints. b, Heatmap of individual changes in selected proteins. Blue indicates decreases, ochre increases and gray missing values. The color scale is limited to ±2. c, Median changes and 95% confidence intervals for representative proteins. Counts on the right give participants with decreases in the bridged analysis/evaluable participants. Gray open and blue filled points denote original and bridged results, respectively.
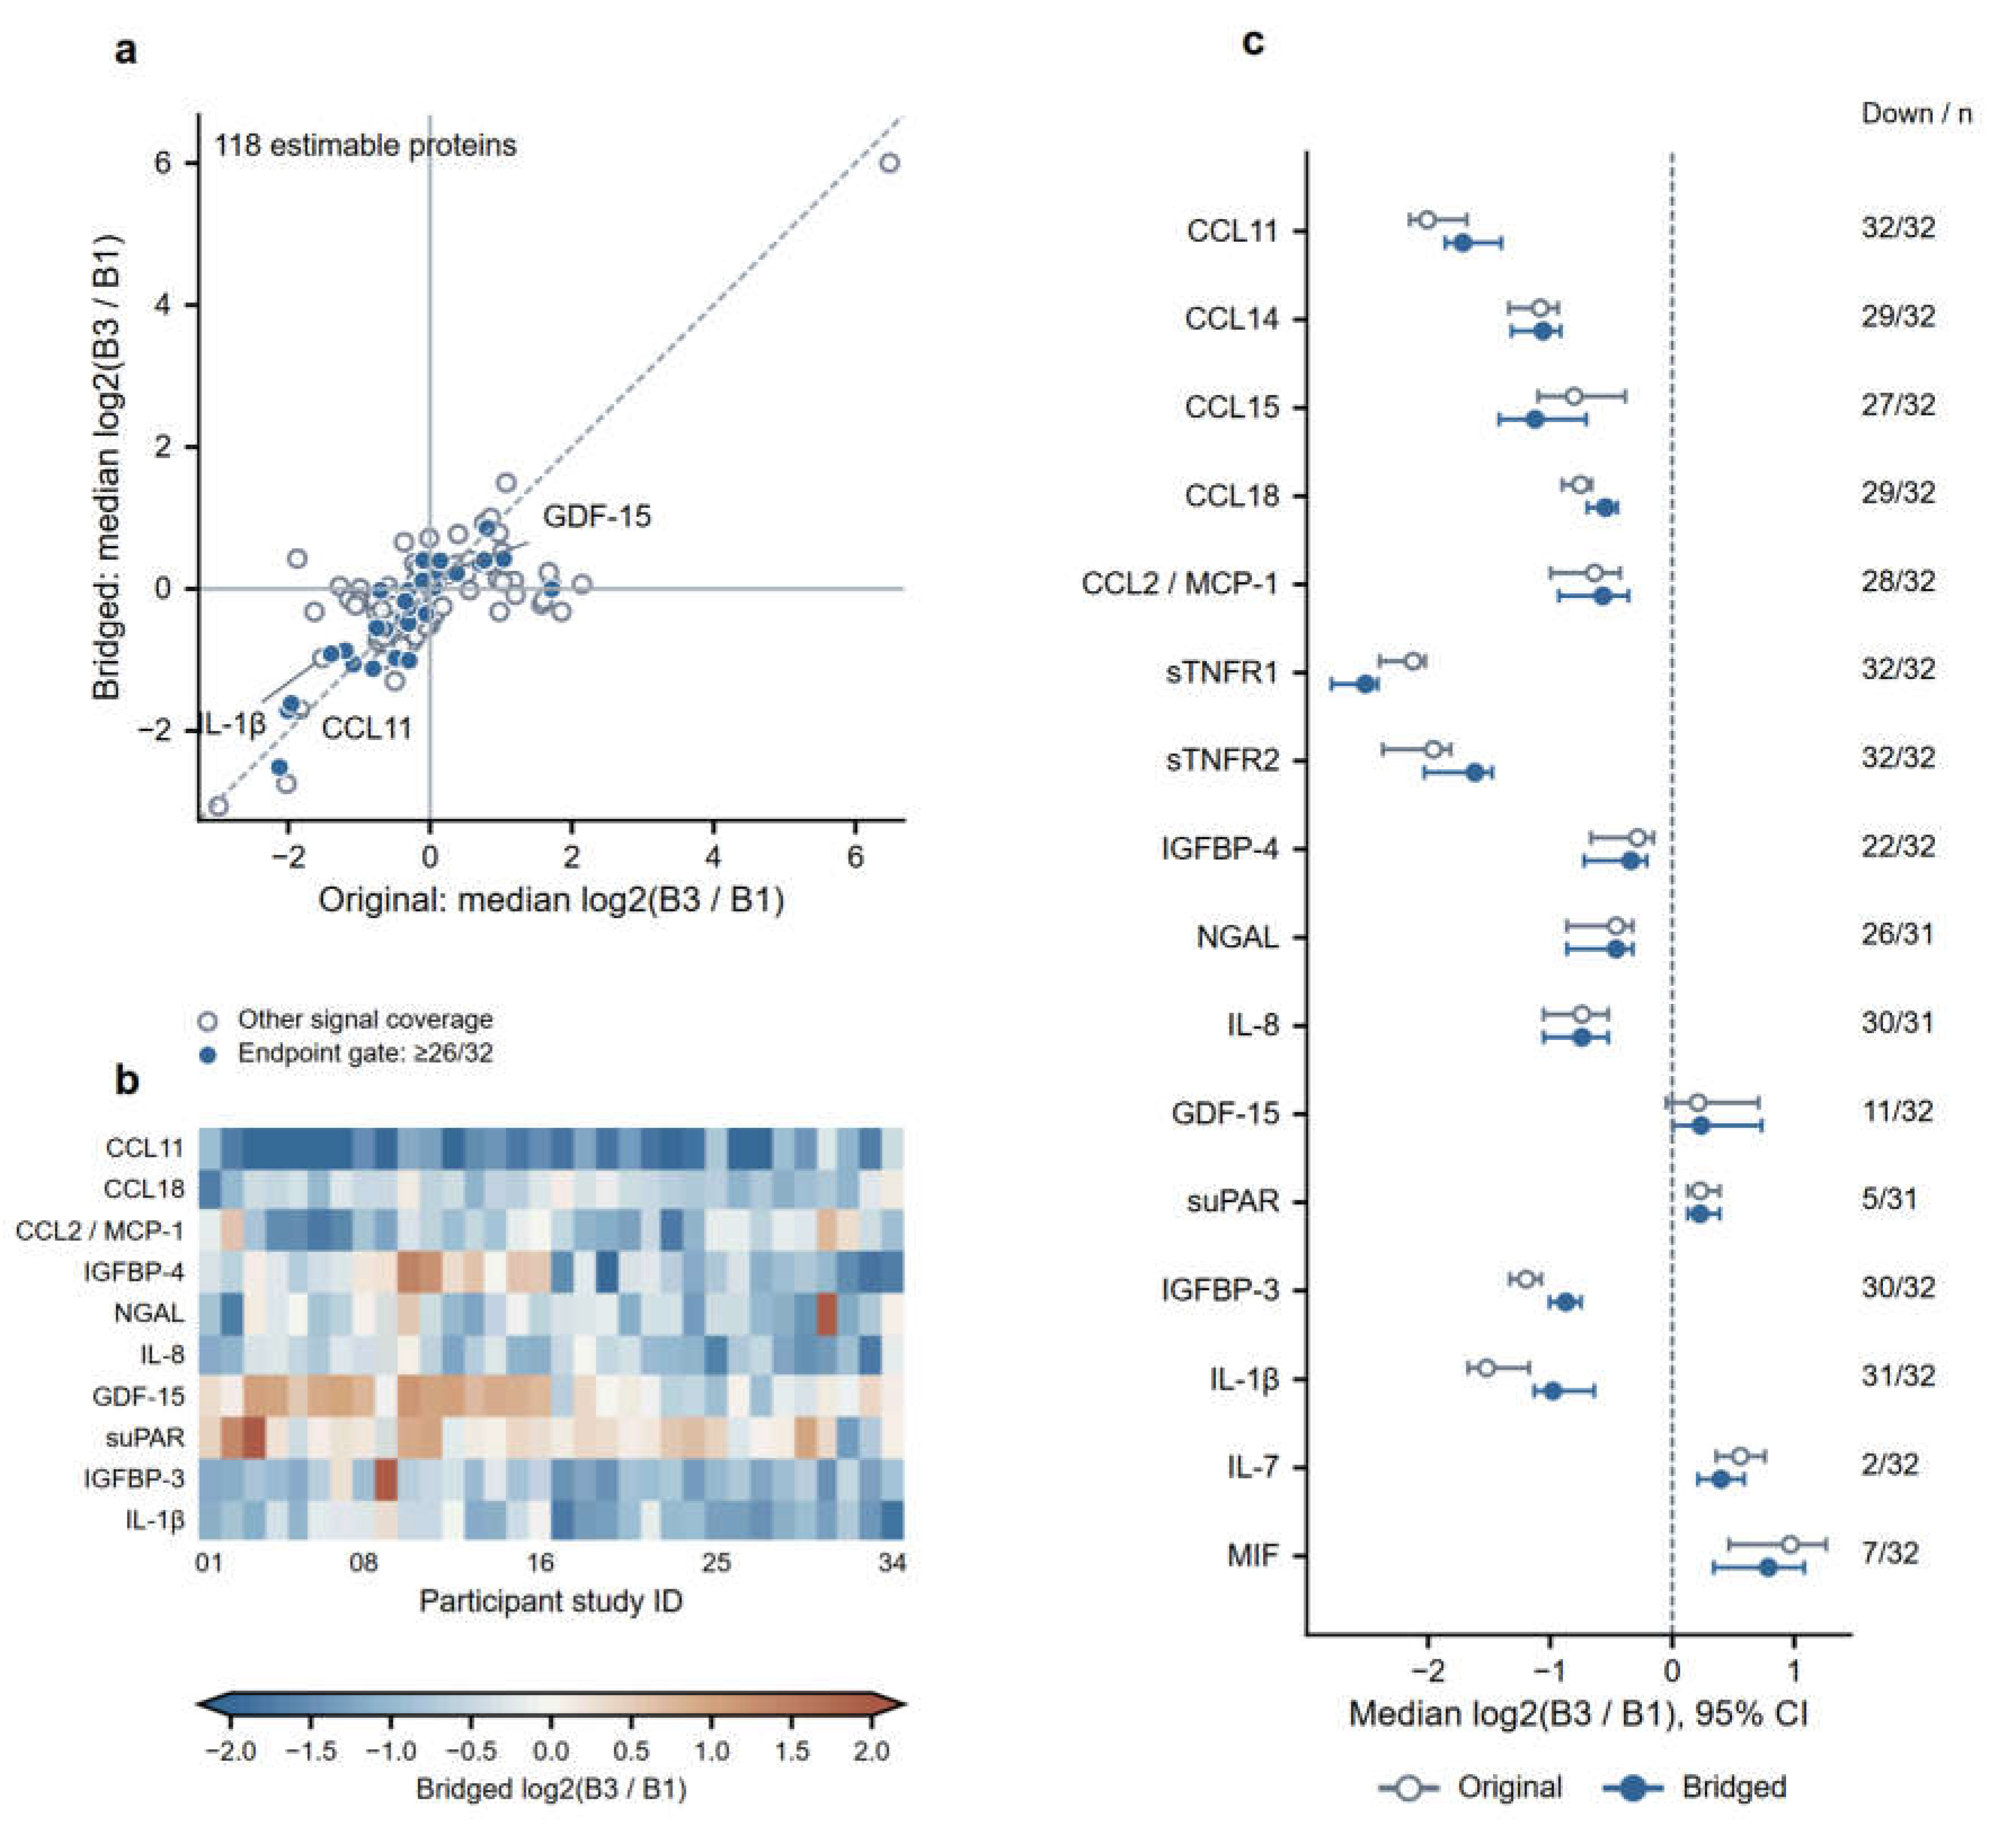
Figure 2.
| Protein age-direction scores a,b, Median scores for the 12- and 19-protein combinations, respectively. c,d, Individual OrganAge and ipfP3GPT local scores, respectively. Thin lines connect the same participant, and squares indicate group medians. e,f, Median local scores under broad-coverage, strict-endpoint and strict-three-visit filtering. Parentheses give the number of proteins, and counts on the right give participants with negative scores/evaluable participants. Error bars indicate 95% confidence intervals for the medians. Gray open and blue filled symbols denote original and bridged results, respectively.
3. Immune Age and Immune Health
3.1. Age Directions of Core Immune Proteins
We constructed a 58-protein core immune age-direction score using immune-communication functions and individual protein–age associations reported by Goeminne et al. [21]. The score summarizes protein changes from baseline according to their published age-association directions, with negative values indicating younger-age-associated characteristics. Member selection and calculation are described in Methods section 3.4 and Supplementary Methods section 3.5.
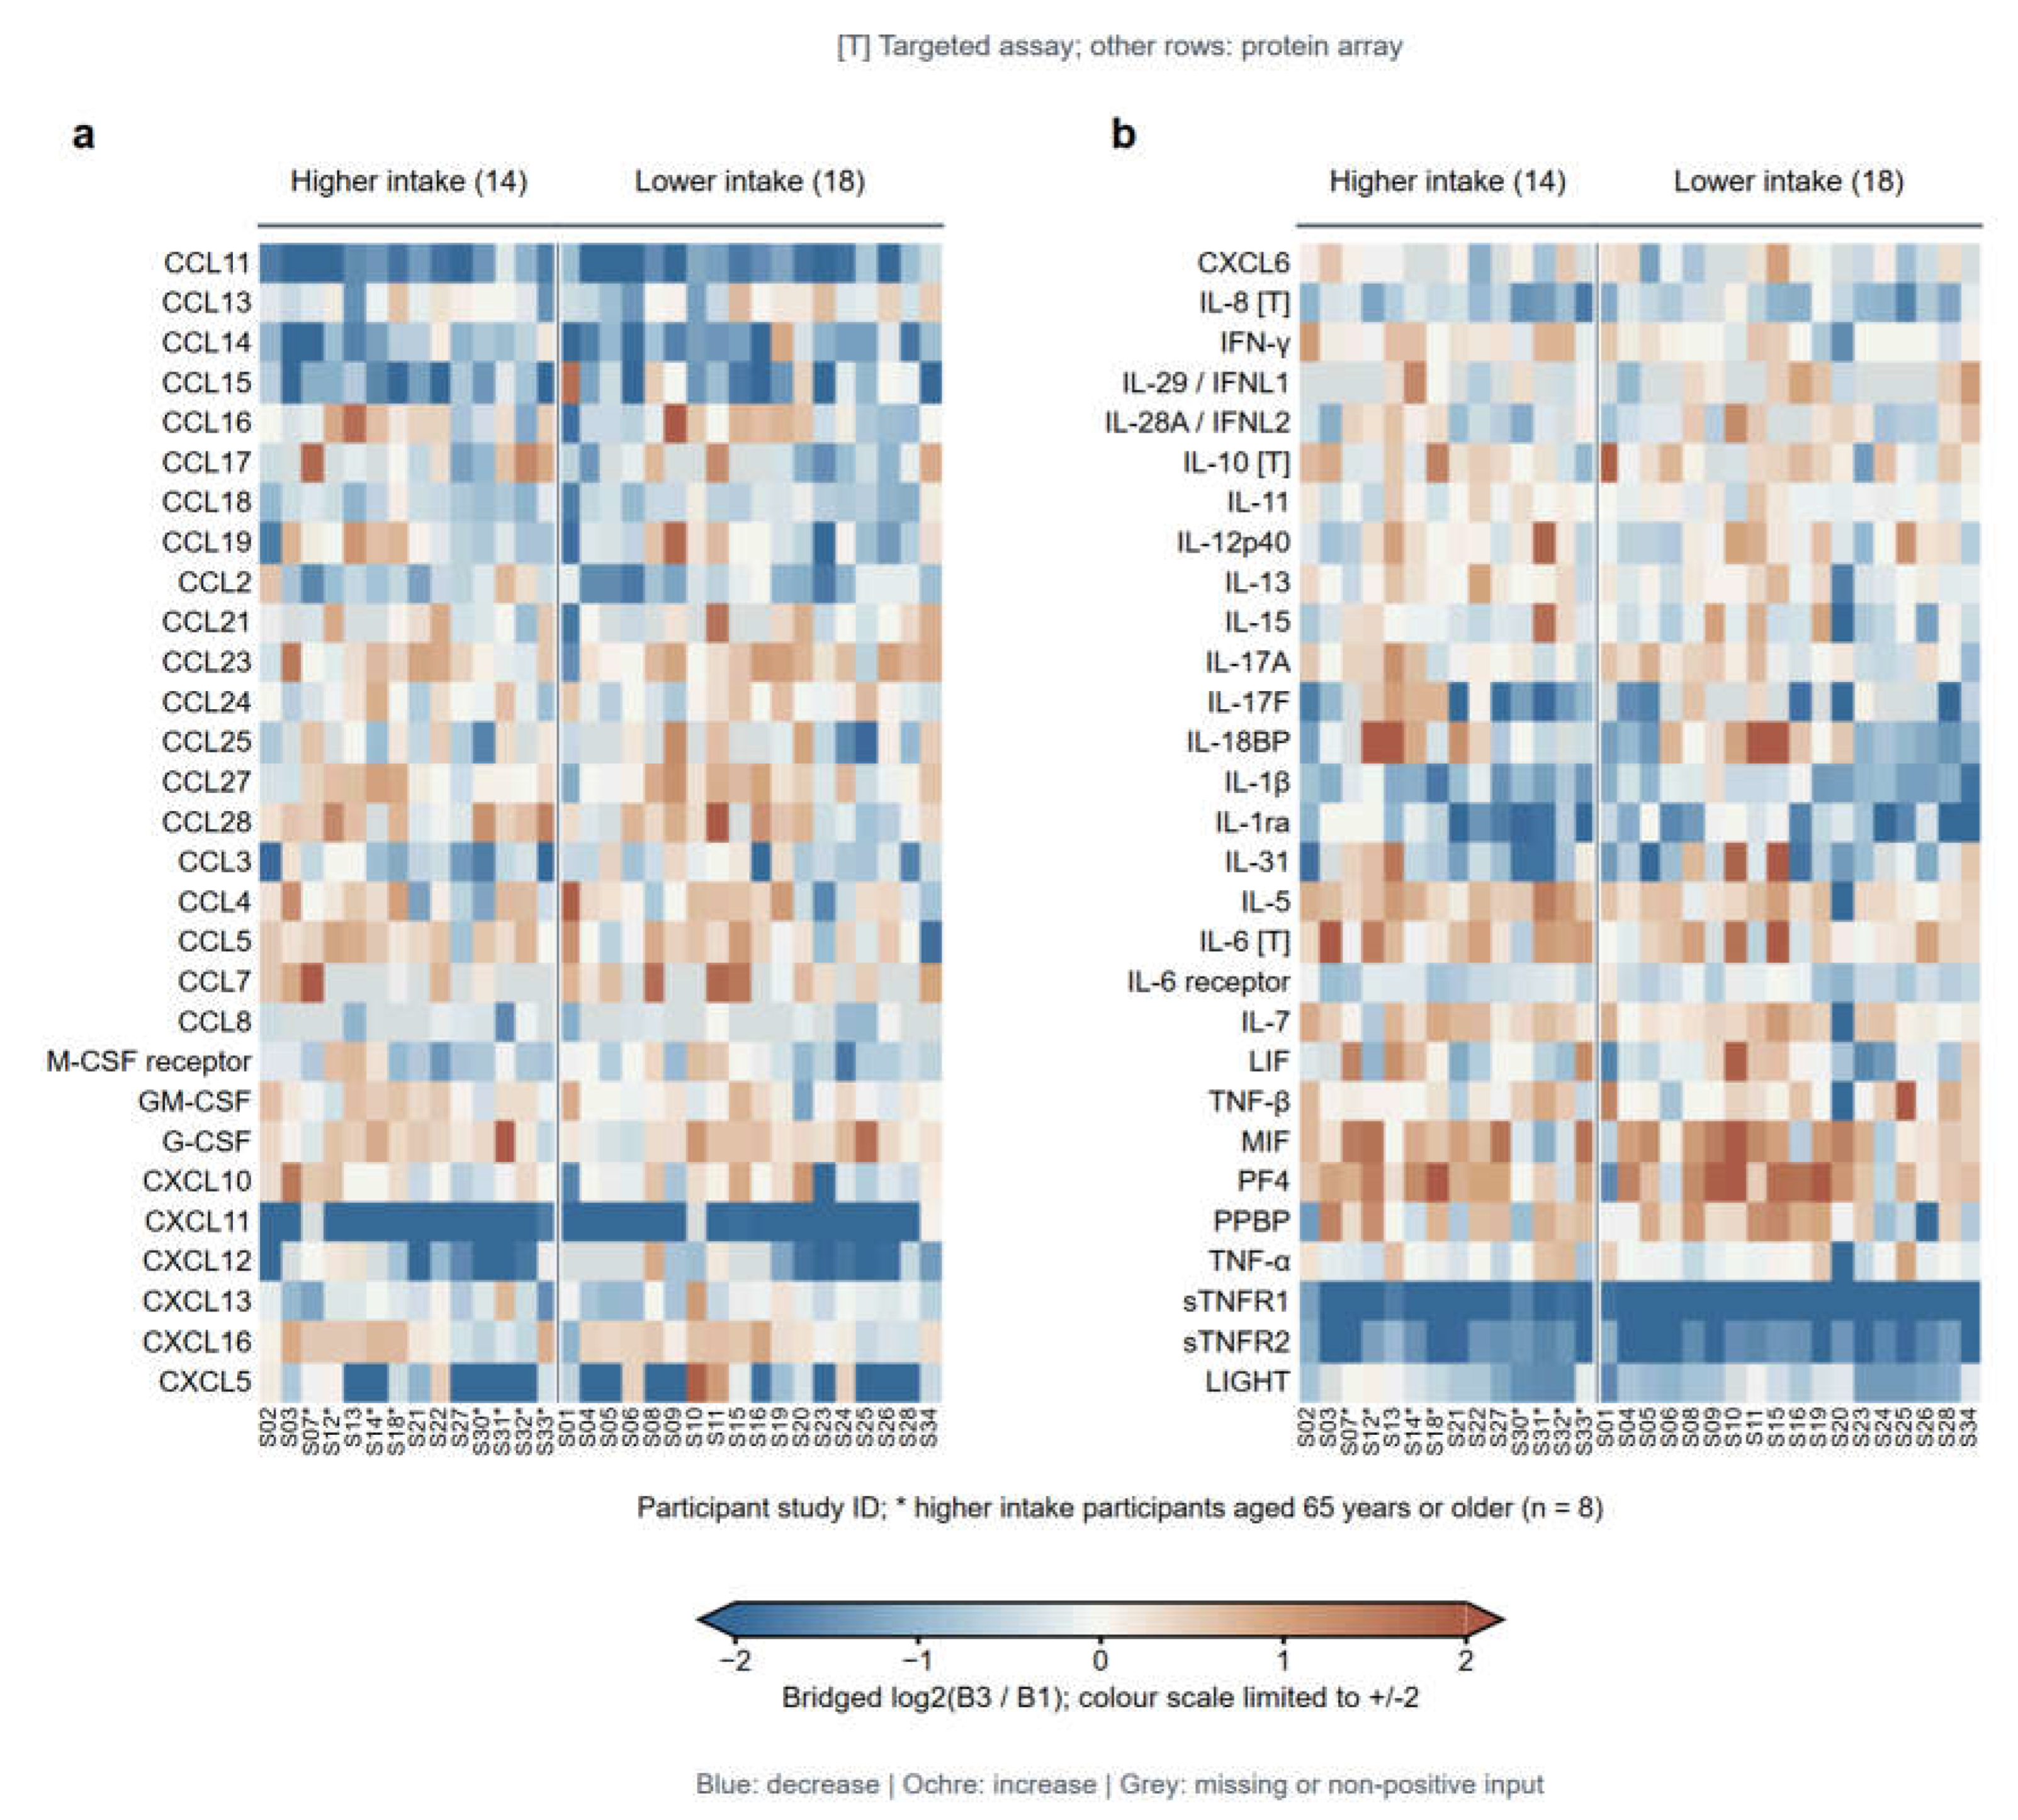
Figure 3 presents individual B3-versus-baseline changes in these 58 proteins. Decreases in CCL11 and the soluble TNF receptors sTNFR1 and sTNFR2 were observed under both cumulative-intake regimens. CCL14 and CCL18 predominantly decreased, whereas targeted IL-6 readouts predominantly increased. Other members showed differing directions across proteins and participants. Colors encode the direction of change in the measured readouts. Whether a change corresponds to younger- or older-age-associated characteristics depends on the protein’s published age-association direction. Unbridged changes for the same proteins are shown in Supplementary Figure S6.
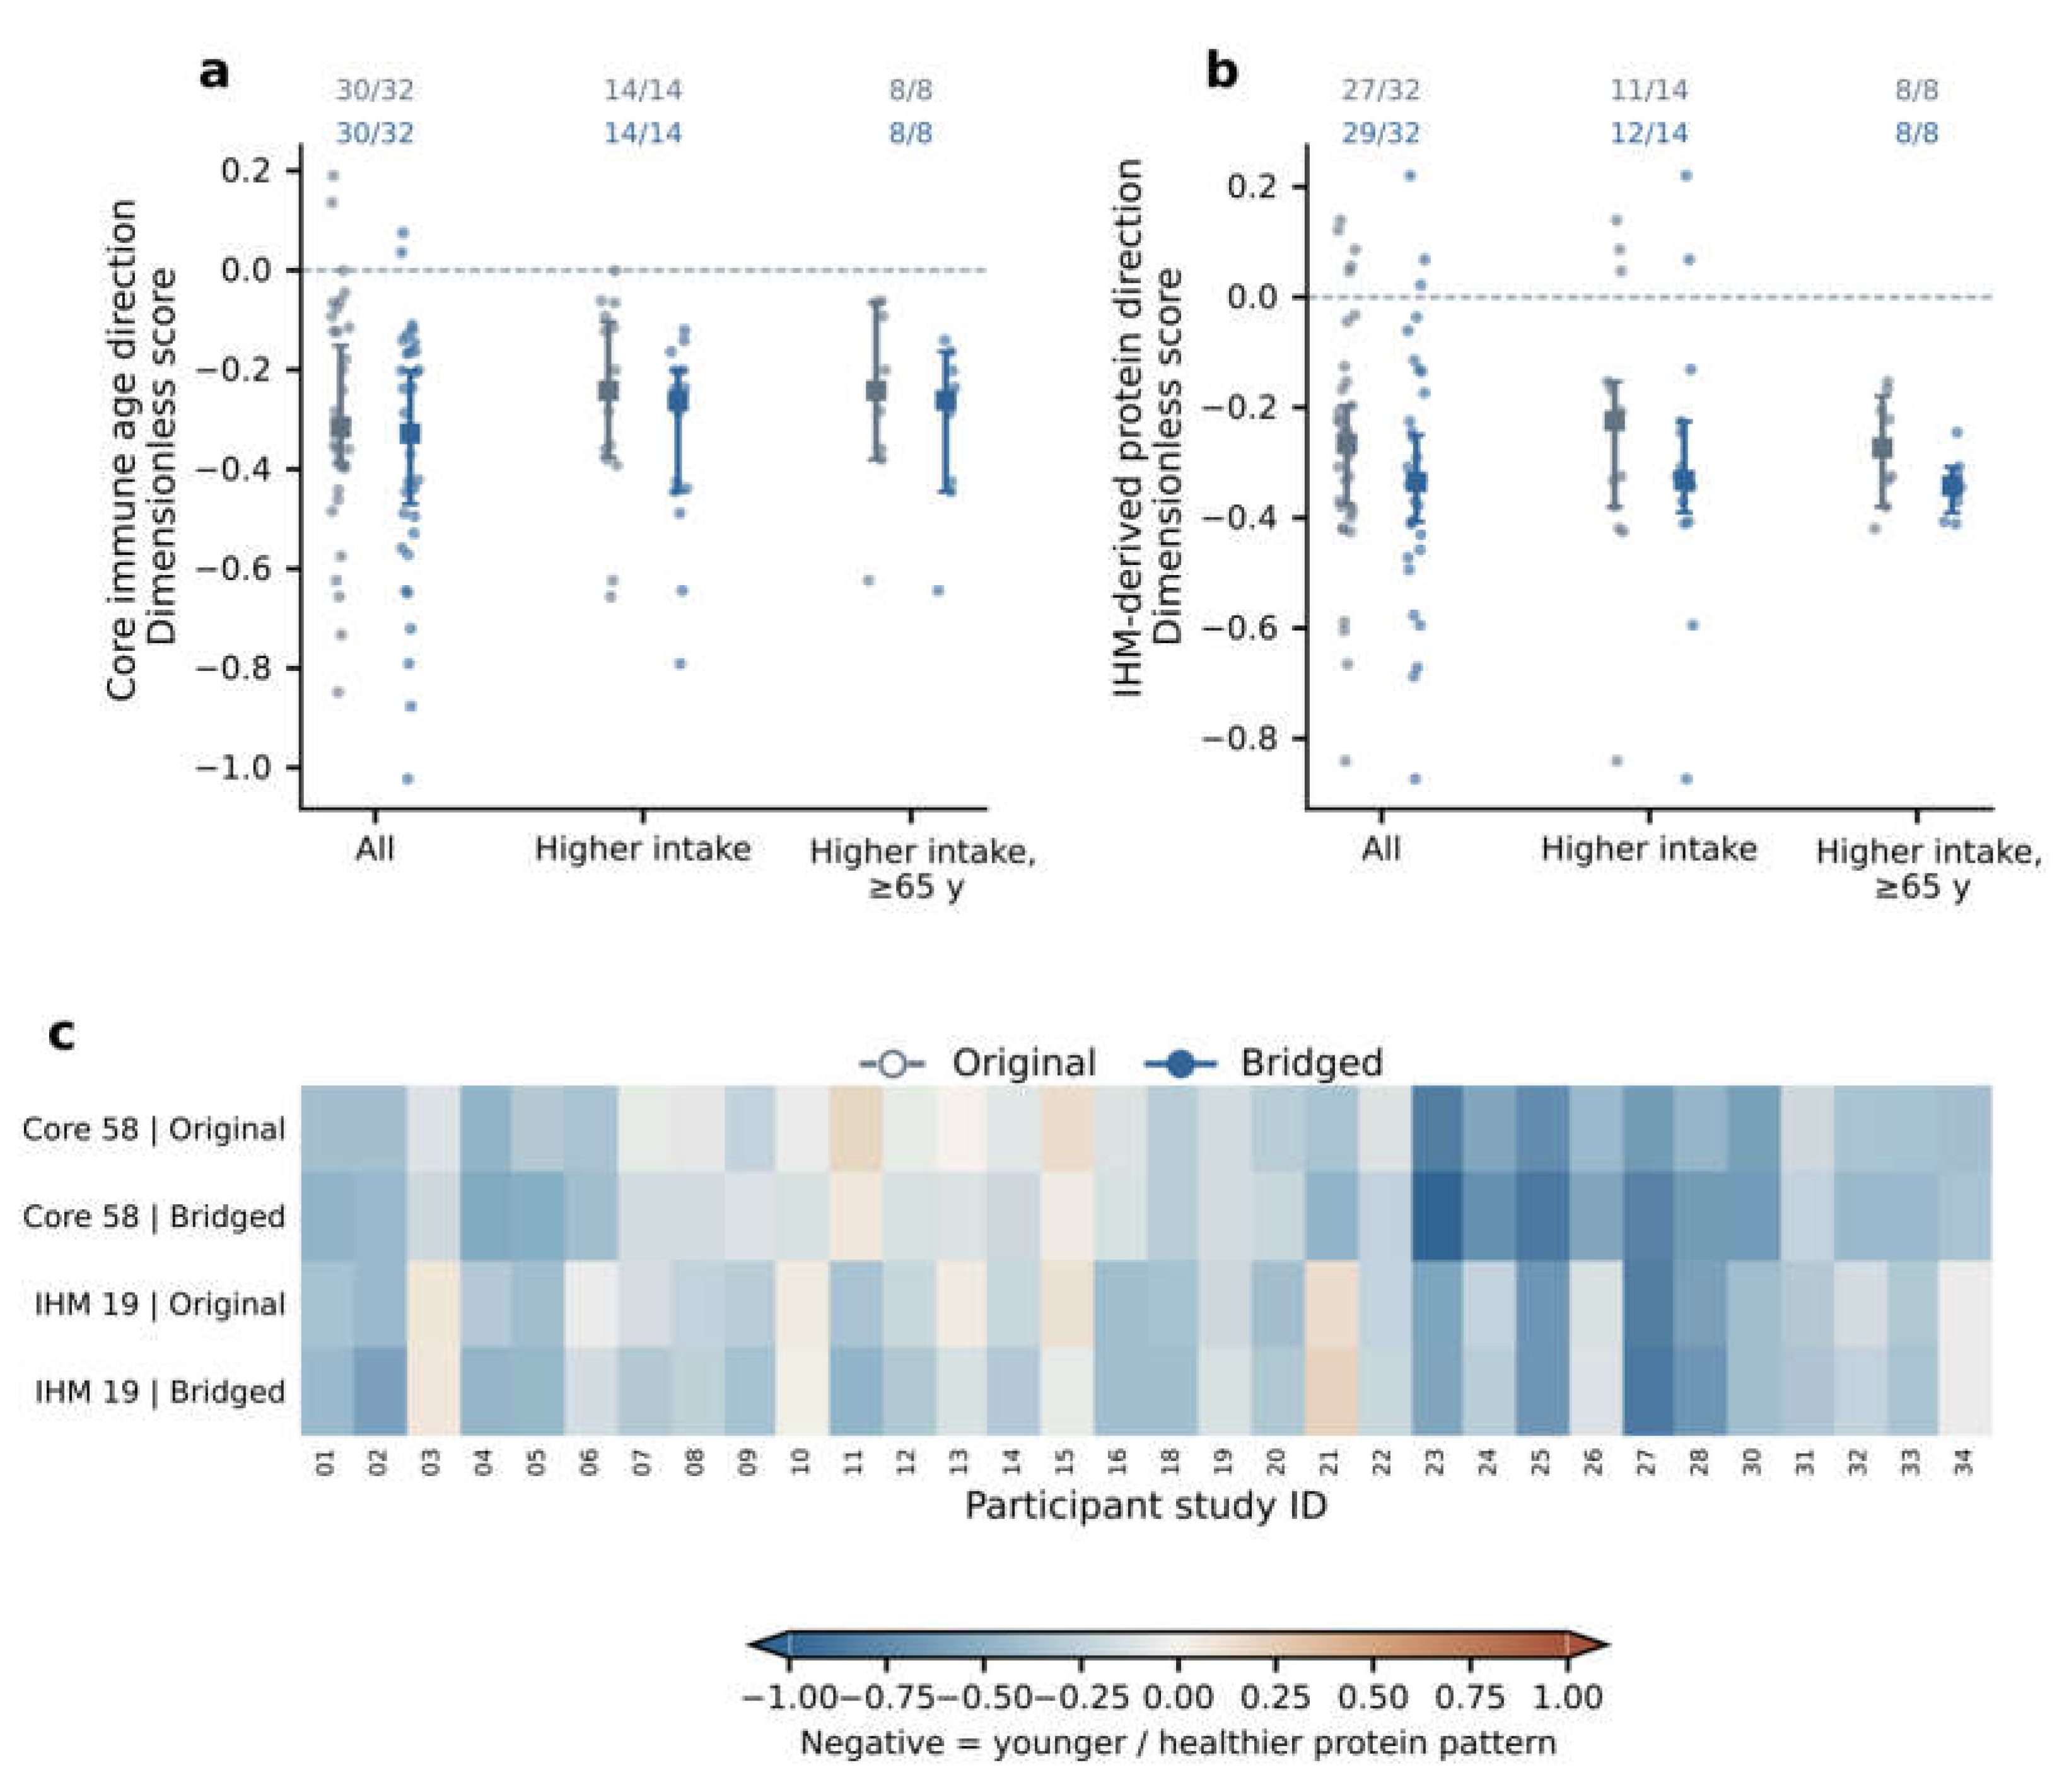
After aggregation according to these age-association directions, the 58-protein core immune age- direction score had an overall median of −0.328 (95% interval: −0.470 to −0.201) in the bridge-adjusted B3- versus-baseline analysis, with a younger-age-associated direction in 30/32 participants (Figure 4a). In the higher cumulative-intake group, 14/14 participants showed this direction, with a median of −0.262 (95% interval: −0.445 to −0.201). Within that group, all 8/8 participants aged ≥65 years showed this direction, with a median of −0.261 (95% interval: −0.445 to −0.164). A younger-age-associated direction was also observed in 16/18 participants in the lower cumulative-intake group (Table 1).
Figure 3.
| Changes in core immune proteins a,b, Each panel shows 29 proteins. Columns represent the same 32 participants in both panels, grouped by cumulative intake. Asterisks identify participants aged ≥65 years within the higher cumulative-intake group. Each cell shows bridged log2(B3/B1). Blue indicates decreases, ochre increases and gray values that could not be calculated. The color scale is limited to ±2. [T] denotes a targeted assay.
3.2. Health Directions of IHM-Associated Proteins
We constructed a 19-protein IHM-associated protein-direction score using the circulating protein features associated with the Immune Health Metric (IHM) proposed by Sparks et al. [23]. This score describes longitudinal changes in these proteins relative to baseline, with negative values indicating characteristics associated with beter immune health. It is not the original IHM’s predicted probability of membership in the healthy group. Analyte matching and calculation are described in Methods section 3.4 and Supplementary Methods section 3.5.
In the bridge-adjusted B3-versus-baseline analysis, the 19-protein IHM-associated protein-direction score had an overall median of −0.335 (95% interval: −0.407 to −0.250), with a direction associated with beter immune health in 29/32 participants (Figure 4b). In the higher cumulative-intake group, the corresponding count was 12/14 and the median was −0.332 (95% interval: −0.390 to −0.225). Within that group, all 8/8 participants aged ≥65 years showed a direction associated with beter immune health, with a median of −0.342 (95% interval: −0.391 to −0.308). In the lower cumulative-intake group, 17/18 participants showed a direction associated with beter immune health (Table 1). Figure 4c presents the immune age-direction and immune health-direction scores for the same 32 participants. Most participants had negative values for both scores, while differences in direction across individuals and between scores were retained.
Figure 4.
| Immune age and immune health scores a, Immune age-direction score. b, IHM-associated score. Both panels show individual scores, group medians and 95% confidence intervals. Numbers at the top give participants with favorable-direction scores/evaluable participants. Gray and blue in a,b denote original and bridged results, respectively. c, Individual heatmap of the two scores. The color scale is limited to ±1, with blue indicating negative and ochre positive scores.
3.3. Robustness of the Immune-Related Scores
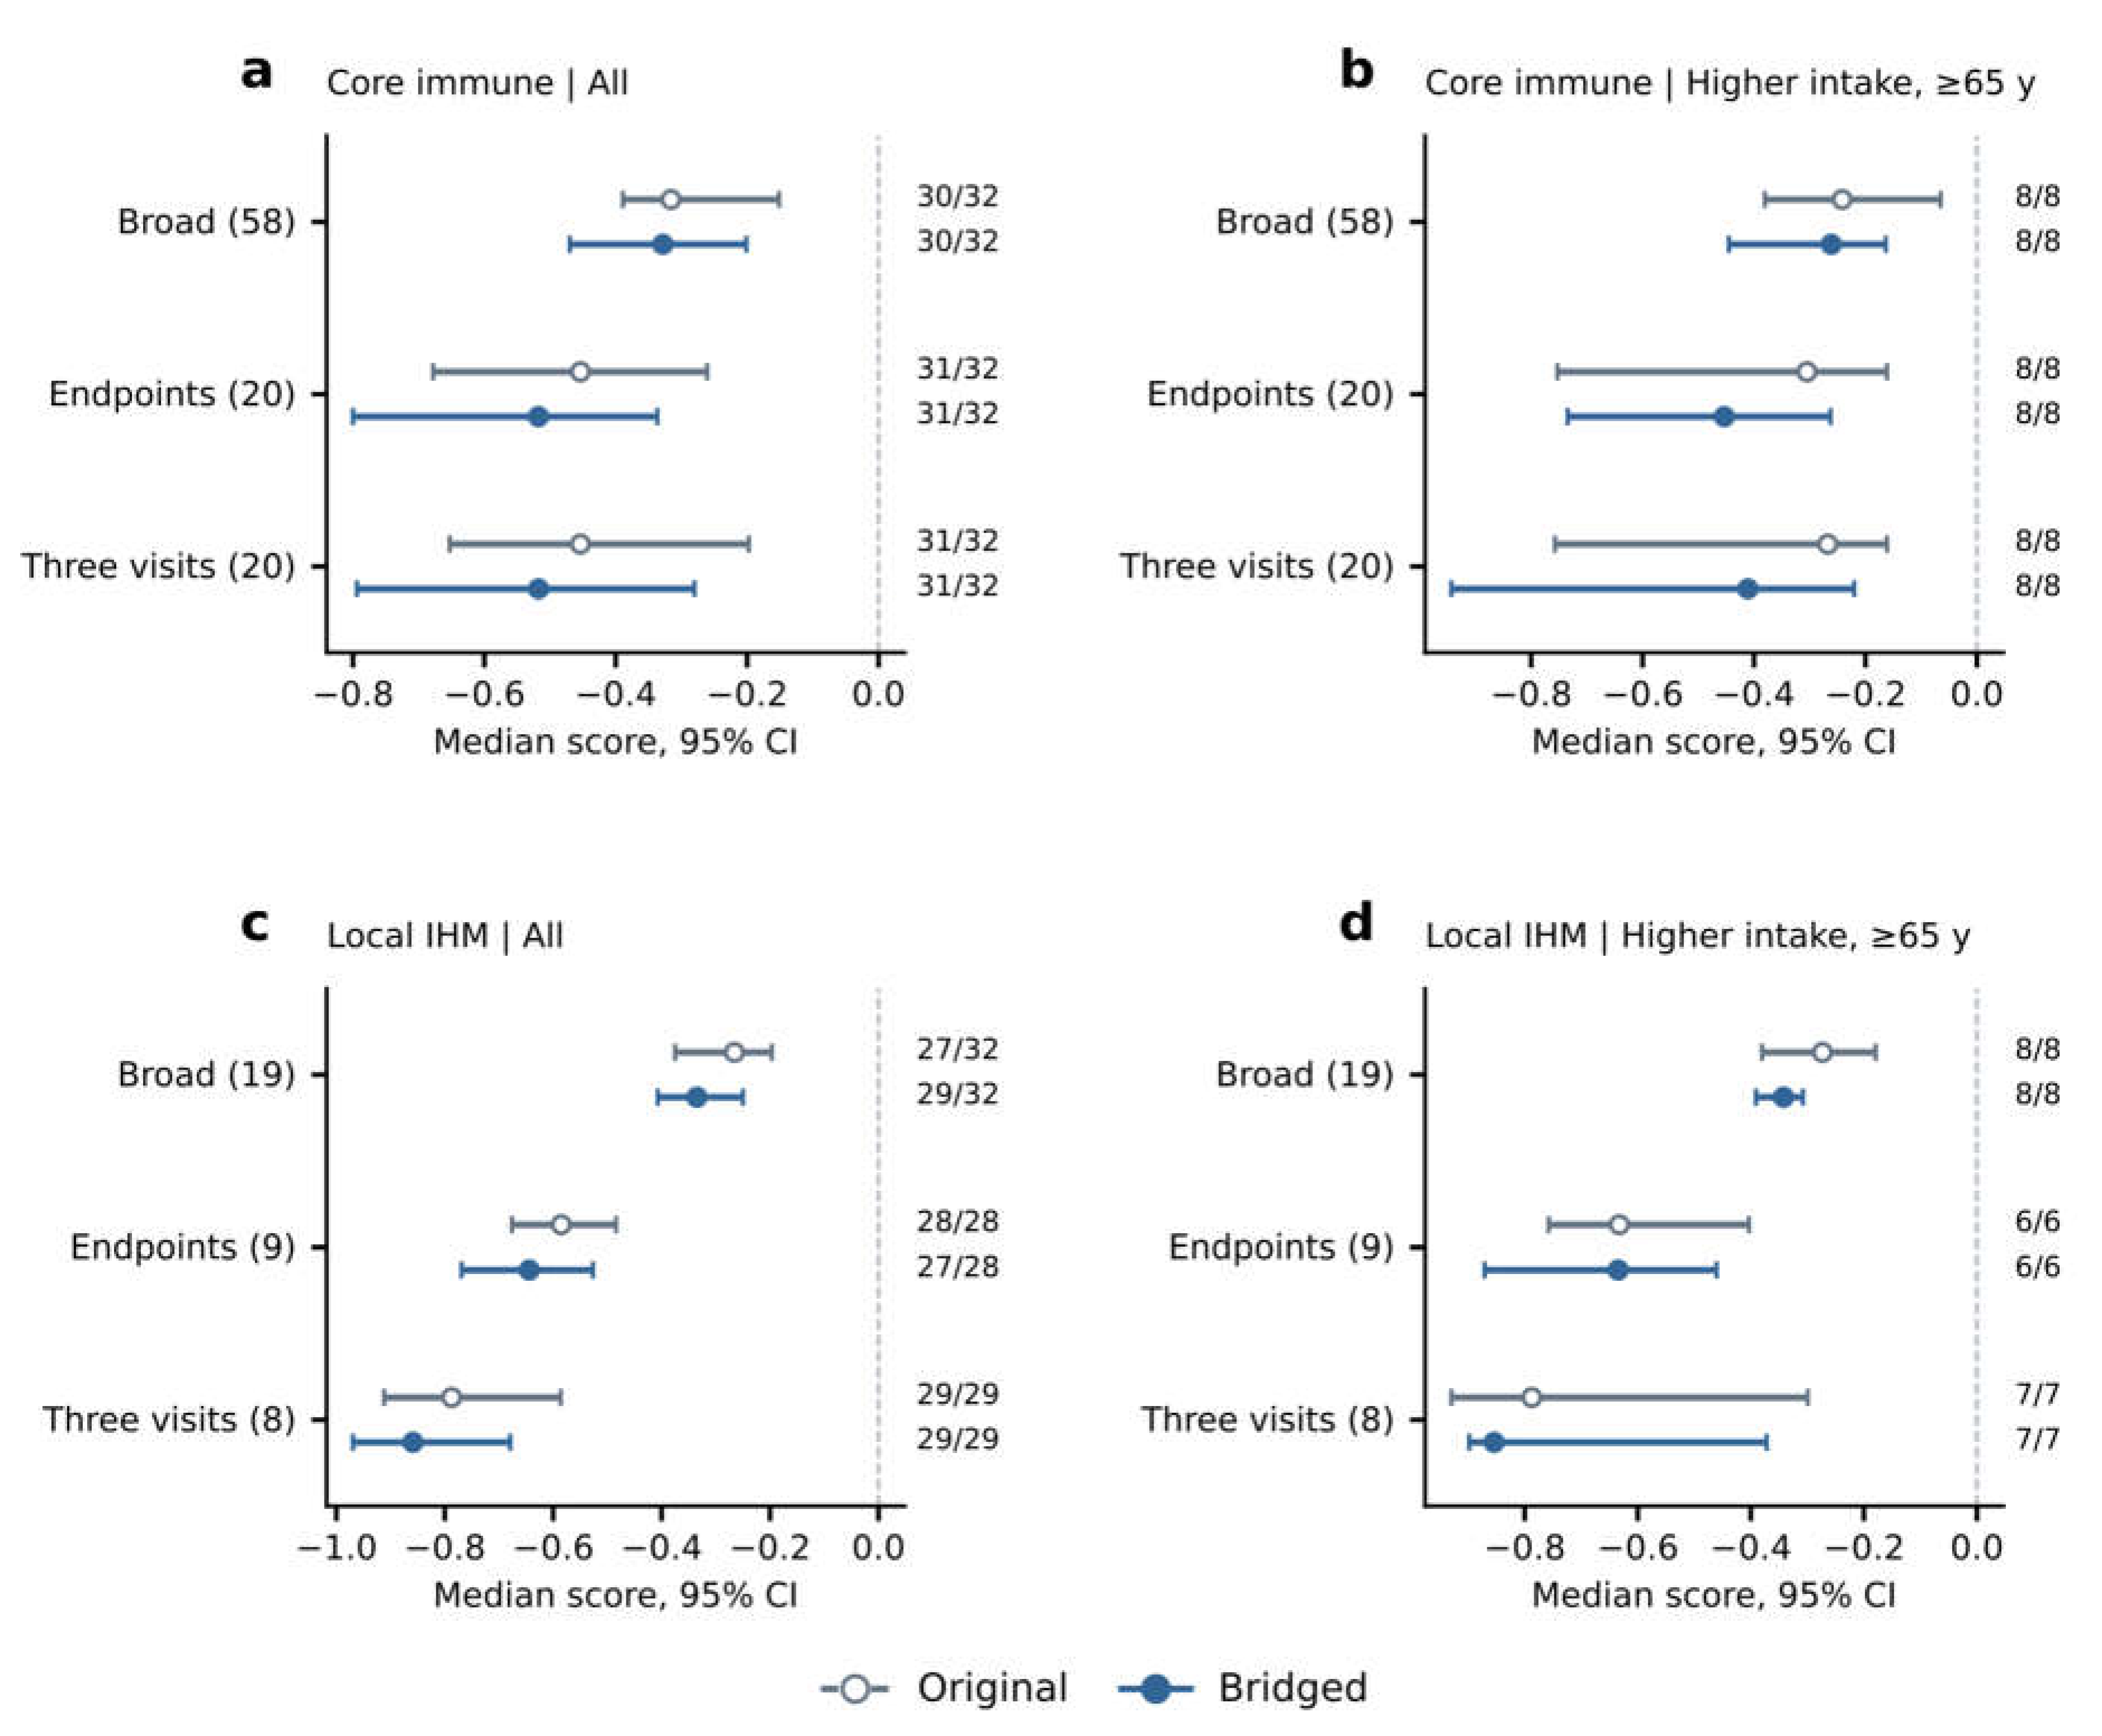
Strict readout filtering was used to assess whether the final-round directions of the immune-related scores depended on low-signal targets. In the bridge-adjusted B3-versus-baseline analysis, retaining only proteins that met strict readout conditions at both endpoints left 20 proteins in the 58-protein core immune age-direction score, with a younger-age-associated direction in 31/32 participants. The 19- protein IHM-associated protein-direction score retained 9 proteins, with a direction associated with beter immune health in 27/28 evaluable participants. Requiring strict readout conditions at all three sampling visits retained 20 and 8 proteins in the two scores, respectively. A younger-age-associated direction was observed in 31/32 evaluable participants for the core immune score, and a direction associated with beter immune health in 29/29 for the IHM-associated protein score (Fig. 5). The corresponding directions were also retained in the subgroup aged ≥65 years within the higher cumulative-intake group under both strict filtering conditions. Counts were 8/8 for the core immune score under each condition and 6/6 and 7/7 for the IHM-associated protein score under the strict- endpoint and strict-three-visit conditions, respectively. Denominators represent the participants evaluable under each condition. Both scores retained predominantly younger- or healthier-associated overall directions under these readout filters.
The 58-protein core immune combination included 49 proteins with positive and 9 with negative age associations. When these two classes were summarized separately, both had median scores in a younger- age-associated direction. Assigning equal weight to the two classes still yielded a younger-age-associated direction in 31/32 participants. The shared direction of this immune protein combination was therefore not determined solely by the imbalance in the number of proteins in the two classes (Supplementary Methods section 4.1).
To assess whether the shared decreases in CCL11 and the two soluble TNF receptors dominated the score results, we compared the corresponding removal conditions. For the 58-protein core immune age- direction score, removing CCL11 alone or sTNFR1 and sTNFR2 together still yielded a younger-age- associated direction in 30/32 participants. For the 19-protein IHM-associated protein-direction score, removing sTNFR1 and sTNFR2 together reduced the number with a direction associated with beter immune health from 29/32 to 23/32. Excluding proteins whose bridging-reference readouts exceeded the upper standard-curve limit reduced the count of participants with a patern associated with beter immune health for the 19-protein IHM-associated protein-direction score from 8/8 to 5/8 in participants aged ≥65 years within the higher cumulative-intake group (Supplementary Fig. S5e–h). When these above-limit targets were further excluded from the IHM-associated protein combination that passed strict readout filtering at all three visits, only three proteins remained and the overall median score shifted to a poorer-health-associated direction (Supplementary Information section 5, “Dependence on key inputs”). The 58-protein core immune age-direction score retained an overall younger-age-associated direction under the CCL11 and TNF-receptor removal conditions described above, whereas the health direction of the IHM-associated protein score was more sensitive to reductions in protein membership and to the population analyzed.
3.4. Comparisons of the Six Main Scores Across Participant Groups

Table 1.
| B3-versus-baseline results for the six main protein-direction scores (bridge-adjusted B3 versus B1). Each row uses different published age associations, age-model weights or IHM protein associations, with potentially overlapping measurement inputs. Denominators are the participants evaluable for each score. Negative values indicate younger-age-associated characteristics for the age-direction scores and characteristics associated with beter immune health for the IHM-associated protein-direction score, rather than clinical benefit. Scores are dimensionless, and the magnitude of change cannot be compared across rows. The two 19-protein combinations represent healthy-population age associations and IHM-related circulating protein features, respectively, and differ in membership and assessment purpose.
| Protein-direction score | Number of proteins | Overall median score |
Participants with negative scores, overall |
Higher cumulative intake |
Lower cumulative intake |
Higher cumulative intake and age ≥65 years |
|---|---|---|---|---|---|---|
| 12-protein combination | 12 | −0.275 | 26/32 | 11/14 | 15/18 | 6/8 |
| 19-protein healthy-population age-associated combination | 19 | −0.277 | 22/31 | 10/14 | 12/17 | 6/8 |
| OrganAge local score | 97 | −0.132 | 24/32 | 11/14 | 13/18 | 6/8 |
| ipfP3GPT local score | 77 | −0.400 | 28/32 | 13/14 | 15/18 | 8/8 |
| 58-protein core immune age- direction score | 58 | −0.328 | 30/32 | 14/14 | 16/18 | 8/8 |
| 19-protein IHM-associated protein-direction score | 19 | −0.335 | 29/32 | 12/14 | 17/18 | 8/8 |
All six main protein-direction scores had favorable final-round medians in both the higher and lower cumulative-intake groups, with a majority of participants showing the corresponding direction within each group. This protein patern was therefore not confined to a single intake regimen. Exploratory between-group comparisons did not identify clear differences by cumulative intake or age stratum after multiple-testing adjustment. This finding does not establish equivalence between groups. The comparisons and population composition are described in Methods section 4 and Supplementary Methods section 4, which also retain the nominal age-stratified signals and their intervals.
4. Protein Changes Across Sampling Time Points
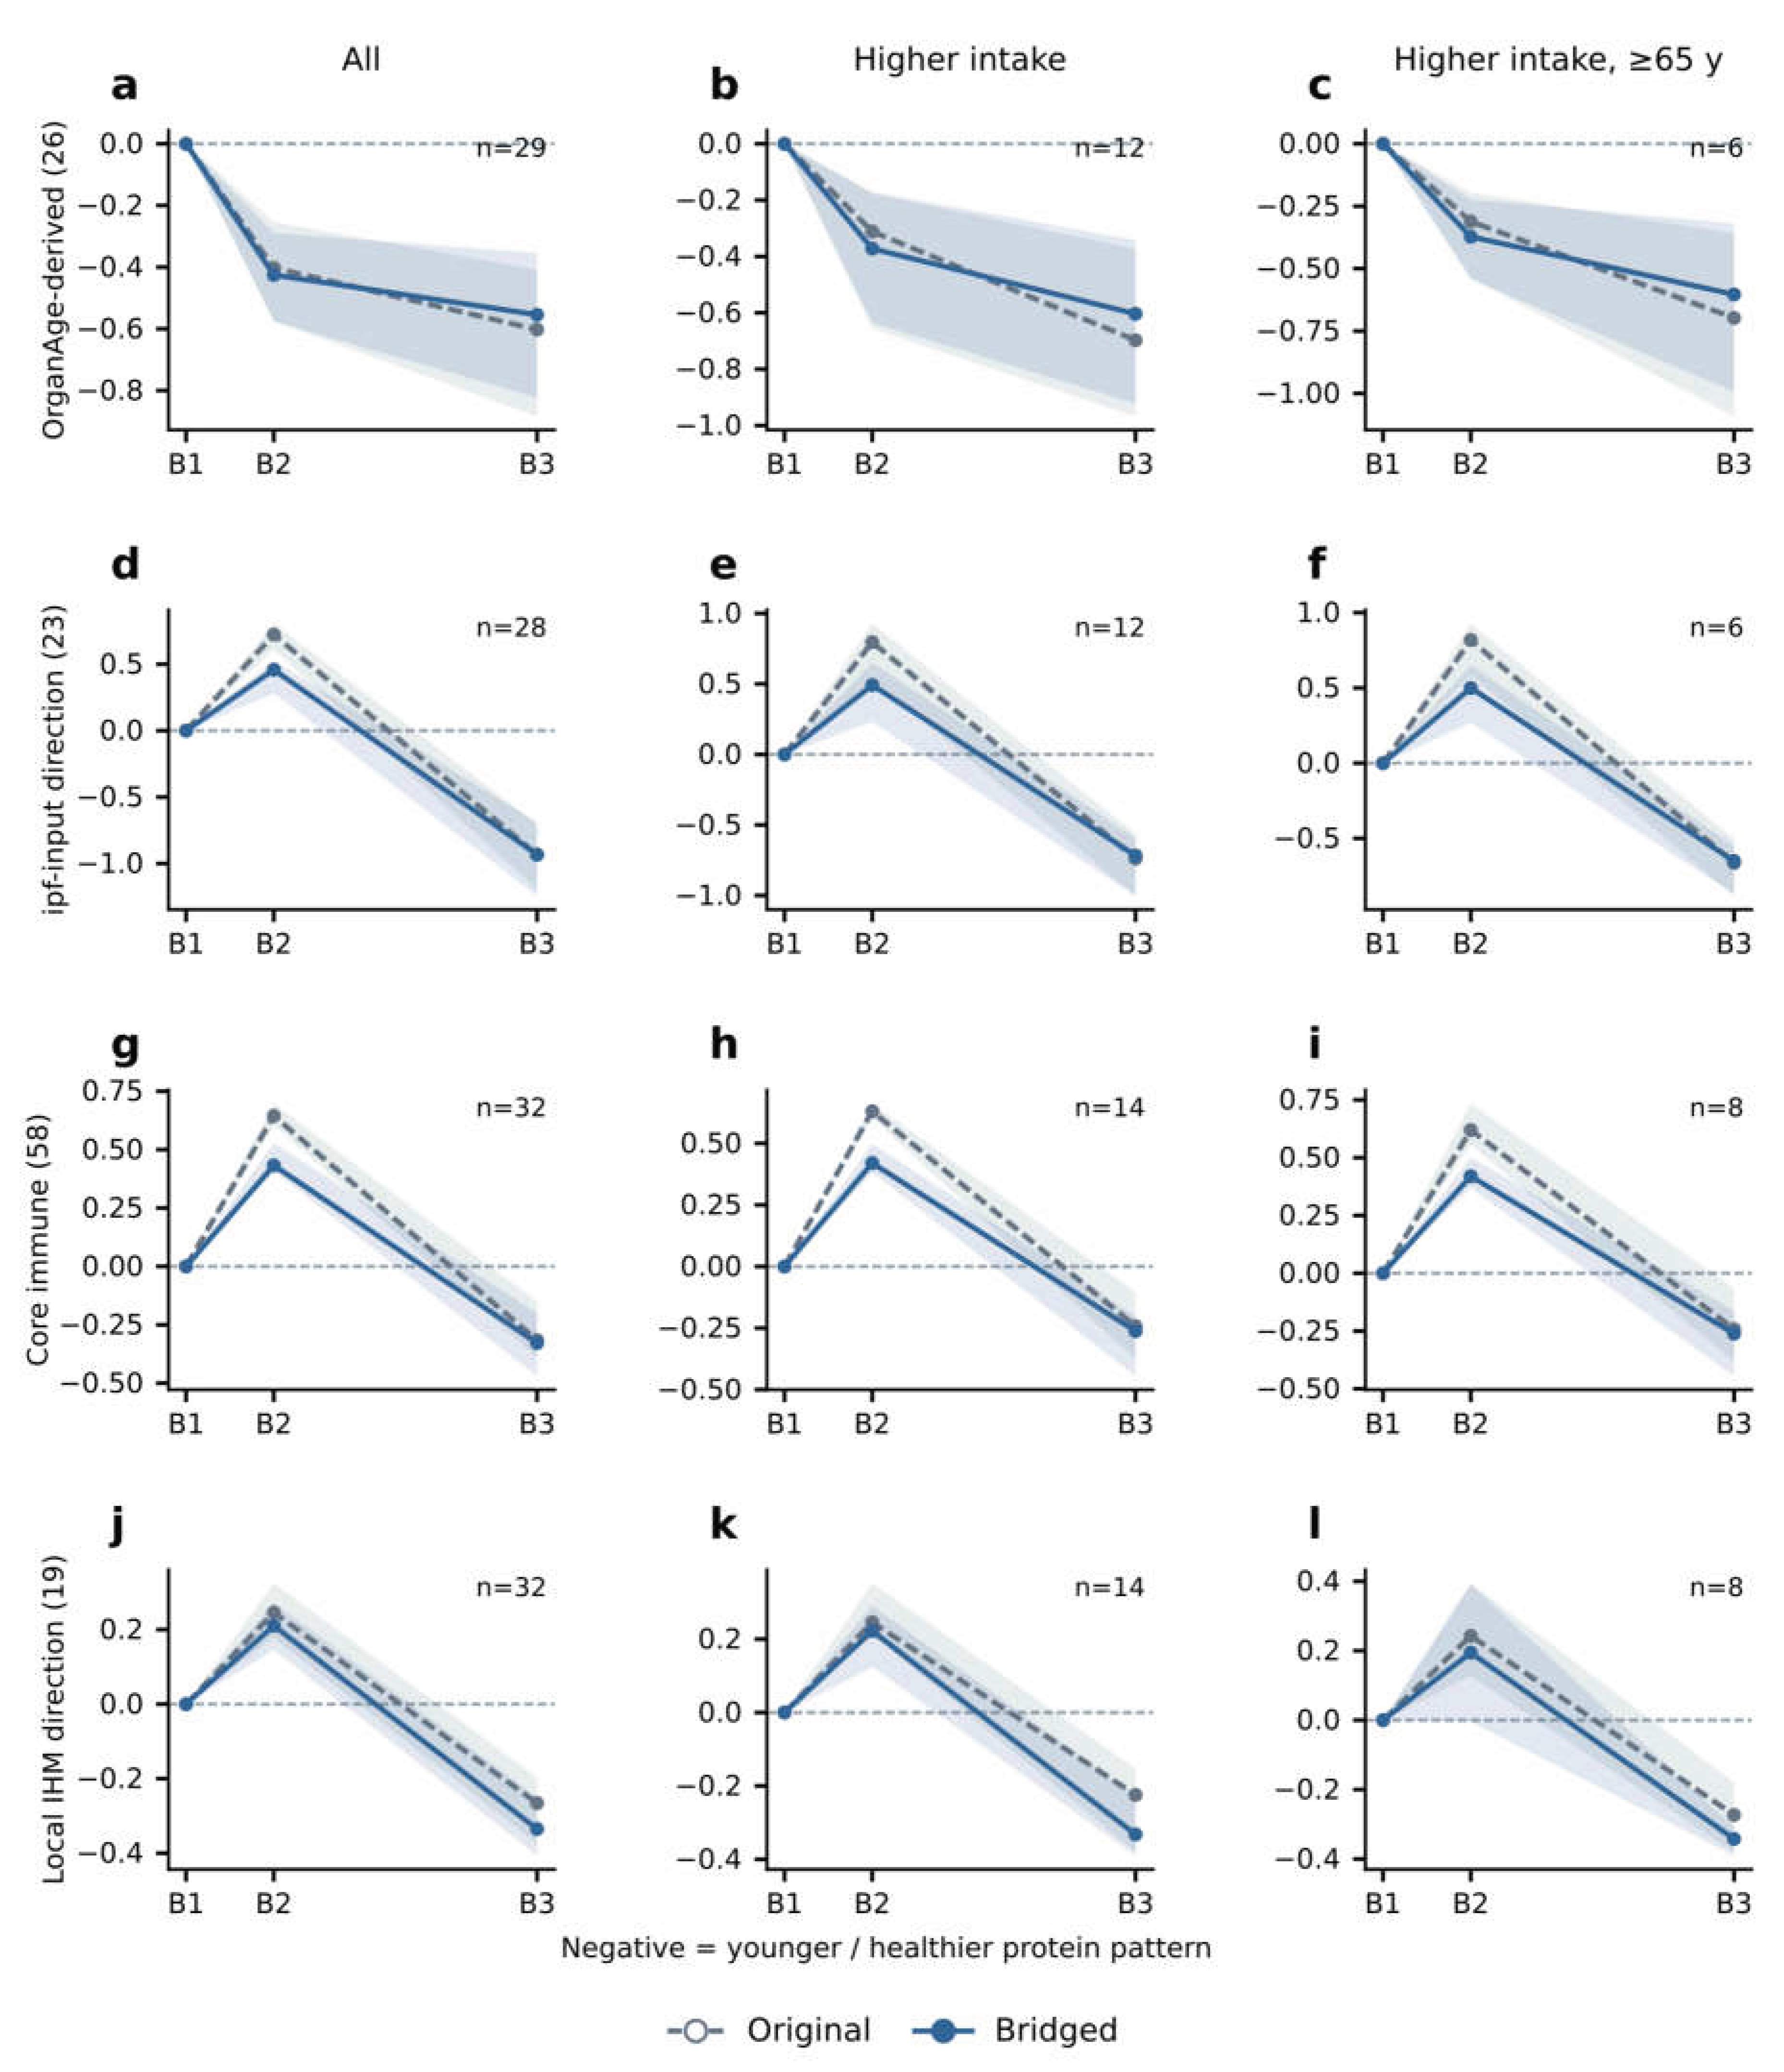
Figure 6 compares changes across the three sampling time points in the 58-protein core immune age- direction score, the 19-protein IHM-associated protein-direction score, the OrganAge local score and the ipfP3GPT local score. For the later two scores, 26 and 23 proteins from the broader local combinations of 97 and 77 proteins, respectively, met strict readout conditions at B1, B2 and B3 and were retained. Assessment methods, full protein membership and analysis conditions are provided in Methods sections 3.2–3.4 and Supplementary Methods sections 3.2–3.5.
In the bridge-adjusted overall analysis, the median 58-protein core immune age-direction score was +0.432 at B2 and _0.328 at B3 (Figure 6g). The corresponding medians for the 19-protein IHM-associated protein-direction score were +0.210 and _0.335 (Figure 6j). Positive B2 and negative B3 scores were observed in 30/32 and 24/32 participants for the two scores, respectively.
This temporal patern in the core immune and IHM-associated protein scores was also observed in the lower cumulative-intake group. B2/B3 medians for the 58- and 19-protein scores were +0.465/_0.395 and +0.197/_0.354, respectively, with positive B2 and negative B3 scores in 16/18 and 14/18 participants. Another 3 participants had negative IHM-associated protein scores at both time points. Within the higher cumulative-intake group, this patern was observed in the subgroup aged ≥65 years. The 6 participants aged <65 years also had positive B2 and negative B3 group medians, at +0.424/_0.338 for the core immune score and +0.239/_0.178 for the IHM-associated protein score. This descriptive temporal patern was therefore not confined to the higher cumulative-intake group or its older subgroup.
Figure 5.
| Robustness of immune scores a,b, Immune age-direction scores. c,d, IHM-associated scores. The left column shows the overall analysis, and the right column shows participants aged ≥65 years within the higher cumulative-intake group. Each panel compares broad- coverage, strict-endpoint and strict-three-visit filtering, with the number of proteins in parentheses. Gray open and blue filled points indicate original and bridged medians, respectively, and error bars indicate 95% confidence intervals. Counts on the right give participants with negative scores/evaluable participants.
In the broad-panel analyses, the median ipfP3GPT local score (77 proteins) changed from +0.323 at B2 to _0.400 at B3. By contrast, the OrganAge local score (97 proteins) had a B2 median close to zero, at _0.022 (95% interval: _0.055 to 0.024), followed by _0.132 at B3, and did not show the same positive-to-negative patern. The unbridged OrganAge local score medians were also negative at both time points. These broad-panel results are distinct from the strict-three-visit subsets of 26 and 23 proteins shown in Figure 6 (Supplementary Information section 6).
These comparisons showed negative overall B3 medians for all the broad-panel scores described here, but their earlier trajectories differed. The core immune, IHM-derived protein and ipfP3GPT local scores had positive B2 and negative B3 group medians, whereas the OrganAge local score was close to zero at B2. These scores covered the B1, B2 and B3 sampling time points. Individual protein follow-up measurements at B4 were not used to calculate them.
Figure 6.
| Score trajectories across three sampling visits a–c, OrganAge local score (26 proteins). d–f, ipfP3GPT local score (23 proteins). g–i, Immune age-direction score. j–l, IHM- associated score. The left, middle and right columns show the overall analysis, the higher cumulative-intake group and its subgroup aged ≥65 years, respectively. B1, B2 and B3 denote sampling at baseline, after the first intake round and after all four rounds, respectively. Gray dashed and blue solid lines denote original and bridged results. Lines show medians relative to B1, and shading indicates 95% confidence intervals. n denotes participants evaluable at all three visits.
Discussion
Immune communication and the circulating environment
Analysis of existing results for more than 100 circulating proteins in plasma from 32 participants revealed two paterns. After all four rounds of supplementation, multiple chemokines and soluble receptors were below baseline, and the six protein-direction scores indicated protein paterns associated with younger age or beter immune health under both cumulative-intake regimens. The two immune- related scores also showed a temporal patern: group medians of the 58-protein core immune age- direction score and the 19-protein IHM-associated protein-direction score were positive after the first round and negative after all four rounds. This group-median patern occurred in both intake groups and in the age subgroups within the higher cumulative-intake group. These findings provide human protein observations relevant to possible immunomodulatory actions of PCC1. Comparing protein-age associations, model weights and IHM-associated protein features helps identify changes supported by different evaluation approaches and reveals dependence on particular proteins or scoring rules. Because these scores share protein inputs, agreement across them does not constitute independent validation.
Remodeling of the immune microenvironment may involve the reorganization of communication between cells. Changes in CCL2, CCL11 and other chemokines concern cell-recruitment signals, whereas soluble TNF receptors reflect the combined influences of receptor release, ligand binding and cellular sources. These readouts are not equivalent to cell counts. At B3, approximately 2 days after the final round ended, increased IL-6, GDF-15 and suPAR readings coexisted with decreases in the chemokine– receptor combination. At subsequent follow-up, group-level IL-6 readings were again close to baseline. These differences in direction and timing show why a single increase or decrease cannot characterize immune state throughout the supplementation period. We propose that the later decline in the chemokine–receptor combination may reflect reduced demand for sustained inflammatory recruitment or reduced secretory activity, rather than a simultaneous decrease in all immune activity. This interpretation links “circulating microenvironment remodeling” to molecular signals that can be followed over time.
PCC1 immunomodulation research and human protein changes
Previous PCC1 experiments provide specific observations on proteins also included in the testing records analyzed here. Liu et al. continuously fed naturally aged mice a PCC1-containing diet for 4 months and found reductions in plasma IL-6, IL-1β and TNF-α by ELISA. In an oxidative-stress model using human lens epithelial cells, Ni et al. found lower MCP-1 and IL-17A protein levels in culture supernatants after PCC1 treatment [8,13]. MCP-1 and CCL2 denote the same protein, allowing a direct comparison with the overall CCL2 decline in this cohort. The IL-1β observations in the present cohort were limited by low signals and provide only exploratory directional concordance. In contrast to the mouse plasma findings, IL-6 tended to increase in both array and targeted assays at B3, approximately 2 days after the final round ended. At follow-up approximately 16 days after the final round, group-level IL-6 readings were close to baseline. Comparisons across studies therefore need to consider both intake schedules and sampling intervals. Comparisons with cellular and tissue RNA heatmaps from previous PCC1 studies showed directional agreement for only some corresponding targets in this cohort. For other targets, directions were opposite or depended on batch adjustment [5,10] (Supplementary Information, “Literature heatmaps and circulating readouts”). Differences in species, tissue compartments, stress conditions and administration schedules may contribute to these discrepancies. Tracking CCL2, which showed concordant directions, alongside IL-6, which differed in direction, could help distinguish shared regulatory processes from responses that depend on the experimental context.
The changes in immune chemokines and soluble receptors observed here provide clues that PCC1 may modulate responses across several immune-cell populations, broadly consistent with previous cell and animal studies. For example, the 2008 review by Holderness et al. included experiments with purified PCC1 in human peripheral blood cell cultures, reporting γδ T-cell priming and CD69 responses in Vδ1 cells, and also mentioned CD69 responses in NK and B cells [26]. At the hematopoietic level, Liu et al. observed partial restoration of B-cell and hematopoietic stem/progenitor-associated cell proportions, together with changes in inflammatory states, after PCC1 treatment in aged mice [6]. Neutrophils also warrant atention. In this study, we observed a downward trend in NGAL levels following oral treatment, which we tentatively atributed to neutrophil-related rather than renal factors. In aged mice, Duan et al. observed PCC1-associated changes involving γδ17 cells and neutrophils, together with a lower lung metastatic burden. Separate cell-depletion experiments supported a role for neutrophils in CD8 T-cell regulation [7]. In an experimental system of breast cancer brain metastasis, Liu et al. found that neutrophil-secreted LCN2, also known as NGAL, contributed to sphere formation by metastatic tumor cells [27]. These connections provide directions for investigating potential applications of PCC1 in modulating immune-cell-associated secretory signals and the tumor microenvironment.
Temporal responses and mechanistic clues
Previous PCC1 studies have addressed both senescent-cell clearance and modulation of the senescence- associated secretory phenotype, corresponding to senolytic and senomorphic activities [5,6]. The immune-related circulating protein changes observed after the first supplementation round raise a specific question: could immune modulation participate early in PCC1-associated control of senescent cells? Immune-cell transplantation and uPAR-targeted CAR T-cell studies in mice have shown that altering immune state or enhancing specific cellular clearance capacities can affect tissue senescence burden [1,28]. PCC1 animal studies have also examined both immune-cell states and senescent-cell- related processes [6,7]. These experiments provide biological grounds for this question. The human temporal observations in the present study direct atention to immune-related protein changes after oral intake of a PCC1-containing supplement and their possible relationship to senescent-cell control.
The 58-protein core immune age-direction score and the 19-protein IHM-associated protein-direction score increased at B2 and declined at B3. This patern highlights the need to interpret protein features in relation to sampling time. An increased score at one visit does not imply sustained immune activation or accelerated aging throughout supplementation. In LPS-stimulated macrophages, PCC1 has reduced inflammatory output, including TNF-α and IL-6. A separate cell study reported NF-κB/MAPK activation and increased cytokines under different culture conditions [14,15]. These context-dependent findings offer a possible explanation for differences between early secretory responses and subsequent regulation. B3 occurred approximately 2 days after the final round ended, and the above-baseline IL-6, GDF-15 and suPAR readings should be interpreted within that window. The subsequent decline in IL-6 at B4 shows that later states can differ. The discrete sampling schedule did not establish when these changes began. The observations therefore raise questions about timing without establishing the causal sequence between immune modulation and senescent-cell changes.
Previous studies of PCC1 in immune cells and inflammatory responses, together with the circulating- protein findings of this study, suggest that modulation of immune state and the circulating microenvironment may be an important component of PCC1’s activity [6,7,14,15,26]. Compared with earlier research on unencapsulated grape seed extract under comparable PCC1 intake and observation conditions, the delivery-enhanced formulation used here was associated with more pronounced changes in circulating immune-related proteins (nonconcurrent comparison, unpublished data). This observation provides a basis for further investigation of how formulation and delivery affect PCC1-associated responses in humans. We also collected separate, unpublished records on peripheral blood immune-cell
composition in older participants, plasma acidic β-gal activity-related readouts and sleep. These complementary observations are preliminary but broadly consistent with the protein directions associated with younger age and beter immune health reported here. The decline in the plasma acidic β- gal signal also offers an additional clue for investigating possible links between PCC1 and senescence- related processes. Together, these observations support further investigation of PCC1’s immunomodulatory potential in humans. Prospective human studies with appropriate group allocation and synchronized sampling will be used to identify which immune cells and functions show corresponding changes.
Study limitations and further validation
This study used existing records from a nonrandomized exploratory human study to track circulating protein changes after participants took a PCC1-containing supplement under different regimens. The available records do not support firm conclusions about differences in protein-change paterns between intake groups or between sexes. Future prospective studies should expand participant recruitment and use appropriate group allocation. The human observations highlight protein signals related to immune modulation and cell recruitment, but it remains unclear whether these changes precede changes in senescent cells, follow senescent-cell clearance or occur in parallel. Future studies should use appropriately timed sampling and concurrent assessment of immune-cell function, relevant circulating proteins and senescent-cell burden using multiple markers to distinguish their temporal relationships and possible mechanisms.
Conclusion
Using multiple protein-age and immune-health assessments, we identified later shifts toward protein paterns associated with younger age and beter immune health in longitudinal records from participants taking a PCC1-containing supplement. These paterns occurred under both cumulative-intake regimens, while immune-related protein states differed after the first and final rounds. The immune-related protein responses detected after the first round provide longitudinal human clues to a possible role for immune modulation in PCC1-associated senescent-cell control. These findings suggest that modulation of immune state and circulating protein signals may be an important component of PCC1’s potential geroprotective activity in humans. Whether immune modulation precedes or mediates changes in senescent-cell burden requires further validation. The protein signals identified here can inform subsequent assessment of PCC1’s effects on human immune function and senescent-cell burden and the selection of relevant clinical endpoints. They also support further investigation of potential applications in immune modulation in older adults, chemotherapy-related interventions and relevant chronic diseases.
1. Study Records and Intake Regimens
We retrospectively analyzed existing longitudinal records from a nonrandomized exploratory human study of the oral PCC1-containing supplement LB-150. The original study used different intake schedules, and some participants withdrew during the study. The usable protein measurement records ultimately obtained covered 32 participants, with a recorded median age of 62 years (range, 46–78 years). Participants were classified by recorded cumulative intake into higher (n=14) and lower (n=18) cumulative-intake groups. Both groups received 60 mg of PCC1 on each intake day and differed in the number of intake days. Detailed schedules and cumulative intakes calculated from these schedules are provided in the Supplementary Methods. The main older subgroup comprised the 8 participants aged ≥65 years in the higher cumulative-intake group. The 6 participants aged <65 years within that group served as the age comparator. Results for all 11 participants aged ≥65 years and 21 aged <65 years were also described separately. The original study did not randomly assign intake regimens and had no concurrent non-supplementation or placebo control group. Participant characteristics, analysis eligibility criteria and the numbers available for pairing for each measurement are provided in the Supplementary Methods.
The three sampling visits used in the main protein analyses were the pre-supplementation baseline (B1), the second sampling visit after the first intake round (B2, approximately 12 days after B1), and the final assessment after four intake rounds (B3, approximately 48 days after B1, 46 days after the first intake and 2 days after the final round ended). The overall supplementation programme was still ongoing at B2, but the blood-sampling day was not a recorded intake day. The B2 measurements describe protein states within that sampling window. Hereafter, the pre-to-post supplementation comparison denotes B3 versus B1, whereas the three-visit trajectories compare B2 and B3 separately with the same B1 baseline. A separate post-discontinuation follow-up (B4) occurred approximately 16 days after the final round ended. No further study supplement was taken between B3 and B4. The limited targeted measurements available at later follow-up were used to describe subsequent changes and were not included in the six main protein-direction scores. Intake and sampling schedules are shown in Supplementary Figure S1, and the stage definitions and intervals are given in Supplementary Methods section 1.
2. Protein Measurement Records and Processing of Between-Batch Differences
We collected existing results for more than 100 circulating protein analytes in plasma from third-party laboratories. Detailed assay methods are provided in the electronic supplementary information (ESI). The records included RayBio protein array results (QAH-CAA-2000) and Hotgen targeted assays of selected individual protein analytes. The IL-6 and IL-8 targeted measurements used chemiluminescence immunoassays (CLIA). Records of suPAR readings from a local laboratory were also collected. Only one measurement source was selected for each protein within a protein combination. IL-1β comparisons across the first three visits used array data.
The initial measurement record for each blood-sampling window was used, retaining original optical values, background, four replicate spots, net signals and quality flags. Technical remeasurements were not treated as independent visits. For the main analysis, reference samples measured across batches were used to estimate protein-specific multiplicative adjustment factors for differences in array readings between batches. This adjustment is referred to as bridging. Unbridged results were used for sensitivity comparisons, and measurements not subject to array bridging retained their own scales. Background- containing optical values were handled separately from reported concentrations. No zero imputation was used, and zero or missing values were excluded from log-ratio calculations. Strict readout criteria for the endpoint and three-visit analyses are specified in Supplementary Methods section 2, “Readout conditions and batch bridging.”
3. Age and Immune-Health Directional Scores
3.1. Selection of Age-Associated Proteins and Construction of Protein Combinations
Protein–age association directions were taken from published studies and applied consistently to changes in this cohort. Neither protein selection nor the assigned age-association directions depended on favorable post-intake results in this cohort. The 12-protein combination included proteins with significant age associations in both the chronic-disease-adjusted analysis by Tanaka et al. and the study by Lehallier et al., with concordant association directions [18,19]. The 19-protein healthy-population age- associated combination, referred to as the 19-protein combination in this subsection, used the individual protein–age associations reported for healthy participants in the study by Oh et al. [20]. Both combinations required unambiguous matching to the measured analytes in the collected records and satisfaction of the readout criteria in at least 80% of the 32 participants at each sampling visit. The combinations were constructed retrospectively using these criteria.
Let d(j) denote the direction of the association between protein j and age reported in the studies by Tanaka, Lehallier and Oh et al. [18,19,20], with +1 for a positive association and −1 for a negative association. For each participant, the change in each protein relative to that participant’s baseline was first calculated as log2[X(t)/X(B1)] and multiplied by d(j). The median of these signed changes across the combination was then used as the individual score to reduce the influence of a large change in any one protein. Under this coding, decreases in age-increasing proteins and increases in age-decreasing proteins both yield negative scores, indicating younger-age-associated directions. Positive scores indicate older- age-associated directions. Each participant’s score used a fixed set of proteins with positive readings within the comparison window, without zero imputation. This method summarizes how protein changes correspond to published age associations. It does not convert cross-sectional associations into changes in an individual’s age or inherit the age-prediction errors or clinical validity of the source studies. Members, literature sources and selection criteria are provided in Supplementary Methods sections 3.1–3.2.
3.2. OrganAge Local Score
The OrganAge local score constructed in this study used 97 proteins and coefficients β from the first fold of Goeminne’s first-generation whole-proteome age model, together with public Olink NPX standard deviations σ [21]. Following the original authors’ approach to non-Olink data, local readings were log2- transformed. The scale s was the sample standard deviation of each protein’s log2-transformed positive baseline readings, estimated from at least 24 participants and required to satisfy s>10−10 . The same definition was used for the ipfP3GPT, core immune and IHM-associated scores below. This same scale was retained at subsequent visits to calculate standardized changes relative to baseline, z=log2[X(t)/X(B1)]/s. With w=βσ, the score was Σwz/Σ |w |, with the denominator restricted to the participant’s fixed valid members. Fixed centering terms and the intercept cancel in paired differences. Division by the sum of absolute weights was a normalization introduced here for dimensionless comparisons. The 97 nominal inputs covered 4.771% of the absolute standardized weight of the original 2,315 nonzero inputs. Each participant also had to meet a threshold of at least 80% of the retained local panel’s absolute weight. This coverage proportion does not indicate predictive accuracy. The original coefficients, both standard deviations, missing-data handling and paired-difference derivation are described in Supplementary Methods section 3.3.
3.3. ipfP3GPT Local Score
The ipfP3GPT local score constructed in this study used 77 proteins. Only the ipfP3GPT input list was used to define the candidate protein scope [22]. Age-association directions for individual proteins were obtained from published single-protein analyses [18,19,20,24,25]. For each protein, z was calculated using the fixed baseline scale described in Methods section 3.2 and multiplied by its published age-association sign. The resulting signed changes were then averaged with equal weights. The original neural network was not run, and its model weights were not used. Participants were evaluable if they covered at least 80% of the retained panel members. Integration of the age-association directions and the sources of the 73 proteins plus 4 supplementary measurements are described in Supplementary Methods section 3.4.
3.4. Core Immune Age-Direction and IHM-Associated Protein-Direction Scores
For the 58-protein core immune age-direction score, d(j) was obtained from Goeminne et al.’s public single-protein age associations. For the 19-protein IHM-associated protein-direction score, h(j) denoted the health-association sign in the published IHM-associated circulating protein signature from Sparks et al. [21,23]. The function used to calculate the original IHM-associated protein signature supports selection of measurable members, protein-wise standardization and aggregation according to health- association directions. Here, each protein’s baseline variability was used as a fixed scale for within- person longitudinal comparisons. The 58-protein core immune age-direction score used d(j)z, and the 19- protein IHM-associated protein-direction score used _h(j)z, so that negative values indicated directions associated with younger age and beter immune health, respectively. For both scores, each signed contribution was capped at ±2 before equal-weight averaging. Capping reduced the influence of extreme individual contributions and was not part of the original IHM classifier. The scale s, defined in Methods section 3.2, was held fixed across visits, subgroups and both unbridged and bridged analyses. The resulting 19-protein score describes longitudinal changes in IHM-associated protein characteristics, rather than the immune-health probability output by the original IHM model. Full formulas, molecular matching, local coverage and the scope of interpretation are specified in Supplementary Methods sections 3.2 and 3.5.
In the three-visit trajectory analysis, B2 and B3 were each compared with the same participant’s B1 baseline. The baseline scale, published association directions and model weights remained fixed across visits, and the B1 score was zero by definition. Individual scores were calculated first, followed by group medians and counts by direction. Negative scores indicated protein characteristics associated with younger age or beter immune health, as applicable, and positive scores indicated the opposite directions.
The use of multiple protein-based age-assessment approaches to examine intervention data has also been described in published research [29]. The six main protein-direction scores in this study summarize age- or health-association directions, or local weighted changes based on model-derived coefficients. They were not converted into age in years. The scores share some proteins and participants and cannot be treated as independent validations.
4. Statistical Analyses
Individual protein changes were reported as median paired log2 ratios, counts by direction and participant-resampled 95% intervals. Scores were reported as the corresponding individual results, group medians and intervals. These were descriptive pointwise intervals, without adjustment for the number of proteins examined, and were not used as proteome-wide significance tests. Resampling was performed at the participant level, with bridging parameters held fixed. Sensitivity to signal filtering, individual protein contributions and technical conditions was examined separately. The intervals do not include uncertainty in cross-platform conversion or estimation of bridging parameters.
To compare the magnitude of changes between participant groups, we retained the six main protein- direction scores defined above and used bridged B3-versus-B1 individual scores for two exploratory comparisons: higher versus lower cumulative intake, and age ≥65 versus <65 years within the higher cumulative-intake group. The effect estimate was the difference between group medians. The 95% intervals were estimated from 50,000 participant-level resamples drawn independently within each group. Two-sided permutation tests of group labels used the absolute difference between group medians. All 3,003 possible allocations were enumerated for the age comparison, and 99,999 random permutations were used for the cumulative-intake comparison. The 12 tests formed by six scores and two comparisons were jointly adjusted using the Benjamini–Hochberg procedure. The 12 unbridged comparisons formed a separate sensitivity-analysis family. These were post hoc exploratory analyses of group associations and cannot remove confounding from nonrandom group allocation. Age-stratified results across all participants were described separately in the supplementary section “Statistical comparisons and robustness analyses.”
Author Contributions
Qun Wang wrote the initial English draft. Jie Li checked the data. Di Zhang contributed to data correction and scientific discussion. Evan Wing-Yip Wan contributed primarily to AI-assisted data processing and organization. Qinghua Lyu designed the study. All authors participated in repeated discussions and in revising and refining the manuscript.
Ethics and informed consent
This study retrospectively analysed existing assay records from the Clinical Laboratory of Xianghe Hospital. No additional sampling, invasive procedures or other interventions were undertaken for this analysis. Under the institution’s policies, separate ethics approval was not required for this analysis. Participants provided informed consent for the specified uses of their data.
Acknowledgments
The authors acknowledge the assistance and suggestions provided by ChatGPT (GPT-6 Astra, OpenAI) in editing the language of this manuscript, refining academic expression, and improving figure clarity, layout and labeling.
Competing interests
Qun Wang, Evan Wing-Yip Wan and Qinghua Lyu are affiliated with Lonvi, Inc. Jie Li and Di Zhang are affiliated with Lonvi Biosciences (Shenzhen) Co., Ltd. Generative AI use and author responsibility During preparation of this manuscript, the authors used ChatGPT (GPT-6 Astra, OpenAI) to assist with editing and refining the language of this manuscript, manuscript organization, and the development and checking of analysis and ploting code. The tool was also used to obtain suggestions for improving figure clarity, layout and labeling. Statistical calculations were performed on existing assay records using the workflows described in the manuscript. Research data figures were ploted from the corresponding numerical results. The authors declare that AI was not used to fabricate research data or invent research findings. All scientific judgments, interpretation of the results and final manuscript approval remained the authors’ responsibility. The authors take final responsibility for the accuracy, completeness and scientific integrity of the manuscript.
Supporting information and code availability
Selected computational analyses are presented in the Supplementary Information. The associated code generated during AI-assisted analyses is available from the authors upon reasonable request.
References
- Yousefzadeh, M.J.; et al. An aged immune system drives senescence and ageing of solid organs. Nature 2021, 594, 100–105. [Google Scholar] [CrossRef] [PubMed]
- Ross, J.B.; et al. Depleting myeloid-biased haematopoietic stem cells rejuvenates aged immunity. Nature 2024, 628, 162–170. [Google Scholar] [CrossRef] [PubMed]
- Sayed, N.; et al. An inflammatory aging clock (iAge) based on deep learning tracks multimorbidity, immunosenescence, frailty and cardiovascular aging. Nat. Aging 2021. [Google Scholar] [CrossRef] [PubMed]
- Oh, H.S.; et al. Plasma proteomics links brain and immune system aging with healthspan and longevity. Nat. Med. 2025. [Google Scholar] [CrossRef] [PubMed]
- Xu, Q.; et al. The flavonoid procyanidin C1 has senotherapeutic activity and increases lifespan in mice. Nat. Metab. 2021, 3, 1706–1726. [Google Scholar] [CrossRef] [PubMed]
- Liu, X.; et al. Single-cell profiling unveils a geroprotective role of Procyanidin C1 in hematopoietic immune system via senolytic and senomorphic effects. npj Aging 2025, 11, 31. [Google Scholar] [CrossRef] [PubMed]
- Duan, R.; et al. Aging-induced immune microenvironment remodeling fosters melanoma in male mice via γδ17- Neutrophil-CD8 axis. Nat. Commun. 2024. [Google Scholar] [CrossRef] [PubMed]
- Liu, Y.; et al. Senolytic and senomorphic agent procyanidin C1 alleviates structural and functional decline in the aged retina. Proc. Natl. Acad. Sci. 2024. [Google Scholar] [CrossRef] [PubMed]
- Shao, M.; et al. Procyanidin C1 inhibits bleomycin-induced pulmonary fibrosis in mice by selective clearance of senescent myofibroblasts. FASEB J. 2024. [Google Scholar] [CrossRef] [PubMed]
- Gan, Y.; et al. Senolytic procyanidin C1 alleviates renal fibrosis by promoting apoptosis of senescent renal tubular epithelial cells. FASEB J. 2025. [Google Scholar] [CrossRef] [PubMed]
- Wang, J.H.; et al. Procyanidin C1 ameliorates aging-related skin fibrosis through targeting EGFR to inhibit TGFβ/SMAD pathway. Phytomedicine 2025. [Google Scholar] [CrossRef] [PubMed]
- Li, M.; et al. Procyanidin C1 from hawthorn modulates metabolic-inflammatory axis to combat vascular senescence in atherosclerosis. Food Res. Int. 2026. [Google Scholar] [CrossRef] [PubMed]
- Ni, Y.; et al. Senescence-Driven IL-17A Inflammatory Circuit Promotes Epithelial–Mesenchymal Transition (EMT) and Progression in Age-Related Posterior Subcapsular Cataracts. Aging Cell 2026. [Google Scholar] [CrossRef] [PubMed]
- Byun, E.B.; et al. The procyanidin trimer C1 inhibits LPS-induced MAPK and NF-κB signaling through TLR4 in macrophages. Int. Immunopharmacol. 2013. [Google Scholar] [CrossRef] [PubMed]
- Sung, N.Y.; et al. The procyanidin trimer C1 induces macrophage activation via NF-κB and MAPK pathways, leading to Th1 polarization in murine splenocytes. Eur. J. Pharmacol. 2013. [Google Scholar] [CrossRef] [PubMed]
- Wang, X.; et al. Procyanidin C1 Modulates the Microbiome to Increase FOXO1 Signaling and Valeric Acid Levels to Protect the Mucosal Barrier in Inflammatory Bowel Disease. Engineering 2024. [Google Scholar] [CrossRef]
- ClinicalTrials.gov. NCT06641869; Study of PCC1 for Skin Rejuvenation. Registry record; no posted results were found as checked on 14 October 2026.
- Tanaka, T.; et al. Plasma proteomic biomarker signature of age predicts health and life span. eLife 2020, 9, e61073. [Google Scholar] [CrossRef] [PubMed]
- Lehallier, B.; et al. Undulating changes in human plasma proteome profiles across the lifespan. Nat. Med. 2019, 25, 1843–1850. [Google Scholar] [CrossRef] [PubMed]
- Oh, H.S.; et al. Organ aging signatures in the plasma proteome track health and disease. Nature 2023, 624, 164–172. [Google Scholar] [CrossRef] [PubMed]
- Goeminne, L.J.E.; et al. Plasma protein-based organ-specific aging and mortality models unveil diseases as accelerated aging of organismal systems. Cell Metab. 2025, 37, 205–222.e6, (online 2024). [Google Scholar] [CrossRef] [PubMed]
- Galkin, F.; et al. AI-driven toolset for IPF and aging research associates lung fibrosis with accelerated aging. Aging 2025, 17, 1999–2014. [Google Scholar] [CrossRef] [PubMed]
- Sparks, R.; et al. A unified metric of human immune health. Nat. Med. 2024, 30, 2461–2472. [Google Scholar] [CrossRef] [PubMed]
- Tanaka, T.; et al. Plasma proteomic signature of age in healthy humans. Aging Cell 2018. [Google Scholar] [CrossRef] [PubMed]
- Lehallier, B.; et al. Data mining of human plasma proteins generates a multitude of highly predictive aging clocks that reflect different aspects of aging. Aging Cell 2020. [Google Scholar] [CrossRef] [PubMed]
- Holderness, J.; et al. Response of γδ T Cells to Plant-Derived Tannins. Crit. Rev. Immunol. 2008, 28, 377–402. [Google Scholar] [CrossRef] [PubMed]
- Liu, Y.; et al. c-Met Mediated Cytokine Network Promotes Brain Metastasis of Breast Cancer by Remodeling Neutrophil Activities. Cancers 2023, 15, 2626. [Google Scholar] [CrossRef] [PubMed]
- Amor, C.; et al. Prophylactic and long-lasting efficacy of senolytic CAR T cells against age-related metabolic dysfunction. Nat. Aging 2024, 4, 336–349. [Google Scholar] [CrossRef] [PubMed]
- Zhavoronkov, A.; et al. Integration of proteomic aging clocks in a phase 2a clinical trial supports simultaneous geroprotective assessment. Nat. Biotechnol. 2026. [Google Scholar] [CrossRef] [PubMed]
Disclaimer/Publisher’s Note: The statements, opinions and data contained in all publications are solely those of the individual author(s) and contributor(s) and not of MDPI and/or the editor(s). MDPI and/or the editor(s) disclaim responsibility for any injury to people or property resulting from any ideas, methods, instructions or products referred to in the content. |
© 2026 by the authors. Licensee MDPI, Basel, Switzerland. This article is an open access article distributed under the terms and conditions of the Creative Commons Attribution (CC BY) license (http://creativecommons.org/licenses/by/4.0/).
Copyright: This open access article is published under a Creative Commons CC BY 4.0 license, which permit the free download, distribution, and reuse, provided that the author and preprint are cited in any reuse.