

Submitted:
17 October 2026
Posted:
19 October 2026
You are already at the latest version
Abstract
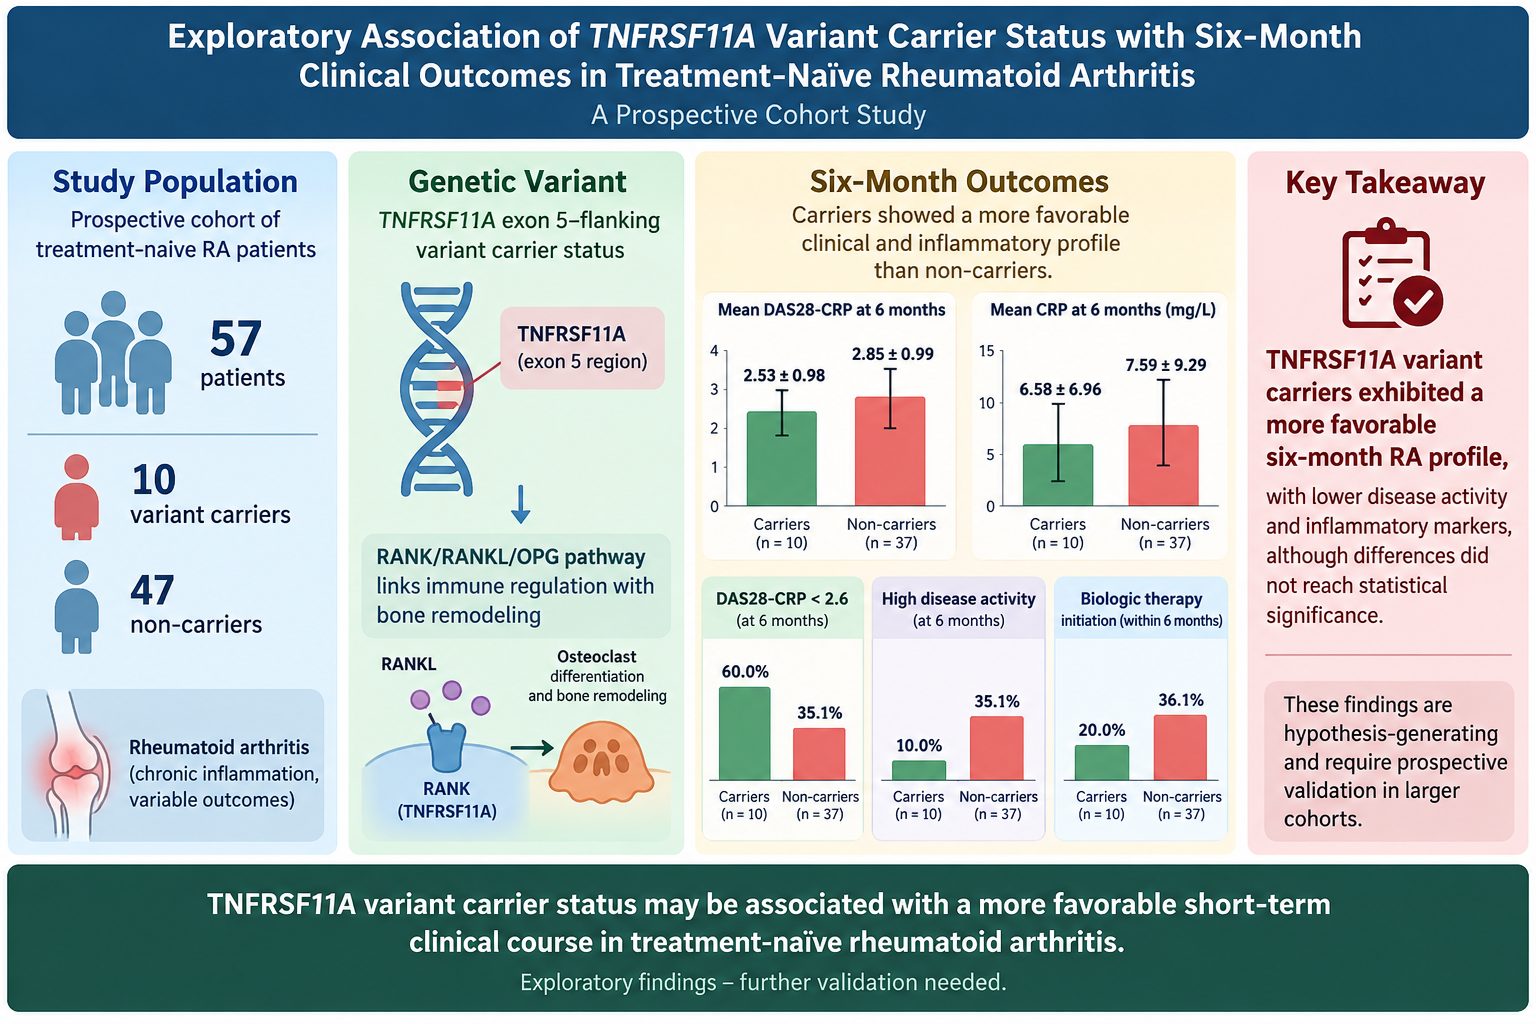
Background and Objectives: Variation in RANK/RANKL/OPG signaling may contribute to rheumatoid arthritis (RA) heterogeneity. We examined whether recorded TNFRSF11A exon 5–flanking variant carrier status was associated with six-month clinical outcomes in treatment-naïve RA. Materials and Methods: This prospective cohort included 57 patients: 10 carriers and 47 non-carriers. The primary outcome was six-month DAS28-CRP. Welch tests, Fisher’s exact tests, effect sizes, 95% confidence intervals, and exploratory baseline-adjusted models were used; missing outcomes were not imputed. Results: Carriers had lower six-month DAS28-CRP than non-carriers (2.53 ± 0.98 [n=10] vs 2.85 ± 0.99 [n=37]) and lower CRP (6.58 ± 6.96 vs 7.59 ± 9.29 mg/L). DAS28-CRP < 2.6 occurred in 60.0% of carriers and 35.1% of non-carriers (OR, 2.769; 95% CI, 0.660–11.618). High activity, recorded deformity, and biologic initiation were 10.0% vs 35.1%, 10.0% vs 29.8%, and 20.0% vs 36.1%, respectively. The composite score was 3.60 ± 1.08 vs 2.83 ± 1.07 (d=0.720; p=0.064). The adjusted DAS28-CRP coefficient was −0.165 (95% CI, −0.850 to 0.520; p=0.629). Conclusions: The carrier pattern suggests a more favorable short-term RA profile, but remains hypothesis-generating and requires prospective validation.
Keywords:
rheumatoid arthritis
; TNFRSF11A
; RANK
; genetic variant
; carrier status
; DAS28-CRP
; methotrexate
; prospective cohort
; exploratory analysis
1. Introduction
Rheumatoid arthritis is a chronic inflammatory disease characterized by synovitis, systemic inflammation, and variable risk of persistent disease activity and structural damage [1]. Serological markers, inflammatory indices, and clinical disease-activity measures are useful for risk assessment, but they do not fully explain interindividual differences in disease course or treatment requirements [1,2]. Genetic variation may contribute to this heterogeneity, although clinically useful genetic prognostic markers remain incompletely validated [2].
The RANK/RANKL/OPG pathway links immune regulation with osteoclast differentiation and bone remodeling [3,4]. TNFRSF11A encodes RANK, the RANKL receptor. Rare pathogenic TNFRSF11A mutations cause skeletal disorders, demonstrating that changes in RANK signaling can have substantial biological consequences [5]. The clinical relevance of less severe or noncoding TNFRSF11A variants in RA, however, remains uncertain.
Previous studies have examined selected RANK or RANKL polymorphisms in relation to RA susceptibility, inflammatory measures, bone remodeling, and response to biologic therapy. Wielińska et al. studied predefined RANK and RANKL single-nucleotide polymorphisms in a larger, treatment-experienced RA cohort [6]. Triguero-Martínez et al. evaluated variants in bone-remodeling genes in early arthritis and reported associations involving a TNFRSF11A variant and bone mineral density or inflammatory measures [7]. A recent meta-analysis found higher circulating RANKL levels in RA than in controls and associations between selected TNFSF11 variants and RA susceptibility [8]. These observations support biological plausibility but do not establish that TNFRSF11A carrier status predicts short-term clinical outcomes in treatment-naïve RA.
We therefore designed the present study as an exploratory prospective cohort analysis. Because the available database did not provide a uniform disease-duration definition, the study is described as treatment-naïve RA rather than as a uniformly defined early-RA cohort. We examined whether carrier status for the recorded TNFRSF11A exon 5–flanking variants was associated with six-month disease activity, inflammatory markers, clinical joint counts, or biologic initiation. We deliberately avoid interpreting anti-CCP status or a single deformity field as six-month outcomes, and we do not use an unvalidated composite score.
2. Materials and Methods
2.1. Study Design and Participants
This prospective observational cohort included 57 consecutive adults with RA evaluated at a tertiary rheumatology center between February and August 2023. RA was classified using the 2010 ACR/EULAR classification criteria [9]. Participants were enrolled before initiation of RA-specific disease-modifying therapy. Exclusion criteria were prior DMARD exposure, pregnancy, malignancy, and another systemic autoimmune disease. The Non-Interventional Clinical Research Ethics Committee of the Faculty of Medicine approved the study protocol (Approval No. 3-5; 16 February 2023). The study followed the Declaration of Helsinki, and all participants provided written informed consent.
The database contained symptom-duration information for 47 participants. The median duration was 18 months (IQR, 15–24; range, 6–48), and only 7 of 47 participants with available information had a duration of 12 months or less. Accordingly, the study is described as a cohort of treatment-naïve RA patients rather than as a uniformly defined early-RA cohort.
2.2. Clinical Assessments and Treatment Variables
At baseline and approximately six months, the database included tender and swollen joint counts, CRP, ESR, DAS28-CRP, CDAI, SDAI, patient-reported and physician-reported global assessments, and selected patient-reported measures. Rheumatoid factor and anti-CCP status were recorded at baseline. Deformity was represented by a single binary variable; no separate baseline and six-month deformity variables were available. Therefore, deformity is reported only as a baseline clinical characteristic and is not interpreted as incident structural progression.
Routine care intended to initiate methotrexate, but the medication fields lacked a complete, time-stamped treatment history. Three records had an MTX flag of 0 while an MTX dose was populated. Concomitant steroid, hydroxychloroquine, sulfasalazine, leflunomide, and biologic fields were present, but titration, adherence, interruptions, and exact dates were unavailable. We therefore describe an intended initial DMARD strategy rather than uniform MTX monotherapy. Biologic initiation was defined as a positive biologic-agent field by six months when observed.
2.3. Genetic Analysis and Exposure Definition
Genomic DNA was extracted from peripheral blood and the TNFRSF11A exon 5 region was analyzed by PCR and direct sequencing. The database contained three binary variant indicators and a total carrier indicator. The recorded labels were c.521+235T>C, c.428−106C>T, and c.428−338G>A. Because the database lacked the reference transcript version, primer sequences, chromatograms, and laboratory quality-control records, these are referred to as exon 5–flanking variants and analyzed as binary carrier status. Carriers had at least one recorded variant (n=10); non-carriers had none (n=47). No common functional direction or variant-specific effect is assumed.
2.4. Outcomes
The principal outcome was continuous six-month DAS28-CRP. Secondary outcomes were six-month CRP, ESR, CDAI, SDAI, tender and swollen joint counts, change from baseline, and a previously derived composite score. For binary disease-activity summaries, we reported a strict DAS28-CRP <2.6 threshold and an inclusive ≤2.6 sensitivity definition because two non-carriers had a value exactly equal to 2.6; high activity was defined operationally as >3.2. Anti-CCP negativity, baseline deformity, and biologic initiation were also described. These thresholds are exploratory numerical definitions and are not presented as universally validated CRP-specific categories [10,11]. The composite-score components and formula were not present in the supplied workbook; therefore, that result is descriptive and was not treated as a prespecified primary outcome.
2.5. Statistical Analysis
Continuous variables are summarized as mean ± standard deviation; symptom duration also uses median and IQR. Welch’s t test was used for continuous outcomes, with mean differences, Cohen’s d, and 95% confidence intervals. Fisher’s exact test was used for categorical outcomes, with crude odds ratios and 95% confidence intervals. Sparse-event intervals require caution.
The principal comparison was the observed-data difference in six-month DAS28-CRP. Baseline-adjusted ordinary least-squares models included carrier status and the corresponding baseline measure as exploratory sensitivity analyses; analogous models were examined for CRP, ESR, CDAI, and SDAI. Change scores were compared descriptively with Welch’s t test. No multiplicity adjustment or imputation was applied. Outcome-specific denominators and missingness by carrier group are reported.
3. Results
3.1. Cohort Characteristics and Baseline Findings
The cohort comprised 57 participants: 10 carriers (17.5%) and 47 non-carriers (82.5%). Mean age was 49.90 ± 13.49 years in carriers and 54.70 ± 12.69 years in non-carriers; women represented 8/10 and 32/47, respectively. Baseline DAS28-CRP was 3.82 ± 1.02 versus 4.22 ± 0.98. Anti-CCP positivity was present in 5/10 carriers and 34/47 non-carriers; RF positivity was present in 9/10 carriers and 33/47 non-carriers. Baseline deformity was recorded in 1/10 carriers and 14/47 non-carriers. These descriptive data do not establish baseline equivalence or a prognostic effect. Complete baseline comparisons are provided in Table 1.
3.2. Follow-Up Completeness
Six-month CRP, ESR, DAS28-CRP, CDAI, and SDAI values were available for all 10 carriers and 37/47 non-carriers; joint counts were available for all 57 participants. Biologic-treatment records were available for all carriers and 36/47 non-carriers. Thus, 10 non-carriers lacked laboratory/disease-activity follow-up and 11 lacked a biologic-treatment record. No imputation was performed. Outcome-specific completeness is shown in Figure 1.
3.3. Six-Month Clinical and Laboratory Outcomes
Carriers had lower mean six-month DAS28-CRP than non-carriers (2.53 ± 0.98 vs 2.85 ± 0.99; n=10 vs n=37; mean difference, −0.319; 95% CI, −1.066 to 0.428; Cohen’s d=−0.323; p=0.377). CRP was also lower in carriers (6.58 ± 6.96 vs 7.59 ± 9.29 mg/L; mean difference, −1.012; 95% CI, −6.627 to 4.603; Cohen’s d=−0.114; p=0.710). ESR was higher in carriers (mean difference, +2.657; 95% CI, −4.356 to 9.669; Cohen’s d=0.288; p=0.431). CDAI, SDAI, and joint counts showed no clear between-group difference. The complete continuous comparisons are presented in Table 2, and individual DAS28-CRP observations are shown in Figure 2.
3.4. Change From Baseline to Six Months
Among participants with paired measurements, DAS28-CRP decreased by −1.29 ± 1.12 points in carriers and −1.41 ± 1.11 points in non-carriers; the between-group difference was 0.12 points (p=0.772). Other markers and joint counts also decreased, with no clear between-group difference. Within-group improvement does not establish a genetic treatment effect because there was no untreated comparator and treatment exposure was not time-resolved. Change scores are summarized in Table 3.
3.5. Baseline-Adjusted Sensitivity Analyses
In baseline-adjusted models, the carrier coefficient was −0.165 for six-month DAS28-CRP (95% CI, −0.850 to 0.520; p=0.629; n=47). Corresponding coefficients were −1.045 for CRP (p=0.746), +2.809 for ESR (p=0.365), +0.043 for CDAI (p=0.987), and +0.354 for SDAI (p=0.903). The intervals remain compatible with modest benefit or no clinically important difference. The full exploratory models are shown in Table 4.
3.6. Exploratory Binary Outcomes
Using the strict DAS28-CRP <2.6 threshold, low activity occurred in 6/10 carriers (60.0%) and 13/37 non-carriers (35.1%; OR, 2.769; 95% CI, 0.660–11.618; Fisher’s p=0.276). Because two non-carriers had a value exactly equal to 2.6, the inclusive ≤2.6 sensitivity definition yielded 6/10 carriers (60.0%) and 15/37 non-carriers (40.5%; OR, 2.200; 95% CI, 0.529–9.150; Fisher’s p=0.306). The exploratory high-activity category (>3.2) occurred in 1/10 carriers (10.0%) versus 13/37 non-carriers (35.1%; OR, 0.205; 95% CI, 0.023–1.803; Fisher’s p=0.242). Anti-CCP negativity was observed in 5/10 carriers (50.0%) versus 13/47 non-carriers (27.7%; OR, 2.615; 95% CI, 0.648–10.550; Fisher’s p=0.260). Deformity was recorded in 1/10 carriers (10.0%) versus 14/47 non-carriers (29.8%; OR, 0.262; 95% CI, 0.030–2.268; Fisher’s p=0.263). Biologic initiation was recorded in 2/10 carriers (20.0%) versus 13/36 non-carriers (36.1%; OR, 0.442; 95% CI, 0.081–2.402; Fisher’s p=0.460). Eleven non-carrier treatment records were missing and were not treated as non-initiation. The descriptive composite score was 3.60 ± 1.08 in carriers versus 2.83 ± 1.07 in non-carriers (Cohen’s d=0.720; p=0.064); its formula and components were not present in the supplied workbook. Binary outcomes are shown in Table 5.
4. Discussion
In this small prospective cohort, TNFRSF11A carriers showed a consistent pattern of more favorable short-term findings than non-carriers. Mean six-month DAS28-CRP was 2.53 ± 0.98 in carriers and 2.85 ± 0.99 in non-carriers, while CRP was 6.58 ± 6.96 versus 7.59 ± 9.29 mg/L. Low disease activity, defined as DAS28-CRP <2.6, occurred in 60.0% of carriers and 35.1% of non-carriers (OR, 2.769; 95% CI, 0.660–11.618), whereas high activity occurred in 10.0% and 35.1%, respectively. Deformity was recorded in 10.0% of carriers versus 29.8% of non-carriers, and biologic initiation in 20.0% versus 36.1% with available data. The composite score also favored carriers (3.60 ± 1.08 vs 2.83 ± 1.07; Cohen’s d=0.720; p=0.064). Although the adjusted DAS28-CRP coefficient remained favorable (−0.165; 95% CI, −0.850 to 0.520; p=0.629), the confidence interval was wide. Overall, these data suggest that TNFRSF11A carrier status may be associated with a more favorable short-term RA profile, but the finding is hypothesis-generating rather than confirmatory.
The biological rationale is supported by the role of RANK in the RANK/RANKL/OPG pathway, which links immune activation, osteoclast differentiation, and bone remodeling [3,4]. Our findings can be compared with the study by Wielińska et al., which included 318 patients with RA and 163 controls, examined four predefined RANK/RANKL polymorphisms, measured serum RANKL, and evaluated CRP, swollen-joint counts, alkaline phosphatase, and anti-TNF treatment outcomes [6]. Their genotype-specific associations with inflammatory measures and treatment response are directionally compatible with the present carrier pattern. However, the studies are not direct replications: Wielińska et al. analyzed individual predefined polymorphisms in a larger, treatment-experienced cohort, whereas our study combined three recorded exon 5–flanking variant indicators into one carrier category in 57 treatment-naïve patients. The lower CRP and lower biologic escalation observed here should therefore be interpreted as supportive evidence for a shared pathway hypothesis, not as proof of a specific variant effect.
Triguero-Martínez et al. provide a complementary comparison in 268 patients with early arthritis. Their analysis of 552 bone-remodeling SNPs identified the nonsynonymous TNFRSF11A rs1805034 variant in relation to bone-mineral-density measures and linked TNFRSF11B variants to serum OPG and longer-term disease activity [7]. Our study examined different recorded exon 5–flanking variants and did not include bone-mineral-density, OPG, RANKL, IL-6, ultrasound, or radiographic measurements. The recent meta-analysis by Lee and Song likewise supports pathway-level relevance: across 10 studies involving 1,682 patients with RA and 1,288 controls, RANKL levels were higher in RA and were associated with RF and DAS28, while selected TNFSF11 polymorphisms were related to RA susceptibility [8]. These studies make the present signal biologically plausible [12], but they do not establish that our carrier definition predicts prognosis. The relationship between bone erosion and RA severity also supports careful structural interpretation [13]. In keeping with treat-to-target recommendations, carrier status should not guide treatment independently; its potential value would be as an additional risk-stratification signal alongside disease activity, serology, imaging, and treatment response [14].
This study has important limitations. Only 10 participants were carriers, so one or two observations could materially change the estimates and the confidence intervals were wide. Six-month laboratory and disease-activity data were available for all carriers but only 37 of 47 non-carriers, and biologic-treatment information was unavailable for 11 non-carriers. Medication records did not provide complete dates, adherence, dose changes, or reasons for escalation. The three recorded variants were analyzed together, although their functional effects and clinical direction may differ; reference transcript, primer, chromatogram, call-rate, and laboratory quality-control information were also unavailable [15]. Deformity was captured by one binary field without separate baseline and follow-up assessments, so it cannot be interpreted as new structural damage. The composite-score formula and components were not included in the workbook and therefore remain exploratory. The cohort was single-center, not powered for variant-specific or interaction analyses, and no multiplicity adjustment or imputation was applied. The cost of genomic sequencing and variant-level phenotyping may also have contributed to the small sample and limited scope. These limitations mean that the findings should be used to generate a prospective validation hypothesis, not to support clinical classification.
In conclusion, TNFRSF11A carriers showed a coherent pattern of lower short-term disease activity, lower CRP, fewer high-activity observations, less recorded deformity, and less biologic escalation than non-carriers. The adjusted estimate remained in the favorable direction, but the uncertainty was substantial. TNFRSF11A carrier status may therefore be associated with a more favorable short-term RA prognosis, yet this possibility requires confirmation in larger, prospective studies with complete follow-up, variant-level genotyping, prespecified outcomes, detailed treatment data, biological measurements, and independent replication. At present, the finding is best regarded as hypothesis-generating rather than as an established prognostic marker.
Author Contributions
Conceptualization, G.N.O.C. and S.B.; Methodology, G.N.O.C., O.E. and S.B.; Formal Analysis, G.N.O.C. and S.B.; Investigation, G.N.O.C., O.E., U.U., O.K., G.S. and S.B.; Data Curation, G.N.O.C. and S.B.; Writing—Original Draft Preparation, G.N.O.C. and S.B.; Writing—Review and Editing, all authors; Visualization, G.N.O.C.; Supervision, S.B. All authors have read and agreed to the published version of the manuscript.
Funding
This research was supported by a research grant from the Antalya Training and Research Hospital Scientific Research Projects Coordination Unit (8,000 Turkish Lira), allocated for genomic sequencing and genotyping analysis. The funder had no role in study design, data collection, analysis, interpretation, or the decision to publish.
Institutional Review Board Statement
The study was conducted in accordance with the Declaration of Helsinki and approved by the Antalya Training anl Research Hospital Non-Interventional Clinical Research Ethics Committee of the Faculty of Medicine (Approval No. 3-5; 16 February 2023).
Informed Consent Statement
Informed consent was obtained from all subjects involved in the study.
Data Availability Statement
The supplied analysis file contained direct participant identifiers and was not suitable for public sharing in its original form. A de-identified dataset and analysis code should be made available by the corresponding author upon reasonable request, subject to institutional and ethics requirements.
Use of Artificial Intelligence
During preparation of this manuscript, AI-based tools were used for language editing, grammar correction, formatting, and readability. No participant data, statistical analyses, figures, or scientific conclusions were generated by AI. The authors reviewed and edited all assisted text and take full responsibility for the content of this publication.
Conflicts of Interest
The authors declare no conflict of interest. The funder had no role in the design of the study; in the collection, analyses, or interpretation of data; in the writing of the manuscript; or in the decision to publish the results.
References
- Smolen, J.S.; Aletaha, D.; McInnes, I.B. Rheumatoid arthritis. Lancet 2016, 388, 2023–2038. [Google Scholar] [CrossRef] [PubMed]
- Viatte, S.; Plant, D.; Raychaudhuri, S. Genetics and epigenetics of rheumatoid arthritis. Nat. Rev. Rheumatol. 2013, 9, 141–153. [Google Scholar] [CrossRef] [PubMed]
- Takayanagi, H. Osteoimmunology: shared mechanisms and crosstalk between the immune and bone systems. Nat. Rev. Immunol. 2007, 7, 292–304. [Google Scholar] [CrossRef] [PubMed]
- Gravallese, E.M.; Manning, C.; Tsay, A.; et al. Synovial tissue in rheumatoid arthritis is a source of osteoclast differentiation factor. Arthritis Rheum. 2000, 43, 250–258. [Google Scholar] [CrossRef] [PubMed]
- Hughes, A.E.; Ralston, S.H.; Marken, J.; et al. Mutations in TNFRSF11A, affecting the signal peptide of RANK, cause familial expansile osteolysis. Nat. Genet. 2000, 24, 45–48. [Google Scholar] [CrossRef] [PubMed]
- Wielińska, J.; Kolossa, K.; Świerkot, J.; et al. Polymorphisms within the RANK and RANKL encoding genes in patients with rheumatoid arthritis: association with disease progression and effectiveness of the biological treatment. Arch. Immunol. Ther. Exp. 2020, 68, 24. [Google Scholar] [CrossRef] [PubMed]
- Triguero-Martínez, A.; Pardines, M.; Montes, N.; et al. Genetic variants in RANK and OPG could influence disease severity and bone remodeling in patients with early arthritis. Life 2024, 14, 1109. [Google Scholar] [CrossRef] [PubMed]
- Lee, Y.H.; Song, G.G. Associations of RANKL levels and polymorphisms with rheumatoid arthritis: a meta-analysis. PLoS ONE 2025, 20, e0317517. [Google Scholar] [CrossRef] [PubMed]
- Aletaha, D.; Neogi, T.; Silman, A.J.; et al. 2010 rheumatoid arthritis classification criteria: an American College of Rheumatology/European League Against Rheumatism collaborative initiative. Arthritis Rheum. 2010, 62, 2569–2581. [Google Scholar] [CrossRef] [PubMed]
- Fleischmann, R.M.; van der Heijde, D.; Gardiner, P.V.; et al. DAS28-CRP and DAS28-ESR cut-offs for high disease activity in rheumatoid arthritis are not interchangeable. RMD Open 2017, 3, e000382. [Google Scholar] [CrossRef] [PubMed]
- Greenmyer, J.R.; Stacy, J.M.; Sahmoun, A.E.; et al. DAS28-CRP cutoffs for high disease activity and remission are lower than DAS28-ESR in rheumatoid arthritis. ACR Open Rheumatol. 2020, 2, 507–511. [Google Scholar] [CrossRef] [PubMed]
- McInnes, I.B.; Schett, G. The pathogenesis of rheumatoid arthritis. N Engl. J. Med. 2011, 365, 2205–2219. [Google Scholar] [CrossRef] [PubMed]
- Schett, G.; Gravallese, E. Bone erosion in rheumatoid arthritis: mechanisms, diagnosis and treatment. Nat. Rev. Rheumatol. 2012, 8, 656–664. [Google Scholar] [CrossRef] [PubMed]
- Smolen, J.S.; Aletaha, D.; Bijlsma, J.W.; T2T Expert Committee; et al. Treating rheumatoid arthritis to target: recommendations of an international task force. Ann. Rheum. Dis. 2010, 69, 631–637. [Google Scholar] [CrossRef] [PubMed]
- Little, J.; Higgins, J.P.T.; Ioannidis, J.P.A.; et al. STREGA—an extension of the STROBE statement: guidelines for reporting genetic association studies. PLoS Med. 2009, 6, e1000022. [Google Scholar] [CrossRef] [PubMed]
Figure 1.
Outcome-specific six-month follow-up completeness. Green bars represent carriers and red bars represent non-carriers. Laboratory and disease-activity outcomes were observed in 100% of carriers and 79% of non-carriers; biologic-treatment records were observed in 100% and 77%, respectively.
Figure 1.
Outcome-specific six-month follow-up completeness. Green bars represent carriers and red bars represent non-carriers. Laboratory and disease-activity outcomes were observed in 100% of carriers and 79% of non-carriers; biologic-treatment records were observed in 100% and 77%, respectively.
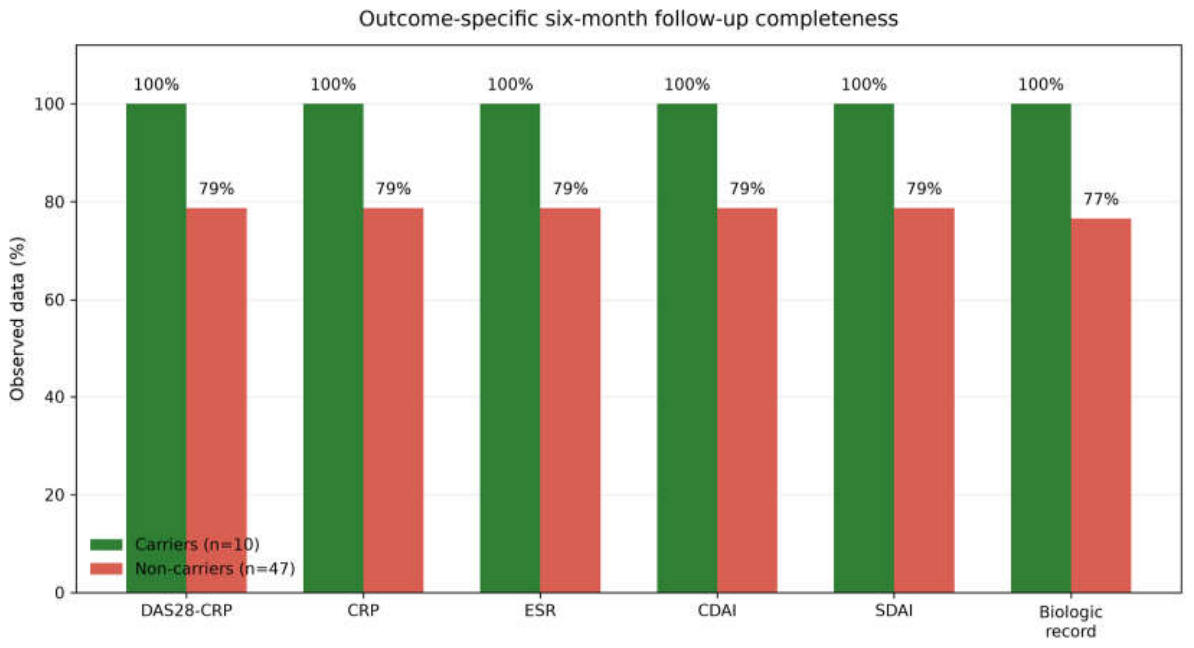
Figure 2.
Individual six-month DAS28-CRP values by carrier status. Dots represent individual observations. Black markers and vertical bars represent group means and 95% confidence intervals. The dashed line at 2.6 is shown as a numerical reference and is not assigned a CRP-specific disease-activity label.
Figure 2.
Individual six-month DAS28-CRP values by carrier status. Dots represent individual observations. Black markers and vertical bars represent group means and 95% confidence intervals. The dashed line at 2.6 is shown as a numerical reference and is not assigned a CRP-specific disease-activity label.
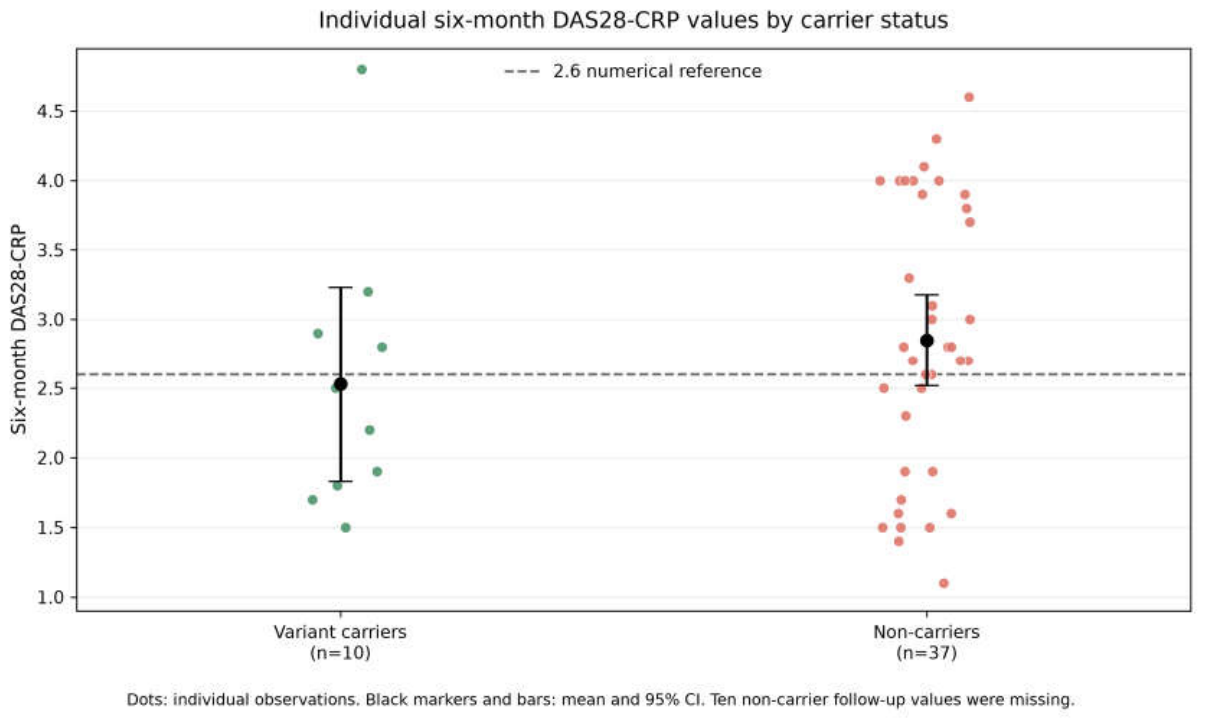

Table 1.
Baseline characteristics by TNFRSF11A variant carrier status.
| Characteristic | Carriers (n=10) | Non-carriers (n=47) | P value |
| Age, years | 49.90 ± 13.49 | 54.70 ± 12.69 | 0.321 |
| Baseline DAS28-CRP | 3.82 ± 1.02 | 4.22 ± 0.98 | 0.273 |
| Baseline CRP, mg/L | 16.97 ± 18.94 | 21.27 ± 28.79 | 0.564 |
| Baseline ESR, mm/h | 18.20 ± 11.01 | 20.38 ± 18.91 | 0.628 |
| Tender joint count at baseline | 4.50 ± 4.25 | 5.19 ± 4.03 | 0.645 |
| Swollen joint count at baseline | 1.50 ± 1.27 | 1.70 ± 1.38 | 0.660 |
| Female sex, n (%) | 8 (80.0%) | 32 (68.1%) | 0.706 |
| Anti-CCP positive, n (%) | 5 (50.0%) | 34 (72.3%) | 0.260 |
| RF positive, n (%) | 9 (90.0%) | 33 (70.2%) | 0.263 |
| Deformity recorded at baseline, n (%) | 1 (10.0%) | 14 (29.8%) | 0.263 |
Continuous variables are mean ± SD. P values are exploratory and should not be interpreted as tests of baseline equivalence.
Table 2.
Six-month continuous outcomes by TNFRSF11A variant carrier status.
| Outcome | Carriers | Non-carriers | Mean difference | 95% CI | Cohen’s d | P value |
| DAS28-CRP | 2.53 ± 0.98 (n=10) | 2.85 ± 0.99 (n=37) | −0.319 | −1.066 to 0.428 | −0.323 | 0.377 |
| CRP, mg/L | 6.58 ± 6.96 (n=10) | 7.59 ± 9.29 (n=37) | −1.012 | −6.627 to 4.603 | −0.114 | 0.710 |
| ESR, mm/h | 13.90 ± 9.18 (n=10) | 11.24 ± 9.23 (n=37) | +2.657 | −4.356 to 9.669 | +0.288 | 0.431 |
| CDAI | 10.41 ± 8.43 (n=10) | 10.75 ± 7.97 (n=37) | −0.341 | −6.726 to 6.044 | −0.042 | 0.910 |
| SDAI | 11.70 ± 8.54 (n=10) | 12.21 ± 8.13 (n=37) | −0.514 | −6.987 to 5.960 | −0.063 | 0.867 |
| Tender joint count | 0.70 ± 1.06 (n=10) | 1.28 ± 1.14 (n=47) | −0.577 | −1.379 to 0.226 | −0.513 | 0.146 |
| Swollen joint count | 0.50 ± 0.53 (n=10) | 0.64 ± 0.61 (n=47) | −0.138 | −0.541 to 0.265 | −0.233 | 0.475 |
Values are mean ± SD. Denominators are outcome-specific.
Table 3.
Change from baseline to six months (six months minus baseline).
| Outcome | Carriers | Non-carriers | Difference in change | P value |
| DAS28-CRP | −1.29 ± 1.12 (n=10) | −1.41 ± 1.11 (n=37) | +0.12 | 0.772 |
| CRP, mg/L | −10.39 ± 18.57 (n=10) | −13.56 ± 27.48 (n=37) | +3.17 | 0.673 |
| ESR, mm/h | −4.30 ± 6.13 (n=10) | −7.59 ± 15.49 (n=37) | +3.29 | 0.310 |
| CDAI | −8.79 ± 8.98 (n=10) | −9.44 ± 8.78 (n=37) | +0.65 | 0.842 |
| SDAI | −8.57 ± 12.26 (n=10) | −11.58 ± 9.63 (n=37) | +3.01 | 0.485 |
| Tender joint count | −3.80 ± 4.24 (n=10) | −3.91 ± 3.70 (n=47) | +0.11 | 0.938 |
| Swollen joint count | −1.00 ± 1.15 (n=10) | −1.06 ± 1.05 (n=47) | +0.06 | 0.875 |
Table 4.
Baseline-adjusted exploratory analyses.
| Outcome | n | Adjusted carrier coefficient | SE | 95% CI | P value |
| DAS28-CRP | 47 | −0.165 | 0.340 | −0.850 to 0.520 | 0.629 |
| CRP, mg/L | 47 | −1.045 | 3.207 | −7.507 to 5.418 | 0.746 |
| ESR, mm/h | 47 | +2.809 | 3.070 | −3.378 to 8.996 | 0.365 |
| CDAI | 47 | +0.043 | 2.708 | −5.414 to 5.500 | 0.987 |
| SDAI | 47 | +0.354 | 2.904 | −5.499 to 6.207 | 0.903 |
The coefficient represents the carrier-minus-non-carrier difference in the six-month outcome after adjustment for the corresponding baseline measure. These analyses are exploratory sensitivity analyses.
Table 5.
Exploratory binary outcomes.
| Outcome | Carriers | Non-carriers | Crude OR (95% CI) | Fisher’s P |
| DAS28-CRP <2.6 at six months | 6/10 (60.0%) | 13/37 (35.1%) | 2.769 (0.660–11.618) | 0.276 |
| DAS28-CRP ≤2.6 sensitivity analysis | 6/10 (60.0%) | 15/37 (40.5%) | 2.200 (0.529–9.150) | 0.306 |
| DAS28-CRP >3.2 at six months | 1/10 (10.0%) | 13/37 (35.1%) | 0.205 (0.023–1.803) | 0.242 |
| Anti-CCP negative at baseline | 5/10 (50.0%) | 13/47 (27.7%) | 2.615 (0.648–10.550) | 0.260 |
| Deformity recorded at baseline | 1/10 (10.0%) | 14/47 (29.8%) | 0.262 (0.030–2.268) | 0.263 |
| Biologic initiation by six months | 2/10 (20.0%) | 13/36 (36.1%) | 0.442 (0.081–2.402) | 0.460 |
Disclaimer/Publisher’s Note: The statements, opinions and data contained in all publications are solely those of the individual author(s) and contributor(s) and not of MDPI and/or the editor(s). MDPI and/or the editor(s) disclaim responsibility for any injury to people or property resulting from any ideas, methods, instructions or products referred to in the content. |
© 2026 by the authors. Licensee MDPI, Basel, Switzerland. This article is an open access article distributed under the terms and conditions of the Creative Commons Attribution (CC BY) license.
Copyright: This open access article is published under a Creative Commons CC BY 4.0 license, which permit the free download, distribution, and reuse, provided that the author and preprint are cited in any reuse.