

Submitted:
15 October 2026
Posted:
19 October 2026
You are already at the latest version
Abstract
Background/Objectives: Evidence on the association between adiposity and postural stability (PS) in children is inconsistent, partly because most studies rely on single indices such as body mass index (BMI). We examined whether preadolescent girls stratified by a multivariate anthropometric adiposity profile differ in static PS. Methods: In this cross-sectional study, 235 girls aged 9–12 years were assigned to three subgroups by Ward's hierarchical cluster analysis of BMI, three skinfold thicknesses and three segment circumferences. Sway area and centre of pressure (COP) path length were recorded in double-leg, right single-leg and left single-leg stance. Group differences were analysed using MANCOVA, with habitual physical activity (PAQ-C) as a covariate. Results: A significant multivariate group effect on PS was found (Pillai's trace = 0.671, p < 0.001, η²p = 0.335), independent of physical activity. Sway area and COP path length decreased consistently from the lowest- to the highest-adiposity subgroup, with the largest effects in left single-leg stance (η²p = 0.381–0.464). Conclusions: Girls with a higher composite adiposity profile exhibited smaller sway excursions across all stance conditions, independent of physical activity. The pattern was most pronounced under the most demanding stance condition and aligns with biomechanical models linking greater segmental mass to a stiffer ankle strategy and an enlarged base of support. Future longitudinal studies with objective body composition and maturation assessment are needed to clarify the mechanisms underlying this relationship.
Keywords:
adiposity
; body composition
; BMI
; skinfold
; postural stability
; balance
; cluster analysis
; preadolescent
; girls
; sway index
1. Introduction
Static postural stability (PS), defined as the ability to maintain the center of mass within the base of support while standing quietly, is a fundamental element of motor competence in children and a prerequisite for developing more complex movement skills [1]. Its development follows a protracted trajectory through middle childhood and early adolescence, making this period particularly sensitive to factors that may disrupt the maturation of sensorimotor integration [2]. Among such factors, excess body adiposity has received increasing attention as the prevalence of childhood overweight and obesity has increased worldwide from about 8% in 1990 to 20% in 2022 among children and adolescents aged 5–19 years [3] and with growing evidence that excess adipose tissue adversely affects both motor functioning and postural control (PC) [4,5].
A large amount of cross-sectional evidence links greater adiposity to poorer PC in school aged children. García-Massó et al. [2] demonstrated in 359 children that the negative effect of obesity on static PS is age-dependent, affecting middle childhood (8–12 years old) and adolescence, but not early childhood, a finding that points to the developmental sensitivity of the preadolescent period. Similarly, Ceschia et al. [6] showed that overweight and obese pre-pubertal schoolchildren (n = 2,411, 7–11 years) had 165.5% more falls in static balance tests than their normal-weight peers. More recently, a study by Brzek et al. [7] in 235 children found that obesity was associated with significantly greater sway path length and ellipse area during posturographic assessment. The proposed biomechanical mechanism is an increased moment of inertia about the ankle joint with greater segmental mass, which increases the corrective demands on the PC system. Excess adiposity also alters plantar contact area and foot arch geometry [8], changing the mechanical base of support available for balance regulation.
Significantly, the relationship between adiposity and PC appears to depend on how adiposity is characterized. Studies using BMI or weight status categories only have shown inconsistent findings while studies using regional measures of body composition (BC) seem to suggest a more consistent association. Guzmán-Muñoz et al. [9] reported that in study of 387 schoolchildren, skinfold thickness, fat mass and somatotype together explained 21–46% of the variance in centre-of-pressure velocity parameters, with multivariate anthropometric profiles providing greater predictive power than any single index. Similarly, Diniz-Sousa et al. [10] reported that fat mass percentage and waist circumference were the strongest BC predictors of balance in children, regardless of physical fitness and physical activity (PA) levels, through dual-energy X-ray absorptiometry. Overall, these results indicate that a composite, multidimensional description of adiposity might reveal associations with PC that could be masked when only global weight status is considered.
However, the evidence is not consistent. Rusek et al. [11] in 1,137 children aged 7–15 years found a higher BMI and adipose tissue content associated with a smaller centre-of-pressure ellipse area and horizontal deviations, which might indicate better, static stability in heavier children. Likewise, Carnevale Pellino et al. [12] did not observe any significant PC impairment in prepubertal children with obesity during quiet stance tests. A systematic review of 53 studies with 8,509 participants [5], the most comprehensive synthesis to date, concluded that impairment was most consistently observed under challenging conditions. Nine of the 53 included studies reported better postural-control outcomes with higher adiposity. An important moderator is the level of PA. Brummer et al. [13] demonstrated that participation in sports clubs moderated the association between excess adiposity and deficits in motor control in children aged 7–18 years, indicating that neuromuscular fitness may partly compensate for the biomechanical disadvantages of increased body mass. Sex also moderates this relationship, with girls generally showing more stable PC than boys across adiposity groups [11]. However, comparative data in preadolescent girls specifically remain limited.
To our knowledge, no study has applied a data-driven, multivariate clustering approach — simultaneously incorporating BMI, skinfold thicknesses, and segment circumferences — to derive empirically grounded composite anthropometric profiles and examine their relationship with static PS across stance conditions of varying postural demand in preadolescent girls. This methodological gap is relevant because stance conditions differing in base of support (double-leg vs. single-leg) are known to vary in their sensitivity to adiposity-related differences in PC [1,5]. The aim of the present study was therefore to determine whether preadolescent girls, stratified into three adiposity-based subgroups by Ward’s hierarchical cluster analysis of standardised anthropometric variables, differ in static PS assessed during double-leg and single-leg quiet stance. Given the contradictory evidence in the literature, no a priori directional hypothesis was specified. It was anticipated that girls with a higher composite adiposity profile would differ from their lower-adiposity peers in static PS, with differences expected to be most pronounced under the more demanding single-leg stance conditions.
2. Materials and Methods
2.1. Study Design and Participants
This was a cross-sectional observational study conducted and reported according to the STROBE guidelines for observational research. Participants were recruited from seven state primary schools in the Vojvodina region, Serbia, by a stratified random sampling procedure with schools as the primary sampling unit. Because participants were recruited from multiple schools, observations within the same school may not be fully independent. Intraclass correlation coefficients (ICCs) for school-level clustering were not computed, as the present study was not designed as a multilevel investigation and school identity was not recorded as a participant variable. The possibility of residual school-level dependence is acknowledged as a limitation; future studies should account for clustering through multilevel modelling or cluster-robust standard errors. Of the 300 girls initially identified and invited to participate, 272 met the eligibility criteria; the remaining 28 were excluded on the basis of the pre-specified exclusion criteria. Of the 272 eligible participants, 242 successfully completed the balance testing protocol, while 30 were unable to complete the required testing tasks without assistance and were therefore excluded; the majority of these participants failed to maintain the single-leg stance conditions (right or left single-leg) for the required 30-s duration across the permitted five attempts, with only a minority failing the double-leg condition. Their mean age (10.41 ± 0.83 years), height (141.9 ± 7.6 cm), and body mass (35.1 ± 6.0 kg) were similar to those of the retained sample, suggesting no systematic anthropometric bias; however, as these data were not formally collected prior to exclusion, a residual possibility of selection bias cannot be fully excluded and should be considered a limitation. A further seven participants were removed from the dataset owing to data recording errors detected during post-hoc quality control of the force platform output files, yielding a final analytical sample of 235 girls (age 10.38 ± 0.79 years; height 142.83 ± 7.33 cm; body mass 34.60 ± 5.82 kg). Inclusion criteria were: (i) female sex; (ii) age between 9 and 12 years; and (iii) attendance at a state primary school in the study region. The exclusion criteria were: (i) a history of neurological, vestibular or musculoskeletal disorder, (ii) an acute or chronic condition that could potentially impair balance or gait, (iii) use of medication known to interfere with postural control or motor function and (iv) inability to complete the testing protocol without assistance. Written informed consent was obtained from each participant’s parent or legal guardian prior to testing and verbal assent was obtained from the child. The study was conducted in accordance with the Declaration of Helsinki and approved by the Human Research Ethics Committee of the University of Novi Sad (approval number: 234/2020; date: 17.06.2020.).
Participants were assigned to three adiposity-based subgroups using Ward’s [14] hierarchical clustering method with squared Euclidean distance, applied to the standardised (z-score) values of BMI, abdominal skinfold, subscapular skinfold, triceps skinfold, chest circumference, arm circumference, and forearm circumference. This multivariate approach was adopted because it simultaneously incorporates global (BMI), regional subcutaneous (skinfolds), and segmental volumetric (circumferences) aspects of adiposity, thereby providing a richer characterisation of BC than any single index.
The number of clusters was determined by inspection of the agglomeration schedule generated by Ward’s hierarchical clustering procedure: a three-cluster solution was selected on the basis of a marked increase in the agglomeration coefficients at the final merge step and the substantive interpretability of the resulting subgroups. Group A comprised girls with the lowest mean values across the clustering variables (lowest adiposity profile, n = 76), Group B those with intermediate values (n = 77), and Group C those with the highest values (highest adiposity profile, n = 82). Descriptive characteristics of the total sample and the three subgroups are presented in Table 1.
2.2. Sample Size Considerations and Sensitivity Analysis
No formal a priori power analysis was conducted, as no prior study has examined PS outcomes using a comparable multivariate cluster-based adiposity stratification in preadolescent girls, precluding a reliable estimate of the expected effect size. A sensitivity power analysis was performed post hoc using G*Power 3.1, approximating the primary MANCOVA design as a fixed-effects ANCOVA with three groups and one covariate (α = 0.05, 1−β = 0.80, total N = 235). With this sample, the minimum detectable effect size was Cohen’s f = 0.204 (η²p ≈ 0.040), corresponding to a small-to-medium effect. The observed between-group effects on PS parameters substantially exceeded this threshold (f = 0.314–0.929; η²p = 0.089–0.464 across the six outcome variables), indicating that the study was adequately powered to detect effects of the magnitude observed. Between-group differences in body composition variables (η² = 0.023–0.054) were at or below the minimum detectable effect, indicating modest between-group separation in the clustering variables within this predominantly normal-weight sample. The present investigation is accordingly conceived as exploratory, aimed at characterising between-group patterns under a novel stratification approach and generating hypotheses for future confirmatory research with pre-registered effect size targets.
2.3. Anthropometric and Body Composition Assessment
All measurements were performed in the morning with participants wearing minimal clothing and without footwear. Body height was measured with a Martin anthropometer (GPM, Zurich, Switzerland) to the nearest 0.1 cm, and body mass with a calibrated scale (SECA 769, SECA GmbH & Co. KG, Hamburg, Germany) to the nearest 0.1 kg. BMI was calculated as body mass (kg) divided by height squared (m²). Abdominal, subscapular, and triceps skinfold thicknesses were measured with a John Bull caliper (British Indicators Ltd., Thornaby, UK) to the nearest 0.2 mm, with three measurements taken at each site and the median value retained for analysis. Chest, arm, and forearm circumferences were measured with a flexible non-elastic tape to the nearest 0.1 cm. All anthropometric procedures followed the standardised protocol of the International Biological Programme [15]. Body composition characteristics by group are presented in Table 2.
2.4. Postural Stability Assessment
Testing was conducted at the Faculty of Sport and Physical Education, University of Novi Sad, in the morning under standardised indoor conditions (ambient temperature 18–21 °C; relative humidity 40–60%). Static PS was assessed using a Footscan® 0.5 m pressure plate (RSscan International, Lammerdries, Belgium; 4,096 sensors; sampling rate 300 Hz). Raw pressure data were digitally low-pass filtered at 10 Hz (4th-order Butterworth filter) by the Footscan® software prior to COP computation. The system has established reliability for static balance assessment in clinical and paediatric research [16,17]. Each participant completed three stance conditions in randomised order: double-leg stance (DL), right single-leg stance (RSL), and left single-leg stance (LSL). For each condition, three trials of 30 s quiet standing were performed with a minimum of 60 s passive rest between trials; the mean of the three trials was retained for analysis. For DL trials, participants stood with feet parallel at hip width, knees extended but not locked, hands on hips, and gaze fixed on a target at eye level [18]. For single-leg trials, participants stood on the test limb with the contralateral foot lifted and the great toe placed at the medial malleolus of the stance leg, head upright, hands on hips, eyes open [19,20]. A standardised familiarisation trial was completed before data collection. A trial was terminated and repeated if any of the following occurred: (i) the lifted foot contacted the force plate or the floor; (ii) the participant removed one or both hands from the hips; (iii) the stance foot was repositioned on the plate; or (iv) the participant required external support. A maximum of five attempts per condition was permitted.
The Footscan® software derived the following outcome variables: sway area (cm²), the area of the 95% confidence ellipse of centre-of-pressure (COP) displacement; COP path length (mm), the cumulative distance traversed by the COP over the full 30-s trial, calculated as the sum of Euclidean distances between successive COP samples; sway speed (mm/s), the mean velocity of COP displacement [21]; and sway index (mm·s⁻¹·cm⁻²), calculated as sway speed divided by sway area, reflecting the efficiency of PC relative to the spatial extent of COP excursion. For sway area, COP path length, and sway speed, smaller values indicate superior PS; for the sway index, larger values indicate less efficient PC. Sway area and COP path length were designated as primary outcomes. Sway speed was classified as a secondary variable, given that it is algebraically equivalent to COP path length divided by trial duration and thus not statistically independent. The sway index was treated as an exploratory derived variable.
2.5. Physical Activity Assessment
Habitual physical activity (PA) was assessed using the Physical Activity Questionnaire for Older Children (PAQ-C) [29,30], a self-administered 7-day recall instrument developed for children aged approximately 8–14 years attending primary school. The PAQ-C comprises nine scored items addressing participation in spare-time activities (activity checklist), effort during physical education classes, and activity during recess, lunch, after school, in the evenings, and at weekends, together with a self-rated item on overall PA frequency during the previous week. Each item is scored on a 5-point scale, and the composite PAQ-C score is calculated as the mean of the nine items, ranging from 1 (low PA) to 5 (high PA). An additional unscored item identifies whether illness or other circumstances prevented usual activity during the reference week. The PAQ-C has demonstrated acceptable internal consistency and moderate validity against objective and self-report measures of PA in this age group [29,30].
2.6. Statistical Analysis
Descriptive statistics are presented as mean ± standard deviation (SD). Distributional properties were examined within each subgroup using skewness and kurtosis values, Q–Q plots and the Shapiro–Wilk test. Given the sensitivity of formal normality tests in samples of this size, normality was judged primarily on skewness and kurtosis (|skewness| < 2; |kurtosis| < 7) [26]. Homogeneity of variance was evaluated using Levene’s test.
Between-group differences in age, body height, body mass, BMI, circumferences, skinfold thicknesses and PAQ-C score were examined using Welch’s one-way ANOVA, as Levene’s test indicated heterogeneous variances for several variables. Effect sizes were expressed as eta squared (η²).
Postural stability was represented by sway area and COP path length in each of the three stance conditions. Sway speed and sway index were not included in the inferential analysis, as both are mathematical derivatives of the primary outcomes (sway speed = COP path length / trial duration; sway index = sway speed / sway area). Group differences in the six PS parameters were examined using a one-way multivariate analysis of covariance (MANCOVA), with group (A, B, C) as the fixed factor and PAQ-C score as the covariate, in order to control for the potential confounding effect of habitual physical activity. PAQ-C was selected as the sole covariate on a priori theoretical grounds: habitual physical activity is the established independent predictor most likely to confound the adiposity–postural stability relationship in this age group [13], and is not a structural determinant of adiposity grouping in the present cluster-based design. Age, height, and body mass were not included as covariates because all three variables were used, directly or indirectly, as clustering inputs (body mass and height through BMI), making their statistical removal analytically inappropriate and potentially distorting the group contrasts. Biological maturation was not assessed and thus could not be included; this is acknowledged as a limitation. The groups did not differ significantly in age (Welch’s ANOVA, p > 0.05), which reduces the likelihood of age acting as a major confounder. Homogeneity of regression slopes was verified by testing the group × PAQ-C interaction. Because Box’s M test indicated heterogeneity of covariance matrices, Pillai’s trace was used as the multivariate test statistic owing to its robustness to violations of this assumption [27].
A significant multivariate effect was followed by univariate ANCOVAs for each PS parameter, with adjusted means (± standard error) evaluated at the sample mean PAQ-C score. As Levene’s test indicated heterogeneous variances for all PS parameters, the univariate models were re-estimated using heteroscedasticity-consistent (HC3) standard errors as a sensitivity analysis [28]. Pairwise comparisons of adjusted means were performed with Bonferroni correction. Effect sizes were expressed as partial eta squared (η²p) for multivariate and univariate effects, interpreted as small (≥ 0.01), medium (≥ 0.06) or large (≥ 0.14) [22]. For pairwise contrasts (A–B, A–C, B–C), Cohen’s d was calculated as the adjusted mean difference divided by the root mean square error of the corresponding ANCOVA model, interpreted as small (≥ 0.20), medium (≥ 0.50) or large (≥ 0.80) [22], and visualised as a colour-coded heatmap (Figure 1).
The alpha level was set at p < 0.05 for all tests. All analyses were performed using IBM SPSS Statistics (Version 22.0; IBM Corp., Armonk, NY, USA).
3. Results
After adjustment for habitual physical activity, MANCOVA revealed a significant multivariate effect of group on PS parameters (Pillai’s trace = 0.671, F(12, 454) = 19.10, p < 0.001, η²p = 0.335), whereas the PAQ-C covariate did not contribute significantly to the model (Pillai’s trace = 0.045, F(6, 226) = 1.78, p = 0.104). The assumption of homogeneity of regression slopes was met (group × PAQ-C interaction: Pillai’s trace = 0.055, F(12, 450) = 1.05, p = 0.397). Pillai’s trace was reported because Box’s M test indicated heterogeneity of covariance matrices (χ²(42) = 704.26, p < 0.001).

Table 3.
MANCOVA results for between-group differences in postural stability parameters.
| Effect | Pillai’s trace | F | df | p | η²p |
|---|---|---|---|---|---|
| Group | 0.671 | 19.10 | 12; 454 | <0.001 | 0.335 |
| PAQ-C | 0.045 | 1.78 | 6; 226 | 0.104 | 0.045 |
η²p, partial eta squared; PAQ-C, Physical Activity Questionnaire for Children.
Univariate ANCOVAs, adjusted for habitual physical activity, revealed significant group differences in all six PS parameters (all p < 0.001; Table 4). Adjusted sway values decreased consistently from Group A to Group C in all stance conditions, indicating smaller sway excursions and shorter COP trajectories in girls with a higher adiposity profile. The magnitude of group effects differed across stance conditions. Effects were moderate in the double-leg (sway area: F(2, 231) = 18.91, η²p = 0.141; COP path length: F(2, 231) = 15.24, η²p = 0.117) and right single-leg stance (sway area: F(2, 231) = 23.69, η²p = 0.170; COP path length: F(2, 231) = 11.29, η²p = 0.089). They were large in the left single-leg stance (sway area: F(2, 231) = 71.16, η²p = 0.381; COP path length: F(2, 231) = 100.08, η²p = 0.464). In the left single-leg stance, the largest between-group differences were observed between Group A and the other two groups, with adjusted sway area of 0.721 in Group A compared with 0.577 and 0.544 in Groups B and C, and adjusted COP path length of 24.29 compared with 21.42 and 19.50. Physical activity was a significant covariate only for right single-leg sway area (F(1, 231) = 4.69, p = 0.031, η²p = 0.020). Re-estimation of the models with heteroscedasticity-consistent (HC3) standard errors yielded identical conclusions.
Pairwise comparisons of adjusted means are presented in Figure 1. Group C exhibited significantly lower sway area and COP path length than Group A in all three stance conditions, with large effects (d = 0.71–2.24). The largest differences were observed in the left single-leg stance (sway area: d = 1.80; COP path length: d = 2.24; both p < 0.001). Compared with Group B, Group C showed significantly lower values in five of six parameters (d = 0.48–0.90). The exception was left single-leg sway area, for which the difference did not reach significance (p = 0.110). Differences between Groups A and B were less consistent. Sway area was significantly lower in Group B in all stance conditions (DL: d = 0.47, p = 0.012; RSL: d = 0.62, p < 0.001; LSL: d = 1.47, p < 0.001), whereas COP path length differed only in the left single-leg stance (d = 1.35, p < 0.001), with no differences in the double-leg (p = 0.778) or right single-leg stance (p = 1.000). Overall, effect sizes increased with the difficulty of the stance condition, being smallest in double-leg stance (d = 0.47–0.98) and largest in left single-leg stance (d = 0.90–2.24 for significant contrasts).
4. Discussion
The aim of this study was to determine whether preadolescent girls, stratified into three adiposity-based subgroups by Ward’s hierarchical cluster analysis, differ in static PS during double-leg and single-leg quiet stance. After adjustment for habitual physical activity, the three groups differed significantly across the set of PS outcomes (Pillai’s trace = 0.671, F(12, 454) = 19.10, p < 0.001, η²p = 0.335), with significant univariate effects for all six parameters and effect sizes ranging from medium (η²p = 0.089) to large (η²p = 0.464). The principal finding was that sway area and COP path length decreased consistently from Group A to Group C in all stance conditions. Physical activity, assessed with the PAQ-C, did not differ between groups and did not account for the observed differences.
The observation that girls with a higher adiposity profile exhibited smaller, rather than larger, sway excursions was not anticipated on the basis of the predominant literature, but is consistent with a growing body of evidence documenting an inverse adiposity–sway relationship in paediatric populations. Rusek et al. [11], in the largest paediatric sample examined to date (n = 1,137), found that higher BMI and adipose tissue content were associated with a smaller COP ellipse area and reduced horizontal centre-of-gravity deviations, and Carnevale Pellino et al. [12] similarly observed no postural impairment in prepubertal children with obesity during quiet stance. The systematic review by Wilde et al. [5] documented this inverse pattern in 9 of 53 included studies.
However, the present findings require cautious interpretation. The between-group differences in body composition were modest (η² = 0.023–0.054 for circumferences and skinfolds) and did not reach significance for BMI (p = 0.139), whereas the differences in PS were considerably larger. Moreover, individual-level correlations between anthropometric indicators and sway parameters were negligible (|r| ≤ 0.18).
Several biomechanical mechanisms may contribute to the smaller sway excursions observed in Group C. First, greater body mass increases the moment of inertia of the body about the ankle joint, which, according to the inverted-pendulum model of upright stance [23], increases the mechanical cost of large postural corrections and may favour a higher-stiffness ankle strategy that restricts the amplitude of COP oscillation without necessarily reflecting superior sensorimotor precision [24]. Second, greater adiposity has been associated with a larger plantar contact area [8], which may enlarge the effective base of support and passively reduce relative COP displacement. Third, greater subcutaneous adipose tissue at the foot sole may modify plantar mechanoreceptor input [25]. It should be noted, however, that these mechanisms were described primarily in children with overweight or obesity, whereas the present sample comprised predominantly normal-weight girls with relatively small between-group differences in body composition; their relevance to the present findings therefore remains speculative.
Habitual physical activity did not explain the observed group differences, as the groups did not differ in PAQ-C score and the covariate did not contribute significantly to the multivariate model. This finding should be interpreted cautiously: the conclusion that group differences are ‘independent of habitual physical activity’ is qualified by the use of a self-report instrument (PAQ-C) susceptible to recall and social desirability bias, and by the fact that potential confounders including biological maturation and aspects of body size beyond adiposity were not fully controlled. The present findings therefore indicate that group differences were not statistically accounted for by self-reported PA level, not that they are independent of all activity-related factors. This contrasts with reports that physical fitness and PA can partially counteract adverse effects of adiposity on balance [10] and that sports club participation attenuates the association between obesity and motor control [13]. A possible explanation is that the limited variability in adiposity within this predominantly normal-weight sample left little room for a moderating effect of PA; a self-report instrument may also lack the sensitivity required to detect such effects.
Effect sizes were considerably larger in LSL stance (η²p = 0.381–0.464) than in DL (η²p = 0.117–0.141) and RSL stance (η²p = 0.089–0.170). Although assessments under greater mechanical demand are thought to be more sensitive to adiposity-related differences [1,5], this explanation does not account for the asymmetry between the two single-leg conditions, which impose comparable mechanical demands.
The use of Ward’s hierarchical cluster analysis on a multivariate anthropometric profile combining BMI, three skinfold sites and three segment circumferences was motivated by evidence that multidimensional adiposity characterisation predicts PC more comprehensively than any single index [9], and that regional adiposity measures explain variance in balance outcomes not captured by global weight-status categories [4,10]. In the present sample, however, the resulting subgroups differed only modestly in body composition, with significant pairwise differences confined largely to the extreme groups and no difference in BMI. The clinical meaning of the cluster-derived categories in a predominantly normal-weight population therefore remains to be established.
Several limitations should be acknowledged. First, the cross-sectional design precludes causal inference. Second, the sample comprised preadolescent girls only, limiting generalisability to boys and other age groups. Third, the cluster-derived subgroups differed only modestly in body composition and were not benchmarked against standard paediatric weight-status classifications (e.g., IOTF or WHO references). Fourth, body composition was estimated from skinfold thicknesses and circumferences rather than by dual-energy X-ray absorptiometry; it should also be noted that the segment circumferences included in the clustering reflect not only adipose tissue but also muscle mass, bone dimensions and growth-related size differences, so the resulting subgroups represent composite anthropometric profiles rather than pure adiposity groups. Fifth, biological maturation status, which may influence both body composition and postural control in this age range, was not assessed. Sixth, PA was assessed by self-report (PAQ-C), which is susceptible to recall and social desirability bias. Seventh, participants were recruited from seven schools, and potential intraclass dependence due to school-level clustering was not accounted for in the analysis; future studies should employ multilevel modelling or cluster-robust standard errors. Eighth, the 30 participants excluded for inability to complete the balance protocol could not be formally characterised at the time of exclusion, so the potential for selection bias — particularly if those excluded differed systematically in adiposity or motor competence from those retained — cannot be fully excluded. Ninth, although stance conditions were administered in randomised order to minimise order and fatigue effects, the randomisation was not stratified by condition, and any residual sequence-related variance cannot be fully excluded. Tenth, variances of PS parameters were heterogeneous across groups; although robust (HC3) estimation confirmed the results, this heterogeneity remains unexplained. Finally, testing was conducted under eyes-open conditions only, precluding examination of sensory reweighting contributions to the observed group differences.
5. Conclusions
In preadolescent girls stratified into three subgroups by Ward’s hierarchical cluster analysis of BMI, skinfold thicknesses and segment circumferences, significant differences in static PS were observed across all three stance conditions, independent of habitual physical activity. Girls in the subgroup with the highest adiposity profile consistently displayed smaller sway area and shorter COP path length than their peers, with the largest differences in the left single-leg stance.
Longitudinal studies incorporating objective PA measurement, biological maturation staging, criterion-standard body composition assessment and comparison with conventional weight-status classifications are needed to clarify whether, and through which mechanisms, adiposity influences postural control in preadolescent girls.
Author Contributions
Conceptualization, D.M. (Dragan Marinković) and B.R.; Methodology, D.M. (Dragan Marinković) and D.R.; Formal Analysis, D.R.; Investigation, A.I. (Aleksandra Ilić), D.M. (Dražena Mačak) and B.P.; Data Curation, A.I. and D.R.; Writing—Original Draft Preparation, D.M. (Dragan Marinković); Writing—Review and Editing, B.R., T.Š., D.M. (Dražena Mačak) and B.P.; Supervision, B.R. All authors have read and agreed to the published version of the manuscript.
Funding
This research was partially funded by the Provincial Secretariat for Higher Education and Scientific Research of the Autonomous Province of Vojvodina, Republic of Serbia, within the projects “PROMO: Contemporary Digital Technologies and Motor Skills of Children and Youth”, Project No. 003878976 2025 09418 003 000 000 001 04 004, and “Integrative Strategies for Injury Prevention and Rehabilitation in Youth Athletes: Advancing Health and Athletic Development” (PREHAB-Youth), Project No. 003878671 2025 09418 003 000 000 001 04 003.
Institutional Review Board Statement
The study was conducted in accordance with the Declaration of Helsinki, and approved by the Human Research Ethics Committee of the University of Novi Sad (approval number: 234/2020; date: 17.06.2020.).
Informed Consent Statement
Written informed consent was obtained from the parents or legal guardians of all participants, with verbal assent obtained from each child.
Data Availability Statement
The raw data supporting the conclusions of this article will be made available by the corresponding author on reasonable request.
AI Author Statement: During the preparation of this manuscript, the authors used Claude (Anthropic, San Francisco, CA, USA) to assist with language editing, structural organization of the manuscript, and preparation of the final submission document. All scientific content, data, analyses, interpretations, and conclusions are the sole responsibility of the authors. The authors reviewed and verified all AI-assisted content and take full responsibility for the integrity of this work.
Conflicts of Interest
The authors declare no conflicts of interest. Dragan Marinković is the Guest Editor of the Special Issue in which this paper is submitted. He was therefore excluded from editorial handling and review of this manuscript, which was assigned to an independent Academic Editor.
Abbreviations
The following abbreviations are used in this manuscript: ANOVA: Analysis of Variance; BC: Body Composition; BMI: Body Mass Index; CDC: Centers for Disease Control and Prevention; COP: Centre of Pressure; DEXA: Dual-Energy X-Ray Absorptiometry; DL: Double-Leg Stance; IBP: International Biological Programme; IOTF: International Obesity Task Force; IQR: Interquartile Range; LSL: Left Single-Leg Stance; MANOVA: Multivariate Analysis of Variance; PA: Physical Activity; PC: Postural Control; PS: Postural Stability; RSL: Right Single-Leg Stance; SD: Standard Deviation; SPSS: Statistical Package for the Social Sciences (IBM Corp., Armonk, NY, USA); STROBE: Strengthening the Reporting of Observational Studies in Epidemiology; α: Alpha; significance level; ε²: Epsilon Squared; effect size statistic for Kruskal–Wallis H test; η²p: Partial Eta Squared; effect size statistic for Welch ANOVA; λ: Wilks’ Lambda; MANOVA test statistic; 1−β: Statistical Power (1 minus Type II error rate).
References
- Tsiros, M.D.; Brinsley, J.; Buckley, J.D.; Thewlis, D. Setting up girls for success in fundamental motor skills: The role of postural control. J. Sports Sci. 2022, 40, 2200–2207. [Google Scholar] [CrossRef] [PubMed]
- García-Massó, X.; Marco-Ahulló, A.; Solana-Tramunt, M.; Morales, J.; Bermejo, J.L. Obesity affects postural control in middle childhood and adolescence but not in early childhood. J. Mot. Learn. Dev. 2019, 7, 307–319. [Google Scholar] [CrossRef]
- World Health Organization. Obesity and Overweight. Fact Sheet. Available online: https://www.who.int/news-room/fact-sheets/detail/obesity-and-overweight (accessed on 1 September 2025).
- Drid, P.; Vujkov, S.; Jakšić, D.; Trivić, T.; Marinković, D.; Bala, G. Differences in motor and cognitive abilities of children depending on their body mass index and subcutaneous adipose tissue. Coll. Antropol. 2013, 37 (Suppl. 2), 171–177. [Google Scholar] [PubMed]
- Wilde, J.H.; Arnold, J.B.; Thewlis, D.; Tsiros, M.D. The relationship between postural control by instrumented assessment and adiposity in children and adolescents: A systematic review. Int. J. Obes. 2026, 50, 288–301. [Google Scholar] [CrossRef] [PubMed]
- Ceschia, A.; Giacomini, S.; Santarossa, S.; Rugo, M.; Salvadego, D.; Da Ponte, A.; Driussi, C.; Boratto, E.; Lazzer, S.; Bianco, A. Deleterious effects of obesity on physical fitness in pre-pubertal children. Eur. J. Sport Sci. 2016, 16, 271–278. [Google Scholar] [CrossRef] [PubMed]
- Brzek, A.; Faff, J.; Pop, T. Children with abnormal body weight dealing with the load of school backpack-is there a need to modify WHO recommendations? A cross sectional study. PeerJ 2025, 13, e19353. [Google Scholar] [CrossRef] [PubMed]
- Mueller, S.; Carlsohn, A.; Mueller, J.; Baur, H.; Mayer, F. Influence of obesity on foot loading characteristics in gait for children aged 1 to 12 years. PLoS ONE 2016, 11, e0149924. [Google Scholar] [CrossRef] [PubMed]
- Guzmán-Muñoz, E.E.; Mendez-Rebolledo, G.; Núñez-Espinosa, C.; Valdés-Badilla, P.; Monsalves-Álvarez, M.; Delgado-Floody, P.; Herrera-Valenzuela, T. Anthropometric profile and physical activity level as predictors of postural balance in overweight and obese children. Behav. Sci. 2023, 13, 73. [Google Scholar] [CrossRef] [PubMed]
- Diniz-Sousa, F.; Edwards, T.; Borsheim, E. The associations of body composition, fitness, and physical activity with balance in children: The Arkansas Active Kids study. Gait Posture 2025, 118, 61–68. [Google Scholar] [CrossRef] [PubMed]
- Rusek, W.; Adamczyk, M.; Baran, J.; Leszczak, J.; Baran, R.; Pop, T. Is there a link between balance and body mass composition in children and adolescents? Int. J. Environ. Res. Public Health 2021, 18, 10449. [Google Scholar] [CrossRef] [PubMed]
- Carnevale Pellino, V.; Calcaterra, V.; Gatti, A.; Vandoni, M. Postural control in children with obesity: A cross-sectional comparison with normal-weight peers. Sport Sci. Health 2026, 22, 55. [Google Scholar] [CrossRef]
- Brummer, S.; Flock, S.; Berelsmann, A.-M.; Scholten, M.; Dobel, C.; Guntinas-Lichius, O. Physical activity and anthropometric factors as predictors for postural stability in children. Sci. Rep. 2026, 16, 16425. [Google Scholar] [CrossRef] [PubMed]
- Ward, J.H. Hierarchical grouping to optimize an objective function. J. Am. Stat. Assoc. 1963, 58, 236–244. [Google Scholar] [CrossRef]
- Weiner, J.S.; Lourie, J.A. Human Biology: A Guide to Field Methods; IBP Handbook No. 9; Blackwell Scientific: Oxford, UK, 1969. [Google Scholar]
- Razak, A.H.A.; Zayegh, A.; Begg, R.K.; Wahab, Y. Foot plantar pressure measurement system: A review. Sensors 2012, 12, 9884–9912. [Google Scholar] [CrossRef] [PubMed]
- Scoppa, F.; Capra, R.; Gallamini, M.; Shiffer, R. Clinical stabilometry standardization: basic definitions--acquisition interval--sampling frequency. Gait Posture 2013, 37, 290–292. [Google Scholar] [CrossRef] [PubMed]
- Bauer, C.; Gröger, I.; Rupprecht, R.; Gaßmann, K.G. Intrasession reliability of force platform parameters in community-dwelling older adults. Arch. Phys. Med. Rehabil. 2008, 89, 1977–1982. [Google Scholar] [CrossRef]
- Troester, J.C.; Jasmin, J.G.; Duffield, R. Reliability of single-leg balance and landing tests in rugby union; prospect of using postural control to monitor fatigue. J. Sports Sci. Med. 2018, 17, 174–180. [Google Scholar] [PubMed]
- Verhagen, E.; Bobbert, M.; Inklaar, M.; van Kalken, M.; van der Beek, A.; Bouter, L.; van Mechelen, W. The effect of a balance training programme on centre of pressure excursion in one-leg stance. Clin. Biomech. 2005, 20, 1094–1100. [Google Scholar] [CrossRef] [PubMed]
- Palmieri, R.M.; Ingersoll, C.D.; Stone, M.B.; Krause, B.A. Center-of-pressure parameters used in the assessment of postural control. J. Sport Rehabil. 2002, 11, 51–66. [Google Scholar] [CrossRef]
- Cohen, J. Statistical Power Analysis for the Behavioral Sciences, 2nd ed.; Lawrence Erlbaum Associates: Hillsdale, NJ, USA, 1988. [Google Scholar]
- Winter, D.A. Biomechanics and Motor Control of Human Movement, 4th ed.; Wiley: Hoboken, NJ, USA, 2009. [Google Scholar]
- Villarrasa-Sapiña, I.; Álvarez-Pitti, J.; Cabeza-Ruiz, R.; Redón, P.; Lurbe, E.; García-Massó, X. Relationship between body composition and postural control in prepubertal overweight/obese children. Clin. Biomech. 2018, 52, 1–6. [Google Scholar] [CrossRef] [PubMed]
- Ribeiro, A.P.; Pereira, D.B.; Berger, G.F.; Ismail, K.M.; Morais, M.D.; Martins, M.S.F. Effect of Abdominal Adiposity on the Impact of Plantar Force in the Foot Support of Obese and Overweight Schoolchildren. Children 2025, 12, 1553. [Google Scholar] [CrossRef] [PubMed]
- George, D.; Mallery, P. IBM SPSS Statistics 26 Step by Step: A Simple Guide and Reference, 16th ed.; Routledge: New York, NY, USA, 2019. [Google Scholar]
- Olson, C.L. On choosing a test statistic in multivariate analysis of variance. Psychol. Bull. 1976, 83, 579–586. [Google Scholar] [CrossRef]
- Long, J.S.; Ervin, L.H. Using heteroscedasticity consistent standard errors in the linear regression model. Am. Stat. 2000, 54, 217–224. [Google Scholar] [CrossRef]
- Kowalski, K.C.; Crocker, P.R.E.; Faulkner, R.A. Validation of the Physical Activity Questionnaire for Older Children. Pediatr. Exerc. Sci. 1997, 9, 174–186. [Google Scholar] [CrossRef]
- Crocker, P.R.E.; Bailey, D.A.; Faulkner, R.A.; Kowalski, K.C.; McGrath, R. Measuring general levels of physical activity: Preliminary evidence for the Physical Activity Questionnaire for Older Children. Med. Sci. Sports Exerc. 1997, 29, 1344–1349. [Google Scholar] [CrossRef]
Figure 1.
Pairwise comparisons of adjusted means of postural stability parameters among the adiposity-based subgroups (ANCOVA with PAQ-C score as covariate). Cell values represent Cohen’s d calculated as the adjusted mean difference divided by the root mean square error of the ANCOVA model; positive values indicate higher values in the first group of the pair. Colour intensity reflects effect size magnitude; grey cells denote non-significant differences (ns). Bold values indicate large effects (d ≥ 0.80). Bonferroni-adjusted significance: * p < 0.05; ** p < 0.01; *** p < 0.001. COP, centre of pressure; DL, double-leg stance; RSL, right single-leg stance; LSL, left single-leg stance.
Figure 1.
Pairwise comparisons of adjusted means of postural stability parameters among the adiposity-based subgroups (ANCOVA with PAQ-C score as covariate). Cell values represent Cohen’s d calculated as the adjusted mean difference divided by the root mean square error of the ANCOVA model; positive values indicate higher values in the first group of the pair. Colour intensity reflects effect size magnitude; grey cells denote non-significant differences (ns). Bold values indicate large effects (d ≥ 0.80). Bonferroni-adjusted significance: * p < 0.05; ** p < 0.01; *** p < 0.001. COP, centre of pressure; DL, double-leg stance; RSL, right single-leg stance; LSL, left single-leg stance.
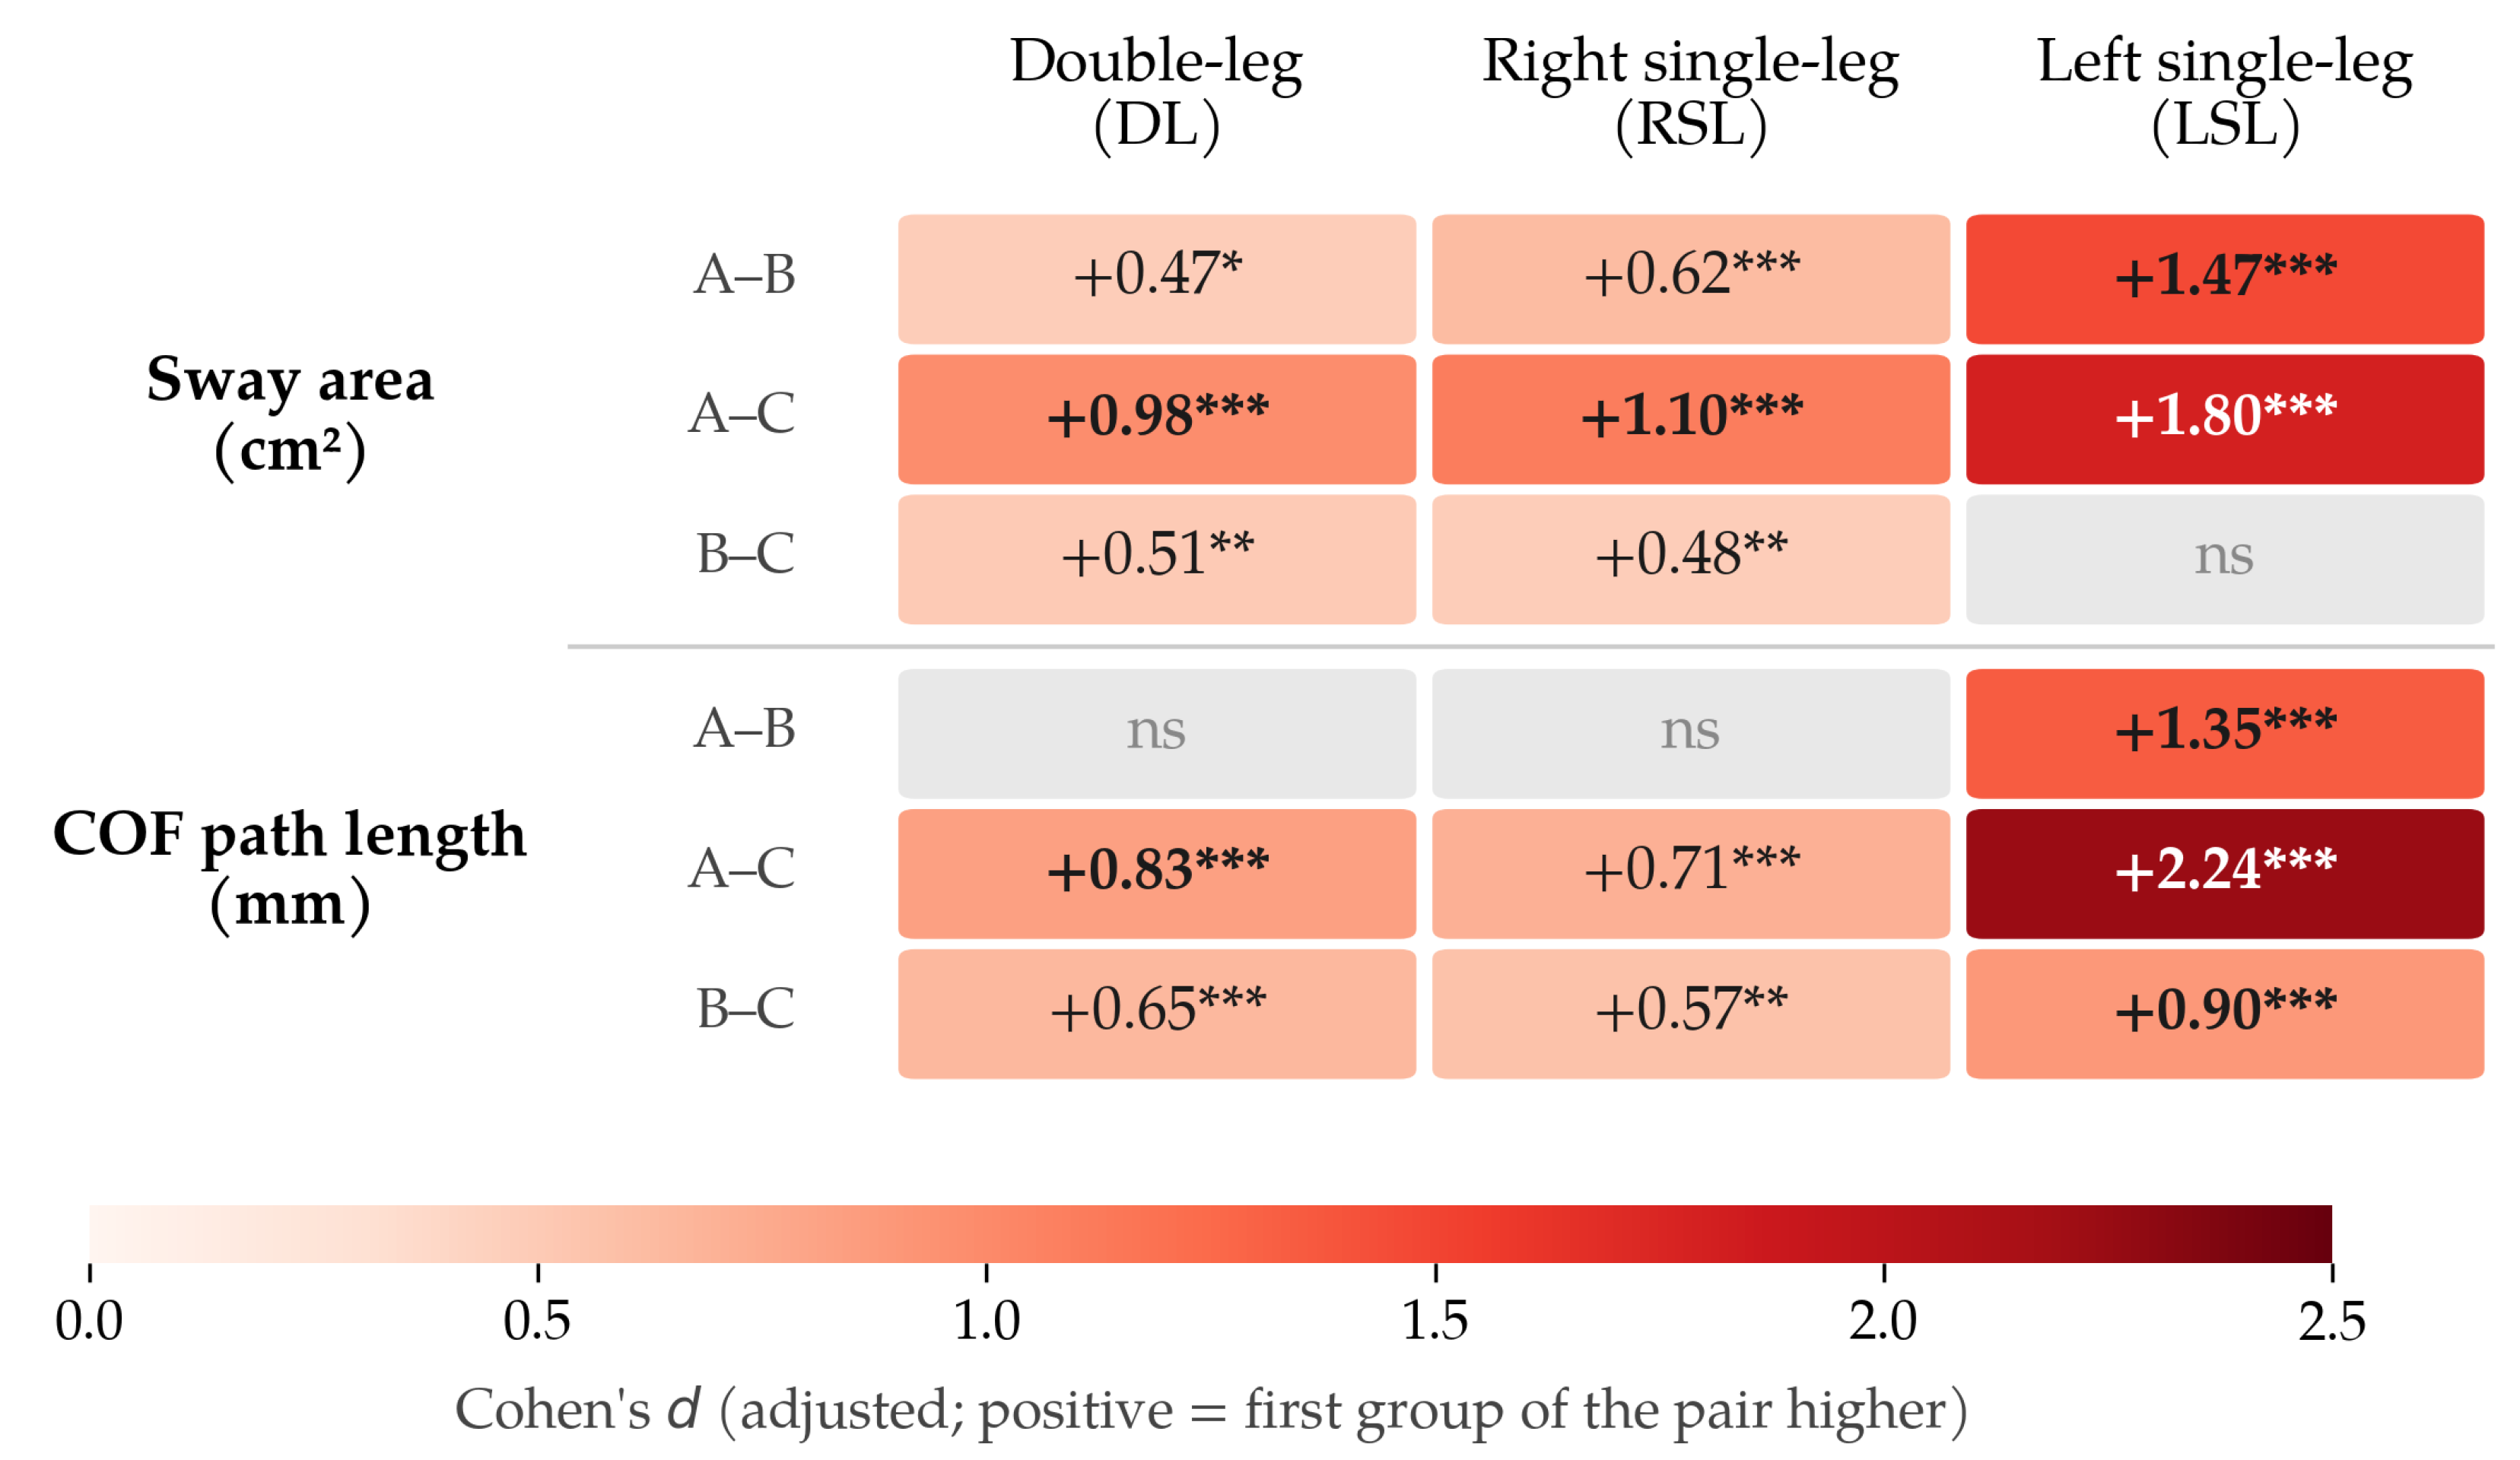
Table 1.
Descriptive characteristics of the total sample and the three adiposity-based subgroups.
| Variable | Total (n = 235) | Group A (n = 76) | Group B (n = 77) | Group C (n = 82) |
|---|---|---|---|---|
| Age (years) | 10.38 ± 0.79 | 10.30 ± 0.82 | 10.43 ± 0.74 | 10.42 ± 0.80 |
| Height (cm) | 142.83 ± 7.33 | 141.75 ± 5.33 | 143.65 ± 8.89 | 143.07 ± 7.28 |
| Body mass (kg) | 34.60 ± 5.82 | 33.32 ± 5.20 | 34.79 ± 6.74 | 35.60 ± 5.24 |
| BMI (kg/m²) | 17.01 ± 2.97 | 16.60 ± 2.64 | 16.94 ± 3.40 | 17.46 ± 2.79 |
Data are presented as mean ± SD. BMI, body mass index; Group A = lowest adiposity profile; Group B = intermediate adiposity profile; Group C = highest adiposity profile.
Table 2.
Anthropometric and body composition characteristics by adiposity subgroup.
| Variable | Total (n = 235) | Group A (n = 76) | Group B (n = 77) | Group C (n = 82) |
|---|---|---|---|---|
| Circumferences (cm) | ||||
| Chest | 65.54 ± 5.13 | 64.27 ± 4.52 | 65.61 ± 5.38 | 66.64 ± 5.20 |
| Arm | 21.35 ± 2.19 | 20.97 ± 2.27 | 21.20 ± 2.15 | 21.85 ± 2.09 |
| Forearm | 19.78 ± 1.48 | 19.50 ± 1.43 | 19.77 ± 1.73 | 20.04 ± 1.21 |
| Skinfold thicknesses (mm) | ||||
| Abdominal | 10.65 ± 5.59 | 9.35 ± 5.19 | 10.28 ± 4.69 | 12.21 ± 6.35 |
| Subscapular | 7.23 ± 2.55 | 6.53 ± 2.17 | 7.13 ± 2.22 | 7.97 ± 2.97 |
| Triceps | 10.33 ± 3.28 | 9.74 ± 3.18 | 10.22 ± 3.29 | 10.99 ± 3.29 |
Data are presented as mean ± SD. Group A = lowest adiposity profile; Group B = intermediate adiposity profile; Group C = highest adiposity profile.
Table 4.
Adjusted means (±SE) and ANCOVA results for postural stability parameters by adiposity subgroup.
Table 4.
Adjusted means (±SE) and ANCOVA results for postural stability parameters by adiposity subgroup.
| Variable | Group A (n = 76) | Group B (n = 77) | Group C (n = 82) | F(2, 231) | p | η²p |
|---|---|---|---|---|---|---|
| Double-leg stance | ||||||
| Sway area | 0.247 ± 0.004 | 0.232 ± 0.004 | 0.215 ± 0.004 | 18.91 | <0.001 | 0.141 |
| COP path length | 9.95 ± 0.06 | 9.85 ± 0.06 | 9.50 ± 0.06 | 15.24 | <0.001 | 0.117 |
| Right single-leg stance | ||||||
| Sway area | 0.610 ± 0.007 | 0.571 ± 0.007 | 0.541 ± 0.007 | 23.69 | <0.001 | 0.170 |
| COP path length | 22.74 ± 0.22 | 22.45 ± 0.22 | 21.35 ± 0.22 | 11.29 | <0.001 | 0.089 |
| Left single-leg stance | ||||||
| Sway area | 0.721 ± 0.011 | 0.577 ± 0.011 | 0.544 ± 0.011 | 71.16 | <0.001 | 0.381 |
| COP path length | 24.29 ± 0.25 | 21.42 ± 0.24 | 19.50 ± 0.24 | 100.08 | <0.001 | 0.464 |
Data are presented as adjusted mean ± SE (marginal means from ANCOVA). η²p, partial eta squared; COP, centre of pressure; SE, standard error.
Disclaimer/Publisher’s Note: The statements, opinions and data contained in all publications are solely those of the individual author(s) and contributor(s) and not of MDPI and/or the editor(s). MDPI and/or the editor(s) disclaim responsibility for any injury to people or property resulting from any ideas, methods, instructions or products referred to in the content. |
© 2026 by the authors. Licensee MDPI, Basel, Switzerland. This article is an open access article distributed under the terms and conditions of the Creative Commons Attribution (CC BY) license (http://creativecommons.org/licenses/by/4.0/).
Copyright: This open access article is published under a Creative Commons CC BY 4.0 license, which permit the free download, distribution, and reuse, provided that the author and preprint are cited in any reuse.